Embed Size (px)
Citation preview
1
OVERVIEW OF RPS CALCULATOR FUNCTIONALITY
2
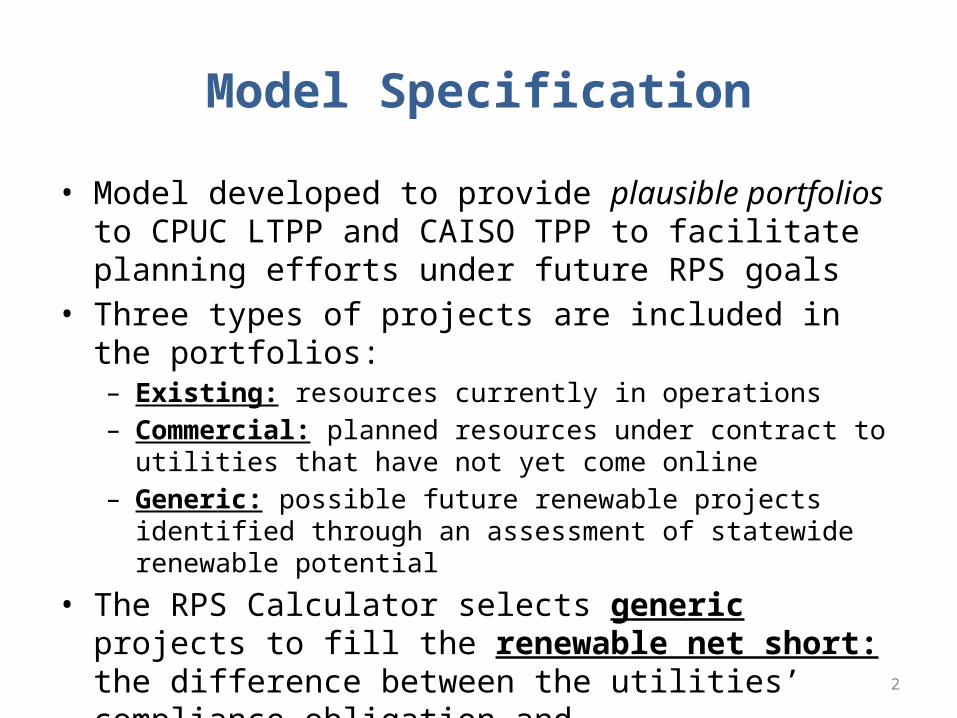
Model Specification
• Model developed to provide plausible portfolios to CPUC LTPP and CAISO TPP to facilitate planning efforts under future RPS goals
• Three types of projects are included in the portfolios:– Existing: resources currently in operations– Commercial: planned resources under contract to utilities that have
not yet come online– Generic: possible future renewable projects identified through an
assessment of statewide renewable potential
• The RPS Calculator selects generic projects to fill the renewable net short: the difference between the utilities’ compliance obligation and existing/commercial resources
3
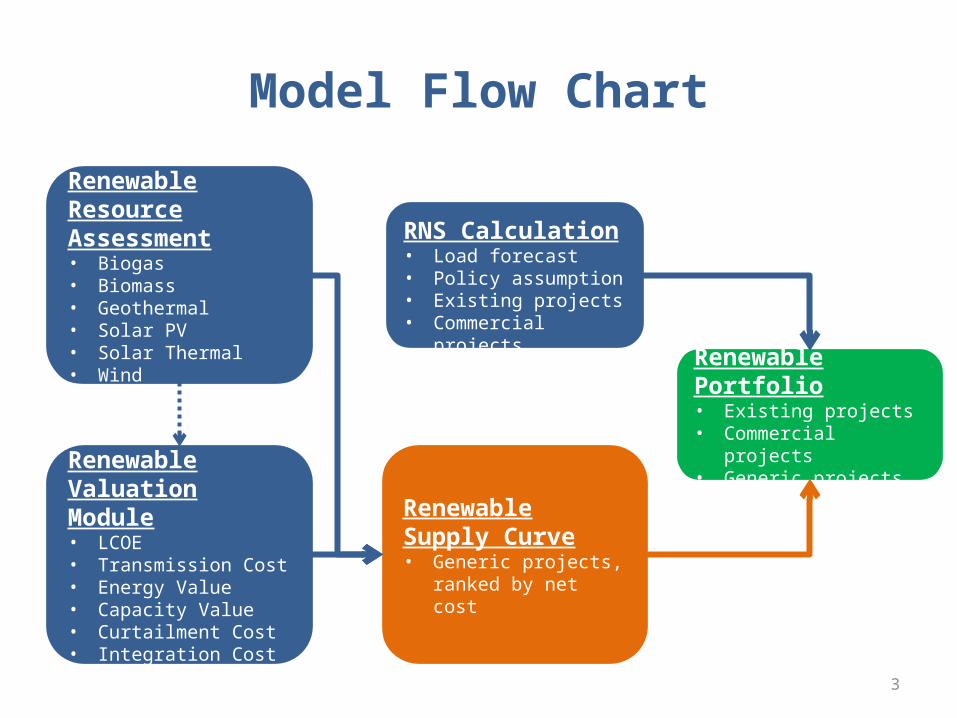
Renewable Valuation Module• LCOE• Transmission Cost• Energy Value• Capacity Value• Curtailment Cost• Integration Cost
Model Flow Chart
Renewable Resource Assessment• Biogas• Biomass• Geothermal• Solar PV• Solar Thermal• Wind
RNS Calculation• Load forecast• Policy assumption• Existing projects• Commercial projects
Renewable Supply Curve• Generic projects, ranked
by net cost
Renewable Portfolio• Existing projects• Commercial projects• Generic projects
4
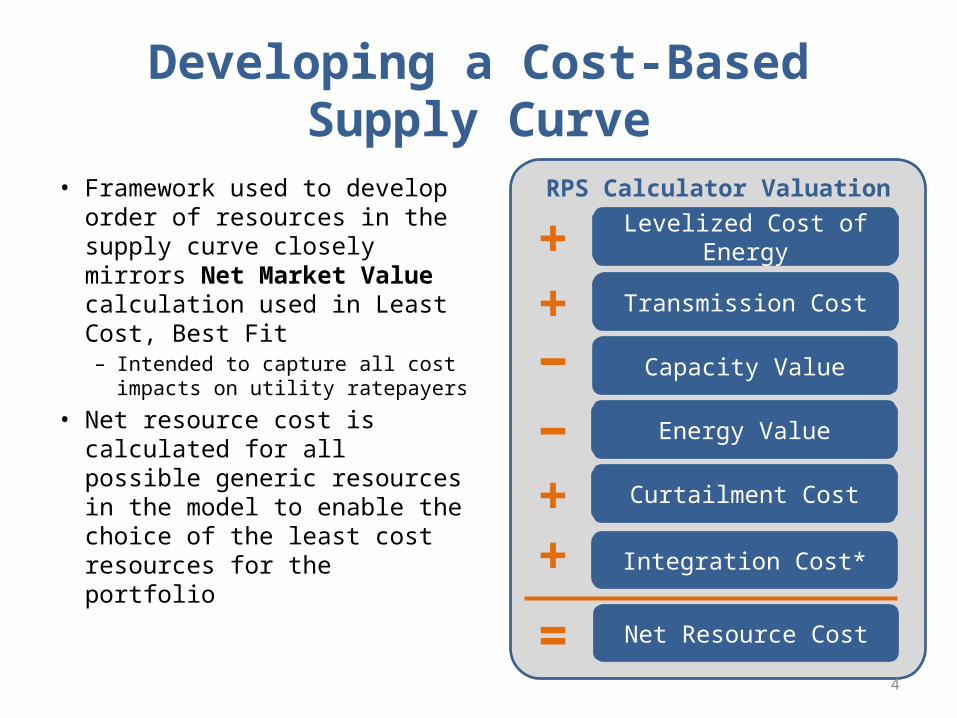
Developing a Cost-Based Supply Curve
• Framework used to develop order of resources in the supply curve closely mirrors Net Market Value calculation used in Least Cost, Best Fit– Intended to capture all cost
impacts on utility ratepayers
• Net resource cost is calculated for all possible generic resources in the model to enable the choice of the least cost resources for the portfolio
RPS Calculator Valuation Framework
Levelized Cost of Energy
Transmission Cost
Capacity Value
Energy Value
Net Resource Cost
Integration Cost*
−
=
−
+
++
Curtailment Cost+
5
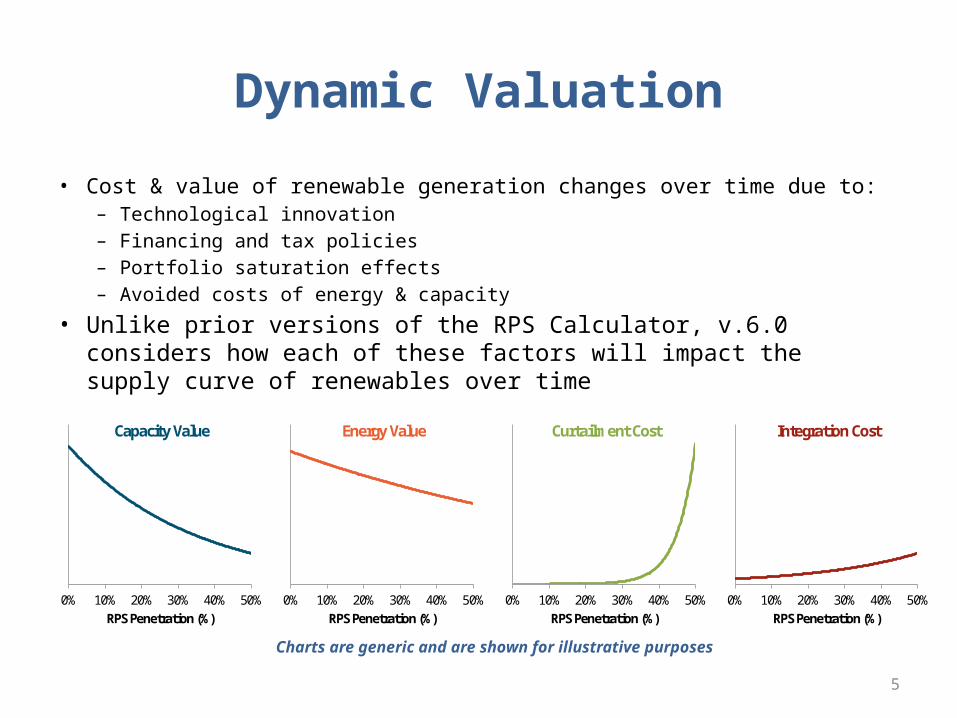
Dynamic Valuation
• Cost & value of renewable generation changes over time due to:– Technological innovation– Financing and tax policies– Portfolio saturation effects– Avoided costs of energy & capacity
• Unlike prior versions of the RPS Calculator, v.6.0 considers how each of these factors will impact the supply curve of renewables over time
Charts are generic and are shown for illustrative purposes
0% 10% 20% 30% 40% 50%RPS Penetration (%)
Capacity Value
0% 10% 20% 30% 40% 50%RPS Penetration (%)
Energy Value
0% 10% 20% 30% 40% 50%RPS Penetration (%)
Curtailment Cost
0% 10% 20% 30% 40% 50%RPS Penetration (%)
Integration Cost
6
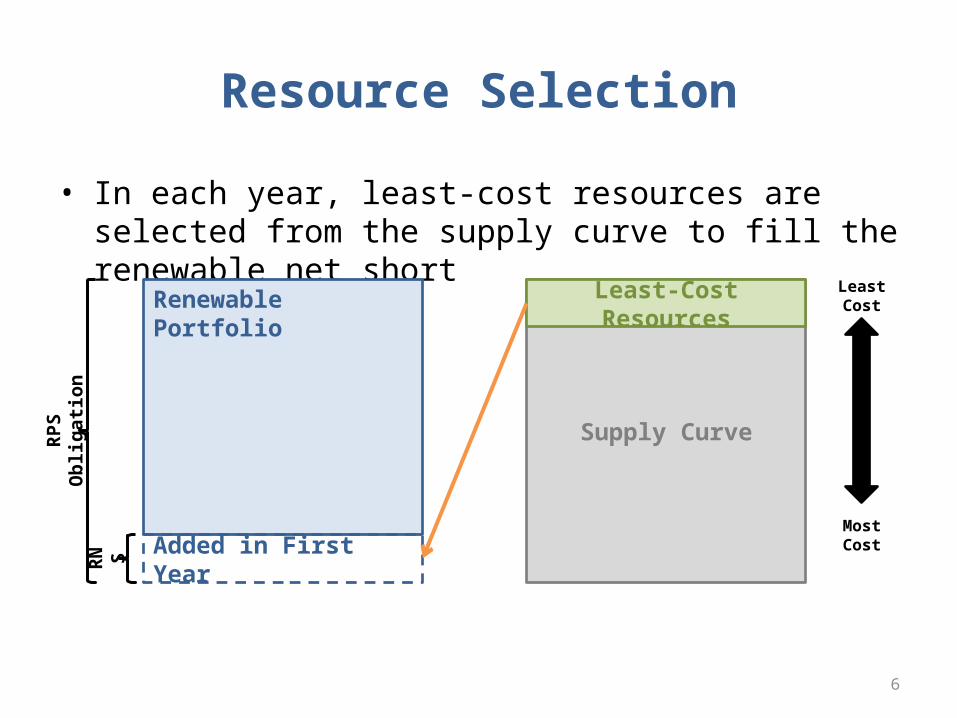
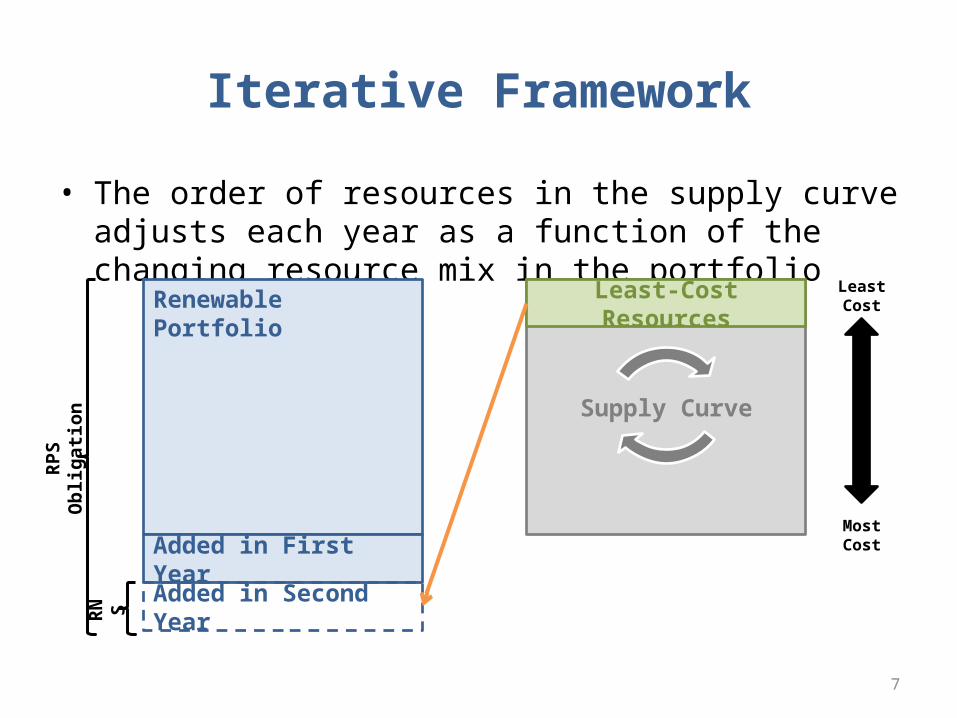
• In each year, least-cost resources are selected from the supply curve to fill the renewable net short
Resource Selection
Supply Curve
Renewable Portfolio Least Cost
Most Cost
Least-Cost Resources
Added in First Year
RPS
Obl
igati
on
RN S
7
• The order of resources in the supply curve adjusts each year as a function of the changing resource mix in the portfolio
Iterative Framework
Supply Curve
Renewable Portfolio Least Cost
Most Cost
Least-Cost Resources
Added in First Year
RPS
Obl
igati
on
RN S Added in Second Year
8
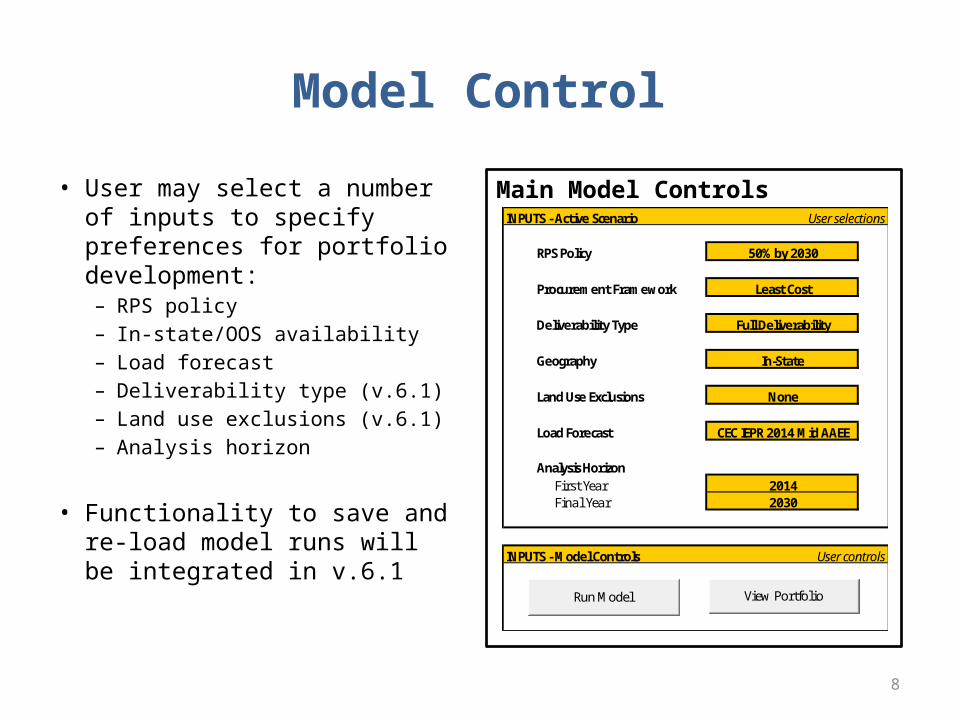
Model Control
• User may select a number of inputs to specify preferences for portfolio development:– RPS policy– In-state/OOS availability– Load forecast– Deliverability type (v.6.1)– Land use exclusions (v.6.1)– Analysis horizon
• Functionality to save and re-load model runs will be integrated in v.6.1
INPUTS - Active Scenario User selections
RPS Policy 50% by 2030
Procurement Framework Least Cost
Deliverability Type Full Deliverability
Geography In-State
Land Use Exclusions None
Load Forecast CEC IEPR 2014 Mid AAEE
Analysis HorizonFirst Year 2014Final Year 2030
INPUTS - Model Controls User controls
View PortfolioRun Model
Main Model Controls
9
Illustrative Model Results
• Model identifies locations and types of resources that can be used to meet RPS policy goals
• Portfolios developed to achieve compliance in each year of analysis horizon
0500
1,0001,5002,0002,5003,0003,5004,0004,5005,000
Inst
alle
d Ca
paci
ty (M
W)
Biogas Biomass Geothermal Hydro Solar PV Solar Thermal Wind
Generic Resources Selected by SuperCREZ
0
20,000
40,000
60,000
80,000
100,000
120,000
140,000
2012 2014 2016 2018 2020 2022 2024 2026 2028 2030
Tota
l Ren
ewab
le G
ener
ation
(GW
h)
Various
Wind
Solar Thermal
Solar PV
Hydro
Geothermal
Biomass
Biogas
Aggregate Renewable Portfolio
10
RENEWABLE NET SHORT
11
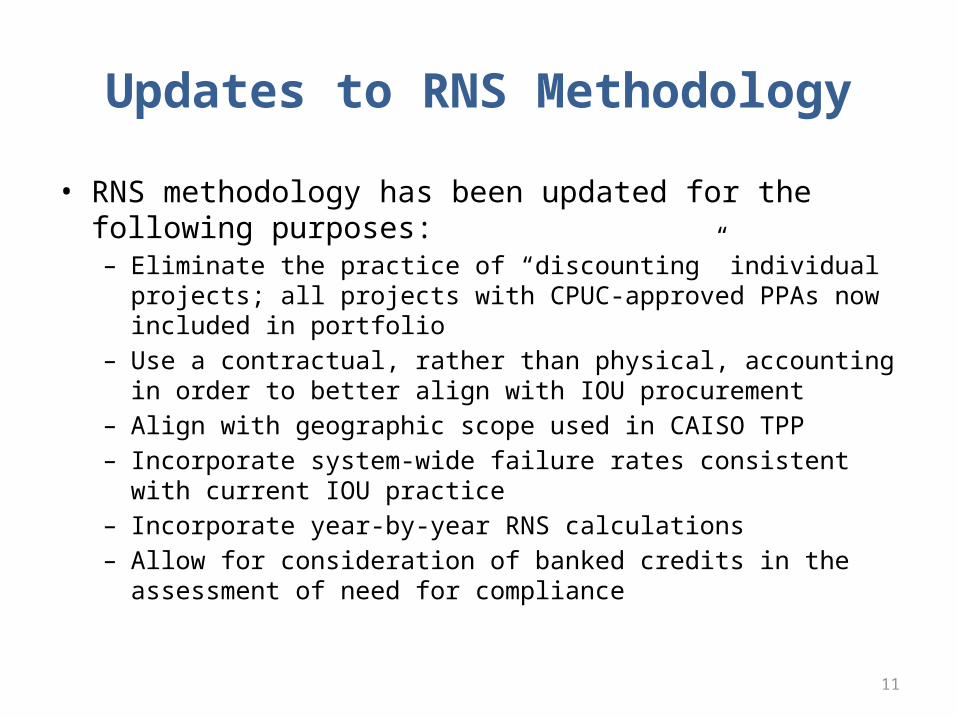
Updates to RNS Methodology
• RNS methodology has been updated for the following purposes:– Eliminate the practice of “discounting” individual projects; all projects
with CPUC-approved PPAs now included in portfolio– Use a contractual, rather than physical, accounting in order to better
align with IOU procurement– Align with geographic scope used in CAISO TPP– Incorporate system-wide failure rates consistent with current IOU
practice– Incorporate year-by-year RNS calculations– Allow for consideration of banked credits in the assessment of need
for compliance
12
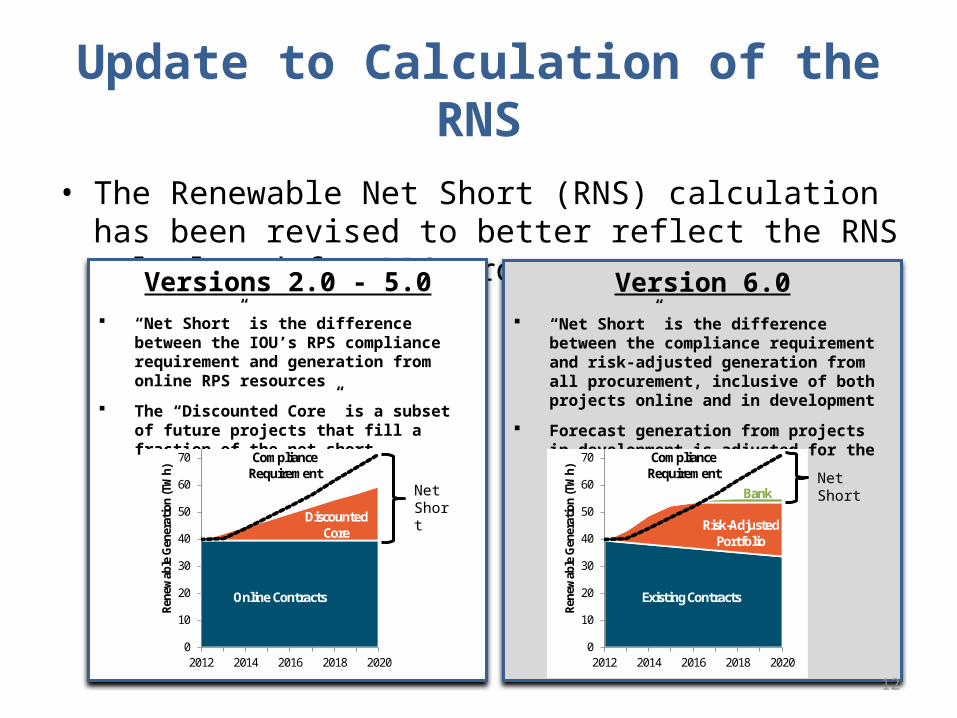
• The Renewable Net Short (RNS) calculation has been revised to better reflect the RNS calculated for RPS procurement
Version 6.0 “Net Short” is the difference between the
compliance requirement and risk-adjusted generation from all procurement, inclusive of both projects online and in development
Forecast generation from projects in development is adjusted for the risk of project failure
Versions 2.0 - 5.0 “Net Short” is the difference between the IOU’s
RPS compliance requirement and generation from online RPS resources
The “Discounted Core” is a subset of future projects that fill a fraction of the net short
Bank
0
10
20
30
40
50
60
70
80
2012 2014 2016 2018 2020
Rene
wab
le G
ener
ation
(TW
h)
Risk-AdjustedPortfolio
Existing Contracts
Compliance Requirement
Update to Calculation of the RNS
0
10
20
30
40
50
60
70
80
2012 2014 2016 2018 2020
Rene
wab
le G
ener
ation
(TW
h)
DiscountedCore
Online Contracts
Compliance Requirement
Net Short
Net Short
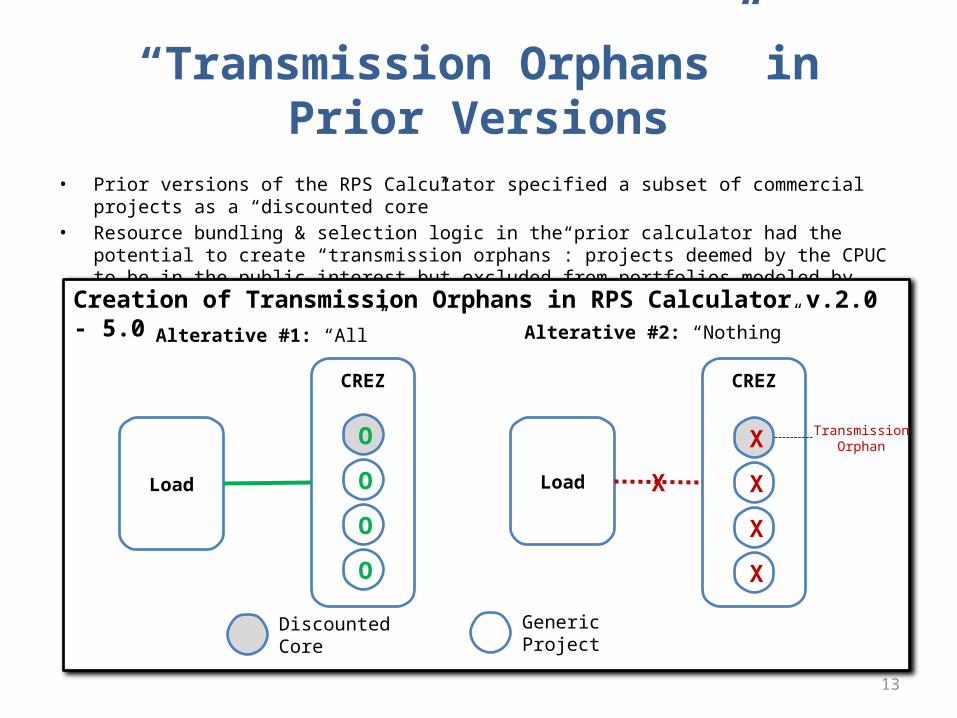
• Prior versions of the RPS Calculator specified a subset of commercial projects as a “discounted core”• Resource bundling & selection logic in the prior calculator had the potential to create “transmission
orphans”: projects deemed by the CPUC to be in the public interest but excluded from portfolios modeled by CAISO in the TPP, creating an obstacle in their development
Creation of Transmission Orphans in RPS Calculator v.2.0 - 5.0
CREZCREZ
“Transmission Orphans” in Prior Versions
O
O
O
O
X
X
X
X
Load Load X
Alterative #1: “All” Alterative #2: “Nothing”
Transmission Orphan
Discounted Core Generic Project
13
14
Avoiding Transmission Orphans
• In RPS Calculator v.6.0, the threshold for inclusion in the portfolio has been changed: all projects with a CPUC-approved contract are included in the portfolio
• This choice prevents the RPS Calculator from acting as an obstacle to project development through exclusion from the TPP’s policy-preferred portfolio
• This choice reemphasizes the importance of the Least-Cost, Best-Fit and the CPUC approval processes to identify and select resources appropriate for development
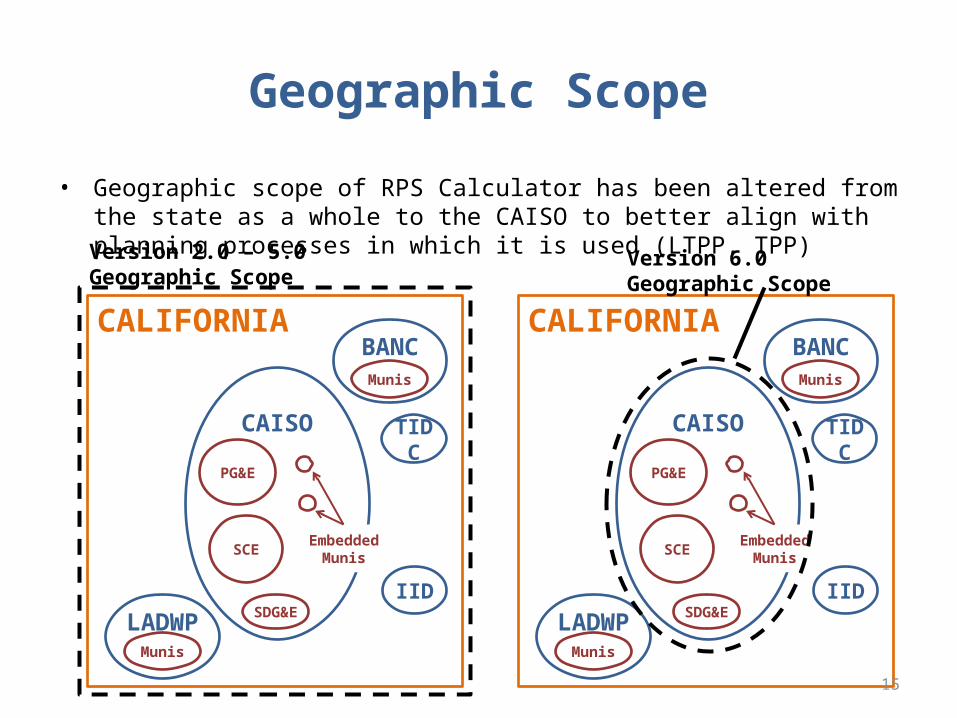
15
CALIFORNIA
Geographic Scope
• Geographic scope of RPS Calculator has been altered from the state as a whole to the CAISO to better align with planning processes in which it is used (LTPP, TPP)
CAISO
PG&E
SCE
SDG&E
BANC
Embedded Munis
Munis
LADWPMunis
CALIFORNIA
CAISO
PG&E
SCE
SDG&E
BANC
Embedded Munis
Munis
LADWPMunis
Version 2.0 – 5.0 Geographic Scope
TIDC TIDC
IID IID
Version 6.0 Geographic Scope