Embed Size (px)
Citation preview
OVERVIEW OF Water Demand Management Initiatives: A City of Cape Town Approach
Zolile Basholo Manager: Water Demand Management and Strategy
|04February 2016
Contents
• Water Value Chain of the City of Cape Town Municipality
• Water Demand and Supply History
• Strategic Goals of Water Demand Management Strategy
• City of Cape Towns Overall Water Balance
• Demand Management Interventions
• Annual Savings Achieved against Projected
• Conservation programmes
2
WATER VALUE CHAIN OF THE CITY OF CAPE TOWN
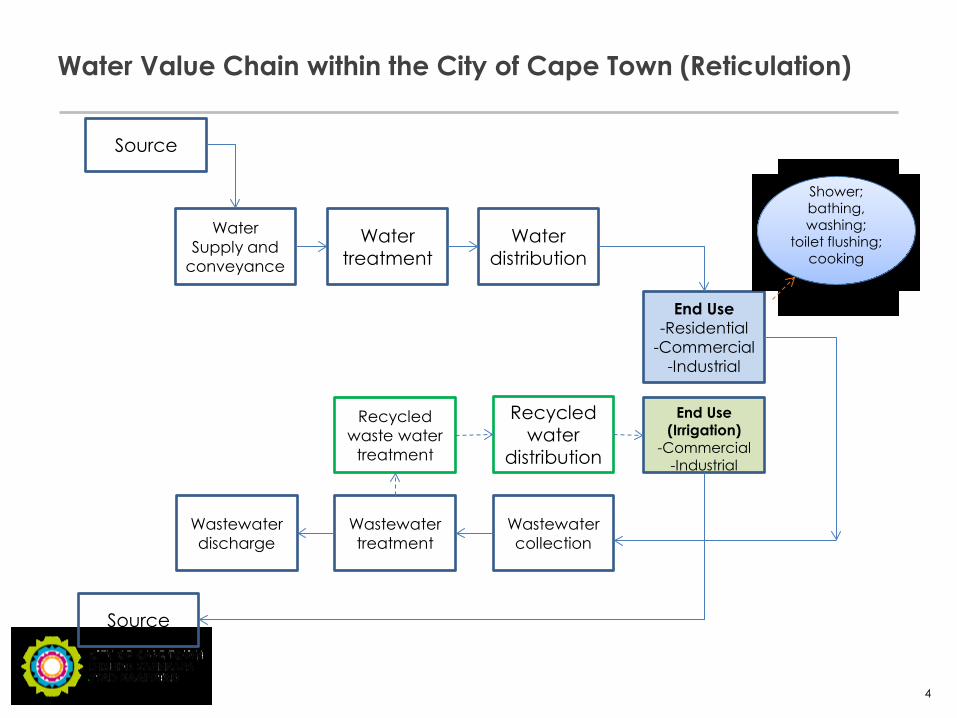
Water Value Chain within the City of Cape Town (Reticulation)
4
Source
Water Supply and
conveyance
Water treatment
Water distribution
End Use -Residential
-Commercial -Industrial
End Use (Irrigation)
-Commercial -Industrial
Wastewater collection
Wastewater treatment
Wastewater discharge
Recycled waste water
treatment
Recycled water
distribution
Source
Shower; bathing, washing;
toilet flushing; cooking
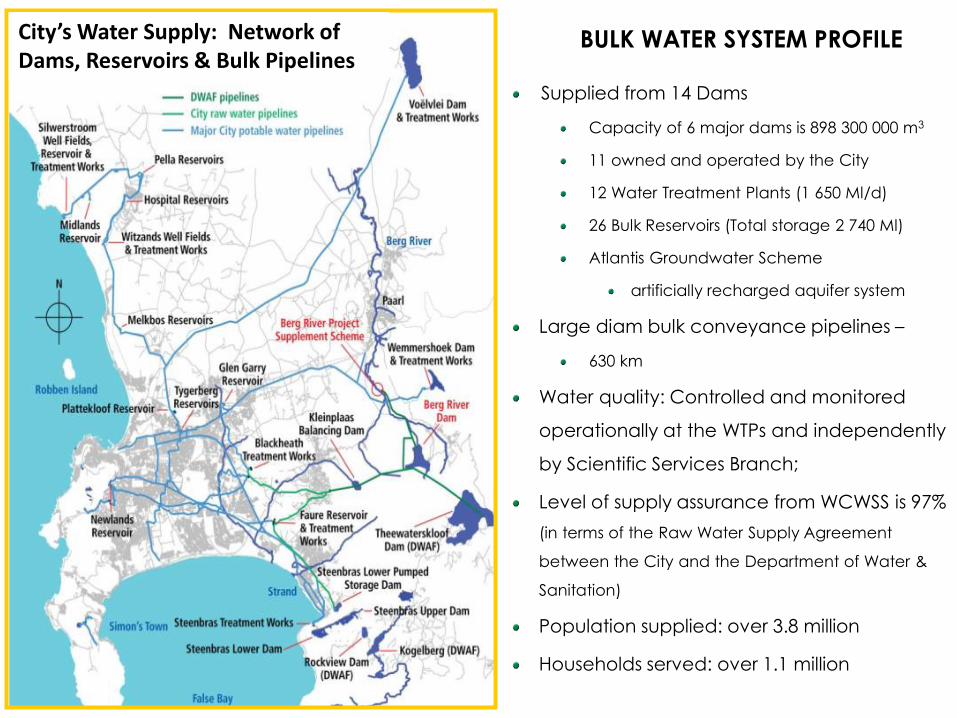
Supplied from 14 Dams
Capacity of 6 major dams is 898 300 000 m3
11 owned and operated by the City
12 Water Treatment Plants (1 650 Ml/d)
26 Bulk Reservoirs (Total storage 2 740 Ml)
Atlantis Groundwater Scheme
artificially recharged aquifer system
Large diam bulk conveyance pipelines –
630 km
Water quality: Controlled and monitored
operationally at the WTPs and independently
by Scientific Services Branch;
Level of supply assurance from WCWSS is 97% (in terms of the Raw Water Supply Agreement
between the City and the Department of Water &
Sanitation)
Population supplied: over 3.8 million
Households served: over 1.1 million
BULK WATER SYSTEM PROFILE City’s Water Supply: Network of Dams, Reservoirs & Bulk Pipelines
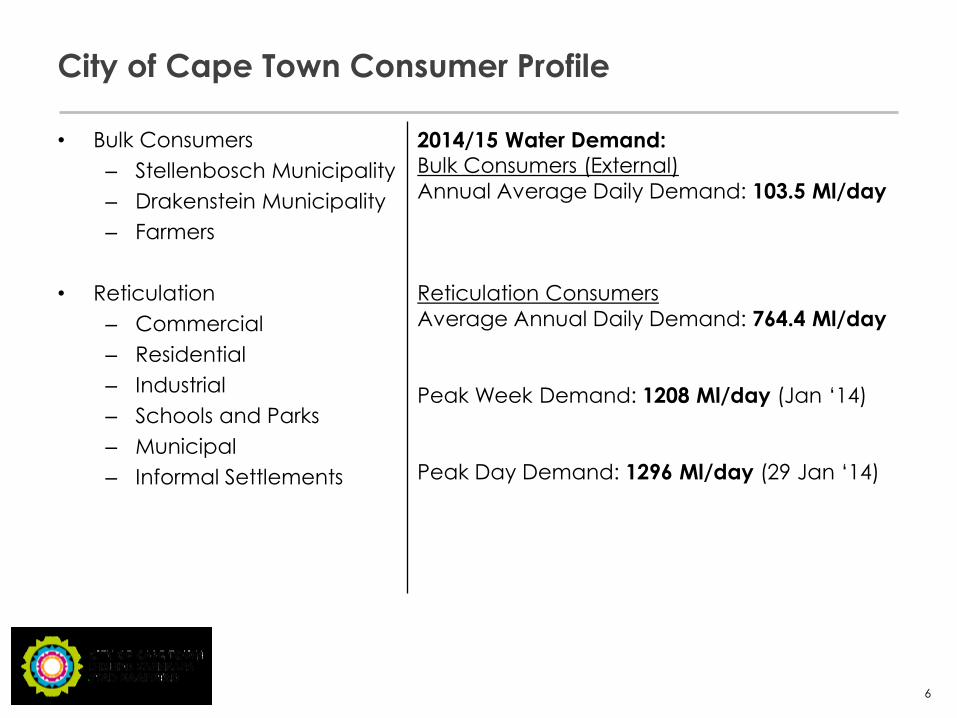
2014/15 Water Demand: Bulk Consumers (External) Annual Average Daily Demand: 103.5 Ml/day Reticulation Consumers Average Annual Daily Demand: 764.4 Ml/day Peak Week Demand: 1208 Ml/day (Jan ‘14) Peak Day Demand: 1296 Ml/day (29 Jan ‘14)
City of Cape Town Consumer Profile
• Bulk Consumers – Stellenbosch Municipality – Drakenstein Municipality – Farmers
• Reticulation – Commercial – Residential – Industrial – Schools and Parks – Municipal – Informal Settlements
6
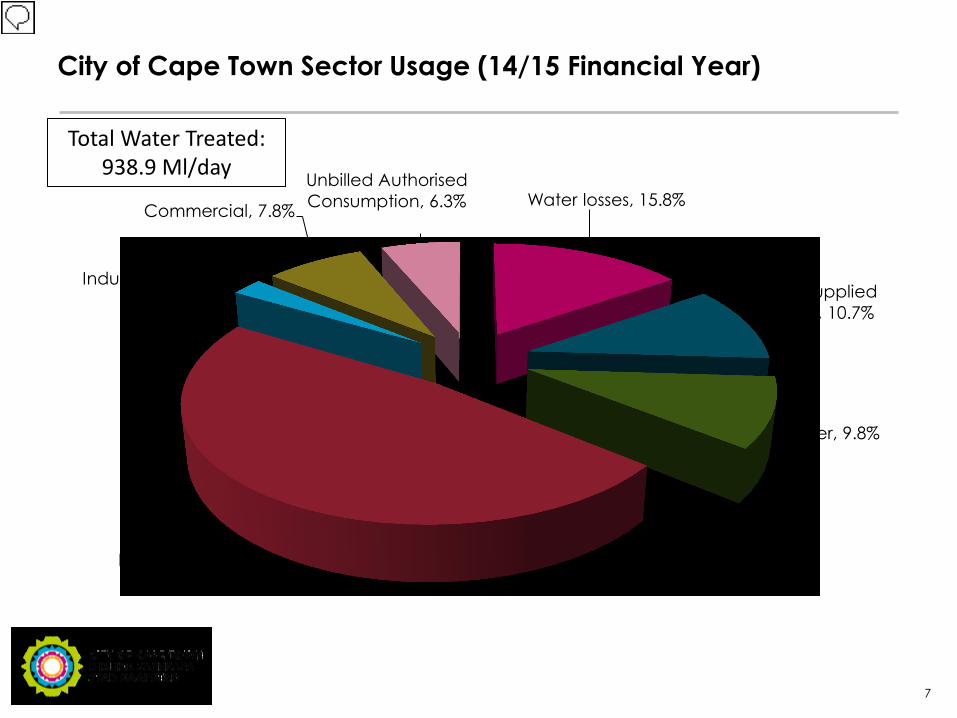
City of Cape Town Sector Usage (14/15 Financial Year)
7
Total Water Treated: 938.9 Ml/day
Water losses, 15.8%
Water Supplied External, 10.7%
Other, 9.8%
Domestic, 47.7%
Industrial, 2.5%
Commercial, 7.8%
Unbilled Authorised Consumption, 6.3%
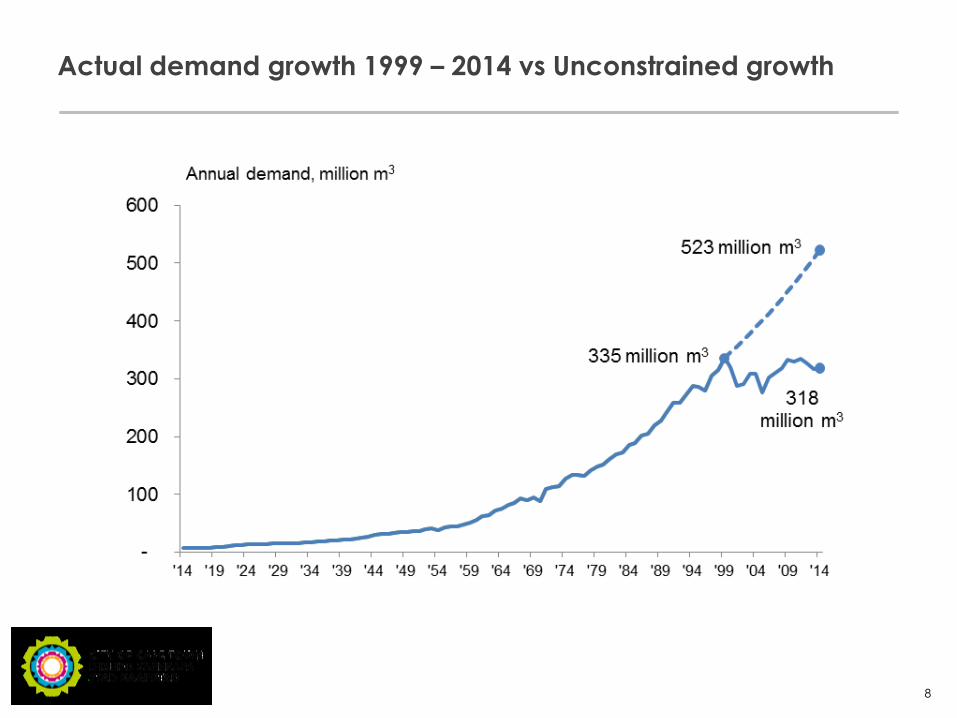
Actual demand growth 1999 – 2014 vs Unconstrained growth
8
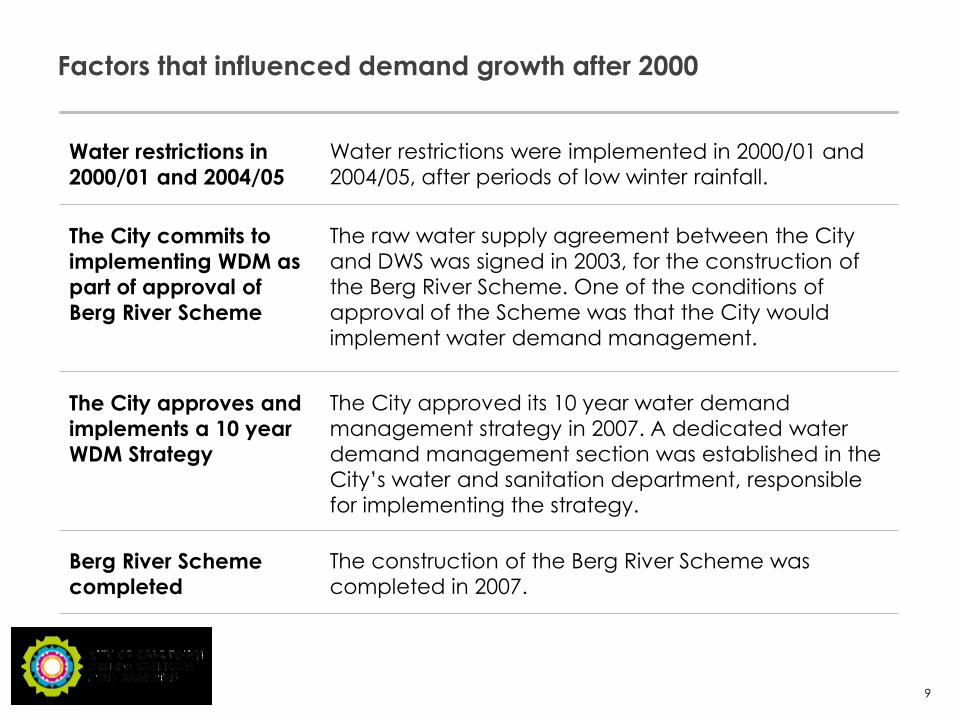
Factors that influenced demand growth after 2000
9
Water restrictions in 2000/01 and 2004/05
Water restrictions were implemented in 2000/01 and 2004/05, after periods of low winter rainfall.
The City commits to implementing WDM as part of approval of Berg River Scheme
The raw water supply agreement between the City and DWS was signed in 2003, for the construction of the Berg River Scheme. One of the conditions of approval of the Scheme was that the City would implement water demand management.
The City approves and implements a 10 year WDM Strategy
The City approved its 10 year water demand management strategy in 2007. A dedicated water demand management section was established in the City’s water and sanitation department, responsible for implementing the strategy.
Berg River Scheme completed
The construction of the Berg River Scheme was completed in 2007.
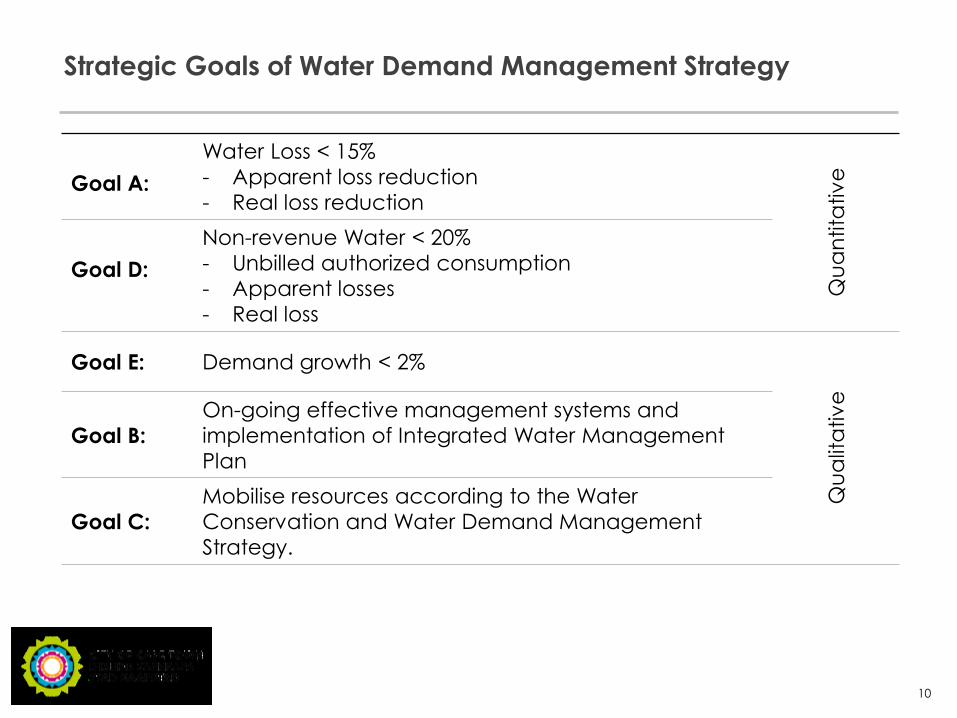
Strategic Goals of Water Demand Management Strategy
10
Goal A: Water Loss < 15% - Apparent loss reduction - Real loss reduction
Qua
ntita
tive
Goal D:
Non-revenue Water < 20% - Unbilled authorized consumption - Apparent losses - Real loss
Goal E: Demand growth < 2%
Qua
lita
tive
Goal B: On-going effective management systems and implementation of Integrated Water Management Plan
Goal C: Mobilise resources according to the Water Conservation and Water Demand Management Strategy.
CITY OF CAPE TOWN OVERALL WATER BALANCE
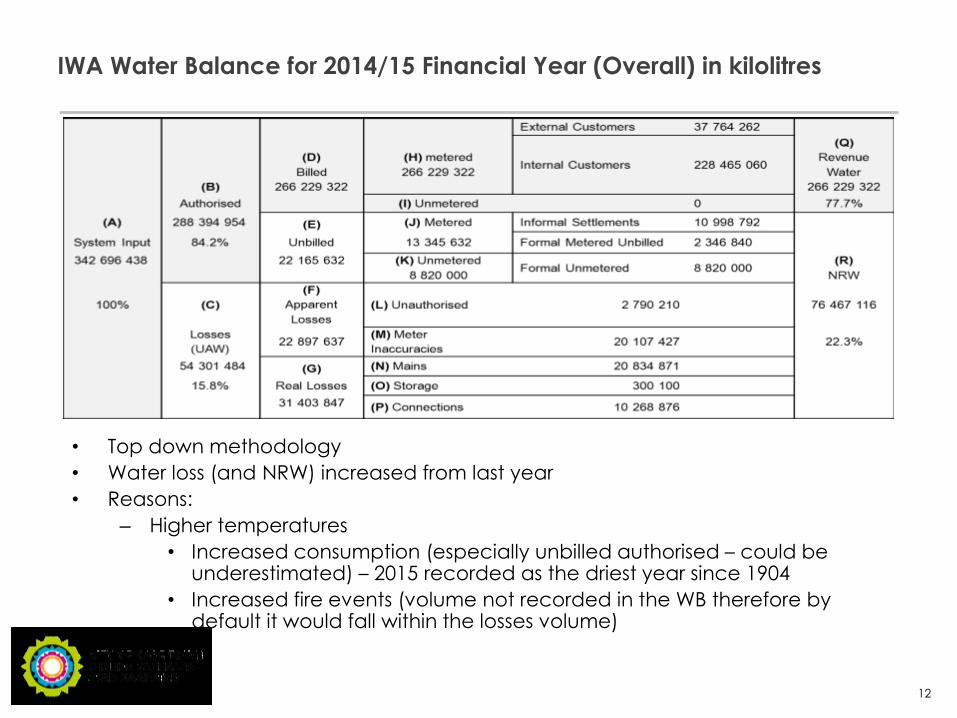
IWA Water Balance for 2014/15 Financial Year (Overall) in kilolitres
• Top down methodology • Water loss (and NRW) increased from last year • Reasons:
– Higher temperatures • Increased consumption (especially unbilled authorised – could be
underestimated) – 2015 recorded as the driest year since 1904 • Increased fire events (volume not recorded in the WB therefore by
default it would fall within the losses volume)
12
DEMAND MANAGEMENT INTERVENTIONS
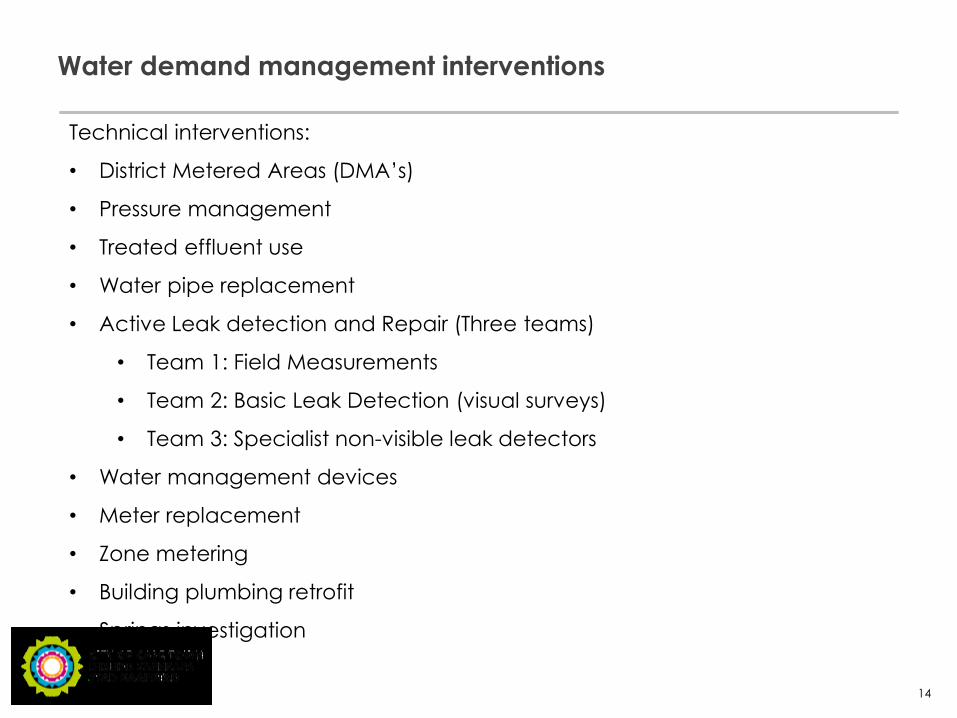
Water demand management interventions
14
Technical interventions:
• District Metered Areas (DMA’s)
• Pressure management
• Treated effluent use
• Water pipe replacement
• Active Leak detection and Repair (Three teams)
• Team 1: Field Measurements
• Team 2: Basic Leak Detection (visual surveys)
• Team 3: Specialist non-visible leak detectors
• Water management devices
• Meter replacement
• Zone metering
• Building plumbing retrofit
• Springs investigation
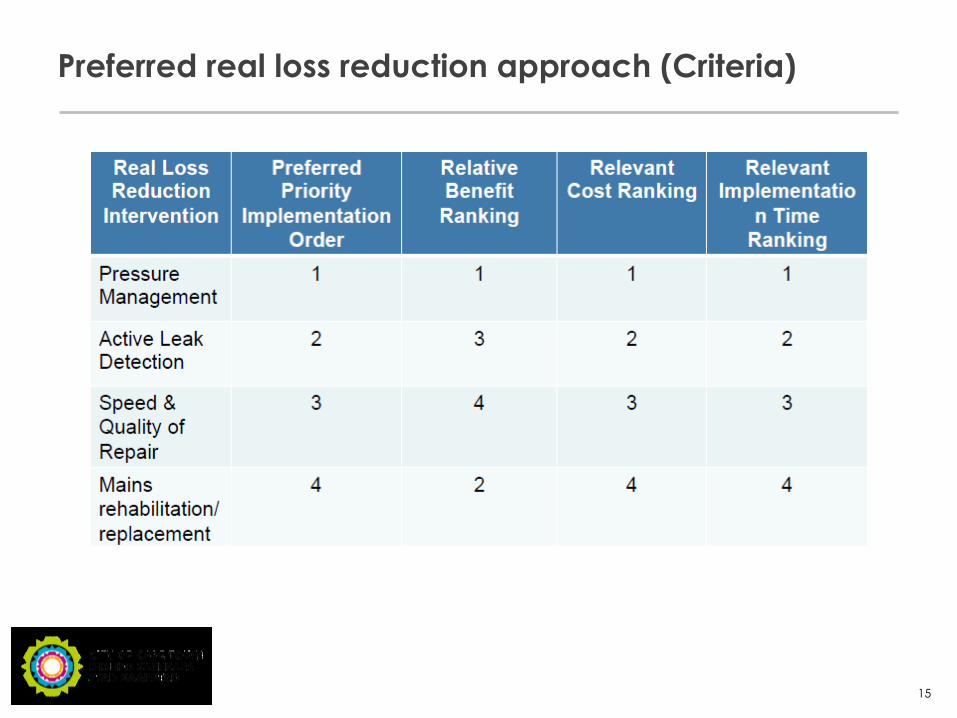
Preferred real loss reduction approach (Criteria)
15
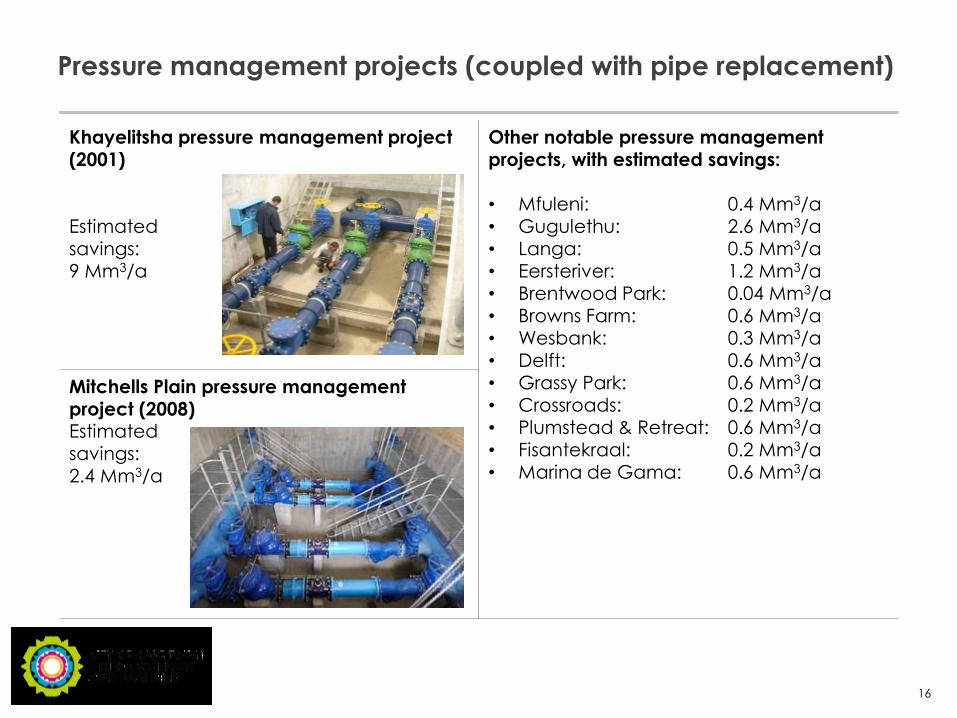
Pressure management projects (coupled with pipe replacement)
16
Khayelitsha pressure management project (2001) Estimated savings: 9 Mm3/a
Other notable pressure management projects, with estimated savings: • Mfuleni: 0.4 Mm3/a • Gugulethu: 2.6 Mm3/a • Langa: 0.5 Mm3/a • Eersteriver: 1.2 Mm3/a • Brentwood Park: 0.04 Mm3/a • Browns Farm: 0.6 Mm3/a • Wesbank: 0.3 Mm3/a • Delft: 0.6 Mm3/a • Grassy Park: 0.6 Mm3/a • Crossroads: 0.2 Mm3/a • Plumstead & Retreat: 0.6 Mm3/a • Fisantekraal: 0.2 Mm3/a • Marina de Gama: 0.6 Mm3/a
Mitchells Plain pressure management project (2008) Estimated savings: 2.4 Mm3/a
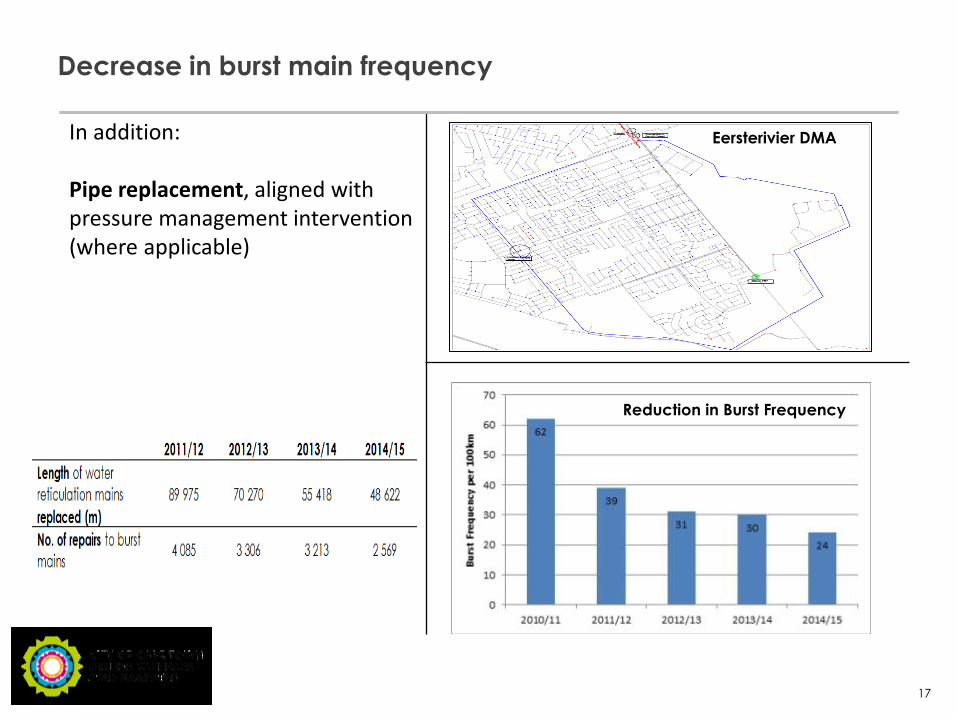
In addition: Pipe replacement, aligned with pressure management intervention (where applicable)
Decrease in burst main frequency
17
Eersterivier DMA
Reduction in Burst Frequency
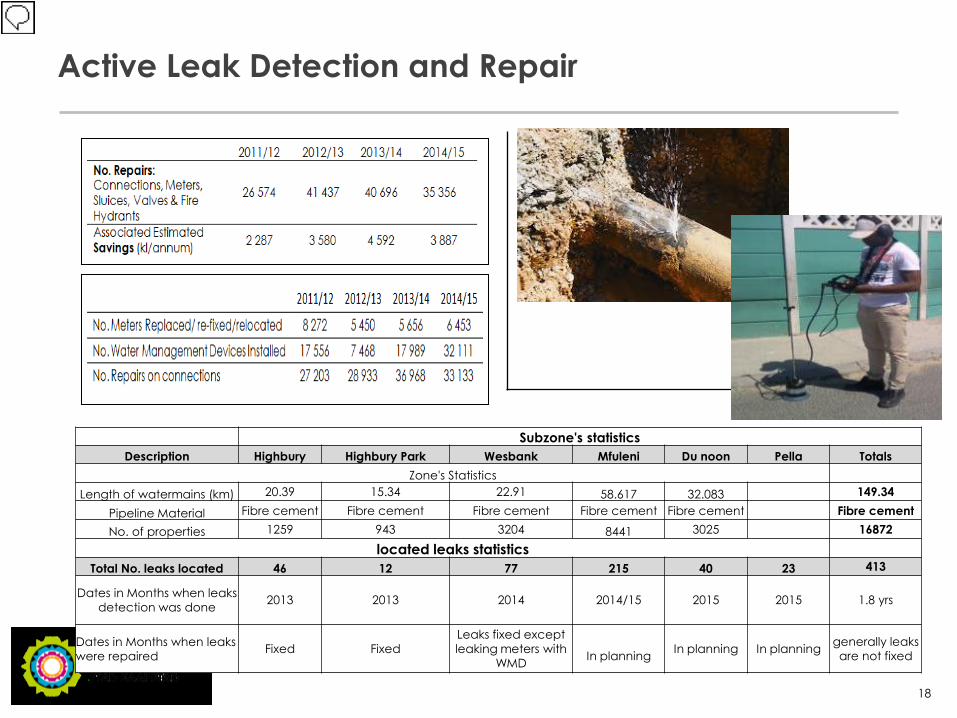
Active Leak Detection and Repair
18
Subzone's statistics Description Highbury Highbury Park Wesbank Mfuleni Du noon Pella Totals
Zone's Statistics Length of watermains (km) 20.39 15.34 22.91 58.617 32.083 149.34
Pipeline Material Fibre cement Fibre cement Fibre cement Fibre cement Fibre cement Fibre cement No. of properties 1259 943 3204 8441 3025 16872
located leaks statistics Total No. leaks located 46 12 77 215 40 23 413
Dates in Months when leaks detection was done 2013 2013 2014 2014/15 2015 2015 1.8 yrs
Dates in Months when leaks were repaired Fixed Fixed
Leaks fixed except leaking meters with
WMD
In planning In planning In planning generally leaks
are not fixed
Industrial meter audit Investigation and illegal connections
• Infrastructure Analyse • Prioritise according to age of the area and consumption profile • Includes illegal connection investigation • Identify damaged meters and Replace meters • +/-20 industrial areas were covered • To name a few :
– Atlantis Industrial Area – Paarden Eiland – Athlone Industria
19
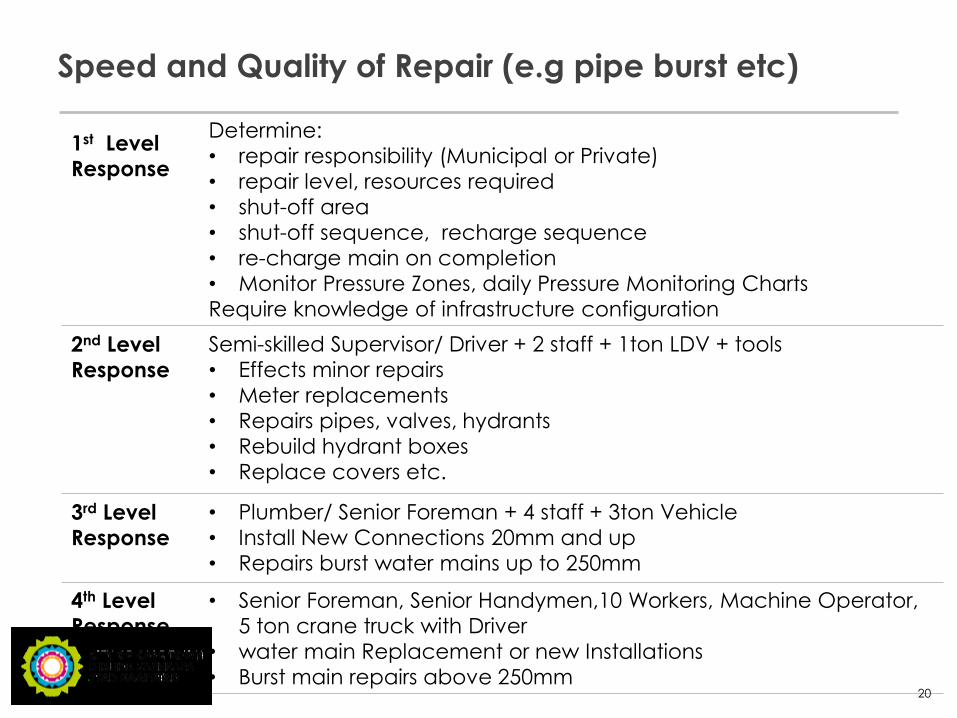
Speed and Quality of Repair (e.g pipe burst etc)
20
1st Level Response
Determine: • repair responsibility (Municipal or Private) • repair level, resources required • shut-off area • shut-off sequence, recharge sequence • re-charge main on completion • Monitor Pressure Zones, daily Pressure Monitoring Charts Require knowledge of infrastructure configuration
2nd Level Response
Semi-skilled Supervisor/ Driver + 2 staff + 1ton LDV + tools • Effects minor repairs • Meter replacements • Repairs pipes, valves, hydrants • Rebuild hydrant boxes • Replace covers etc.
3rd Level Response
• Plumber/ Senior Foreman + 4 staff + 3ton Vehicle • Install New Connections 20mm and up • Repairs burst water mains up to 250mm
4th Level Response
• Senior Foreman, Senior Handymen,10 Workers, Machine Operator, 5 ton crane truck with Driver
• water main Replacement or new Installations • Burst main repairs above 250mm
Speed and Quality of Repair
• Rapid response to complaints • Shut down burst mains quickly (less wastage) • Reduce risk of private damage • Reduce risk of public liability – e.g vehicles into hole • Staff utilisation optimised, eliminate overtime
Benefits of the Levels of response
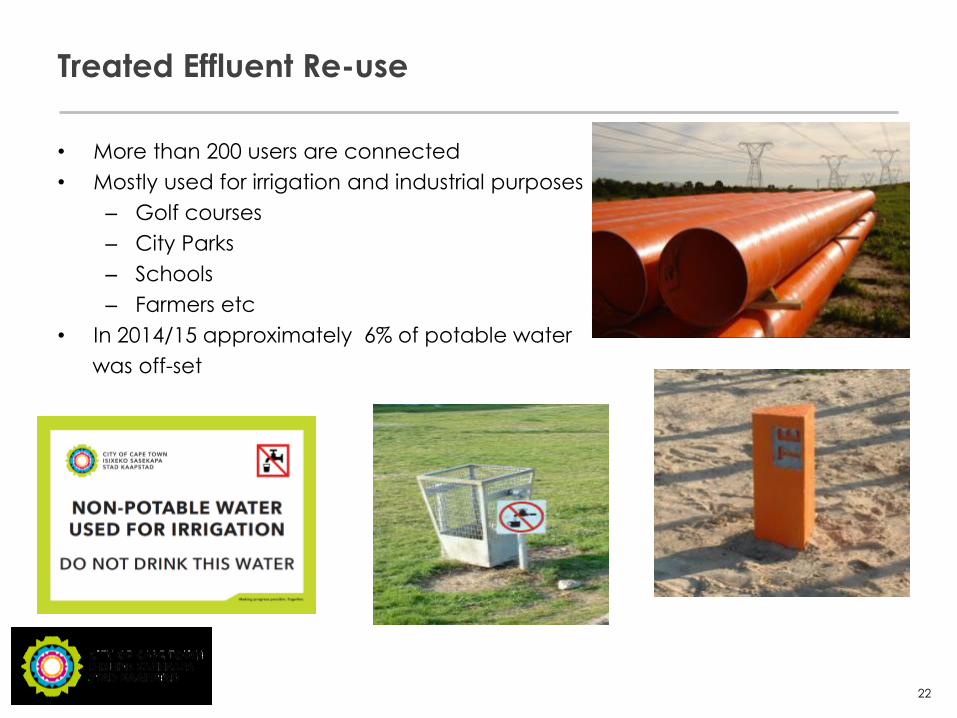
Treated Effluent Re-use
• More than 200 users are connected • Mostly used for irrigation and industrial purposes
– Golf courses – City Parks – Schools – Farmers etc
• In 2014/15 approximately 6% of potable water was off-set
22
SAVINGS ACHIEVED AGAINST PROJECTIONS
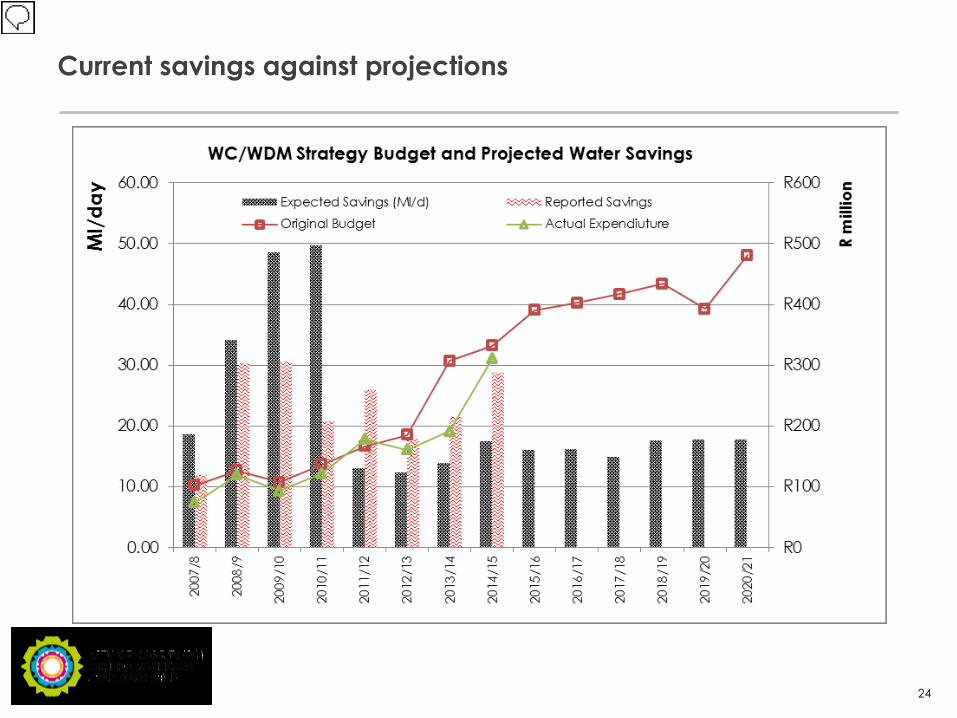
Current savings against projections
24
Water Conservation Programme
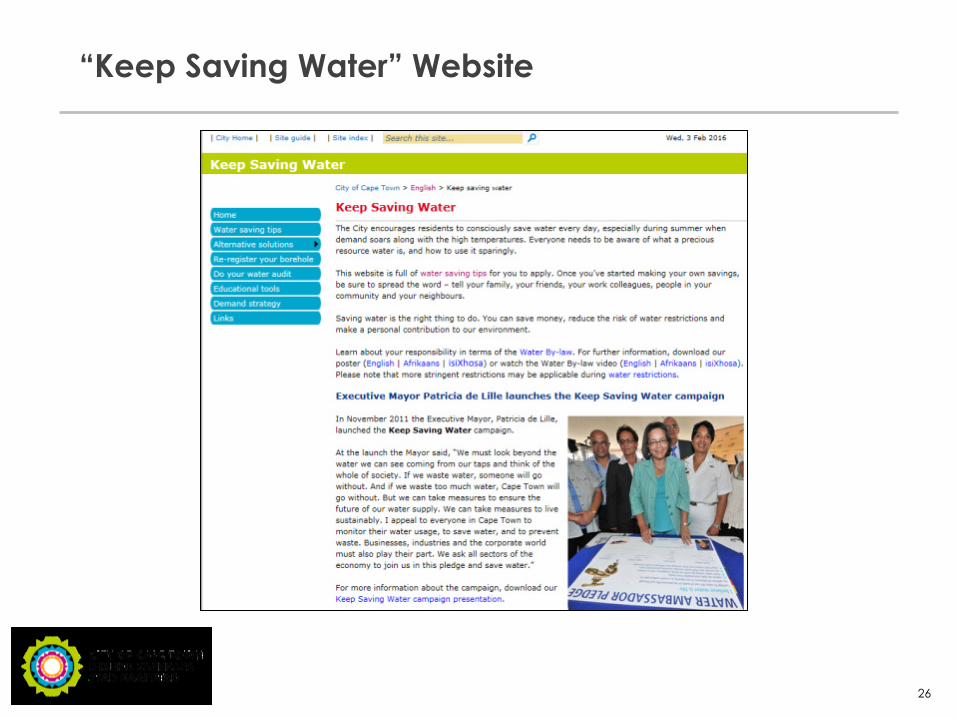
“Keep Saving Water” Website
26
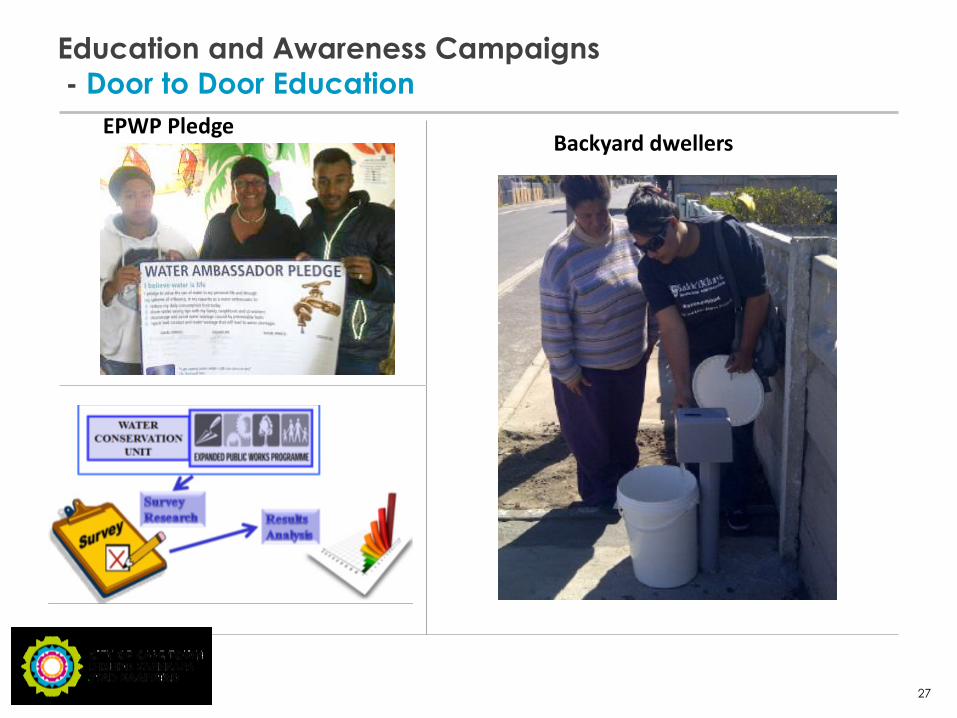
Education and Awareness Campaigns - Door to Door Education
27
EPWP Pledge Backyard dwellers
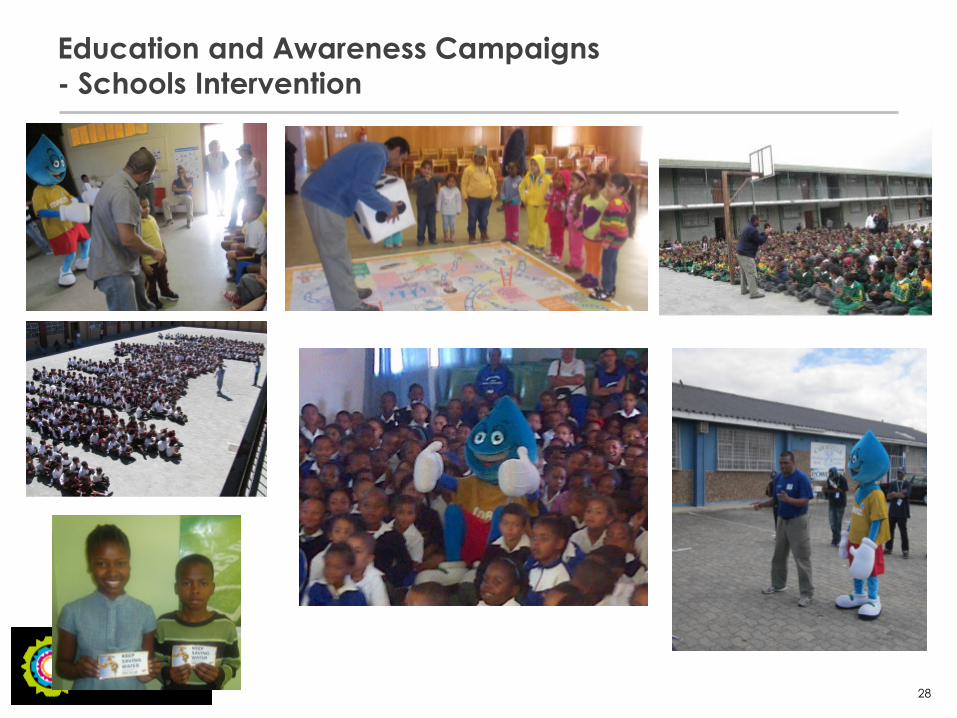
Education and Awareness Campaigns - Schools Intervention
28
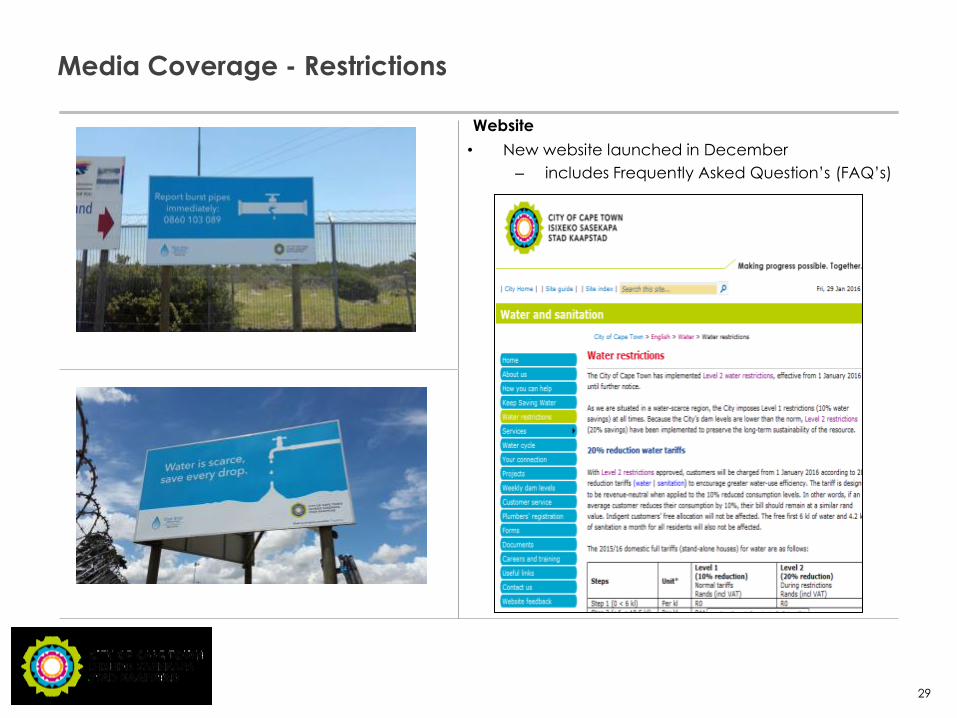
Media Coverage - Restrictions
29
Website • New website launched in December
– includes Frequently Asked Question’s (FAQ’s)

International Award: C40 Cities-Adaption and Implementation of the WCWDM Strategy (2015)
30 Go to Insert > Header & Footer > Enter presentation name into footer field
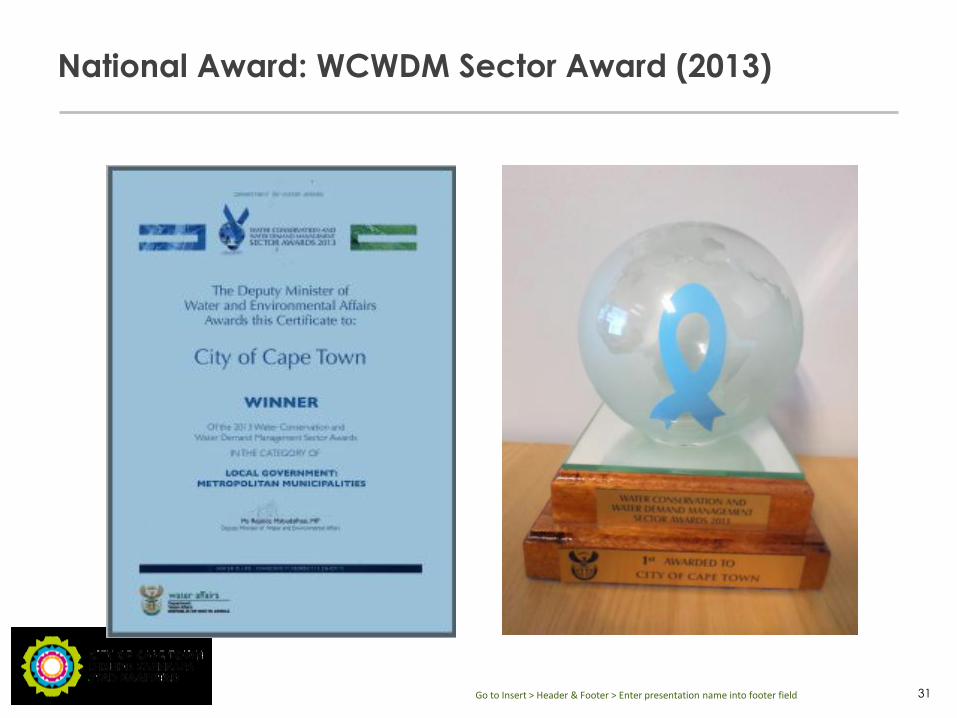
National Award: WCWDM Sector Award (2013)
31 Go to Insert > Header & Footer > Enter presentation name into footer field
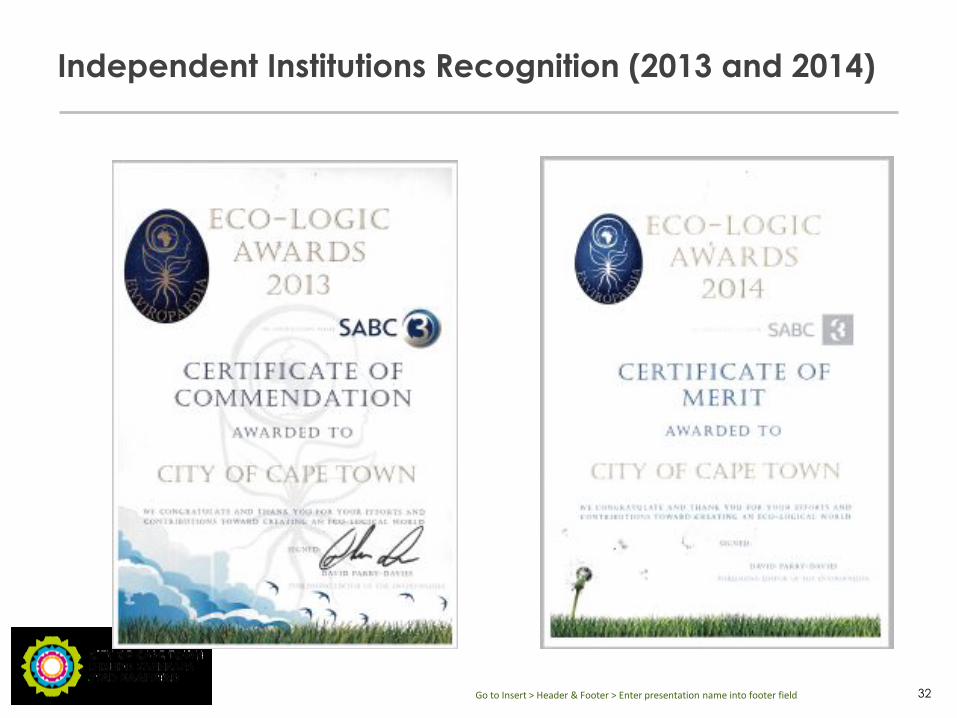
Independent Institutions Recognition (2013 and 2014)
32 Go to Insert > Header & Footer > Enter presentation name into footer field