Embed Size (px)
Citation preview

Overview & Outlook for the P/C Insurance Industry
Drivers of Revenue, Cost and Competition
National Conference of Insurance Guaranty FundsMemphis, TNMay 4, 2011
Robert P. Hartwig, Ph.D., CPCU, President & EconomistInsurance Information Institute ♦ 110 William Street ♦ New York, NY 10038
Tel: 212.346.5520 ♦ Cell: 917.453.1885 ♦ [email protected] ♦ www.iii.org

3
What in the World Is Going On?
Is the World Becoming a Riskier Place?
And If It Is, Should Guaranty Funds Be Concerned?

4
Uncertainty, Risk and Fear Abound Resurgent Terrorism Risk (e.g., Bin Laden Killing) Record Tornado Activity in the US Japan, New Zealand, Haiti, Chile Earthquakes Political Upheaval in the Middle East Echoes of the Financial Crisis Housing Crisis US Debt and Budget Crisis Sovereign Debt & Currency Crises Inflation Runaway Energy & Commodity Prices Era of Fiscal Austerity Reshuffling the Global Economic Deck China Becomes #2 Economy in the World Nuclear Fears Manmade Disasters (e.g., Deepwater Horizon)
Are “Black Swans” everywhere or
does it just seem that way?

5
Recent Events Illustrate the Importance of Guaranty Events
Uncertainty, Volatility and Catastrophe

6
Terrorism, P/C Insurance and the Killing of Osama bin Laden
Do We Still Need the Terrorism Risk Insurance Program?

7
Bin Laden, Justice and the Future of Terrorism, Risk and Insurance
Sources: Insurance Information Institute.
Property-WTCProperty -
Other
Bin Laden is Dead and Justice Is Served, But What Are the Implications for the P/C Insurance Industry?

8
Distribution of Insured September 11 Losses by Line ($ Billions, 2009 Dollars)
Sources: Insurance Information Institute research.
Property-WTC
Industrial
Property -Other
Property-Other,$7.419%
Business Interruption,
$13.533%
Workers Comp,$2.2
6%
Aviation Hull,$0.6
2%
Event Cancellation,$1.2
3%
Aviation Liability,$4.3
11%
Other Liability,$4.9
12%
Life,$1.23%
Property-WTC,$4.4
11%
(1) Loss total does not include NYC March 2010 settlement of up to $657.5 million to compensate about 10,000 Ground Zero workers.(2) Sum of segment totals may not equal overall total due to rounding. Adjusted to 2010 dollars using the Bureau of Labor Statistics (BLS) Inflation Calculator.
9/11 losses totaled $40.0 billion in 2010 dollars ($32.5 billion in 2001 dollars) 9/11 remains the largest
WC loss in US history ($2.2 bn), even though
9/11 property losses were surpassed by Hurricane
Katrina in 2005

9
Thwarted and Failed Terrorism Attempts Against the US in 2009 and 2010
Sources: Terrorism Risk: A Reemergent Threat, Insurance Information Institute (http://www.iii.org/white_papers/terrorism-risk-a-reemergent-threat-2011.html); Federal Bureau of Investigation.
Property-WTCProperty -
Other
9/11 remains the largest WC loss in US history ($2.2 bn), even though
9/11 property losses were surpassed by Hurricane
Katrina in 2005
There Have Been Numerous Unsuccessful Attempts by Terrorists to Attack the US Over the Past 2 Years

Insured Loss Estimates: Large CNBR Terrorist Attack ($ Bill)
Type of Coverage New York WashingtonSan
FranciscoDes
Moines
Group Life $82.0 $22.5 $21.5 $3.4General Liability 14.4 2.9 3.2 0.4Workers Comp 483.7 126.7 87.5 31.4Residential Prop. 38.7 12.7 22.6 2.6Commercial Prop. 158.3 31.5 35.5 4.1Auto 1.0 0.6 0.8 0.4TOTAL $778.1 $196.8 $171.2 $42.3
Source: American Academy of Actuaries, Response to President’s Working Group, Appendix II, April 26, 2006.
Workers Comp is and Remains the Most Vulnerable of All P/C Lines, Despite Killing of Bin Laden

13
Terrorism Risk Insurance and Bin Laden’s Death Bin Laden’s Killing, at Least in the Short Run, Could Actually Increase
Risk as Al Qaeda’s Sympathizers Seek to Avenge His Death US State Department: “Enhanced potential for anti-American violence.”
Longer-Run Impact is Unclear Al Qaeda has many splinter groups Current Mideast conflicts (e.g., Libya/Qaddafi attack) could increase risk
Domestic/Home Grown Terror Risk Looms Large Today than in 2001 Several potentially severe attacks have been thwarted
Challenge to Maintain Terrorism Risk Insurance Program through 2014 Will the Administration try to scale TRIPRA back under budget pressure using bin
Laden’s death as the rationale?
Will a Lack of Attacks, Death of bin Laden Influence Terrorism Risk Insurance Program Renewal Debate Ahead of 2014 Expiration? Narrowing of coverage (WC is the least likely of lines to be excluded) Increased private insurer retention relative to federal government backstop
TRIA and Its Successors: Economic Stimulus Programs that Have Cost the Government Nothing Programs promote employment, construction and investment

14
Summary of April 2011 Tornado Outbreak
2011 Will Be Among the Most Deadly and Expensive for
Tornadoes in History

15
Summary of Recent Tornado Activity
There Have Been 877 Tornadoes Through April 28 in the US
Approximately 450 People Have Died
The April 27 Tornado Outbreak Killed at Least 342 People Now the 2nd deadliest outbreak in US history (747 killed in march 1925 event)
States impacted: AR, TN, LA, MS, GA and especially AL
Insured Losses Estimated at $2 Bill to $5 Bill (Eqecat)
Economic Losses Likely in the $4 Bill to $10 Bill Range
P/C Insurers (and their Reinsurers) Will Settle Tens of Thousands of Home, Business and Auto Claims
P/C Insurance Industry is Very Strong and Will Encounter No Difficulties in Paying these Claims

16
1,13
3
1,13
2 1,29
7
1,17
3
1,08
2 1,23
4
1,17
3
1,14
8
1,42
4
1,34
5
1,07
1 1,21
6
941
1,37
6
1,26
4
1,10
3
1,09
8
1,69
2
1,15
6 1,28
0
1,819
877
440
0
200
400
600
800
1,000
1,200
1,400
1,600
1,800
2,000
90 91 92 93 94 95 96 97 98 99 00 01 02 03 04 05 06 07 08 09 10 11P
Num
ber o
f Tor
nado
es
0
50
100
150
200
250
300
350
400
450
500
Num
ber of Deaths
Number of Tornadoes
Number of Deaths
*2011 is preliminary data through April 28; Death count is III estimate based on official sources as of April 30. Source: U.S. Department of Commerce, Storm Prediction Center, National Weather Service.
Number of Tornadoes and Related Deaths, 1990 – 2011*
Tornadoes have already claimed more than 400 lives
There were already 877 tornadoes in the
US by April 28

U.S. Tornado Count, 2010
Source: NOAA 17
There were 1483 tornadoes in the US in 2010, slightly
above average
2011 is shaping to be a deadlier
version of 2008

20
Summary of Japan Earthquake
The March 11 Quake is Just the Most Recent of Several Large
Catastrophe Losses

21
Location of March 11, 2011 Earthquake Near Sendai, Honshu, Japan
Source: US Geological Service; Insurance Information Institute.
Magnitude 9.0 earthquake struck Japan at 2:46PM local time (2:46AM Eastern) off northeast coast of Honshu, 80 miles east of Sendai
Quake is among the 5 strongest in recorded history and the strongest in the 140 years for which records have been kept in Japan
12,000+ fatalities
Economic loss: $100 - $300 bn
Insured losses up to $45 bn
Fukushima Nuclear Plant threat level raised to Category 7 on April 11 (highest, same as Chernobyl)
Significant tsunami damage was recorded in Japan; relatively minor damage on the U.S. West Coast
March 11 Earthquake Factsas of 3/24/2011
LOCATION130 km (80 miles) E of Sendai, Honshu, Japan178 km (110 miles) E of Yamagata, Honshu, Japan178 km (110 miles) ENE of Fukushima, Honshu, Japan373 km (231 miles) NE of TOKYO, Japan

Insured Japan Earthquake Loss Estimates*
$- $5 $10 $15 $20 $25 $30 $35 $40 $45 $50
Towers Watson
AIR Worldwide
RMS
Eqecat
$21 - $34 bn
$20 - $45 bn
$12 - $25 bn
$25 - $35 bn
22
*As of April 21, 2011. Towers Watson estimate includes $3.0 (low) to $4.9 billion (high) in life insurance losses. RMS estimate includes insured life/health losses of $3 to $8 billion.Sources: AIR Worldwide, Eqecat, RMS, Towers Perrin; Insurance Information Institute.
(Insured Losses, $ Billions)
Economic losses are likely to total in the $200-$300 billion
range, meaning only a fraction of the loss is insured

23
Top 20 Nonlife Insurance Companies in Japan by DPW, 2008
Direct premiums written, 2008
Rank Companies JPY (millions)
U.S. ($ millions)
Marketshare
Cumulative Market Share
1 Tokio & Marine Nichido $2,032,131.2 $19,660.9 24.0% 24.0%
2 Sompo Japan 1,504,262.7 14,553.8 17.8 41.8%
3 Mitsui Sumitomo 1,455,161.8 14,078.7 17.2 59.0%
4 Aioi 897,182.6 8,680.3 10.6 69.6%
5 Nipponkoa 728,262.9 7,046.0 8.6 78.2%
6 Nisay Dowa 361,530.7 3,497.8 4.3 82.5%
7 Fuji 329,345.7 3,186.4 3.9 86.4%
8 AIU 253,522.8 2,452.8 3.0 89.4%
9 Kyoei 199,393.1 1,929.1 2.4 91.8%
10 Nisshin 149,735.8 1,448.7 1.8 93.6%
11 American Home 82,889.8 802.0 1.0 94.6%
12 Asahi 73,600.1 712.1 0.9 95.5%
13 Sony 60,868.3 588.9 0.7 96.2%
14 ACE 54,876.2 530.9 0.7 96.9%
15 Zurich 45,471.3 439.9 0.5 97.4%
16 SECOM 44,245.0 428.1 0.5 97.9%
17 Sumi Sei 33,594.0 325.0 0.4 98.3%
18 AXA 30,418.9 294.3 0.4 98.7%
19 Mitsui Direct 29,471.9 285.1 0.4 99.1%
20 Daido 15,690.4 151.8 0.2 99.3%
Source: © AXCO 2011.

24
Recent Major Catastrophe Losses
(Insured Losses, $US Billions)
Sources: Insurance Council of Australia, Munich Re, AIR Worldwide; Insurance Information Institute.
$30.0
$10.0$8.0
$5.0$2.0$0.5
$0
$5
$10
$15
$20
$25
$30
$35
Cyclone Yasi(Australia) Feb
2011
Australia Floods(Dec - Feb 2011)
New ZealandQuake (Sep 2010)
Chile Earthquake(Feb 2010)
New ZealandQuake (Feb 2011)
Japan Earthquake(Mar 2011)
Insured Losses from Recent Major Catastrophe Events Exceed $55 Billion, an Estimated $53 Billion of that from Earthquakes
The March 2011 earthquake in Japan will become among the most expensive in world history in terms of insured losses (current
leader is the 1994 Northridge earthquake with $22.5B in insured losses in 2010 dollars)

25
Potential Impacts of Japan Quake & Other Major CATs on
P/C (Re)Insurance Markets
Impacts Could Be Felt Well Beyond Japan

26
Nonlife (P/C) Insurance Market Impacts of Japan Earthquake No Direct Impact for US Domestic Primary Insurers Primary Insurance: Domestic Japanese Insurers Take Big Losses Few US/Foreign Insurers Had Direct Exposure to Japanese P/C Market
Low single-digit market share for a small number of companies Not a capital event for any non-Japanese primary insurer
Significant Absorption of Loss by Japanese Government Residential earthquake damage Nuclear-related property and liability damage
Significant Impacts for Global Reinsurers Property-Catastrophe covers on Commercial Lines Business Interruption/Contingent Business Interruption
Currently an Earnings Event for Global Reinsurers Not a capital event: Global reinsurance markets entered 2011 with record capital
Cost of Property/Cat Reinsurance Rising in Japan, New Zealand, Australia Up for all; Magnitude of increase is sensitive to size of loss
Reinsurance Coverage Remains Available in Affected Regions Marginal Impact on Cost of US Property-Cat Reinsurance
Market remains well capitalized and competitive Elevated global cat activity could halt/hike price declines for property/cat reinsurance

Percentage of California Homeowners with Earthquake Insurance, 1994-2010*
32.9% 33.2%
19.5%17.4%
14.6% 13.3% 13.8%12.0% 12.0%
15.8%15.7%16.8%
0%
5%
10%
15%
20%
25%
30%
35%
94 96 97 98 99 00 01 02 03 04 06** 10**
*Includes CEA policies beginning in 1996. **2006/10 estimates from Insurance Information Network of CA.Source: California Department of Insurance; Insurance Information Institute.
The vast majority of California homeowners forego earthquake
coverage and play Russian Roulette with their most valuable asset

28
% of Residences in MO Quake-Prone Areas with Earthquake Coverage, 2009 vs. 2002
Sources: Missouri Department of Insurance news release, Feb. 11, 2011; Insurance Information Institute.
69%
63%
36%
63%
37% 45
%
43%
32%
55%
49%
48%
73%
54%
56%
51%
51%
0%
10%
20%
30%
40%
50%
60%
70%
80%
St. LouisCity
St. LouisCounty
Dunklin Mississippi NewMadrid
Pemiscot Scott Stoddard
2002 2009
Residential Take-Up Rates in Missouri Quake-Prone Counties Have Fallen Significantly in Recent Years, but Compare Favorably to California (12%)
Between 32% and 63% of MO homeowners buy quake coverage in
vulnerable areas compared to 12% of CA homeowners and about 50% in Japan.

29
Estimated Insured Losses for the Top 10 Historical Earthquakes Based on Current Exposures (1) ($ Billion)
(1) Modeled loss to property, contents, and business interruption and additional living expenses for residential, mobile home, commercial and auto exposures as of December 31, 2008. Losses include demand surge and fire following earthquake. Policy conditions and earthquake insurance take up rates are based on estimates by state insurance departments and client claims data.
Source: AIR Worldwide Corporation.
Rank Date Location Magnitude Insured loss(current exposures)
1 Feb. 7, 1812 New Madrid, MO 7.7 $100
2 Apr. 18, 1906 San Francisco, CA 7.8 96
3 Aug. 31, 1886 Charleston, SC 7.3 37
4 Jun. 1, 1838 San Francisco, CA 7.4 27
5 Jan. 17, 1994 Northridge, CA 6.7 21
6 Oct. 21, 1868 Hayward, CA 7.0 21
7 Jan. 9, 1857 Fort Tejon, CA 7.9 8
8 Oct. 17, 1989 Loma Prieta, CA 6.3 6
9 Mar. 10, 1933 Long Beach, CA 6.4 5
10 Jul. 1, 1911 Calaveras, CA 6.4 4

30
Reinsurance Market Overview
Reinsurers Will Bear a Significant Share of Recent Major Catastrophes Losses

31
Change in Reinsurer Capital, 2007-2010:Q3

$0
$10
$20
$30
$40
$50
$60
$70
$80
$90
$100
1985 1987 1988 1989 1990 1991 1992 1993 1994 1995 1996 1998 1999 2001 2002 2003 2004 2005 2007 2008 2009 2010 2011
Bill
ion
s
Worldwide Direct Insured Losses Reinsured Losses
Reinsurers’ share of major market losses was
exceptionally high in 2010 and early 2011
Source: Holborn; RAA.* 2011 events are as of March 31 and are preliminary and may change as loss estimates are refined further.
Significant Market Losses, 1985-2011*

41
Reasons for Optimism, Causes for Concern in the P/C
Insurance Industry
The Outlook for the Economy Has Brightened, But the Outlook
for P/C Insurance Is Mixed

42
Reasons for Optimism, Causes for Concern in the P/C Insurance Industry Economic Recovery in US is Self-Sustaining and Strengthening
No Double Dip or Second Recession Economy is more resilient than most pundits presume
Consumer Confidence is Gradually Improving Consumer Spending is Recovering Gradually Consumer and Business Lending Are Expanding Housing Market Remains Weak, but Some Improvement Expected in 2011 Inflation Remains Under Control
Runaway inflation is highly unlikely; Fed has things under control Deflation—threat has disappeared
Private Sector Hiring is Consistently Positive for 14 Months Acceleration in hiring later in 2011 compared to 2010 No significant secondary spike in unemployment
Japan Threat to Global Economy Overstated Sovereign Debt, Muni Bond “Crises” Overblown Current Middle East Turmoil Poses Only Moderate Risk to US Economy Interest Rates Are Rising but Remain Low by Historical Standards Stock and Bond Markets More Stable, Less Volatile Political Environment Is More Hospitable to Business Interests

43
Reasons for Optimism, Causes for Concern in the P/C Insurance Industry Era of Mass P/C Insurance Exposure Destruction Has Ended
Personal and commercial exposure growth is virtually certain in 2011 But restoration of destroyed exposure will take 3-5 years in US
Exposure Growth Returned in in 2nd Half 2010, Will Accelerate in 2011 P/C Industry Saw Growth in 2010 (+0.8%) for the First Time Since 2006 Increasing Private Sector Hiring Will Drive Payrolls/WC Exposures
Wage growth is also positive and could modestly accelerate
Increase in Demand for Commercial Insurance Is in its Earliest Stages and Will Accelerate in 2011 Includes workers comp, commercial auto, marine, many liability coverages, D&O Laggards: Property, inland marine, aviation Personal Lines: Auto leads, homeowners lags
Investment Environment Is/Remains Much More Favorable Return of realized capital gains as a profit driver Interest rates are low but are risingBoost to investment income
Agent Commissions Should Begin to Rise in 2011
Demand, Capital Management Strategies Will Temper Overcapitalization

44
P/C Insurance Industry Financial Overview
Profit Recovery ContinuesEarly Stage Growth Begins

P/C Net Income After Taxes1991–2010 ($ Millions)
$14,
178
$5,8
40
$19,
316
$10,
870 $20,
598
$24,
404 $3
6,81
9
$30,
773
$21,
865
$3,0
46
$30,
029
$62,
496
$3,0
43
$34,
670
$28,
672
-$6,970
$65,
777
$44,
155
$20,
559
$38,
501
-$10,000
$0
$10,000
$20,000
$30,000
$40,000
$50,000
$60,000
$70,000
$80,000
91 92 93 94 95 96 97 98 99 00 01 02 03 04 05 06 07 08 09 10
2005 ROE*= 9.6% 2006 ROE = 12.7% 2007 ROE = 10.9% 2008 ROE = 0.3% 2009 ROAS1 = 5.9% 2010 ROAS = 6.5%
P-C Industry 2010 profits were$34.7B vs.$28.7B in 2009, due mainly to $5.7B in realized capital
gains vs. -$7.9B in previous realized capital losses
* ROE figures are GAAP; 1Return on avg. surplus. Excluding Mortgage & Financial Guaranty insurers yields a 7.5% ROAS for 2010 and 7.4% for 2009.Sources: A.M. Best, ISO, Insurance Information Institute

A 100 Combined Ratio Isn’t What ItOnce Was: Investment Impact on ROEsCombined Ratio / ROE
* 2009 and 2010 figures are return on average statutory surplus. 2008, 2009 and 2010 figures exclude mortgage and financial guaranty insurers
Source: Insurance Information Institute from A.M. Best and ISO data.
97.5100.6 100.1 100.7
92.6
99.3100.8101.0
7.5%7.4%
9.6%
15.9%14.3%
12.7%
4.4%
8.9%
80
85
90
95
100
105
110
1978 1979 2003 2005 2006 2008* 2009* 2010*0%
3%
6%
9%
12%
15%
18%
Combined Ratio ROE*
Combined Ratios Must Be Lower in Today’s DepressedInvestment Environment to Generate Risk Appropriate ROEs
A combined ratio of about 100 generated ~7.5% ROE in 2009/10,
10% in 2005 and 16% in 1979

PRICING TRENDS
50
Winds of Change or Moving Sideways?

51
-5%
0%
5%
10%
15%
20%
25%
71 72 73 74 75 76 77 78 79 80 81 82 83 84 85 86 87 88 89 90 91 92 93 94 95 96 97 98 99 00 01 02 03 04 05 06 07 08 09 10E
11F
Soft Market Persisted in 2010 but Growth Returned: More in 2011?(Percent)
1975-78 1984-87 2000-03
Shaded areas denote “hard market” periodsSources: A.M. Best (historical and forecast), ISO, Insurance Information Institute.
Net Written Premiums Fell 0.7% in 2007 (First Decline Since 1943) by 2.0% in 2008, and 4.2% in 2009, the First 3-Year Decline Since 1930-33.
NWP was up 0.9% in 2010 with forecast growth of 1.4% in 2011

52
P/C Net Premiums Written: % Change, Quarter vs. Year-Prior Quarter
Sources: ISO, Insurance Information Institute.
Finally! Back-to-back quarters of net written premium growth(vs. the same quarter, prior year)
10.2
%15
.1%
16.8
%16
.7%
12.5
%10
.1%
9.7%
7.8%
7.2%
5.6%
2.9%
5.5%
-4.6
%-4
.1%
-5.8
%-1
.6%
10.3
%10
.2% 13
.4%
6.6%
-1.6
%2.
1%0.
0%-1
.9%
0.5%
-1.8
%-0
.7%
-4.4
%-3
.7%
-5.3
%-5
.2%
-1.4
%-1
.3%
1.3% 2.
3%1.
3%
-10%
-5%
0%
5%
10%
15%
20%
2002
:Q1
2002
:Q2
2002
:Q3
2002
:Q4
2003
:Q1
2003
:Q2
2003
:Q3
2003
:Q4
2004
:Q1
2004
:Q2
2004
:Q3
2004
:Q4
2005
:Q1
2005
:Q2
2005
:Q3
2005
:Q4
2006
:Q1
2006
:Q2
2006
:Q3
2006
:Q4
2007
:Q1
2007
:Q2
2007
:Q3
2007
:Q4
2008
:Q1
2008
:Q2
2008
:Q3
2008
:Q4
2009
:Q1
2009
:Q2
2009
:Q3
2009
:Q4
2010
:Q1
2010
:Q2
2010
:Q3
2010
:Q4
The long-awaited uptick:
mainly personal lines

53
Net Written Premium Growth by Segment: 2008-2011F
-0.1%
-9.4%
2.8%
-2.0%
2.5%0.3%
-3.1%
-0.1%
-12%-10%
-8%-6%-4%-2%0%2%4%
Personal Lines Commercial Lines
2008 2009E 2010P 2011F
Rate and exposure are more favorable in personal lines, whereas a prolonged soft market and sluggish recovery from the recession
weigh on commercial lines.
Personal lines growth resumed in 2010 and will continue in 2011, while commercial lines contracted
again in 2010 and but will stabilize in 2011
Sources: A.M. Best; Insurance Information Institute.

UNDERWRITING
55
Cyclicality is Driven Primarily by the Industry’s Underwriting
Cycle, Not the Economy
56
P/C Insurance Industry Combined Ratio, 2001–2010*
* Excludes Mortgage & Financial Guaranty insurers in 2008, 2009 and 2010. Including M&FG, 2008=105.1, 2009=100.7, 2010=102.4 Sources: A.M. Best, ISO.
95.7
99.3100.8101.0
92.6
100.898.4
100.1
107.5
115.8
90
100
110
120
2001 2002 2003 2004 2005 2006 2007 2008 2009 2010
Best Combined Ratio Since 1949 (87.6)
As Recently as 2001, Insurers Paid Out
Nearly $1.16 for Every $1 in Earned Premiums
Relatively Low CAT Losses, Reserve Releases
Cyclical Deterioration
Heavy Use of Reinsurance Lowered Net
Losses
Relatively Low CAT Losses, Reserve Releases
Avg. CAT Losses,
More Reserve Releases

57
Calendar Year Combined Ratios by Segment: 2008-2011F
Sources: A.M. Best . Insurance Information Institute.
102.4
98.9100
106
99.5
108
103.8104.5
9092949698
100102104106108110
Personal Lines Commercial Lines
2008 2009 2010P 2011F
Overall deterioration in 2011 underwriting performance is due to expected return to normal catastrophe activity along with deteriorating underwriting
performance related to the prolonged commercial soft market
Personal lines combined ratio is expected to remain stable in 2010 while commercial lines and reinsurance deteriorate

60
2.3
-2.1
-8.3
-2.6-6.6
-9.9 -9.8
-4.1
1
11.7
23.2
13.79.9
7.3
-6.7-9.5
-14.6-16 -15
-5
-$20
-$15
-$10
-$5
$0
$5
$10
$15
$20
$25
$3092 93 94 95 96 97 98 99 00 01 02 03 04 05 06 07 08 09
10E
11E
Prio
r Yr.
Res
erve
Rel
ease
($B
)
-6
-4
-2
0
2
4
6
8 Impact on C
ombined R
atio (Points)
Prior Yr. ReserveDevelopment ($B)
Impact onCombined Ratio
P/C Reserve Development, 1992–2011E
Reserve Releases Are Remained Strong in 2010 But Should Begin to Taper Off in 2011
Note: 2005 reserve development excludes a $6 billion loss portfolio transfer between American Re and Munich Re. Including this transaction, total prior year adverse development in 2005 was $7 billion. The data from 2000 and subsequent years excludes development from financial guaranty and mortgage insurance. Sources: Barclay’s Capital; A.M. Best.
Prior year reserve releases totaled
$8.8 billion in the first half of 2010, up from $7.1 billion in
the first half of 2009

INVESTMENTS: THE NEW REALITY
61
Investment Performance is a Key Driver of Profitability
Does It Influence Underwriting or Cyclicality?
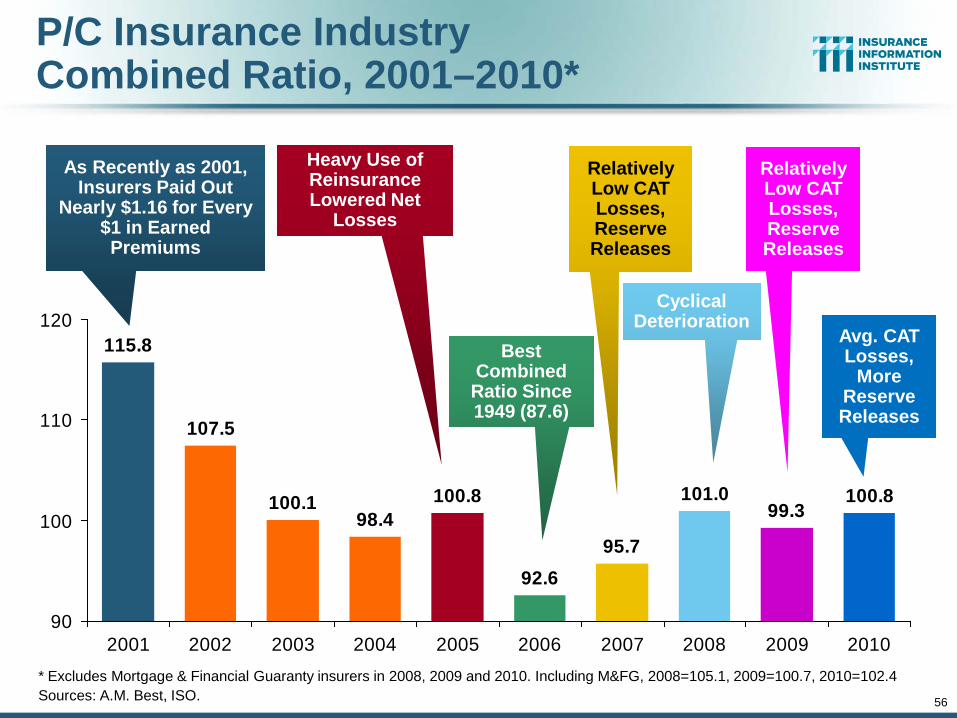
Property/Casualty Insurance Industry Investment Gain: 1994–20101
$35.4
$42.8$47.2
$52.3
$44.4
$36.0
$45.3$48.9
$59.4$55.7
$64.0
$31.7
$39.2
$52.9$58.0
$51.9$56.9
$0
$10
$20
$30
$40
$50
$60
$70
94 95 96 97 98 99 00 01 02 03 04 05* 06 07 08 09 10
Investment Gains Recovered Significantly in 2010 Due to Realized Investment Gains; The Financial Crisis Caused Investment Gains to
Fall by 50% in 20081 Investment gains consist primarily of interest, stock dividends and realized capital gains and losses.* 2005 figure includes special one-time dividend of $3.2B.Sources: ISO; Insurance Information Institute.
($ Billions)
Investment gains in 2010 were the best
since 2007

Financial Strength & Underwriting
67
Cyclical Pattern is P-C Impairment History is Directly Tied to
Underwriting, Reserving & Pricing

P/C Insurer Impairments, 1969–20108
1512
711 9
349
13 1219
916 14 13
3649
3134
50 4855
60 5841
2916
1231
18 1949 50
4735
1814 15 16 18
11
5
0
10
20
30
40
50
60
70
69 70 71 72 73 74 75 76 77 78 79 80 81 82 83 84 85 86 87 88 89 90 91 92 93 94 95 96 97 98 99 00 01 02 03 04 05 06 07 08 09 10
Source: A.M. Best Special Report “1969-2010 Impairment Review,” June 21, 2010; Insurance Information Institute.
The Number of Impairments Varies Significantly Over the P/C Insurance Cycle, With Peaks Occurring Well into Hard Markets
8 of the 18 in 2009 were small Florida carriers. Total also
includes a few title insurers.

69
P/C Insurer Impairment Frequency vs. Combined Ratio, 1969-2010
90
95
100
105
110
115
12069 70 71 72 73 74 75 76 77 78 79 80 81 82 83 84 85 86 87 88 89 90 91 92 93 94 95 96 97 98 99 00 01 02 03 04 05 06 07 08 09 10
Com
bine
d R
atio
0.0
0.2
0.4
0.6
0.8
1.0
1.2
1.4
1.6
1.8
2.0
Impairm
ent Rate
Combined Ratio after Div P/C Impairment Frequency
Source: A.M. Best; Insurance Information Institute
2010 impairment rate was 0.35%, down from 0.65% in 2009 and near the record low of 0.17% in 2007; Rate is still less than
one-half the 0.81% average since 1969
Impairment Rates Are Highly Correlated With Underwriting Performance and Reached Record Lows in 2007

70
Reasons for US P/C Insurer Impairments, 1969–2010
3.6%4.0%
8.6%
7.3%
7.8%
7.1%
7.8% 13.6%
40.3%
Source: A.M. Best: 1969-2010 Impairment Review, Special Report, April 2011.
Historically, Deficient Loss Reserves and Inadequate Pricing AreBy Far the Leading Cause of P-C Insurer Impairments.
Investment and Catastrophe Losses Play a Much Smaller Role
Deficient Loss Reserves/Inadequate Pricing
Reinsurance Failure
Rapid GrowthAlleged Fraud
Catastrophe Losses
Affiliate Impairment
Investment Problems (Overstatement of Assets)
Misc.
Sig. Change in Business

71
Top 10 Lines of Business for US P/C Impaired Insurers, 2000–2010
2.0%4.4%
4.8%
6.5%
6.9%
7.7%
8.1%
10.9%
22.2%
26.6%
Source: A.M. Best: 1969-2010 Impairment Review, Special Report, April 2011.
Workers Comp and Pvt. Passenger Auto Account for Nearly Half of the Premium Volume of Impaired Insurers Over the Past Decade
Workers Comp
Financial Guaranty
Pvt. Passenger Auto
Homeowners
Commercial Multiperil
Commercial Auto Liability
Other Liability
Med Mal
SuretyTitle

CAPITAL MANAGEMENT & LEVERAGE
83
Excess Capital is a Major Obstacle to a Market Turn;
Capital Management Decisions Will Impact Market Direction

85
Policyholder Surplus, 2006:Q4–2010:Q4
Sources: ISO, A.M .Best.
($ Billions)
$487.1$496.6
$512.8$521.8
$478.5
$455.6
$437.1
$463.0
$490.8
$511.5
$540.7$530.5
$544.8$556.9
$505.0$515.6$517.9
$420
$440
$460
$480
$500
$520
$540
$560
06:Q4 07:Q1 07:Q2 07:Q3 07:Q4 08:Q1 08:Q2 08:Q3 08:Q4 09:Q1 09:Q2 09:Q3 09:Q4 10:Q1 10:Q2 10:Q3 10:Q4
2007:Q3Previous Surplus Peak
Quarterly Surplus Changes Since 2007:Q3 Peak
09:Q1: -$84.7B (-16.2%)09:Q2: -$58.8B (-11.2%)09:Q3: -$31.0B (-5.9%)09:Q4: -$10.3B (-2.0%)
10:Q1: +$18.9B (+3.6%)10:Q2: +$8.7B (+1.7%)10:Q3: +$23.0B (+4.4%)10:Q4: +$35.1B (+6.7%)
Surplus set a new record in 2010:Q4*
*Includes $22.5B of paid-in capital from a holding company parent for one insurer’s investment in a non-insurance business in early 2010.
The Industry now has $1 of surplus for every $0.76 of
NPW—the strongest claims-paying status in its history.

90
2.1
1.9
2.7
2.5
2.3
1.8
1.7
1.7
1.9
1.9
1.9
1.9
1.7
1.6
1.6
1.4
1.4
1.3
1.3
1.1
1.1
0.9
1.13
0.94
0.86
0.84
1.29
1.17
1.07
0.99
0.840.
91
0.760.
950.
82
1.6
2.0
2.52.5
1.8
2.1
0.0
0.5
1.0
1.5
2.0
2.5
3.0
70 72 74 76 78 80 82 84 86 88 90 92 94 96 98 0 02 04 06 08 10*
The Premium-to-Surplus Ratio in 2010 Implies that P/C Insurers Held $1 in Surplus Against Each $0.76 Written in Premiums. In 1974, Each $1 of
Surplus Backed $2.70 in Premium.*2010 data are as of 12/31/10.Sources: Insurance Information Institute calculations from A.M. Best data.
Ratio of Net Premiums Writtento Policyholder Surplus, 1970-2010*
The premium-to-surplus ratio (a measure of leverage) hit a record low at just 0.76:1 in 2010. It has decreased as PHS grows
more quickly than NPW, with the effect of holding down profitability.
Record High P-S Ratio was 2.7:1
in 1974
Record Low P-S Ratio was 2.7:1
in 2010*

Inflation
100
Is it a Threat to Claim Cost Severities
101
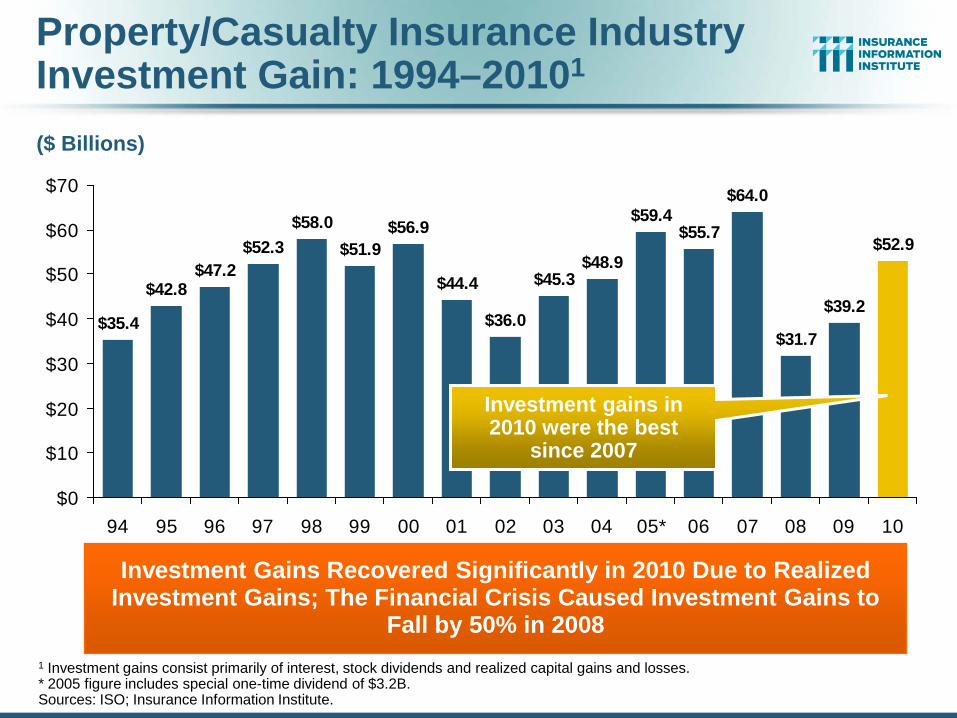
Annual Inflation Rates, (CPI-U, %),1990–2014F
2.8 2.6
1.51.9
3.3 3.4
1.3
2.5 2.3
3.0
3.8
2.8
3.8
-0.4
1.6
2.72.1 2.1 2.2
2.92.4
3.23.0
5.14.9
-1.0
0.0
1.0
2.0
3.0
4.0
5.0
6.0
90 91 92 93 94 95 96 97 98 99 00 01 02 03 04 05 06 07 08 09 10 11F 12F 13F 14F
Sources: US Bureau of Labor Statistics; Blue Chip Economic Indicators, 3/11 and 4/11 (forecasts).
The slack in the U.S. economy suggests that inflation should not heat upbefore 2012, but other forces (commodity prices, inflation in countries from which we import, etc.), plus U.S. debt burden, remain longer-run concerns
Annual Inflation Rates (%)
Inflation peaked at 5.6% in August 2008 on high energy and commodity crisis. The recession and the collapse of the
commodity bubble reduced inflationary pressures in 2009/10
Higher energy, commodity and food prices are pushing up inflation in 2011, but not longer turn
inflationary expectations.

P/C Insurance Claim Cost Drivers Grow Faster than even the Medical CPI Suggests
Source: Bureau of Labor Statistics; Insurance Information Institute.
1.6%1.0%
3.4%
8.8%
6.1%
3.3%
4.3%
3.1%
0%
3%
6%
9%
Overall CPI "Core" CPI Medical CPI InpatientHospitalServices
OutpatientHospitalServices
Physicians'Services
PrescriptionDrugs
Medical CareCommodities
Price Changes in 2010
Healthcare costs are a major liability, med pay, and PIP claim cost driver. They are likely to grow faster than the CPI for the next few years, at least
102
Excludes Food and
Energy

Financial Services Reform
103
Insurers Not as Impacted as Banks, But Dodd-Frank
Implementation Has Been a Concern for Insurers

104
Financial Services Reform:What does it mean for insurers?
Systemic Risk and Resolution Authority Creates the Financial Stability Oversight Council and the Office of Financial Research
Regulator representative is MO Insurance Commissioner Huff
No industry representative has been appointed yet
Imposes heightened federal regulation on large bank holding companies and “systemically risky” nonbank financial companies, including insurers
Concern some insurers may be labeled as systemically risky based on size alone
Federal Insurance Office (FIO) Establishes the FIO (while maintaining state regulation of insurance) within the
Department of Treasury, headed by a Director appointed by the Secretary of Treasury
FIO will have authority to monitor the insurance industry, identify regulatory gaps that could contribute to systemic crisis
IL Insurance Director Michael McGraith will become first FIO Director
CONCERN: FIO morphs into quasi/shadow or actual regulator
The Dodd Frank Wall Street Reform and Consumer Protection Act
Source: Insurance Information Institute (I.I.I.) updates and research; The Financial Services Roundtable; Adapted from summary by Dewey & LeBoeuf LLP

Source: James Madison Institute, February 2008.
ME
NH
MA
CT
PA
WVVA
NC
LATX
OK
NE
ND
MN
MI
IL
IA
ID
WA
OR
AZ
HI
NJRI C
DE
AL
VT
NY
MD
SC
GA
TN
AL
FL
MS
ARNM
KYMOKS
SD WI
INOH
MT
CA
NV
UT
WY
CO
AK
= A= B= C= D= F= NG
Source: Heartland Institute, May 2010
A- A-
A-
B-
B-
B-
B-
B-
B-B-
B-B-
B-
B-
B-
B-
B- C-
C-
C-
C -
C-
D-D-
A
A
A
A
B+
B+
B+
B
B
B
B
B
B
C+
C+
C
D+
D+D+D
NGNG
D F
F
2010 Property and Casualty InsuranceReport Card
Not Graded: District of ColumbiaMississippiLouisiana

Economic Issues for the Next 3-5 Years
106
P/C Insurance Industry Growth in the Wake of the “Great Recession”

107
US Real GDP Growth*
* Estimates/Forecasts from Blue Chip Economic Indicators.Source: US Department of Commerce, Blue Economic Indicators 4/11; Insurance Information Institute.
2.7%
0.9%
3.2%
2.3% 2.
9%-0
.7%
0.6%
-4.0
%-6
.8% -4
.9%
-0.7
%1.
6%5.
0%3.
7%1.
7% 2.6% 3.1%
1.8% 3.
2%3.
3%3.
4%3.
1%3.
2%3.
2%3.
3%4.1%
1.1% 1.
8% 2.5% 3.
6%3.
1%
-8%
-6%
-4%
-2%
0%
2%
4%
6%
20
00
20
01
20
02
20
03
20
04
20
05
20
06
07:1
Q
07:2
Q
07:3
Q07
:4Q
08:1
Q
08:2
Q
08:3
Q
08:4
Q
09:1
Q
09:2
Q
09:3
Q
09:4
Q
10:1
Q
10:2
Q10
:3Q
10:4
Q
11:1
Q
11:2
Q
11:3
Q
11:4
Q
12:1
Q
12:2
Q
12:3
Q
12:4
Q
Demand for Insurance Continues To Be Impacted by Sluggish Economic Conditions, but the Benefits of Even Slow Growth Will Compound and
Gradually Benefit the Economy Broadly
Real GDP Growth (%)
Recession began in Dec. 2007. Economic toll of credit
crunch, housing slump, labor market contraction has
been severe but modest recovery is underway
The Q4:2008 decline was the steepest since the Q1:1982 drop of 6.8%
2011 got off to a sluggish start, but growth is expected
to accelerate in the remainder of the year. This is a major
positive for insurance demand and exposure growth.

110
Direct Premiums Written: All P/C Lines Percent Change by State, 2005-2010
44.8
25.4
19.8
17.3
16.6
14.2
13.9
12.4
12.3
11.9
9.1
8.1
8.1
7.1
6.8
5.4
5.2
4.7
3.8
3.7
3.1
3.0
1.5
1.2
1.1
05
1015202530354045
ND SD LA WY
OK
WV
KS IA TX MT
NE
DE
MS
NM SC DC UT AR
NC ID WA AL WI
AK
TN
Pece
nt c
hang
e (%
)
Sources: SNL Financial LC.; Insurance Information Institute.
Top 25 StatesNorth Dakota is the growth
juggernaut of the P/C insurance industry—too bad nobody lives there…
111
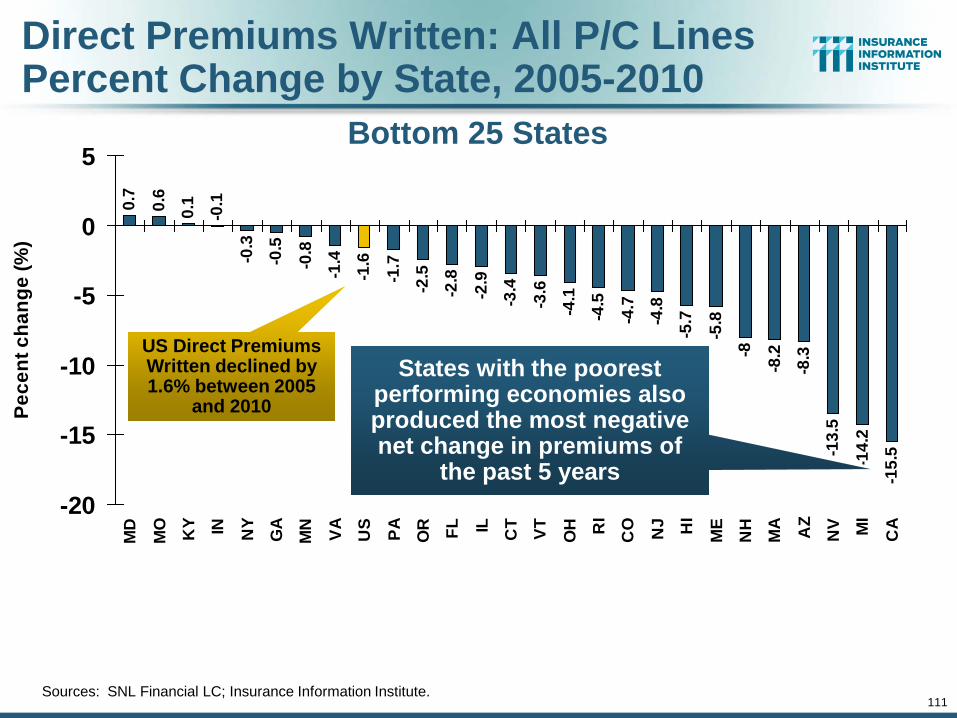
0.7
0.6
0.1
-0.1
-0.3
-0.5
-0.8
-1.4
-1.6
-1.7
-2.5
-2.8
-2.9
-3.4
-3.6
-4.1
-4.5
-4.7
-4.8
-5.7
-5.8
-8
-8.2
-8.3
-13.
5
-14.
2
-15.
5
-20
-15
-10
-5
0
5M
D
MO KY IN NY
GA
MN VA US PA OR FL IL CT VT OH RI
CO NJ HI
ME
NH
MA AZ
NV MI
CA
Pece
nt c
hang
e (%
)
Sources: SNL Financial LC; Insurance Information Institute.
Bottom 25 States
States with the poorest performing economies also produced the most negative net change in premiums of
the past 5 years
Direct Premiums Written: All P/C Lines Percent Change by State, 2005-2010
US Direct Premiums Written declined by 1.6% between 2005
and 2010

118
11 Industries for the Next 10 Years: Insurance Solutions Needed
Shipping (Rail, Marine, Trucking)
Health Sciences
Health Care
Energy (Traditional)
Alternative Energy
Agriculture
Natural Resources
Environmental
Technology (incl. Biotechnology)
Light Manufacturing
Export-Oriented Industries
Many industries are
poised for growth, but
many insurers do not write in
these economic segments
129
Catastrophic Loss –Catastrophe Losses Trends Are
Trending Adversely

130
$8.3
$7.4
$2.6 $1
0.1
$8.3
$4.6
$26.
5
$5.9 $1
2.9 $2
7.5
$61.
9
$9.2
$6.7
$27.
1
$10.
6
$13.
6
$1.6
$100
.0
$7.5
$2.7
$4.7
$22.
9
$5.5 $1
6.9
$0
$20
$40
$60
$80
$100
$120
89 90 91 92 93 94 95 96 97 98 99 00 01 02 03 04 05 06 07 08 09 10 11*20??
US Insured Catastrophe Losses
*First quarter 2011.Note: 2001 figure includes $20.3B for 9/11 losses reported through 12/31/01. Includes only business and personal property claims, business interruption and auto claims. Non-prop/BI losses = $12.2B.Sources: Property Claims Service/ISO; Munich Re; Insurance Information Institute.
2010 CAT Losses Were Close to “Average” Figures Do Not Include an Estimate of Deepwater Horizon Loss
$100 Billion CAT Year is Coming Eventually
2010 CAT Losses Were
About Average
($ Billions)
2000s: A Decade of Disaster2000s: $193B (up 117%)
1990s: $89BTornado losses
could total $2B+ in
2011

132
Combined Ratio Points Associated with Catastrophe Losses: 1960 – 2010E
Notes: Private carrier losses only. Excludes loss adjustment expenses and reinsurance reinstatement premiums. Figures are adjusted for losses ultimately paid by foreign insurers and reinsurers.Source: ISO; Insurance Information Institute estimate for 2010.
0.4 1.
20.
4 0.8 1.
30.
30.
4 0.7 1.
51.
00.
40.
4 0.7
1.8
1.1
0.6 1.
4 2.0
1.3 2.
00.
50.
5 0.7
3.0
1.2
2.1
8.8
2.3
5.9
3.3
2.8
1.0
3.6
2.9
1.6
5.4
1.6
3.3
3.3
8.1
2.7
1.6
5.0
2.6 3.
33.6
0.9
0.1
1.1
1.1
0.8
0123456789
10
1960
1962
1964
1966
1968
1970
1972
1974
1976
1978
1980
1982
1984
1986
1988
1990
1992
1994
1996
1998
2000
2002
2004
2006
2008
2010
E
The Catastrophe Loss Component of Private Insurer Losses Has Increased Sharply in Recent Decades
Avg. CAT Loss Component of theCombined Ratio
by Decade
1960s: 1.04 1970s: 0.85 1980s: 1.31 1990s: 3.39 2000s: 3.52
Combined Ratio Points

Num
ber
Geophysical (earthquake, tsunami, volcanic activity)
Climatological (temperature extremes, drought, wildfire)
Meteorological (storm)
Hydrological (flood, mass movement)
Natural Disasters in the United States, 1980 – 2010Number of Events (Annual Totals 1980 – 2010)
Source: MR NatCatSERVICE 133
There were a record 247 natural disaster events in
the US in 2010

U.S. Thunderstorm Loss Trends, 1980 – 2010 (Annual Totals)
Source: Property Claims Service, MR NatCatSERVICE 134
Thunderstorm losses in 2010 totaled $9.5 billion, the
3rd highest ever
Average thunderstorm losses have now quintupled since
the early 1980s
Hurricanes get all the headlines, but thunderstorms are
consistent producers of large scale loss

Source: Property Claims Service, MR NatCatSERVICE
U.S. Winter Storm Loss Trends, 1980 – 2010 (Annual Totals)
135
Insured winter storm losses in 2010 are one of the top five in US history, totaling
$2.6 billion in 2010

136
Inflation Adjusted US Catastrophe Losses by Cause of Loss, 1990–20091
0.5%
2.4%3.3%5.2%
7.0%
7.4%
29.0%
45.2%
1. Catastrophes are defined as events causing direct insured losses to property of $25 million or more in 2009 dollars.2. Excludes snow.3. Does not include NFIP flood losses4. Includes wildland fires5. Includes civil disorders, water damage, utility disruptions and non-property losses such as those covered by workers compensation.Source: ISO’s Property Claim Services Unit.
Hurricanes & Tropical Storms, $152.4
Fires (4), $8.0
Tornadoes (2), $97.8
Winter Storms, $25.0
Terrorism, $23.6
Geological Events, $17.6
Wind/Hail/Flood (3), $11.1
Other (5), $0.5
Wind losses are by far cause the most catastrophe losses,
even if hurricanes/TS are excluded.

137
Distribution of US Insured CAT Losses: TX, FL, LA vs. US, 1980-2010*($ Billions)
* Adjusted to 2010 dollars.Source: PCS division of ISO; Insurance Information Institute.
Louisiana Accounted for 10% of All US Insured CAT Losses from 1980-2010: $36.7B out of $237.5B
$237.52 , 62%
$62.62 , 17%
$42.30 , 11% $36.68 ,
10%
Florida
Texas
Louisiana
Rest of US
138
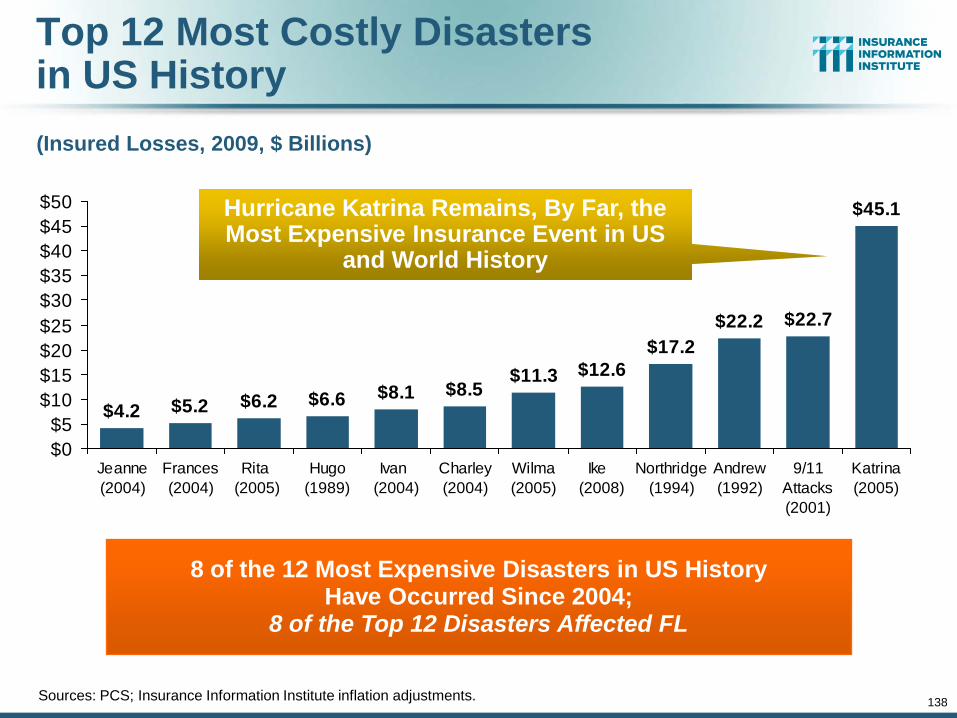
Top 12 Most Costly Disastersin US History(Insured Losses, 2009, $ Billions)
Sources: PCS; Insurance Information Institute inflation adjustments.
$11.3 $12.6$17.2
$22.2 $22.7
$45.1
$8.5$8.1$6.6$6.2$5.2$4.2
$0$5
$10$15$20$25$30$35$40$45$50
Jeanne(2004)
Frances(2004)
Rita (2005)
Hugo(1989)
Ivan (2004)
Charley(2004)
Wilma(2005)
Ike (2008)
Northridge(1994)
Andrew(1992)
9/11Attacks(2001)
Katrina(2005)
8 of the 12 Most Expensive Disasters in US History Have Occurred Since 2004;
8 of the Top 12 Disasters Affected FL
Hurricane Katrina Remains, By Far, the Most Expensive Insurance Event in US
and World History

139
Total Value of Insured Coastal Exposure
(2007, $ Billions)
Source: AIR Worldwide
$224.4$191.9
$158.8$146.9$132.8
$92.5$85.6$60.6$55.7$51.8$54.1
$14.9
$479.9$635.5
$772.8$895.1
$2,378.9$2,458.6
$0 $500 $1,000 $1,500 $2,000 $2,500 $3,000
FloridaNew York
TexasMassachusetts
New JerseyConnecticut
LouisianaS. Carolina
VirginiaMaine
North CarolinaAlabamaGeorgia
DelawareNew Hampshire
MississippiRhode Island
Maryland
In 2007, Florida Still Ranked as the #1 Most Exposed State to Hurricane Loss, with
$2.459 Trillion Exposure, but Texas is very exposed too, and ranked #3 with $895B
in insured coastal exposure
The Insured Value of All Coastal Property Was $8.9 Trillion in 2007, Up 24% from $7.2 Trillion in 2004

141
Outlook for the 2011 Atlantic Hurricane Season
Above Average Activity, More Landfalls Expected

Outlook for 2011 Hurricane Season: 75% More Active Than Average
Average* 2005(Katrina Year)
2011F
Named Storms 9.6 28 16Named Storm Days 49.1 115.5 80Hurricanes 5.9 14 9Hurricane Days 24.5 47.5 35Intense Hurricanes 2.3 7 5
Intense Hurricane Days 5.0 7 10
Accumulated Cyclone Energy 96.1 NA 160
Net Tropical Cyclone Activity 100% 275% 175%
*Average over the period 1950-2000.Source: Dr. Philip Klotzbach and Dr. William Gray, Colorado State University, April 6, 2011.

Probability of Major Hurricane Landfall (CAT 3, 4, 5) in 2011
Average* 2011F
Entire US Coast 52% 72%
US East Coast Including Florida Peninsula
31% 48%
Gulf Coast from FL Panhandle to Brownsville, TX
30% 47%
ALSO…Above-Average Major HurricaneLandfall Risk in Caribbean for 2011 (61% vs. 42%)
*Average over the period 1950-2000.Source: Dr. Philip Klotzbach and Dr. William Gray, Colorado State University, April 6, 2011.

www.iii.org
Thank you for your timeand your attention!
Twitter: twitter.com/bob_hartwig
Insurance Information Institute Online: