Embed Size (px)
Citation preview
Jacob Gyntelberg
Peter Hördahl
Overview: sovereign risk jolts markets
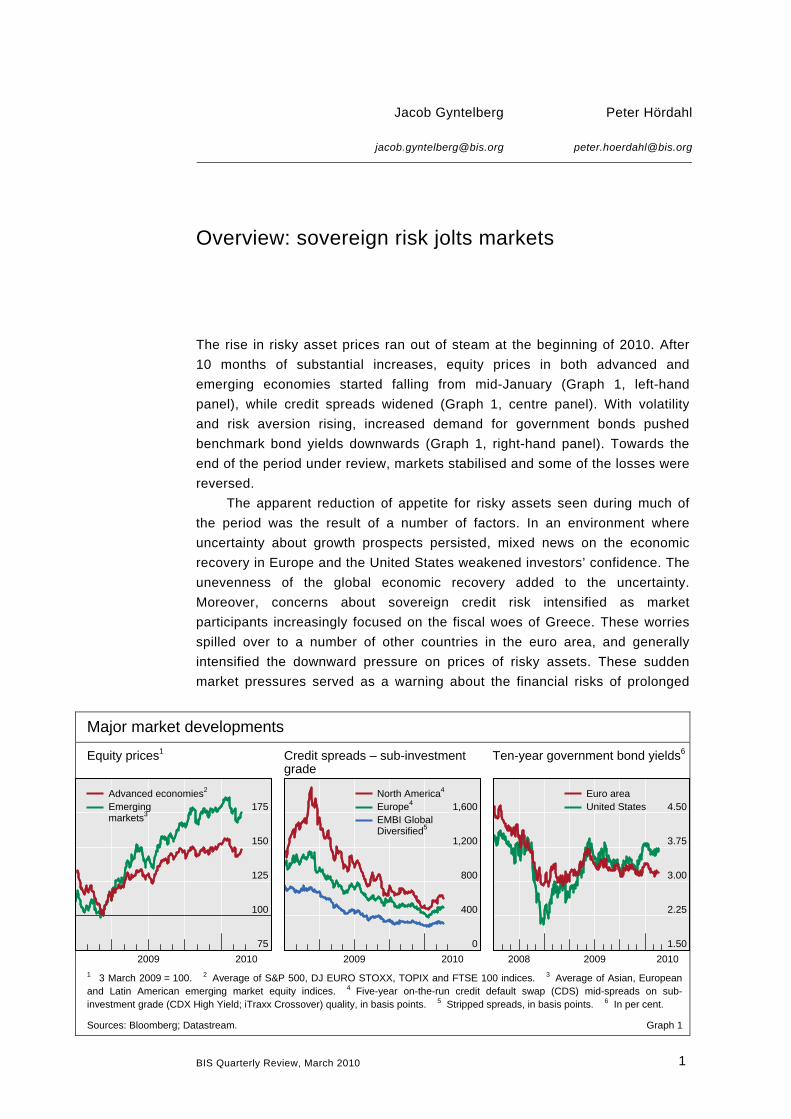
The rise in risky asset prices ran out of steam at the beginning of 2010. After
10 months of substantial increases, equity prices in both advanced and
emerging economies started falling from mid-January (Graph 1, left-hand
panel), while credit spreads widened (Graph 1, centre panel). With volatility
and risk aversion rising, increased demand for government bonds pushed
benchmark bond yields downwards (Graph 1, right-hand panel). Towards the
end of the period under review, markets stabilised and some of the losses were
reversed.
The apparent reduction of appetite for risky assets seen during much of
the period was the result of a number of factors. In an environment where
uncertainty about growth prospects persisted, mixed news on the economic
recovery in Europe and the United States weakened investors’ confidence. The
unevenness of the global economic recovery added to the uncertainty.
Moreover, concerns about sovereign credit risk intensified as market
participants increasingly focused on the fiscal woes of Greece. These worries
spilled over to a number of other countries in the euro area, and generally
intensified the downward pressure on prices of risky assets. These sudden
market pressures served as a warning about the financial risks of prolonged
Major market developments
Equity prices1 Credit spreads – sub-investment grade
Ten-year government bond yields6
0
400
800
1,200
1,600
2009 2010
North America4
Europe4
EMBI GlobalDiversified5
75
100
125
150
175
2009 2010
Advanced economies2
Emergingmarkets3
Euro areaUnited States 4.50
3.75
3.00
2.25
1.50
2008 2009 20101 3 March 2009 = 100. 2 Average of S&P 500, DJ EURO STOXX, TOPIX and FTSE 100 indices. 3 Average of Asian, European and Latin American emerging market equity indices. 4 Five-year on-the-run credit default swap (CDS) mid-spreads on sub-investment grade (CDX High Yield; iTraxx Crossover) quality, in basis points. 5 Stripped spreads, in basis points. 6 In per cent.
Sources: Bloomberg; Datastream. Graph 1
BIS Quarterly Review, March 2010 1
fiscal deficits. Against this backdrop, the euro fell significantly against other
major currencies. In addition, market interpretations of steps and future plans
to normalise very expansionary policies seemed to amplify investors’
unwillingness to take on risk. Global equity prices fell following decisions by the
Chinese authorities to raise the reserve requirement ratio for large depository
institutions. Moreover, bond yields rose and equity prices fell after the US
Federal Reserve announced an increase in the discount rate in the second half
of February.
Asset prices retreat as investors shun risk
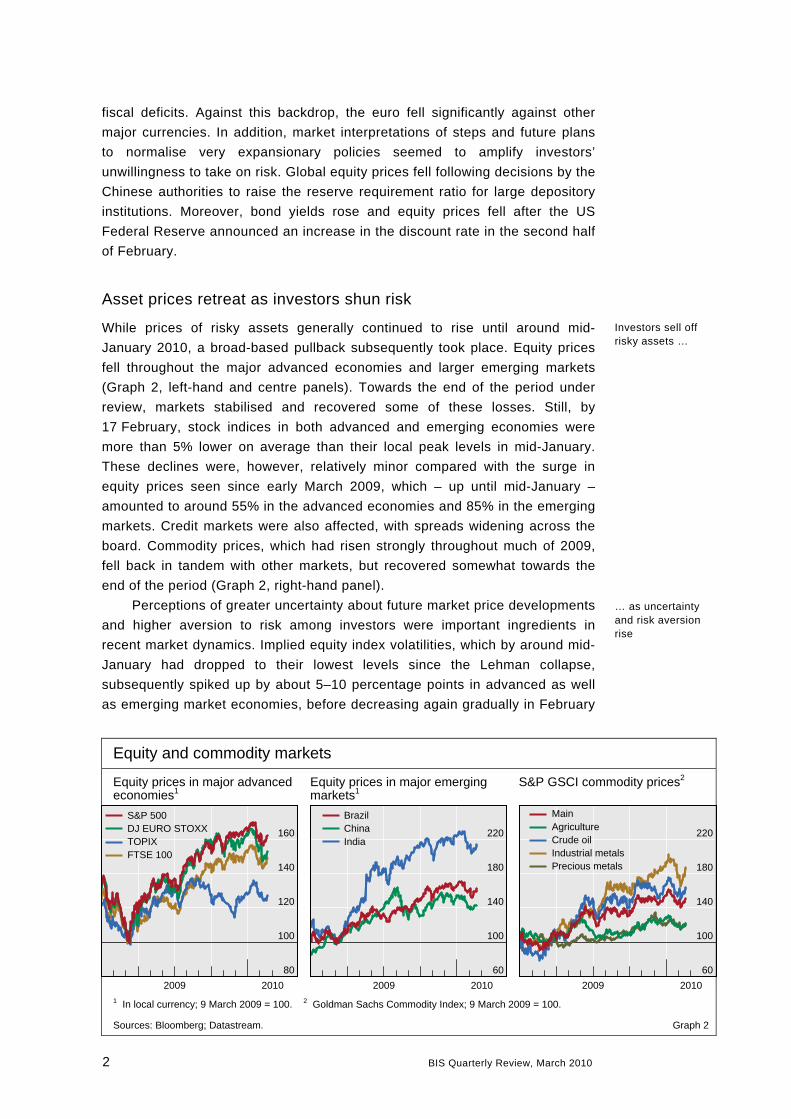
While prices of risky assets generally continued to rise until around mid-
January 2010, a broad-based pullback subsequently took place. Equity prices
fell throughout the major advanced economies and larger emerging markets
(Graph 2, left-hand and centre panels). Towards the end of the period under
review, markets stabilised and recovered some of these losses. Still, by
17 February, stock indices in both advanced and emerging economies were
more than 5% lower on average than their local peak levels in mid-January.
These declines were, however, relatively minor compared with the surge in
equity prices seen since early March 2009, which – up until mid-January –
amounted to around 55% in the advanced economies and 85% in the emerging
markets. Credit markets were also affected, with spreads widening across the
board. Commodity prices, which had risen strongly throughout much of 2009,
fell back in tandem with other markets, but recovered somewhat towards the
end of the period (Graph 2, right-hand panel).
Investors sell off risky assets …
Perceptions of greater uncertainty about future market price developments
and higher aversion to risk among investors were important ingredients in
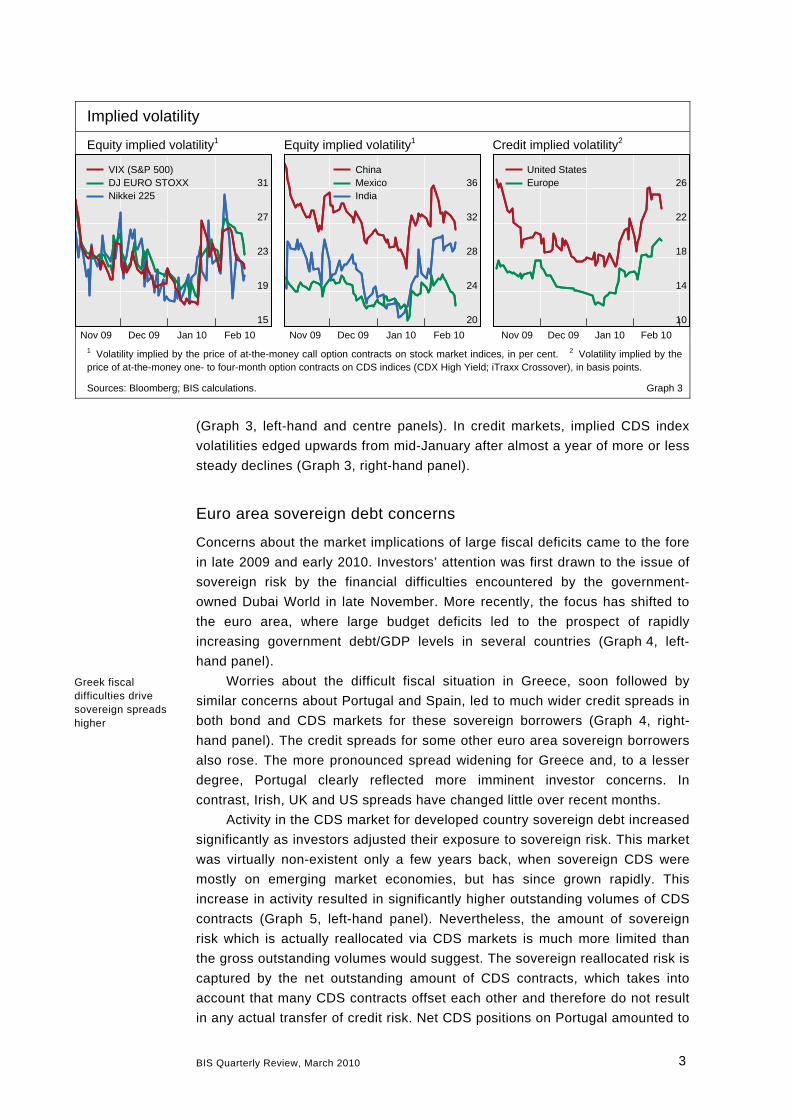
recent market dynamics. Implied equity index volatilities, which by around mid-
January had dropped to their lowest levels since the Lehman collapse,
subsequently spiked up by about 5–10 percentage points in advanced as well
as emerging market economies, before decreasing again gradually in February
Equity and commodity markets
Equity prices in major advanced economies1
Equity prices in major emerging markets1
S&P GSCI commodity prices2
60
100
140
180
220
2009 2010
BrazilChinaIndia
MainAgricultureCrude oilIndustrial metalsPrecious metals
S&P 500DJ EURO STOXXTOPIXFTSE 100
160 220
140 180
120 140
100 100
80 60
2009 2010 2009 20101 In local currency; 9 March 2009 = 100. 2 Goldman Sachs Commodity Index; 9 March 2009 = 100.
Sources: Bloomberg; Datastream. Graph 2
… as uncertainty and risk aversion rise
2 BIS Quarterly Review, March 2010
Implied volatility
Equity implied volatility1 Equity implied volatility1 Credit implied volatility2
20
24
28
32
36
Nov 09 Dec 09 Jan 10 Feb 10
ChinaMexicoIndia
(Graph 3, left-hand and centre panels). In credit markets, implied CDS index
volatilities edged upwards from mid-January after almost a year of more or less
steady declines (Graph 3, right-hand panel).
Euro area sovereign debt concerns
Concerns about the market implications of large fiscal deficits came to the fore
in late 2009 and early 2010. Investors’ attention was first drawn to the issue of
sovereign risk by the financial difficulties encountered by the government-
owned Dubai World in late November. More recently, the focus has shifted to
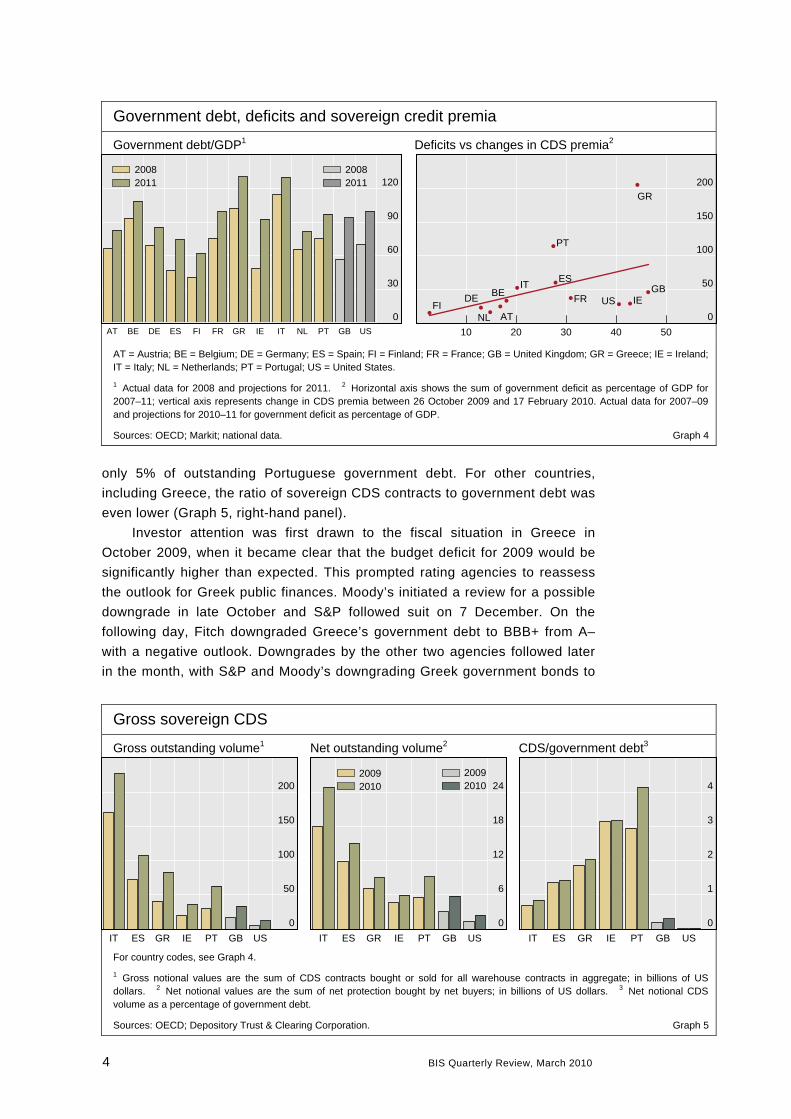
the euro area, where large budget deficits led to the prospect of rapidly
increasing government debt/GDP levels in several countries (Graph 4, left-
hand panel).
Worries about the difficult fiscal situation in Greece, soon followed by
similar concerns about Portugal and Spain, led to much wider credit spreads in
both bond and CDS markets for these sovereign borrowers (Graph 4, right-
hand panel). The credit spreads for some other euro area sovereign borrowers
also rose. The more pronounced spread widening for Greece and, to a lesser
degree, Portugal clearly reflected more imminent investor concerns. In
contrast, Irish, UK and US spreads have changed little over recent months.
Activity in the CDS market for developed country sovereign debt increased
significantly as investors adjusted their exposure to sovereign risk. This market
was virtually non-existent only a few years back, when sovereign CDS were
mostly on emerging market economies, but has since grown rapidly. This
increase in activity resulted in significantly higher outstanding volumes of CDS
contracts (Graph 5, left-hand panel). Nevertheless, the amount of sovereign
risk which is actually reallocated via CDS markets is much more limited than
the gross outstanding volumes would suggest. The sovereign reallocated risk is
captured by the net outstanding amount of CDS contracts, which takes into
account that many CDS contracts offset each other and therefore do not result
in any actual transfer of credit risk. Net CDS positions on Portugal amounted to
15
19
23
27
31
Nov 09 Dec 09 Jan 10 Feb 10
VIX (S&P 500)DJ EURO STOXXNikkei 225
United StatesEurope 26
22
18
14
10
Nov 09 Dec 09 Jan 10 Feb 101 Volatility implied by the price of at-the-money call option contracts on stock market indices, in per cent. 2 Volatility implied by the price of at-the-money one- to four-month option contracts on CDS indices (CDX High Yield; iTraxx Crossover), in basis points.
Sources: Bloomberg; BIS calculations. Graph 3
Greek fiscal difficulties drive sovereign spreads higher
Greek fiscal difficulties drive sovereign spreads higher
BIS Quarterly Review, March 2010 3
Government debt, deficits and sovereign credit premia
Government debt/GDP1 Deficits vs changes in CDS premia2
only 5% of outstanding Portuguese government debt. For other countries,
including Greece, the ratio of sovereign CDS contracts to government debt was
even lower (Graph 5, right-hand panel).
Investor attention was first drawn to the fiscal situation in Greece in
October 2009, when it became clear that the budget deficit for 2009 would be
significantly higher than expected. This prompted rating agencies to reassess
the outlook for Greek public finances. Moody’s initiated a review for a possible
downgrade in late October and S&P followed suit on 7 December. On the
following day, Fitch downgraded Greece’s government debt to BBB+ from A–
with a negative outlook. Downgrades by the other two agencies followed later
in the month, with S&P and Moody’s downgrading Greek government bonds to
0
30
60
90
120
AT BE DE ES FI FR GR IE IT NL PT GB US
20082011
20082011
AT
BEDE
ES
FIFR
GB
GR
IE
IT
NL
PT
US
200
150
100
50
0
10 20 30 40 50
AT = Austria; BE = Belgium; DE = Germany; ES = Spain; FI = Finland; FR = France; GB = United Kingdom; GR = Greece; IE = Ireland; IT = Italy; NL = Netherlands; PT = Portugal; US = United States.
1 Actual data for 2008 and projections for 2011. 2 Horizontal axis shows the sum of government deficit as percentage of GDP for 2007–11; vertical axis represents change in CDS premia between 26 October 2009 and 17 February 2010. Actual data for 2007–09 and projections for 2010–11 for government deficit as percentage of GDP.
Sources: OECD; Markit; national data. Graph 4
Gross sovereign CDS
Gross outstanding volume1 Net outstanding volume2 CDS/government debt3
0
6
12
18
24
IT ES GR IE PT GB US
20092010
20092010
200
0
1
2
3
4
150
100
50
0
IT ES GR IE PT GB US IT ES GR IE PT GB US
For country codes, see Graph 4.
1 Gross notional values are the sum of CDS contracts bought or sold for all warehouse contracts in aggregate; in billions of US dollars. 2 Net notional values are the sum of net protection bought by net buyers; in billions of US dollars. 3 Net notional CDS volume as a percentage of government debt.
Sources: OECD; Depository Trust & Clearing Corporation. Graph 5
4 BIS Quarterly Review, March 2010
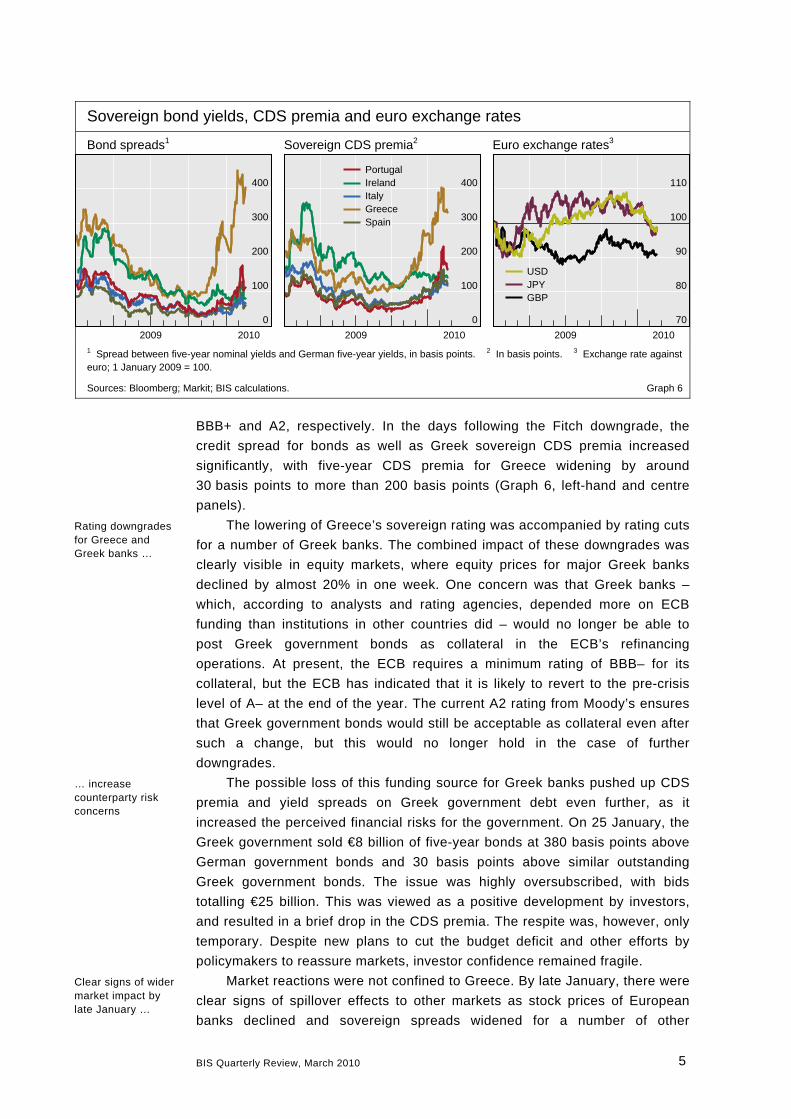
Sovereign bond yields, CDS premia and euro exchange rates
Bond spreads1 Sovereign CDS premia2 Euro exchange rates3
0
100
200
300
400
2009 2010
PortugalIrelandItalyGreeceSpain
400 110
300 100
200 90
USDJPYGBP
100 80
0 70
2009 2010 2009 20101 Spread between five-year nominal yields and German five-year yields, in basis points. 2 In basis points. 3 Exchange rate against euro; 1 January 2009 = 100.
Sources: Bloomberg; Markit; BIS calculations. Graph 6
BBB+ and A2, respectively. In the days following the Fitch downgrade, the
credit spread for bonds as well as Greek sovereign CDS premia increased
significantly, with five-year CDS premia for Greece widening by around
30 basis points to more than 200 basis points (Graph 6, left-hand and centre
panels).
The lowering of Greece’s sovereign rating was accompanied by rating cuts
for a number of Greek banks. The combined impact of these downgrades was
clearly visible in equity markets, where equity prices for major Greek banks
declined by almost 20% in one week. One concern was that Greek banks –
which, according to analysts and rating agencies, depended more on ECB
funding than institutions in other countries did – would no longer be able to
post Greek government bonds as collateral in the ECB’s refinancing
operations. At present, the ECB requires a minimum rating of BBB– for its
collateral, but the ECB has indicated that it is likely to revert to the pre-crisis
level of A– at the end of the year. The current A2 rating from Moody’s ensures
that Greek government bonds would still be acceptable as collateral even after
such a change, but this would no longer hold in the case of further
downgrades.
The possible loss of this funding source for Greek banks pushed up CDS
premia and yield spreads on Greek government debt even further, as it
increased the perceived financial risks for the government. On 25 January, the
Greek government sold €8 billion of five-year bonds at 380 basis points above
German government bonds and 30 basis points above similar outstanding
Greek government bonds. The issue was highly oversubscribed, with bids
totalling €25 billion. This was viewed as a positive development by investors,
and resulted in a brief drop in the CDS premia. The respite was, however, only
temporary. Despite new plans to cut the budget deficit and other efforts by
policymakers to reassure markets, investor confidence remained fragile.
Market reactions were not confined to Greece. By late January, there were
clear signs of spillover effects to other markets as stock prices of European
banks declined and sovereign spreads widened for a number of other
Rating downgrades of Greece and banks …
Rating downgrades for Greece and Greek banks …
… increase counterparty risk concerns
… increase counterparty risk concerns
Clear signs of wider market impact by late January …
BIS Quarterly Review, March 2010 5
European countries. Portugal and Spain were the most directly affected, but
the impact was felt more broadly. A small but unsuccessful auction of
Portuguese government debt in early February accentuated concerns. Equity
prices fell around the globe and corporate credit spreads increased, while safe
haven flows pushed down the government bond yields of several major
countries. Sovereign credit spreads on a number of other countries widened.
The sovereign CDS index for western Europe (which measures the cost of
insuring against the risk of default for a basket of western European
sovereigns) rose above 100 basis points for the first time amid increased
activity in the sovereign CDS market. The growing unease also weighed on the
euro, which by early February had declined against other major currencies to
levels not seen since early or mid-2009 (Graph 6, right-hand panel). Markets
did, however, calm down in the weeks that followed, leading to a fall in Greek,
Portuguese and Spanish credit spreads from their previous highs.
Nevertheless, uncertainty remained despite EU governments pledging
“determined and coordinated action” to ensure financial stability in the euro
area. This uncertainty was perhaps most clearly reflected in continued high
sovereign credit spreads for a number of euro area countries.
… lead to a weaker euro
Banks, sovereign risk exposures and post-crisis regulation
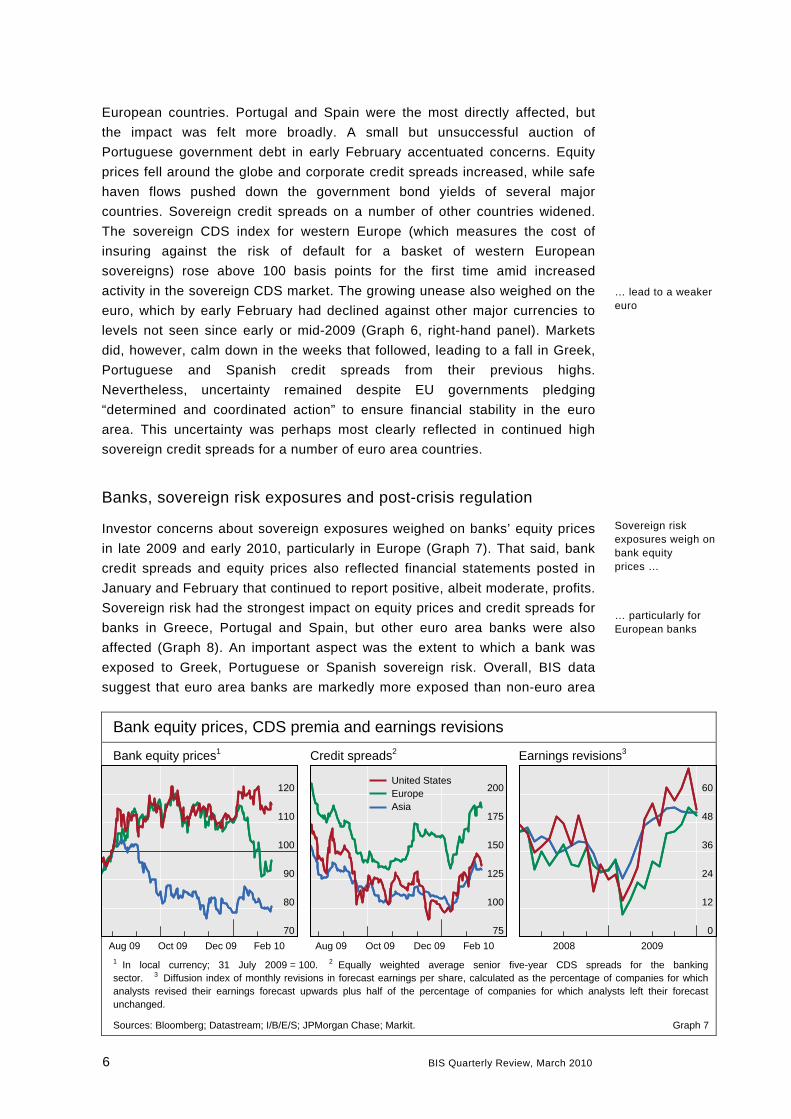
Investor concerns about sovereign exposures weighed on banks’ equity prices
in late 2009 and early 2010, particularly in Europe (Graph 7). That said, bank
credit spreads and equity prices also reflected financial statements posted in
January and February that continued to report positive, albeit moderate, profits.
Sovereign risk had the strongest impact on equity prices and credit spreads for
banks in Greece, Portugal and Spain, but other euro area banks were also
affected (Graph 8). An important aspect was the extent to which a bank was
exposed to Greek, Portuguese or Spanish sovereign risk. Overall, BIS data
suggest that euro area banks are markedly more exposed than non-euro area
Sovereign risk exposures weigh on bank equity prices …
Bank equity prices, CDS premia and earnings revisions
Bank equity prices1 Credit spreads2 Earnings revisions3
75
100
125
150
175
200
Aug 09 Oct 09 Dec 09 Feb 10
United StatesEuropeAsia
120 60
110 48
100 36
90 24
80 12
70 0
Aug 09 Oct 09 Dec 09 Feb 10 2008 2009
1 In local currency; 31 July 2009 = 100. 2 Equally weighted average senior five-year CDS spreads for the banking sector. 3 Diffusion index of monthly revisions in forecast earnings per share, calculated as the percentage of companies for which analysts revised their earnings forecast upwards plus half of the percentage of companies for which analysts left their forecast unchanged.
Sources: Bloomberg; Datastream; I/B/E/S; JPMorgan Chase; Markit. Graph 7
… particularly for European banks
6 BIS Quarterly Review, March 2010
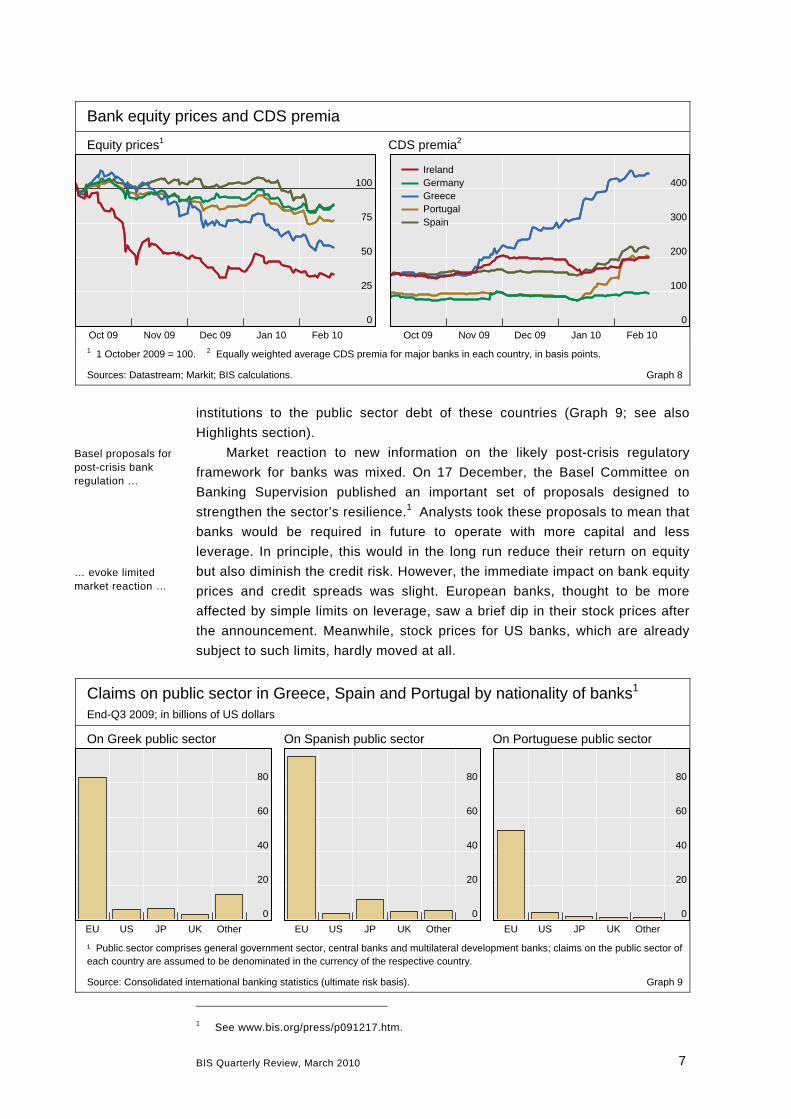
institutions to the public sector debt of these countries (Graph 9; see also
Highlights section).
Market reaction to new information on the likely post-crisis regulatory
framework for banks was mixed. On 17 December, the Basel Committee on
Banking Supervision published an important set of proposals designed to
strengthen the sector’s resilience.1 Analysts took these proposals to mean that
banks would be required in future to operate with more capital and less
leverage. In principle, this would in the long run reduce their return on equity
but also diminish the credit risk. However, the immediate impact on bank equity
prices and credit spreads was slight. European banks, thought to be more
affected by simple limits on leverage, saw a brief dip in their stock prices after
the announcement. Meanwhile, stock prices for US banks, which are already
subject to such limits, hardly moved at all.
1 See www.bis.org/press/p091217.htm.
Claims on public sector in Greece, Spain and Portugal by nationality of banks1 End-Q3 2009; in billions of US dollars
On Greek public sector On Spanish public sector On Portuguese public sector
0
20
40
60
80
EU US JP UK Other
0
20
40
60
80
EU US JP UK Other
0
20
40
60
80
EU US JP UK Other
¹ Public sector comprises general government sector, central banks and multilateral development banks; claims on the public sector of each country are assumed to be denominated in the currency of the respective country.
Source: Consolidated international banking statistics (ultimate risk basis). Graph 9
Bank equity prices and CDS premia
Equity prices1 CDS premia2
0
25
50
75
100
Oct 09 Nov 09 Dec 09 Jan 10 Feb 10
IrelandGermanyGreecePortugalSpain
400
300
200
100
0
Oct 09 Nov 09 Dec 09 Jan 10 Feb 101 1 October 2009 = 100. 2 Equally weighted average CDS premia for major banks in each country, in basis points.
Sources: Datastream; Markit; BIS calculations. Graph 8
Basel proposals for post-crisis bank regulation …
… evoke limited market reaction …
BIS Quarterly Review, March 2010 7
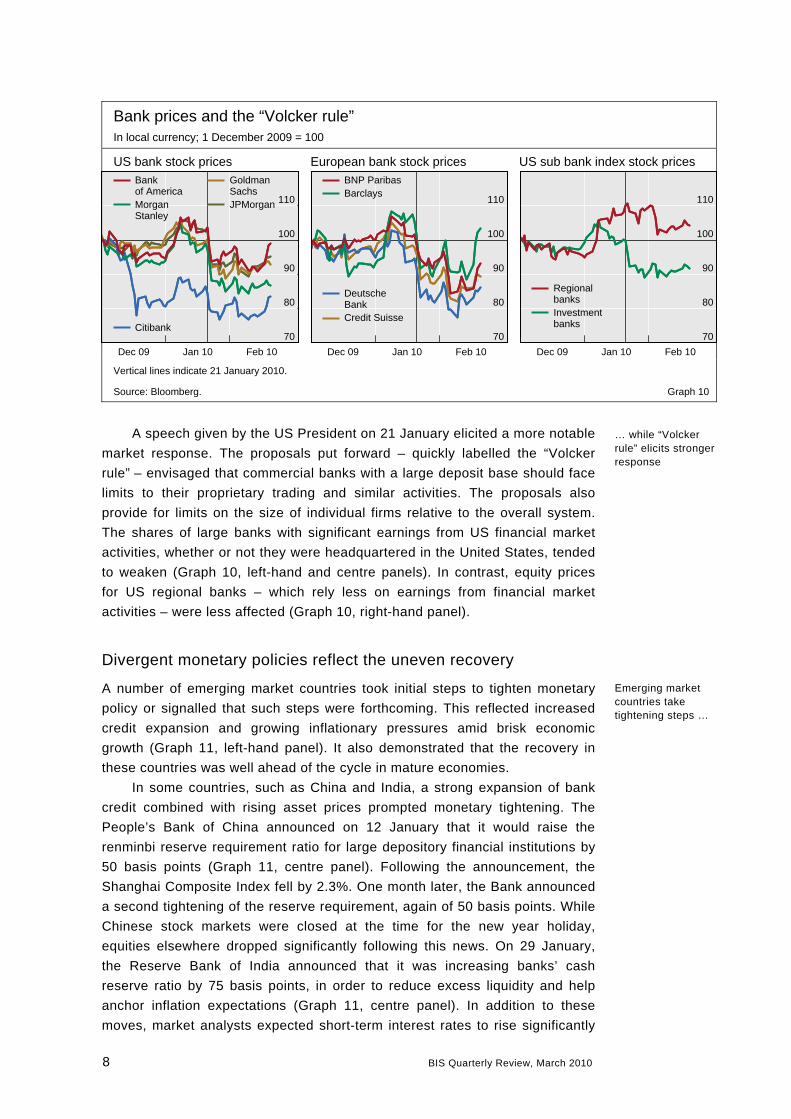
Bank prices and the “Volcker rule” In local currency; 1 December 2009 = 100
US bank stock prices European bank stock prices US sub bank index stock prices
70
80
90
100
110
Dec 09 Jan 10 Feb 10
BNP ParibasBarclays
DeutscheBankCredit Suisse
70
80
90
100
110
Dec 09 Jan 10 Feb 10
GoldmanSachsJPMorgan
Bankof AmericaMorganStanley
110
100
90
RegionalbanksInvestmentbanks
80
Citibank70
Dec 09 Jan 10 Feb 10
Vertical lines indicate 21 January 2010.
Source: Bloomberg. Graph 10
A speech given by the US President on 21 January elicited a more notable
market response. The proposals put forward – quickly labelled the “Volcker
rule” – envisaged that commercial banks with a large deposit base should face
limits to their proprietary trading and similar activities. The proposals also
provide for limits on the size of individual firms relative to the overall system.
The shares of large banks with significant earnings from US financial market
activities, whether or not they were headquartered in the United States, tended
to weaken (Graph 10, left-hand and centre panels). In contrast, equity prices
for US regional banks – which rely less on earnings from financial market
activities – were less affected (Graph 10, right-hand panel).
… while “Volcker rule” elicits stronger response
Divergent monetary policies reflect the uneven recovery
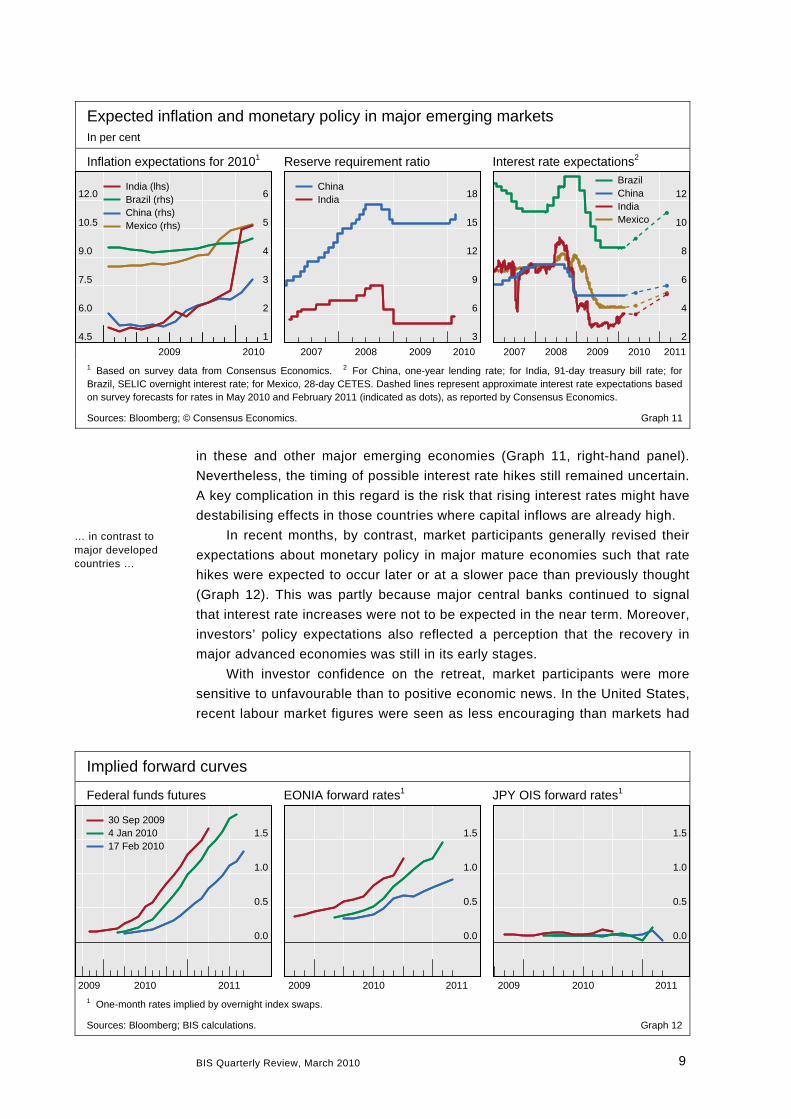
A number of emerging market countries took initial steps to tighten monetary
policy or signalled that such steps were forthcoming. This reflected increased
credit expansion and growing inflationary pressures amid brisk economic
growth (Graph 11, left-hand panel). It also demonstrated that the recovery in
these countries was well ahead of the cycle in mature economies.
Emerging market countries take tightening steps …
In some countries, such as China and India, a strong expansion of bank
credit combined with rising asset prices prompted monetary tightening. The
People’s Bank of China announced on 12 January that it would raise the
renminbi reserve requirement ratio for large depository financial institutions by
50 basis points (Graph 11, centre panel). Following the announcement, the
Shanghai Composite Index fell by 2.3%. One month later, the Bank announced
a second tightening of the reserve requirement, again of 50 basis points. While
Chinese stock markets were closed at the time for the new year holiday,
equities elsewhere dropped significantly following this news. On 29 January,
the Reserve Bank of India announced that it was increasing banks’ cash
reserve ratio by 75 basis points, in order to reduce excess liquidity and help
anchor inflation expectations (Graph 11, centre panel). In addition to these
moves, market analysts expected short-term interest rates to rise significantly
8 BIS Quarterly Review, March 2010
Expected inflation and monetary policy in major emerging markets In per cent
Inflation expectations for 20101 Reserve requirement ratio Interest rate expectations2
in these and other major emerging economies (Graph 11, right-hand panel).
Nevertheless, the timing of possible interest rate hikes still remained uncertain.
A key complication in this regard is the risk that rising interest rates might have
destabilising effects in those countries where capital inflows are already high.
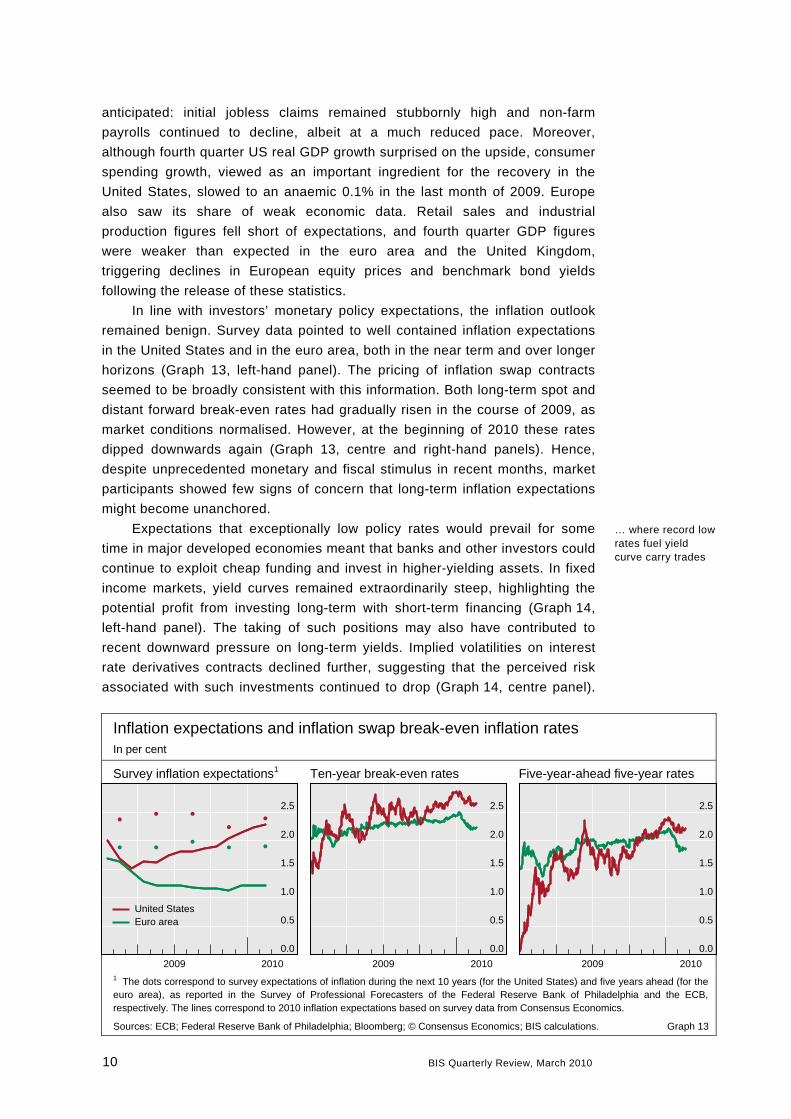
In recent months, by contrast, market participants generally revised their
expectations about monetary policy in major mature economies such that rate
hikes were expected to occur later or at a slower pace than previously thought
(Graph 12). This was partly because major central banks continued to signal
that interest rate increases were not to be expected in the near term. Moreover,
investors’ policy expectations also reflected a perception that the recovery in
major advanced economies was still in its early stages.
With investor confidence on the retreat, market participants were more
sensitive to unfavourable than to positive economic news. In the United States,
recent labour market figures were seen as less encouraging than markets had
4.5
6.0
7.5
9.0
10.5
12.0
3
6
9
12
15
18
2007 2008 2009 2010
ChinaIndia
BrazilChinaIndiaMexico
India (lhs)Brazil (rhs)China (rhs)Mexico (rhs)
1
2
3
4
5
6 12
10
2
4
6
8
2009 2010 2007 2008 2009 2010 20111 Based on survey data from Consensus Economics. 2 For China, one-year lending rate; for India, 91-day treasury bill rate; for Brazil, SELIC overnight interest rate; for Mexico, 28-day CETES. Dashed lines represent approximate interest rate expectations based on survey forecasts for rates in May 2010 and February 2011 (indicated as dots), as reported by Consensus Economics.
Sources: Bloomberg; © Consensus Economics. Graph 11
Implied forward curves
Federal funds futures EONIA forward rates1 JPY OIS forward rates1
0.0
0.5
1.0
1.5
2009 2010 2011
30 Sep 20094 Jan 201017 Feb 2010
1.5 1.5
1.0 1.0
0.5 0.5
0.0 0.0
2009 2010 2011 2009 2010 20111 One-month rates implied by overnight index swaps.
Sources: Bloomberg; BIS calculations. Graph 12
… in contrast to major developed countries …
BIS Quarterly Review, March 2010 9
anticipated: initial jobless claims remained stubbornly high and non-farm
payrolls continued to decline, albeit at a much reduced pace. Moreover,
although fourth quarter US real GDP growth surprised on the upside, consumer
spending growth, viewed as an important ingredient for the recovery in the
United States, slowed to an anaemic 0.1% in the last month of 2009. Europe
also saw its share of weak economic data. Retail sales and industrial
production figures fell short of expectations, and fourth quarter GDP figures
were weaker than expected in the euro area and the United Kingdom,
triggering declines in European equity prices and benchmark bond yields
following the release of these statistics.
In line with investors’ monetary policy expectations, the inflation outlook
remained benign. Survey data pointed to well contained inflation expectations
in the United States and in the euro area, both in the near term and over longer
horizons (Graph 13, left-hand panel). The pricing of inflation swap contracts
seemed to be broadly consistent with this information. Both long-term spot and
distant forward break-even rates had gradually risen in the course of 2009, as
market conditions normalised. However, at the beginning of 2010 these rates
dipped downwards again (Graph 13, centre and right-hand panels). Hence,
despite unprecedented monetary and fiscal stimulus in recent months, market
participants showed few signs of concern that long-term inflation expectations
might become unanchored.
Expectations that exceptionally low policy rates would prevail for some
time in major developed economies meant that banks and other investors could
continue to exploit cheap funding and invest in higher-yielding assets. In fixed
income markets, yield curves remained extraordinarily steep, highlighting the
potential profit from investing long-term with short-term financing (Graph 14,
left-hand panel). The taking of such positions may also have contributed to
recent downward pressure on long-term yields. Implied volatilities on interest
rate derivatives contracts declined further, suggesting that the perceived risk
associated with such investments continued to drop (Graph 14, centre panel).
Inflation expectations and inflation swap break-even inflation rates In per cent
Survey inflation expectations1 Ten-year break-even rates Five-year-ahead five-year rates
0.0
0.5
1.0
1.5
2.0
2.5
2009 2010
2.5 2.5
2.0 2.0
1.5 1.5
1.0 1.0
United StatesEuro area 0.5 0.5
0.0 0.0
2009 2010 2009 20101 The dots correspond to survey expectations of inflation during the next 10 years (for the United States) and five years ahead (for the euro area), as reported in the Survey of Professional Forecasters of the Federal Reserve Bank of Philadelphia and the ECB, respectively. The lines correspond to 2010 inflation expectations based on survey data from Consensus Economics.
Sources: ECB; Federal Reserve Bank of Philadelphia; Bloomberg; © Consensus Economics; BIS calculations. Graph 13
… where record low rates fuel yield curve carry trades
10 BIS Quarterly Review, March 2010
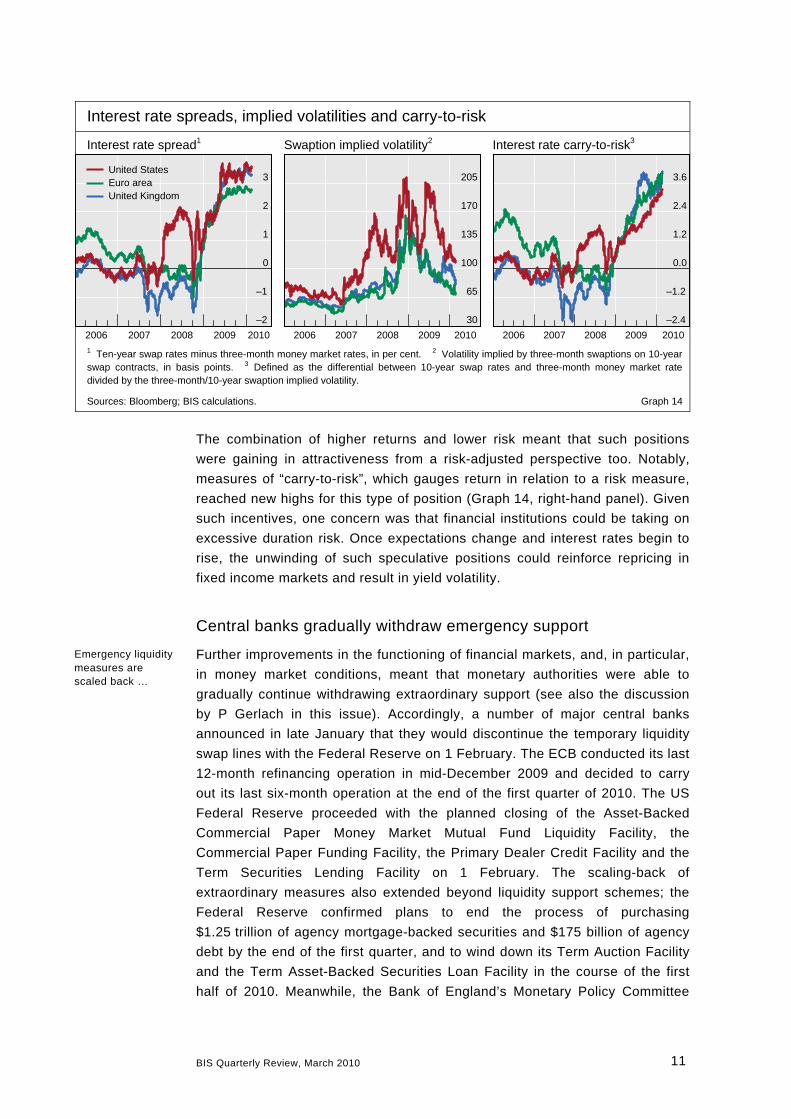
Interest rate spreads, implied volatilities and carry-to-risk
Interest rate spread1 Swaption implied volatility2 Interest rate carry-to-risk3
30
65
100
135
170
205
2006 2007 2008 2009 2010
United StatesEuro areaUnited Kingdom
0
1
2
3 3.6
2.4
1.2
0.0
–2
–1 –1.2
–2.4
2006 2007 2008 2009 2010 2006 2007 2008 2009 20101 Ten-year swap rates minus three-month money market rates, in per cent. 2 Volatility implied by three-month swaptions on 10-year swap contracts, in basis points. 3 Defined as the differential between 10-year swap rates and three-month money market rate divided by the three-month/10-year swaption implied volatility.
Sources: Bloomberg; BIS calculations. Graph 14
The combination of higher returns and lower risk meant that such positions
were gaining in attractiveness from a risk-adjusted perspective too. Notably,
measures of “carry-to-risk”, which gauges return in relation to a risk measure,
reached new highs for this type of position (Graph 14, right-hand panel). Given
such incentives, one concern was that financial institutions could be taking on
excessive duration risk. Once expectations change and interest rates begin to
rise, the unwinding of such speculative positions could reinforce repricing in
fixed income markets and result in yield volatility.
Central banks gradually withdraw emergency support
Further improvements in the functioning of financial markets, and, in particular,
in money market conditions, meant that monetary authorities were able to
gradually continue withdrawing extraordinary support (see also the discussion
by P Gerlach in this issue). Accordingly, a number of major central banks
announced in late January that they would discontinue the temporary liquidity
swap lines with the Federal Reserve on 1 February. The ECB conducted its last
12-month refinancing operation in mid-December 2009 and decided to carry
out its last six-month operation at the end of the first quarter of 2010. The US
Federal Reserve proceeded with the planned closing of the Asset-Backed
Commercial Paper Money Market Mutual Fund Liquidity Facility, the
Commercial Paper Funding Facility, the Primary Dealer Credit Facility and the
Term Securities Lending Facility on 1 February. The scaling-back of
extraordinary measures also extended beyond liquidity support schemes; the
Federal Reserve confirmed plans to end the process of purchasing
$1.25 trillion of agency mortgage-backed securities and $175 billion of agency
debt by the end of the first quarter, and to wind down its Term Auction Facility
and the Term Asset-Backed Securities Loan Facility in the course of the first
half of 2010. Meanwhile, the Bank of England’s Monetary Policy Committee
Emergency liquidity measures are scaled back …
BIS Quarterly Review, March 2010 11
12 BIS Quarterly Review, March 2010
decided in early February not to increase the Bank’s programme of asset
purchases beyond the total of £200 billion that had already been completed.
This scaling-back of supportive monetary measures was widely
anticipated, in line with earlier announcements or signalling by central banks.
As a result, it had no significant impact on asset prices. However, investors did
react to new statements about possible future policy action. Specifically, UK gilt
yields fell sharply on 10 February – by as much as 10 basis points at the short
end of the maturity spectrum – following remarks by the Governor of the Bank
of England that it was “far too soon” to conclude that no further central bank
purchases will be needed in sterling bond markets. On the same day, Federal
Reserve Chairman Bernanke mentioned in testimony to Congress that an
increase in the spread between the discount rate and the target federal funds
rate might be considered “before long”, and he discussed the sequence of
steps that the Federal Reserve might follow to exit from its very
accommodative policy stance. Following these statements, US Treasury yields
rose by some 5 basis points across the curve. Despite this signalling, markets
were surprised by the Federal Reserve’s 18 February announcement of a
25 basis point increase in the discount rate, which was intended as a step
towards further normalising its lending facilities. After the announcement, bond
yields rose and equity prices fell.
… and largely anticipated by markets …
… although other actions surprise investors