Embed Size (px)
Citation preview

Ownership Concentration and Strategic Supply Reduction∗
Ulrich Doraszelski Katja Seim Michael Sinkinson Peichun Wang†
December 30, 2016
Abstract
We explore the sensitivity of the U.S. government’s ongoing incentive auction to multi-license
ownership by broadcasters. We document significant broadcast TV license purchases by private
equity firms prior to the auction and perform a prospective analysis of the effect of ownership
concentration on auction outcomes. We find that multi-license holders are able to raise spectrum
acquisition costs by 22% by strategically withholding some of their licenses to increase the price
for their remaining licenses. A proposed remedy reduces the distortion in payouts to license
holders by up to 80%, but lower participation could greatly increase payouts and exacerbate
strategic effects.
∗We thank Gabbie Nirenburg and Elizabeth Oppong for research assistance, Gavin Burris and Hugh MacMullan for
technical assistance, and the Penn Wharton Public Policy Initiative and Dean’s Research Funds for financial support.
We have benefited from conversations with participants at the Searle Center Conference on Antitrust Economics, as
well as discussions with Eric Budish, Rob Gertner, Ali Hortacsu, Evan Kwerel, Jonathan Levy, Greg Lewis, Rakesh
Vohra, Glen Weyl, and others. Katja Seim’s participation in the project predated her appointment as the Chief
Economist at the Federal Communications Commission. The opinions expressed in the paper are accordingly those
of the authors and do not represent the positions of the Federal Communications Commission or the U.S. Government.†Wharton School, University of Pennsylvania, Steinberg Hall-Dietrich Hall, 3620 Locust Walk, Philadelphia,
PA 19104, USA. E-mail: [email protected]; [email protected]; [email protected];
1

1 Introduction
In 2010, the U.S. Federal Communications Commission (FCC) proposed to acquire spectrum from
broadcast TV license holders and sell it to wireless carriers to be repurposed into mobile broadband
spectrum. The so-called incentive auction combines a reverse auction for broadcast TV licenses
with a forward auction for selling the thus-acquired spectrum to wireless carriers. Between the two
auctions lies a repacking process where remaining broadcasters are reassigned channels to clear a
contiguous nationwide block of spectrum for wireless use. Prior to the currently ongoing auction,
estimates put the expected revenue from the forward auction at up to $45 billion, in excess of the
payouts to broadcast TV license holders in the reverse auction, with the balance going towards the
costs of repacking spectrum into a contiguous block and to the government.1,2 In this paper, we
study the potential for strategic behavior in the reverse auction.
We document that following the announcement of the incentive auction, a number of private eq-
uity firms acquired broadcast TV licenses in several local media markets, often purchasing multiple
licenses in the same market. Newspaper articles and industry reports claimed that these purchases
were undertaken with the goal of trying to “flip” broadcast TV licenses for profit in the reverse
auction.3 Politicians also raised concerns about speculation.4 Yet, reselling broadcast TV licenses
does not necessarily entail efficiency losses.
We argue that in addition to speculative motivations behind reselling broadcast TV licenses,
there is the potential for strategic bidding. In a prospective analysis of the incentive auction, we
show that owners of multiple licenses have an incentive to withhold some of their licenses from the
auction, thereby driving up the closing price for the remaining licenses they own and affecting a
large transfer of wealth from the government - and ultimately taxpayers - to themselves. Apart from
affecting closing prices, this behavior causes efficiency losses as the set of broadcast TV licenses
surrendered in the auction is not the socially optimal set and may reduce the total amount of
spectrum that will be repurposed.
Repurposing spectrum from broadcast TV to mobile broadband usage is no doubt an extremely
valuable - and complex - undertaking. The incentive auction was very carefully designed and has
many desirable properties such as strategy proofness (Milgrom et al., 2012; Milgrom and Segal,
2014). If broadcast TV licenses were separately owned, then it is optimal for an owner to bid a
1See Expanding Opportunities for Broadcasters Coalition (EOBC) Notice of Oral Ex Parte Filing with the FCC,June 13, 2014, available at http://www.tvtechnology.com/portals/0/EOBC0614.pdf, accessed on November 15, 2015.
2The Congressional Budget Office (CBO) estimates the net proceeds from the incentive auction to fall be-tween $10 billion and $40 billion, with an expected value of $25 billion, the middle of that range. “ProceedsFrom Auctions Held by the Federal Communications Commission”, CBO Report 50128, April 21, 2015, availableat https://www.cbo.gov/publication/50128, accessed on November 15, 2015.
3See “NRJ Wins Bidding For WSAH New York,” TVNewsCheck, November 29, 2011, “Small TV Stations GetHot,” The Wall Street Journal, September 3, 2012, “Speculators Betting Big on FCC TV Spectrum Auctions,”Current.org, February 26, 2013, “TV Spectrum Speculation Nears $345 Million,” TVNewsCheck, March 1, 2013,“Broadcast Incentive Spectrum Auctions: Gauging Supply and Demand,” SNL Kagan Broadcast Investor, November20, 2013, and “TV Station Spectrum Deals Expand Into Major Network Affiliates as Players Stake Out PositionsPre-Auction,” SNL Kagan Broadcast Investor, December 4, 2013.
4See “Rep. LoBiondo Seeks FCC Info On Possible Spectrum Speculation,” Broadcasting & Cable, February 12,2014.
2

station’s value as a going concern in exchange for relinquishing the broadcast license; we refer to
this as naive bidding. Our paper points out the sensitivity of the incentive auction to multi-license
ownership. In particular, the rules of the auction leave room for strategic supply reduction for firms
that own multiple broadcast TV licenses. Such firms can withhold a subset of their licenses from the
auction to raise the closing price for the remaining licenses. This behavior is purely rent-seeking,
as these firms are attempting to increase their share of existing wealth without creating any new
wealth.
We use a simple model to illustrate how strategic supply reduction works in the context of the
reverse auction and under what circumstances it is a profitable strategy for multi-license owners.
Our model implies that certain types of broadcast licenses are more suitable for a supply reduction
strategy and that certain types of local media markets are more vulnerable to this type of behavior.
We begin by showing that the ownership patterns in the data are broadly consistent with the
implications of the model.
In a second step, we analyze the reverse auction in more detail and quantify increased payouts
and efficiency losses due to strategic supply reduction. To do so, we undertake a large scale
valuation exercise to estimate reservation values for all currently held UHF broadcast TV licenses.
We combine various data sources to estimate a TV station’s cash flows and from them infer its value
as a going concern. This allows us to simulate the auction outcome for all participating license
holders, accounting for the repacking process at a regional level, and then to assess the impact of
potential strategic bidding.
We compare the outcome under naive bidding with the outcome when we account for the own-
ership patterns in the data and allow multi-license owners to engage in strategic supply reduction.
Our approach solves for all equilibria of a simplified version of the reverse auction that accounts
for the repacking process at the regional - though not at the national - level. We then show that
across markets, strategic supply reduction has a large impact on closing prices and payouts to
broadcast TV license holders and causes sizable efficiency losses. For a nationwide clearing target
of repurposing 126 MHz of spectrum, the initial starting point of the incentive auction when it com-
menced on March 29, 2016, strategic behavior by multi-license owners increases payouts by 22%.
The payout increases, as well as payouts from the auction in general, are concentrated in a small
number of markets, however, with nearly 99% of payout increases occurring in markets with two
or more owners of multiple licenses. This reflects two factors. First, there is significant variation
in station cashflows and thus willingness-to-sell due to stations’ differential success in attracting
advertising revenue. This results in steep increases in closing prices as more licenses are acquired.
Second, the FCC’s need to clear spectrum is particularly pronounced in large markets where the
expected demand by wireless carriers means that even high-value TV licenses can successfully sell
into the auction and that strategically withholding a low-value station can drive up closing prices
significantly. We illustrate these issues in a case study of the Philadelphia, PA, market.
Netting out the firms’ reservation values from their auction payouts, the strategic supply reduc-
tion strategy translates into surplus increases of several billion dollars across broadcast TV license
3

owners. This reflects that a multi-license owner who withholds a license from the auction creates
a positive externality for other market participants by raising the closing price in the market. The
multi-license owner, by selling his remaining licenses in the market, captures some of this exter-
nality, but not all of it: while in aggregate, payouts increase by 22%, they increase by 25% for
multi-license owners and 19% for single-license owners.
We propose a partial remedy that imposes a constraint on the ordering of bids of multi-license
owners. The rule change reduces the effect of strategic behavior by roughly eighty percent. This
result is directly policy relevant as it suggests ways of mitigating the impact of strategic supply
reduction. Our hope is that this proves useful in designing future auctions in the U.S. and other
countries as they strive to alleviate the “spectrum crunch” resulting from the rapid growth in data
usage by smartphones in recent years.
We also illustrate how a firm may extend a supply reduction strategy by leveraging technological
constraints on the repacking of spectrum across local media markets. While a complete analysis of
multi-market strategies at the national level is computationally infeasible, we highlight a particular
case of a firm owning licenses in adjacent markets and the potential effect of reducing supply in
one market on the closing price in another targeted market. In this case, we find a six-fold increase
in the impact of strategic bidding.
Finally, we quantify the effect of potential low participation by non-commercial (public) and
religious broadcasters. A reduction in participation among such licenses leads to a significant
number of auction failures, and large increases in payouts when auctions complete. We suggest
that modifying must-carry regulations could be a useful tool in increasing auction participation.
There is a rich literature on strategic bidding in multi-unit auctions. Substantial theoretical
work (Wilson, 1979; Back and Zender, 1993; Menezes, 1996; Engelbrecht-Wiggans and Kahn, 1998;
Jun and Wolfstetter, 2004; Riedel and Wolfstetter, 2006; Ausubel et al., 2014) and experimental
evidence (List and Lucking-Reiley, 2000; Kagel and Levin, 2001; Engelmann and Grimm, 2009;
Goeree, Offerman and Sloof, 2013) point to the potential for strategic demand reduction. In addi-
tion, case studies of past spectrum auctions have documented strategic demand reduction (Weber,
1997; Grimm, Riedel and Wolfstetter, 2003). Our paper is most closely related to the empirical
literature examining market power in wholesale electricity markets (Wolfram, 1998; Borenstein,
Bushnell and Wolak, 2002; Hortacsu and Puller, 2008), where firms bid supply schedules and have
strategic incentives to alter their bids and raise closing prices for inframarginal units. In contrast
to electricity markets, however, in our setting the acquisition of significant market power is easier:
a small number of licenses outstanding in a given local market, combined with the discreteness of
broadcast spectrum units (6 MHz), implies that a single additional license can confer a significant
increase in market power in the spectrum market to its owner.
Significantly, our paper departs from much of the auction literature in that it does not invert the
first-order conditions to recover valuations from observed bids. Instead, we use auxiliary data to
directly estimate valuations. One reason is the lack of bidding data because, by congressional order,
the FCC is unable to release details of the auction proceedings until two years after completion of
4

the incentive auction.
However, even if data were available, extending the standard first-order conditions approach
to our case of multi-unit auctions with personalized prices is less than straightforward and may
entail challenges to identification as discussed by Cantillon and Pesendorfer (2007) in the context
of heterogeneous multi-unit first-price auctions. More importantly, the descending clock nature of
the ongoing incentive auction exacerbates identification concerns. While the value of a broadcast
license can be inferred from the price at which it drops out of the auction, payout price provides at
most an upper bound on the value of a broadcast license that instead sells into the auction. Further,
observing that a broadcast license is withheld from the auction is uninformative about its value if a
multi-license owner chooses to withhold it from the auction for strategic reasons. This is in contrast
to work on wholesale electricity markets where complete supply schedules are observed. We also do
not adopt the moment inequalities approach in Fox and Bajari (2013) that - rather than assuming
full optimality of bids - only assumes that the configuration of licenses that a multi-license owner
sells into the auction dominates any alternative configuration due to the typically small number
of alternatives in our setting given that licenses are not perfect substitutes for one another. This
approach also only identifies relative valuations but not the levels of valuations that are required
for the analysis of welfare effects of ownership concentration.
Our work is also related to the extensive literature on collusion in auctions (Asker 2010, Conley
and Decarolis 2016, Kawai and Nakabayashi 2015, and Porter and Zona 1993, among others),
including spectrum auctions (Cramton and Schwartz, 2002). A multi-license owner in our setting
internalizes the profit implications of all licenses he controls as is the case with colluding, but
otherwise independent, single-license owners. Finally, we contribute to the literature on distortions
induced by incentive schemes and regulation in various settings such as employee compensation
(Oyer, 1998), environmental regulation (Fowlie, 2009; Bushnell and Wolfram, 2012), health care
(Duggan and Scott Morton, 2006), and tax avoidance (Goolsbee, 2000).
The remainder of this paper is organized as follows: Section 2 describes the setting and sets
out a simple model of strategic supply reduction, Section 3 presents data and descriptive evidence,
Sections 4 and 5 describe the main analysis and results, and Section 6 concludes.
2 The FCC incentive auction
The rapid growth in data usage by smartphones has significantly increased the demand for mobile
broadband spectrum in recent years.5 At the same time, some previously allotted spectrum is no
longer used intensively. In particular, each of approximately 8,500 currently operating TV stations
5According to FCC Chairman Tom Wheeler, “America has gone mobile. Most Americans would have a hard timeimagining life without their smartphones, and tens of millions are similarly in love with their tablets. The problem isthat spectrum, the lifeblood of all wireless technologies, is finite. That wasn’t a problem before the mobile web, whenmost consumers were mostly watching videos or surfing the web at home. If we don’t free up more airwaves for mobilebroadband, demand for spectrum will eventually exceed the supply. If you’ve ever been frustrated by websites thatloaded slowly or videos that wouldn’t download to your phone, you have a sense what that world could look like.” See“Channel Sharing: A New Opportunity for Broadcasters,” Official FCC Blog, available at https://www.fcc.gov/news-events/blog/2014/02/11/channel-sharing-new-opportunity-broadcasters, accessed on November 15, 2015.
5

owns a license for a 6 MHz block of spectrum covering a particular geographical area for over-the-
air transmission of programming. Yet, as of 2010 only about 10% of U.S. TV households used
broadcast TV, with a rapidly declining trend.6
In its 2010 National Broadband Plan, the FCC under then-chairman Julius Genachowski pro-
posed, and was authorized by Congress in 2012, to conduct an incentive auction to reallocate
spectrum from TV stations located in the higher frequency UHF band to wireless providers. The
incentive auction consists of a reverse auction in which TV stations submit bids to relinquish spec-
trum rights in exchange for payment and a forward auction in which wireless operators bid for the
newly available spectrum.
While the FCC has conducted spectrum auctions in the past, the incentive auction is the first
time an auction to sell spectrum is combined with an auction to purchase spectrum from existing
licensees.7 Designing this auction is complicated not only by incumbent claims on spectrum, but
also by technological constraints for mobile data and broadcast TV uses. Originally projected for
early 2014, the incentive auction was repeatedly postponed due to legal and technological challenges,
first to the middle of 2015 and then again to its ultimate starting date of March 29, 2016.8
The format of the ongoing auction was made public in May 2014.9 The forward auction to sell
spectrum to wireless carriers uses an ascending-clock format similar to previous spectrum auctions.
The reverse auction uses a descending-clock format in which the price offered to a TV station for
its spectrum usage rights declines with each successive round of bidding. A TV station faces a
price for its broadcast license that is personalized to it (see Section 2.2 for details). If a TV station
chooses to participate in the reverse auction, it has several options for relinquishing its spectrum
usage rights: going off the air, moving channels from a higher frequency band (UHF channels 14-36
and 38-51 or high VHF channels 7-13) to a lower frequency band (respectively, VHF channels 2-13
or low VHF channels 2-6) to free up more desirable parts of the spectrum, or sharing a channel
with another TV station.
Between the reverse and forward auctions, a repacking process takes place in which the remain-
ing TV stations are consolidated in the lower end of the UHF band to create a contiguous block of
6“Connecting America: The National Broadband Plan”, FCC, 2010, Chapter 5, p. 89.7“Let’s start with the concept of an incentive auction. While it has never been tried before, its power lies in how
it addresses the root of all issues: economics. If it is possible to marry the economics of demand with the economicsof current spectrum holders, it should be possible to allow market forces to determine the highest and best use ofspectrum. In mid-2015 we will run the first ever incentive auction. Television broadcasters will have the opportunityto bid in a reverse auction to relinquish some or all of their spectrum rights, and wireless providers will bid in aforward auction on nationwide, ’repacked’ spectrum suitable for two-way wireless broadband services.” See FCCChairman Tom Wheeler’s prepared remarks at the “Wireless Spectrum And The Future Of Technology Innovation”Forum, available at https://apps.fcc.gov/edocs public/attachmatch/DOC-326215A1.pdf, accessed on November 15,2015.
8See “The Path to a Successful Incentive Auction,” Official FCC Blog, December 6, 2013, available athttps://www.fcc.gov/news-events/blog/2013/12/06/path-successful-incentive-auction-0, accessed on November 15,2015, and “F.C.C. Delays Auction of TV Airways for Mobile,” The New York Times, October 24, 2014.
9See https://apps.fcc.gov/edocs public/attachmatch/FCC-14-50A1.pdf, accessed on November 15, 2015. An ex-cellent and detailed explanation of the mechanism is available from the FCC and greatly informs our analysis. SeeAppendix D of FCC Public Notice in matter FCC-14-191 “Comment Sought On Competitive Bidding ProceduresFor Broadcast Incentive Auction 1000, Including Auctions 1001 And 1002,” released December 17, 2014.
6

spectrum in the higher end of the UHF band for wireless use.10 The process is visually similar to
defragmenting a hard drive on a personal computer. However, it is far more complex because many
pairs of TV stations cannot be located on adjacent channels, even across markets, without causing
unacceptable levels of interference. As a result, the repacking process ties together all local media
markets. In practice, the reverse auction is therefore at the national level. A further consequence
of interference is that even though each TV station owns a license for a 6 MHz block of spectrum
covering a particular geographical area, far more than 6n MHz of spectrum are likely required to
accommodate n remaining TV stations in a market.
The auction rules integrate the reverse and forward auctions in a series of stages. For the first
stage, initial commitments from stations and repacking constraints determined an initial maximum
nationwide clearing target of 126 MHz. Each stage of the incentive auction begins with multiple
rounds of the reverse auction, followed by multiple rounds of the forward auction. The reverse
auction determines the cost of acquiring a set of licenses that allow the repacking process to meet
the clearing target. There are many different feasible sets of licenses that could be surrendered
to meet a particular clearing target given the complex interference patterns between stations; the
reverse auction is intended to identify the low-cost set.
After the reverse auction determines the cost of acquiring an amount of spectrum, the forward
auction determines the willingness-to-pay of wireless operators for this amount of spectrum. If
willingness-to-sell in the reverse auction outpaces willingness-to-pay in the forward auction, the
clearing target is decreased, so that a smaller set of lower value TV stations have to be acquired.
The process repeats until a “final stage rule” is satisfied that ensures that proceeds in the forward
auction (more than) cover payouts in the reverse auction and the cost of repacking spectrum.11
At the time of this writing, the FCC has completed three stages of the auction. The reverse
auction phase of the auction’s first stage concluded on June 29, 2016. The total payout required
to meet the initial 126 MHz clearing target amounted to $86.4 billion, which was not met in the
forward auction in attempting to sell the freed spectrum to wireless providers; it yielded a payout
of only $23.1 billion. Since this first stage, the clearing target has been lowered twice and the FCC
opened the fourth stage for a clearing target of 84 MHz on December 13, 2016.
We next provide additional details on the reverse auction and illustrate the potential for strategic
supply reduction.
2.1 The reverse auction
The reverse auction uses a descending-clock format. A TV station that participates in the reverse
auction is offered a personalized price at which it can either remain in the auction, indicating that
10Congress’ authorization of the incentive auction required the FCC to make all reasonable efforts to preserve thecoverage area and population served by TV stations involved in the repacking.
11Specifically, the final stage rule requires that proceeds in the forward auction are at least $1.25 per MHz perpopulation for the largest 40 wireless service market areas and not only cover payouts in the reverse auction but alsothe FCC’s administrative costs, the reimbursements of channel relocation costs incurred by TV stations, and thefunding of the First Responder Network Authority’s public safety operations.
7

it is prepared to accept this price to cease operating and surrender its broadcast license, or leave the
auction, indicating that the price is too low and that it prefers to continue operating and potentially
be repacked to a new UHF channel. In the subsequent analysis, we abstract from the options to
relocate from a higher to a lower frequency band or to share a channel with another station. We
discuss this simplification further in Section 4.2.
Broadcast licenses are assigned by the FCC to a local media market, which is the designated
market area (DMA) as defined by Nielsen Media Research based on the reach and viewing patterns
of TV stations. A DMA is defined as a group of counties such that the home market TV stations
hold a dominance of total hours viewed. There are 210 DMAs in the U.S. that vary in size from
New York, NY, with over 7 million TV households, to Glendive, MT, with 4,230 TV households.
Appendix Table 12 lists the top ten DMAs based on their 2012 rank.
Across these 210 markets, a total of 2,166 broadcast licenses are eligible for the auction.12 They
can be classified by type of service into UHF and VHF stations, by type of use into commercial and
non-commercial stations, and by power output into full-power (primary and satellite13) and low-
power (class-A) stations. Appendix Table 13 summarizes the auction-eligible broadcast licenses.
Formally, in round τ of the reverse auction, a currently active TV station j is offered the price
pjτ = ϕjPτ ,
where Pτ is the base clock price and ϕj is the station’s broadcast volume. The base clock price Pτ
begins at $900 and decreases with each successive round of bidding. The broadcast volume
ϕj = M√CoveragePopj · InterferenceCntj (1)
is a known function of the station’s population reach CoveragePopj and the interference count
InterferenceCntj , defined as the number of TV stations that station j can potentially interfere
with in the repacking process. Finally, M = 17.253 is a scaling factor that is chosen to set the
maximum ϕj across the U.S. to one million.
The broadcast volume is an important concept: the FCC uses it to personalize the base clock
price to a TV station based on its value as a broadcast business (as proxied by population reach)
and the difficulty of repacking the station in case it does not surrender its license (as proxied by
the interference count). The broadcast volume thus reflects that the FCC is willing to incentivize a
TV station to surrender its license if the alternative of having to repack the station is particularly
challenging. Importantly, the broadcast volume for all TV stations is known in advance to all
auction participants.
The design of the reverse auction is partly dictated by the FCC’s obligation to guarantee a 6
12See http://www.fcc.gov/learn, accessed on November 15, 2015. The FCC excludes approximately 10,000 low-power, translator, multi-cast signal, and cable stations from the reverse auction. In 2016, the FCC updated thelist of auction-eligible stations, see http://transition.fcc.gov/Daily_Releases/Daily_Business/2015/db0609/
DA-15-679A2.pdf, accessed on February 10, 2016. In this paper, we work with the earlier list of 2,166 auction-eligiblestations as it underlies the FCC’s repacking simulations (see Section 3.1).
13A satellite station is a relay station that repeats the broadcast signal of its parent primary station.
8

MHz block of spectrum to any TV station that chooses to remain on air rather than surrender its
license. At the initial base clock price of $900, most, if not all, TV stations would be prepared to
surrender their licenses. Hence, any remaining TV stations can be trivially repacked. The auction
mechanism then preserves the feasibility of repacking as it unfolds as follows: as the base clock
price descends, licenses withdraw from the auction, deciding that the price is too low and that
they would prefer to continue broadcasting. When this happens, the feasibility of repacking every
single remaining license in the auction must be asserted one-by-one given the interference patterns
of the withdrawing and the remaining stations. If a remaining license can no longer be repacked,
the price it sees is “frozen” and it is declared to be “provisionally winning,” in that the FCC will
accept its bid to surrender its license. In this case, the withdrawing station effectively sets the price
of the frozen station. The base clock price then falls and the process of feasibility checking repeats
with each new withdrawal. The reverse auctions ends if all TV stations have either withdrawn
from the auction or are provisionally winning. Note that there is no single market price at which a
station sells; different stations obtain different closing prices for their spectrum depending on the
exact base clock price when, given the implied set of withdrawn stations, they could no longer be
repacked.
2.2 Strategic supply reduction
Clock auctions are strategy proof (Milgrom et al., 2012; Milgrom and Segal, 2014). Hence, if a TV
station is independently owned, its owner optimally remains in the reverse auction until
pjτ = ϕjPτ < vj ,
where vj is the reservation value of TV station j that reflects its value as a going concern. We
henceforth refer to this strategy as naive bidding.
Clock auctions are not only strategy proof but also “group-strategy proof” (Milgrom and Segal,
2014). This means that no coalition of bidders has a joint deviation from naive bidding that is
strictly profitable for all members of the coalition. However, as Milgrom and Segal (2014) explicitly
acknowledge, their results do not apply if bidders are “multi minded,” a concept that includes
bidders with multiple objects for sale.
We show that a firm owning multiple broadcast licenses may indeed have an incentive to deviate
from naive bidding. Note that this does not contradict group-strategy proofness as it suffices that
the deviating group, i.e., the multi-license owner, is better off as a whole. Withdrawing a license
from the auction could increase the price for the remaining broadcast TV licenses that a firm owns.
However, the firm is then left with a TV station that it may have been able to sell into the auction.
Therefore, this supply reduction strategy is only profitable if the gain from raising the closing price
for other stations exceeds the loss from continuing to own a TV station instead of selling it into
the auction.
For concreteness and simplicity, consider a situation where all stations are perfectly interchange-
9

able in the repacking process. A firm owns TV stations a and b. The FCC intends to acquire k
broadcast licenses and stations are ordered in ascending order of the ratiovjϕj
. If vaϕa
< vkϕk
andvbϕb
< vkϕk
, then under naive bidding the reverse auction closes at base clock pricevk+1
ϕk+1and both
licenses sell into the auction, yielding the firm a profit of (ϕa + ϕb)(vk+1
ϕk+1
)− (va + vb). On the
other hand, if the firm withholds station a from the auction, then the closing base clock price rises
tovk+2
ϕk+2and its profit is va + ϕb
vk+2
ϕk+2− vb. It is therefore profitable to engage in strategic supply
reduction and withhold TV station a from the auction if the gain in profit from selling the license
of TV station b outweighs the loss in profit from not selling the license of TV station a, or
ϕb
(vk+2
ϕk+2− vk+1
ϕk+1
)> ϕa
(vk+1
ϕk+1
)− va. (2)
The left-hand side implies that strategic supply reduction is more likely to be profitable if ϕb is
large and if the increase in the closing base clock pricevk+2
ϕk+2− vk+1
ϕk+1is large. The right-hand side
implies that it is more likely to be profitable if ϕa is small and va is large. In short, strategic supply
reduction is more likely to be profitable if the “leverage” of increasing the closing base clock price
is large and the opportunity cost of continuing to own a TV station is small.
Strategic supply reduction has been explored in earlier work on multi-unit auctions in wholesale
electricity markets (e.g. Wolfram, 1998): if a firm’s bid for one of its generators has a chance to
set the price, then the firm has an incentive to raise that bid if it will earn the price increases on
its inframarginal generators.14 Other electricity market papers consider this the exercise of market
power, and note that the effects can be large when demand or supply is inelastic (Borenstein,
Bushnell and Wolak, 2002). Unlike in wholesale electricity, a broadcast TV license is indivisible,
leading to sharper behavior in our setting: while there is a maximum of 28 UHF licenses outstanding
in a given DMA market, the median DMA market has 7 UHF licenses, and the mean is 8.2; for
the median market, the market share increase from owning two licenses, rather than a single
one, represents a market share jump from 14.3% to 28.6%. Furthermore, because of interference
constraints, licenses are not homogeneous in the repacking process. Both facts may amplify the
impact of strategic supply reduction. At the same time, unlike the short-run demand for electricity,
the FCC’s demand for licenses is not inelastic, and we account for this in our subsequent analysis
of the reverse auction.
Equation 2 implies that certain types of DMAs are more vulnerable to a supply reduction
strategy and that certain types of broadcast TV licenses are more suitable for this type of behavior.
First, ideal markets from a supply reduction perspective are DMAs in which the FCC will likely
need to acquire a positive number of broadcast licenses and where, at the expected demand levels,
closing prices for selling stations are likely to change significantly should a lower value station be
removed from the auction. This maximizes the impact of withholding a license from the auction
on the closing price (the left-hand side of equation 2). Second, suitable groups of licenses consist of
some stations with higher broadcast volume to sell into the auction and some with lower broadcast
14This mechanism is also similar to the upper bound of the “bidder exclusion effect” considered by Coey, Larsenand Sweeney (2015) in the case of a non-random merger of auction participants.
10

volume to withhold. We return to these implications of the model below when discussing the data
and our results.
3 Data and descriptive evidence
We begin by describing the various sources of data used in the analysis and then turn to providing
descriptive evidence in support of the model from Section 2.2.
3.1 Data sources
We use several sources of data to construct firm valuations, determine how non-selling TV sta-
tions would be repacked, and summarize the likely spectrum demand in a given market in the
forward auction. First, we rely on the MEDIA Access Pro Database (2003 - 2013) from BIA Kelsey
(henceforth BIA) and the Television Financial Report (1995 - 2012) from the National Association
of Broadcasters (NAB) to estimate a TV station’s cash flows and from them infer its reservation
value going into the auction.
BIA contains the universe of broadcast TV stations. It provides station, owner, and market
characteristics, as well as TV stations’ transaction histories covering the eight most recent changes
in ownership. The BIA’s revenue measure covers broadcast-related revenue in the form of local,
regional, and national advertising revenue, commissions, and network compensation. We refer to
BIA’s revenue measure as advertising revenue in what follows. For commercial stations, advertising
revenue is missing for 30.9% of station-year observations, which we impute as detailed in Appendix
A.1.3. For non-commercial stations, advertising revenue is missing for 99.7% of station-year obser-
vations and we do not impute it.
The BIA data excludes non-broadcast revenue, most notably, retransmission fees. These are
fees TV stations charge pay-TV providers to use their content, which the trade press mentions as
a small but growing source of revenue for many TV stations.15 Outside estimates suggest that
advertising revenue accounts for a declining share of a typical station’s revenue, estimated at 69%
in 2016, with the remaining revenue coming from retransmission fees (24%) and online revenues
(7%).16 Consequently, the variation in advertising revenue across stations is a major, but not the
sole, driver of the variation in cash flows and thus willingness-to-sell in the reverse auction.
To get at non-broadcast revenue and ultimately profitability, we rely on NAB as a second source
of data. For commercial full-power stations, NAB collects financial information. Revenue is broken
down into detailed source categories from which we are able to construct advertising revenue and
non-broadcast revenue. NAB further covers expenses related to programming, advertising, and
other sources, and profitability as measured by cash flows. However, for confidentiality reasons,
NAB reports only the distributions of these measures (the 25th, 50th, and 75th percentiles, as well
15See, e.g., “SNL Kagan raises retrans fee forecast to $9.8B by 2020; Mediacom’s CEO complains to FCC”,FierceCable, July 7, 2015.
16“Retrans Revenue Share Expands In Latest U.S. TV Station Industry Forecast”, Justin Nielson, S&P GlobalMarket Intelligence, Jul 14, 2016.
11

as the mean) at various levels of aggregation, resulting in “tables” such as “ABC, CBS and NBC
affiliates in markets ranked 51-60 in 2012” or “CBS affiliates in markets ranked 1-50 in 2012.”
Appendix Table 15 lists the set of 66 tables for 2012; other years are very similar. In Section 4
we describe a method to combine the station-level data on advertising revenue from BIA with the
aggregated data from NAB to estimate a TV station’s cash flows.
To simulate the repacking process required to construct a contiguous spectrum block out of
acquired TV broadcast spectrum, we use three inputs available from the FCC: a TV station inter-
ference file, a TV station domain file, and a repacking feasibility checker that takes these two files as
inputs.17 The first file lists, for every TV station and every channel, sets of other TV stations that
cannot be located on the same channel, or alternatively cannot be located on adjacent channels, due
to interference constraints given the stations’ facility locations. Looking only at the UHF channels
that would exist if the 126 MHz clearing target had been met (channels 14-30), this file lists 2.5
million pairwise restrictions between broadcast TV stations. As an example, Figure 1 shows the
set of the 102 TV stations that have interference constraints with WCAU, the Philadelphia affiliate
of NBC. Of those, 37 have adjacent-channel constraints, meaning that they cannot even be located
one channel above or below WCAU in the repacked region of spectrum, while the rest have same-
channel constraints. Interference is influenced by several factors, including geography, broadcast
tower height, and the transmitter’s power output. The second file, the domain file, provides a list
of channels that a given station may be assigned to in repacking. For most UHF stations, the
set of valid channels is the set of all UHF channels, although some have fewer due to international
broadcasters or military broadcasting. Relying on these two inputs, the so-called SATFC feasibility
checker ascertains whether or not a set of stations can be feasibly repacked into a set of channels
given interference constraints and constraints on station channel locations. SATFC is run as part
of the reverse auction and uses optimized approaches to NP-complete problems to limit the space
of problems to be considered.
Last, the simplified reverse auction model above pointed to DMA-level spectrum demand as
a determinant of the likely success of strategic supply reduction. To construct a simple demand
estimate, we rely on output of a large-scale simulation exercise conducted by the FCC to determine
the likely number of UHF stations it has to acquire in each DMA to meet a nationwide clearing
target of 120 MHz.18 The FCC performed 100 simulations that differ in the identity of the TV
stations that do not relinquish their licenses and require repacking after the auction. We restrict
attention to the 27 repacking simulations that assume full participation by UHF auction-eligible
licenses. For our initial descriptive analysis, we label a DMA as a positive demand DMA if at
the median across these simulations the FCC expected to acquire at least one license. Figure 2
shows that in many DMAs no licenses need to be acquired in expectation to meet this clearing
17All three files are available at http://data.fcc.gov/download/incentive-auctions/Constraint_Files/.18The FCC also conducted a similar simulation exercise to derive the likely number of stations to be cleared in each
market to satisfy an 84 MHz clearing target. We focus on 120 MHz as it is closer to the Stage 1 clearing target the FCCused in the actual auction, which forms the basis for our simulations. See FCC’s Public Notice Appendix, “Analysisof Potential Aggregate Interference,” available at https://apps.fcc.gov/edocs public/attachmatch/DA-14-677A2.pdf,accessed on March 10, 2016.
12

Figure 1: Interference Constraints for NBC Philadelphia (WCAU)
Notes: Each pin represents the facility location of a TV station. WCAU (NBC Philadelphia) is denoted by
a green pin. TV stations denoted by red pins have adjacent-channel interference constraints, while those
denoted by yellow pins have same-channel interference constraints. A total of 102 broadcast TV stations
have some interference constraint with WCAU.
target; hence, payouts from the reverse auction are expected to be concentrated in a small number
of DMAs.
The various data sets use a number of different station identifiers. Below, we identify a station
either by its call sign (e.g., WCAU, continuing with the NBC Philadelphia example from above) or
by the FCC identifier of the facility from which it broadcasts (e.g., WCAU’s broadcast facility ID
is 63153).
3.2 Descriptive evidence
Our data reveal significant ownership concentration, both within and across DMAs, consistent with
the idea of “chains” of broadcasters. We focus on the 1,672 UHF licenses that the FCC denoted
as eligible for the reverse auction in November 2014 and used in its own simulation exercises.19 In
2012, the 1,672 UHF licenses are held by 514 unique owners. Of these 514 owners, 330 hold a single
license, 60 hold two licenses, and 37 hold three licenses. The remaining 87 owners hold at least
four licenses. Of the 204 DMAs with UHF broadcasters, 79 DMAs have only single-license owners
while the remaining 125 DMAs have at least one owner that owns multiple licenses in the DMA.
Ownership concentration has traditionally been a concern of regulators. The FCC Local TV
Ownership Rules permit ownership of up to two full-power commercial stations in the same DMA
if either the two stations’ service areas do not overlap or at least one of the two stations is not
ranked among the top four stations in the DMA, based on the most recent audience market share,
and at least eight independently owned full-power stations broadcast in the DMA in addition to
19The FCC excludes 6 DMAs without UHF stations from its repacking simulations. These DMAs are Bangor, ME,Glendive, MT, Juneau, AK, Lafayette, IN, Mankato, MN, and Presque Isle, ME.
13

Figure 2: Demand Across DMAs
Notes: This histogram indicates how many DMAs need a given number of licenses to be surrendered in
order to meet the overall clearing target to be met in the FCC’s simulations. Data are the median,
minimum, and maximum of the FCC simulated repacking scenario outcomes that assume 100%
participation for the 120 MHz clearing target.
any jointly owned stations.20 These rules are oriented towards the business of running TV stations
that primarily earn revenues through advertising and have a limited effect in preventing a firm from
accumulating market power in the reverse auction. Waivers for the rules can be - and have been -
granted for failing or financially distressed stations. The rules also do not apply to satellite, public,
and low-power stations. However, these types of stations still hold licenses to 6 MHz of spectrum
and are eligible for the auction.
Table 1 summarizes ownership patterns, first for all 204 DMAs and then for the 121 DMAs
with positive demand under a clearing target of 120 MHz in the FCC’s simulations. On average, a
positive demand DMA has 9 broadcast TV licenses that are held by 7.15 owners. The number of
multi-license owners is 1.36 on average for positive demand DMAs compared to 1.20 for all DMAs.
The counts of ownership configurations in the bottom panel of the table reinforce that ownership is
more concentrated in positive demand DMAs. In 81 out of 121 or 67% of positive demand DMAs
at least one firm owns multiple licenses compared to 125 out of 204 or 61% of all DMAs. Taken
together, this suggests that multi-license ownership is a broad concern for the reverse auction.
In addition, news reports have pointed out that at least three private equity firms - LocusPoint
Networks, NRJ TV, and OTA Broadcasting - spent almost $345 million acquiring 39 broadcast TV
licenses from 2010 to early 2013, mostly from failing or insolvent stations in distress, and mostly
20See Title 47 of Code of Federal Regulations, Chapter I.C, Part 73. H, Section 73.3555.
14

Table 1: Ownership concentration
All Positive Private equityDMAs demand DMAs active DMAs
(n = 204) (n = 121) (n = 18)
DMA averages:Number of licenses 8.20 9.00 15.94Number of owners 6.51 7.15 12.22
Number of multi-license owners 1.20 1.36 2.67Expected number of licenses demanded 2.03 3.42 6.67Counts of DMAs with j multi-license owners:
j = 0 79 40 3j = 1 53 31 3j = 2 42 30 2j = 3 17 11 3j = 4+ 13 9 7
Notes: An observation is a DMA. Table displays average number of licenses, owners, and multi-license
owners present in each DMA, together with average of median DMA-level FCC simulated demand at the
120 MHz clearing target. Positive demand DMAs are DMAs where the FCC expects to purchase at least
one license (at median) under the 120 MHz clearing target. Private equity active DMAs are DMAs where
one of the three private equity firms holds at least one license. Multi-license owners refers to firms owning
more than one auction-eligible license within one DMA.
low-power licenses (25 low-power versus 14 full-power licenses).21,22 Since those press mentions
and through the end of our data set in late 2013, an additional 4 license purchases by the three
private equity firms were recorded, for a total of 43 license purchases. Of the 43 transactions, 25
are for licenses that cover the same DMA as that of another purchased license and may thus be
indicative of attempts to accumulate market power in the reverse auction. Most of the stations are
on the peripheries of major DMAs, ranging from Boston, MA, to Washington, DC, on the Eastern
Seaboard and from Seattle, WA, to Los Angeles, CA, along the West Coast.
Table 1 illustrates that ownership is especially concentrated in the 18 DMAs in which the three
private equity firms have been active (henceforth, private equity active DMAs). The number of
multi-license owners is 2.67 on average for private equity active DMAs, and in 15 out of 18, or 83%,
of these DMAs at least one firm owns multiple licenses. Moreover, at a 120 MHz clearing target,
the FCC anticipated to purchase 6.67 licenses on average in private equity active DMAs compared
to 3.42 licenses in positive demand DMAs. In line with the model in Section 2.2, the three private
equity firms appear to focus on DMAs with robust demand for spectrum.
Section 2.2 discusses what types of TV stations are best suited for a supply reduction strategy.
21See, e.g., http://www.tvnewscheck.com/article/65850/tv-spectrum-speculation-nears-345-millionorhttp://current.org/2013/02/speculators-betting-big-on-fcc-tv-spectrum-auctions/, accessed on November 15,2015.
22According to FCC filings, the Blackstone Group LP owns 99% of LocusPoint Networks. NRJ TV LLC is a mediaholding company funded through loans from Fortress Investment Group LLC according to a recent U.S. Securitiesand Exchange Commission filing. Lastly, OTA Broadcasting is a division of MSD Capital, L.P., which was formedto manage the capital of Dell Computer founder Michael Dell.
15

Table 2 summarizes the characteristics of TV stations transacted from 2003 to 2009 in the first
column and those of TV stations transacted from 2010, when the incentive auction was proposed, to
2013 in the remaining columns. The latter are further separated into transactions in the 121 DMAs
with positive expected demand under a clearing target of 120 MHz and transactions involving the
three private equity firms.
Consistent with the model, the three private equity firms have acquired TV stations with
high broadcast volume. They also typically have low valuations, as evidenced by the low prices
paid and the fact that very few stations are affiliated with a major network. Even compared to
transactions in positive demand DMAs, the TV stations acquired by these firms are particularly
high in population reach, interference count, and broadcast volume. Private equity firms also
concentrate predominantly on DMAs expected to have positive demand and above average levels
of demand: at a 120 MHz clearing target, 98% of their transactions fall into positive expected
demand DMAs with average demand of 9 licenses compared to 60% positive demand DMAs with
average demand of 3 licenses for all transactions between 2010 and 2013. We caution that most
differences between the subsamples are not statistically significant in light of the small sample sizes
and large variances of many of the outcomes. In Section 5.1, we return to the model implications
and investigate the attributes of licenses that multi-license owners choose to strategically withhold
from and bid into the auction.
4 Analysis
We first estimate the reservation value of a TV station going into the auction. Then we simulate
the auction and compare the outcome under naive bidding with the outcome when we account
for the ownership pattern in the data and allow multi-license owners to engage in strategic supply
reduction.
4.1 Reservation values
The reservation value of TV station j in a particular DMA going into the reverse auction held at
time t0 is the greater of its cash flow value V CFjt0
and its stick value V Stickjt0
:
vjt0 = max{V CFjt0 , V
Stickjt0
}. (3)
The industry standard for valuing a broadcast business as a going concern is to assess its cash
flow CFjt0 and scale it by a cash flow multiple MultipleCFjt0 . Hence, the cash flow value of the TV
station is
V CFjt0 = MultipleCFjt0 · CFjt0 . (4)
This is the price a TV station expects if it sells itself on the private market as a going concern. The
stick value V Stickjt0
, on the other hand, reflects solely the value of the station’s broadcast TV license
and tower, not the ongoing business. This is the valuation typically used for unprofitable or non-
16

Tab
le2:
Bro
ad
cast
TV
licen
setr
an
sacti
on
s
2003
-200
920
10-2
013
Inp
osit
ive
Invol
vin
gp
riva
teA
lld
eman
dD
MA
seq
uit
yfi
rms
Nu
mb
erof
Lic
ense
sT
ran
sact
ed51
832
919
943
Ave
rage
Tra
nsa
ctio
nP
rice
($m
illi
on)
47.7
423
.00
23.5
88.
54A
vera
geIn
terf
eren
ceC
ou
nt
68.3
371
.74
87.9
592
.58
Ave
rage
Inte
rfer
ence
-Fre
eP
opu
lati
on(m
illi
on)
1.78
1.92
2.68
3.89
Ave
rage
Bro
adca
stV
olu
me
(th
ousa
nd
)16
3.43
177.
9223
2.97
285.
01P
erce
nta
ge
majo
rn
etw
ork
affili
atio
n(%
)48
.84
52.5
840
.70
4.65
Pos
itiv
eD
eman
dD
MA
(%,
at12
0M
Hz)
58.1
160
.49
100
97.6
7A
vera
geD
eman
d(1
20M
Hz)
2.62
2.94
4.85
8.93
Note
s:A
nobse
rvati
on
isa
transa
ctio
nof
an
auct
ion-e
ligib
lest
ati
on.
“In
terf
eren
ceC
ount”
isth
enum
ber
of
stati
ons
wit
hw
hic
ha
giv
enst
ati
on
would
inte
rfer
eif
they
wer
elo
cate
don
adja
cent
channel
s.“D
emand”
is
the
med
ian
num
ber
of
lice
nse
sex
pec
ted
tob
epurc
hase
din
the
DM
Aacc
ord
ing
toth
eF
CC
repack
ing
scen
ari
os
for
the
120
MH
zcl
eari
ng
targ
et.
“P
osi
tive
Dem
and
DM
As”
refe
rsto
transa
ctio
ns
that
involv
ea
lice
nse
loca
ted
ina
DM
Aw
ith
ap
osi
tive
med
ian
dem
and
level
under
the
120
MH
zcl
eari
ng
targ
etin
FC
C
repack
ing
sim
ula
tions.
For
the
507
acq
uis
itio
ns
that
involv
em
ult
iple
stati
ons,
som
eof
whic
hm
aynot
be
elig
ible
for
the
auct
ion,
we
use
the
aver
age
pri
cep
erlice
nse
as
atr
ansa
ctio
npri
ce.
17

commercial broadcast licenses. It is computed from the station’s population reach CoveragePopjt0
and the stick multiple MultipleStickjt0as
V Stickjt0 = MultipleStickjt0 · 6MHz · CoveragePopjt0 . (5)
For example, a TV station reaching 100,000 people with a license for a 6 MHz block of spectrum
and a stick multiple of $0.30 per MHz per population (henceforth MHz-pop) is worth $180,000
based on its fixed assets alone.
While we observe a TV station’s covered population, its cash flow is only available at various
levels of aggregation in the NAB data. Moreover, we observe neither the cash flow multiple nor the
stick multiple. Below we explain how we estimate these objects and infer the station’s reservation
value vjt0 .
Cash flows. We specify a simple accounting model for cash flows.23 The cash flow CFjt of TV
station j in a particular DMA in year t is
CFjt = α (Xjt;β)ADjt +RT (Xjt; γ)− F (Xjt; δ) + εjt, (6)
where α (Xjt;β)ADjt is the contribution of advertising revenue to cash flow, RT (Xjt; γ) is non-
broadcast revenue (including retransmission fees), F (Xjt; δ) is fixed cost, and εjt ∼ N(0, σ2
)is
an idiosyncratic, inherently unobservable component of cash flow. Only advertising revenue ADjt
and station and market characteristics Xjt are directly observable in the BIA data. To estimate
the remaining components of cash flow, we specify flexible functional forms of subsets of Xjt for
α (Xjt;β), RT (Xjt; γ), and F (Xjt; δ) and estimate the parameters θ = (β, γ, δ, σ) drawing on the
aggregated data from NAB.
We proceed using a simulated minimum distance estimator as detailed in Appendix A.2. The
parameters θ = (β, γ, δ, σ), together with our functional form and distributional assumptions in
equation 6, imply a distribution of the cash flow CFjt of TV station j in a particular DMA in year
t. We first draw a cash flow error term εjt for each TV station covered by the aggregated data
from NAB. Then we match the moments of the predicted cash flow and non-broadcast revenue
distributions to the moments reported by NAB for different sets of TV stations and DMAs. In
particular, we match the mean, median, 25th and 75th percentiles of cash flow and the mean of
non-broadcast revenue for each NAB table in each year, yielding a total of 3,313 moments.
The correlation between the moments of the predicted distributions at our estimates and the
moments reported by NAB is 0.98 for cash flow and 0.84 for non-broadcast revenue. The estimates
indicate that major network affiliates are most profitable; that non-broadcast revenue has grown
significantly in recent years; and that there are economies of scale in fixed cost. Appendix A.2.4
gives details on parameter estimates and fit measures.
23In doing so, we follow the Well Fargo analyst report, “Broadcasting M&A 101 Our View of the Broadcast TVM&A Surge,” J. Davis Herbert and Eric Fishel, June 26, 2013.
18

Multiples. To estimate the multiples MultipleCFjt and MultipleStickjt , we begin with the 350
transactions for an individual broadcast TV station in the eleven years from 2003 to 2013 as
recorded by BIA.24 We extract 136 transactions based on cash flows and 201 transactions based
on stick values between 2003 and 2013.25 We infer the cash flow multiple and stick multiple from
the transaction price using equations 4 and 5, respectively. Because the transacted stations may
be a selected sample, we incorporate industry estimates of the range of the multiples. Using these
estimates as priors, we estimate a Bayesian regression model to project multiples on station and
market characteristics Xjt. This allows us to predict multiples for any TV station, not just those
that were recently transacted. Appendix A.3 provides further details. The resulting posteriors,
shown in Appendix Figure 11, are a normal distribution for the cash flow multiple and a log-normal
distribution for the stick multiple.
Reservation values. We use our estimates to infer a TV station’s reservation value for its
broadcast license going into the auction. Not all the 1,672 UHF stations that the FCC includes
in its simulation exercise are covered in the aggregated data from NAB that we use to estimate
the cash flow model in equation 6. The omissions are 386 low-power UHF stations and 290 non-
commercial UHF stations. We therefore extrapolate from our estimates as follows. First, we assume
that low-power stations are valued in the same way as full-power stations conditional on station
and market characteristics Xjt. Second, we assume that non-commercial stations are valued by
stick value, consistent with industry practice.
To infer the reservation value of TV station j in a particular DMA going into the reverse auction,
we set t0 = 2012 and draw from the estimated distribution of the cash flow error term εjt0 to get
CF jt0 . We draw from the respective posterior distributions of the multiples to get MultipleCF
jt0
and MultipleStick
jt0 . A commercial station’s reservation value vjt0 is then the higher of the realized
draws of its discounted broadcast cash flow value and its stick value as specified in equations 3-5;
a non-commercial station’s reservation value vjt0 is its stick value. Our estimates imply that the
average TV station in our data has a cash flow value of $42.2 million and a stick value of $4.5
million. For 31.6% of TV stations, our estimates indicate that the reservation value is given by its
stick value rather than its cash flow value.
24BIA records 877 transactions with full transaction prices, as opposed to station swaps, stock transfers, donations,etc. We focus on the 350 transactions involving a single license in order to evaluate the trading multiples as a functionof station and market characteristics. Of these 350 transactions, 26 involve the three private equity firms.
25Because 2012 is the last year of availability for the NAB data, we cannot estimate a TV station’s cash flow for2013. To classify transactions, we proceed as follows: We first define a TV station to be a major network affiliateif it is affiliated with ABC, CBS, Fox, or NBC. We then classify a transaction as based on stick value if it is for anon-major network affiliate with a cash flow of less than $1 million. Regardless of network affiliation, we also classifya transaction as based on stick value if the TV station has a negative cash flow. Finally, we classify a transaction thatwould have implied a stick value greater than $4 per MHz-pop to be based on cash flow and a transaction that wouldhave implied a cash flow multiple greater than 30 to be based on stick value. Together, we drop 13 transactions thatdo not fit the criteria.
19

Figure 3: Sample Draw of Valuations for Philadelphia Licenses
Notes: This chart shows reservation values (left axis), advertising revenues (right axis), and network
affiliations (horizontal axis) for all auction-eligible UHF licenses in the Philadelphia DMA, for a single
draw from our estimated distributions of valuations and multiples. The Philadelphia ABC affiliate
broadcasts from the VHF spectrum and so is not included here.
Example. As an example, Figure 3 shows a sample draw from our estimated reservation values
for auction-eligible UHF licenses in the Philadelphia, PA, DMA. The licenses are ordered by their
reservation value, and we overlay each license’s 2012 advertising revenues from the BIA dataset. In
addition, we label each license by its network affiliation on the horizontal axis. It is immediately
apparent that our estimated valuations correlate with advertising revenues and network affiliation.
In addition, it is clear that reservation values can differ greatly across licenses.
Reservation values are not the same as naive bids in the auction, as pointed out in Section
2.1; since a license is shown a personalized price based on its broadcast volume, two licenses with
the same reservation value may have very different clock prices at which they would withdraw
from the reverse auction. Figure 4 plots, for the same draw of valuations as above, each license’s
broadcast volume against its reservation value. While there is some positive correlation, it is far
from perfect, and the vertical cluster of licenses on the left indicates that a number of licenses with
similar reservation values have broadcast volume levels that are multiples of one another.
As a result of the variation in broadcast volumes, naive bids have a different distribution than
reservation values. Figure 5 plots naive bids compared to reservation values. Stations with a
relatively low broadcast volume - that are shown a relatively low price in the auction - would
withdraw from the auction at relatively higher clock prices. For example, the licenses affiliated
with MdF and AsiaV have valuations similar to many other stations, but far lower broadcast
volume, meaning that they are shown a relatively lower price than other stations for the same clock
price in the auction. Consequently, they would withdraw from the auction at a higher clock price
20

Figure 4: Correlation of Broadcast Volume and Reservation Values
Notes: This scatterplot shows broadcast volume (left axis) against reservation values (horizontal axis) for
all auction-eligible UHF licenses in the Philadelphia DMA, for a single draw from our estimated
distributions of valuations and multiples.
than a station with a similar valuation but higher broadcast volume, and so their naive bids in
terms of the clock price are relatively high.
In other contexts, we would interpret the naive bids in Figure 5 as the elements of a supply
curve. Here, however, that would ignore repacking constraints. Since the licenses are not perfectly
interchangeable in repacking, the supply of licenses at a given point in the auction depends on
what other licenses have already been surrendered. To illustrate, we return to the Philadelphia
example in Section 5.2, where we show our simulation auction outcomes for this particular draw of
reservation values.
While reservation values alone ignore repacking constraints that together make up supply, they
are nevertheless useful in assessing the implications of the basic model in Section 2.2 descriptively,
outside of full model simulations. We test whether pre-auction acquisitions are concentrated in
vulnerable DMAs where the change in closing clock price is likely large due to supply reduction: we
relate the propensity of a purchase by one of the three private equity firms in a probit regression
to the increase in reservation values that results from removing from the auction either one or
two licenses that would otherwise sell given the median number of licenses the FCC expects to be
repurchased in the DMA (the term in parentheses on the left hand side of equation 2). Controlling
for population and number of licenses, we find in unreported results that private equity firms were
more likely to acquire licenses in DMAs where the distribution of reservation values is relatively
steep around expected demand levels and strategic supply reduction is thus likely to be profitable.
21

Figure 5: Naive Bids and Reservation Values for Philadelphia Licenses
Notes: This chart shows reservation values (left axis), naive bids (right axis), and network affiliations
(horizontal axis) for all auction-eligible UHF licenses in the Philadelphia DMA, for a single draw from our
estimated distributions of valuations and multiples. ABC Philadelphia broadcasts from the VHF spectrum
and is not included here.
4.2 Simulations
To quantify the impact of strategic supply reduction, we solve for all equilibria of a simplified
localized version of the reverse auction. Since it is possible, albeit unlikely, that due to interference
constraints, the withdrawal of a license in New York, NY, sets the price of a license in Los Angeles,
CA, through a series of domino effects, the reverse auction is truly national. Checking the feasibility
of repacking a particular station is an NP-complete computational problem that can easily take
hours to run. Indeed, according to the FCC’s own reports, Round 22 of the first stage of the reverse
auction was delayed by one day since the FCC computing engine could not determine the necessary
outcomes on time.26 The computational challenge is further compounded here as we study the
impact of strategic supply reduction by enumerating all auction equilibria and integrate over the
distribution of estimated cash flows using Monte Carlo simulation.
As a step towards making the analysis computationally feasible, we reduce the size of the
nationwide repacking problem by taking repacking constraints into account only at a regional level.
Our approach is as follows: for a “focal” DMA m ∈ {1, 2, ..., 204}, we define the “region” of DMA
m as the set of all DMAs in which at least one station has an interference constraint with at least
one station in DMA m. We simulate the auction for a focal DMA m taking all stations in that
DMA’s region into account, even those stations that do not have any direct interference constraints
with licenses in the focal DMA. The object of interest is the payouts in the focal DMA alone. Table
26See https://auctiondata.fcc.gov/public/projects/1000/reports/reverse_announcements, accessed on De-cember 9, 2016.
22

Table 3: Repacking “Regions” of Licenses
Mean Min 25th Percentile Median 75th Percentile Max
Number of Eligible UHF Licenses:By DMA 8.2 1 4 7 11 28By Repacking Region 83.5 3 54 82.5 112.5 191
Distance Between Eligible UHF Licenses:By DMA 34.86 0 1.52 22.44 49.11 414.92By Repacking Region 184.19 0 107.44 176.61 252.91 779.5
Notes: Statistics are for 204 DMAs with eligible licenses. Distances are in miles. All pairwise distances
between stations’ broadcast towers in the same DMA or Repacking Region are computed, and statistics are
for the full sample of 17,438 pairwise distances within DMAs and 1,751,112 pairwise distances within
Repacking Regions.
3 shows that a typical repacking region consists of a far larger set of licenses, and a far more distant
set of licenses, than those in a DMA alone. Figure 6 shows the set of TV stations considered to be
a part of the Philadelphia region for repacking purposes in our simulations.
We require a number of additional simplifications. First, to sidestep the forward auction and the
multi-stage nature of the overall incentive auction, we fix the clearing target in the reverse auction
to be the clearing target used by the FCC in the first round of the actual incentive auction, namely
126 MHz, the clearing target at the time we performed our simulations below. The assumption of a
fixed clearing target does not imply that the FCC’s demand for a given license is inelastic because
there are many sets of licenses that can be repacked to meet the target.
Second, we assume full participation by auction-eligible stations. This is a conservative assump-
tion: concerns have been raised about the possibility of some license holders, such as nonprofit or
religious stations, being motivated by considerations beside profitability and choosing not to par-
ticipate in the reverse auction, even though it would in likelihood be profitable for those stations to
surrender their license. In the popular press, several commercial broadcasting chains have shown
little interest in the auction, with the CEO of Sinclair Broadcasting Group, which operates 74
stations, stating he “hasn’t heard of any broadcaster who has said they have anything for sale.”27
We consider the effect of partial participation specifically by non-commercial station types in Sec-
tion 5.5 and find that total payouts can easily double, even in the absence of strategic bidding, if
participation is low among such stations.
Third, we focus exclusively on the full surrender of UHF licenses into the auction in line with
the FCC’s own simulation exercise. We thus set aside VHF licenses and, similarly, do not model a
TV station’s additional option of moving from a higher to a lower frequency band in order to free
up more desirable parts of the spectrum. The price that a VHF station is offered for going off the
air and the price that a UHF or a VHF station is offered to move channels are fixed fractions of the
price that a UHF station is offered for going off the air. For this reason, the FCC’s own auction
simulations focus solely on the number of UHF licenses required to meet a given clearing target
27“FCC can auction spectrum, but will broadcasters sell?”, Joe Flint, The Los Angeles Times, February 17 2012.
23

Figure 6: The Repacking “Region” for Philadelphia, PA
Notes: Each pin represents the facility location of an auction-eligible UHF broadcast TV station. Stations
in the Philadelphia DMA are denoted by red pins. Stations denoted by yellow pins are in other DMAs that
have at least one station that has a repacking constraint with a Philadelphia station. A total of 126
broadcast stations are considered to be in the Philadelphia region for the purposes of our analysis.
in its repacking simulations. We also do not consider the option of channel-sharing arrangements.
Channel-sharing refers to a situation where two TV stations enter into a private agreement to
share a license to 6 MHz of spectrum and split the proceeds from selling the other license into
the auction. It is unclear how attractive this option is, in part due to technological constraints.28
Channel-sharing arrangements are likely to boost participation in the reverse auction, thereby
effectively reducing the number of UHF licenses required from regular auction participants to meet
a given clearing target.
Fourth, we assume complete information among the owners of TV stations in that they know the
broadcast volume ϕjt0 and reservation value vjt0 of every TV station. The assumption of complete
information greatly simplifies the analysis relative to an asymmetric information formulation. The
net effect of this assumption on prices and payouts is ambiguous as it makes it easier for firms
to implement supply reduction strategies while also eliminating any possible ex-post regret for
multi-license owners. Furthermore, while knowledge of reservation values is a strong assumption,
many large broadcasters have engaged consultants to help them estimate valuations heading into
the auction. In addition, industry groups of smaller broadcasters have helped their members
to similarly estimate valuations in their DMAs. While there may be some residual uncertainty
about reservation values, we conjecture that a model with incomplete information has similar but
possibly less sharp implications as our current model. In particular, strategic supply reduction with
286 MHz of spectrum is insufficient for two high-definition video streams. The FCC has piloted a channel-sharingarrangement in Los Angeles, CA, showing that it is technologically feasible for one high-definition video stream andone or more standard-definition video streams to share 6 MHz of spectrum. 6 MHz of spectrum may no longer sufficeif a TV station eventually transitions from a high-definition to a ultra-high-definition (4K) video stream.
24

incomplete information manifests itself by a multi-license owner raising her bid above a station’s
reservation value instead of outright withdrawing the station from the auction, which could have a
smaller impact on closing prices.
Our baseline is the outcome of the reverse auction with naive bidding. Under naive bidding, we
simply ignore the ownership pattern in the data and treat TV stations as independently owned. In
line with the discussion in Section 2.2, TV license j remains in the auction until the base clock price
drops belowvjϕj
. To account for uncertainty in our estimates of reservation values, we construct
reservation values by repeatedly drawing realizations of the cash flow error term εj and the multiples
MultipleCFj and MultipleStickj . Given a particular set of implied reservation values, we proceed as
follows to compute the naive bidding outcome (a formal coding of the algorithm is presented in
Appendix B):
1. Any participating license in a focal DMA’s repacking region whose reservation value is above
its starting price is repacked into the available spectrum. If it is not possible to accommodate
all of these licenses in the available channel space (UHF channels 14-30 for the 126 MHz
clearing target), then the auction is considered to have failed.29
2. All remaining licenses are considered “active” in the auction. They are sorted in descending
order by their reservation price and are denoted by j ∈ {1, ..., J}, where j = 1 is the station
with the highest reservation value in terms of the base clock price. As the base clock price
falls, licenses withdraw one by one. Each time a license j withdraws, we verify that each of
the remaining “active” stations in {j + 1, ..., J} could still feasibly be repacked if it were to
withdraw in the next round of the auction. If station k ∈ {j + 1, ..., J} can no longer be
repacked due to j having withdrawn, it is no longer “active”, and instead is “frozen” at the
current base clock price. The payout to station k is therefore set by station j, who made it
no longer feasibly to repack k.
3. The base clock price drops and the process continues until all licenses are either repacked or
frozen.
Unless otherwise noted, we report average auction outcomes based on 100 draws from the distri-
bution of reservation values below. With 204 DMAs, each with its own repacking region, and 100
simulation draws, we determine payouts for 20,400 simulated auctions.
We next account for the ownership pattern in the data. We assume that a multi-license owner
engages in strategic supply reduction by withholding one or more of its TV stations from the
reverse auction at the outset of the auction. Hence, an owner of no TV stations has 2no−1 possible
combinations of licenses to consider bidding into auction, and if there are No multi-license owners
in the repacking region, there are∏Noo=1(2
no − 1) strategy profiles across firms, assuming again full
auction participation by single-license owners. Given computational constraints, this creates an
29In practice, it is very rare for the auction to fail. The fail rate for our main results is under 0.7% of simulations,and those cases involve many strategic withdrawals of licenses. It is unclear although perhaps unlikely that massivewithdrawals of licenses could constitute equilibria.
25

infeasibly large strategy space for at least some repacking regions; there are 17 owners with 20 or
more TV stations and one owner with 93 TV stations in the data. Hence, we impose a restriction
on the strategy space, by limiting strategic bidding to licenses in the focal DMA, rather than all
licenses owned by a given firm across the repacking region. This reduces both No to only multi-
license owners and no to only licenses in the focal DMA. For example, a multi-license owner of a
given license in the Philadelphia, PA, DMA considers strategic bidding only for that and any other
licenses in the Philadelphia, PA, DMA, but not for those held in, say, the Harrisburg, PA, DMA,
even though we consider such stations in repacking.
For each of the resulting strategy profiles, we re-run the above algorithm to determine the
payouts associated with this strategy profile, assuming that firms bid their valuations for the set
of licenses they consider bidding into the auction under the particular profile under consideration.
We use these payouts to determine whether a particular strategy profile is an equilibrium outcome
of each multi-license owner’s strategic choice of licenses to bid into the auction in the focal DMA
by verifying the absence of any unilaterally profitable deviations from the strategy. With no or one
multi-license owner in a DMA, there is a unique pure-strategy equilibrium set of licenses to bid
into the auction. With more than one multi-license owner, there may be multiple equilibria; we
enumerate all of them.
To be able to accommodate the large dimensional strategy space under strategic bidding, we
make one final simplification in estimating auction outcomes: we do not assert feasibility or compute
payouts for stations outside the focal DMA; we instead assume they exit the auction at the same
base clock price when they would have exited under naive bidding over the entire repacking region.
We assert feasibility only for active licenses in the focal DMA when these licenses exit. Our main
results compare naive and strategic outcomes under this simplification. In Section 5.6 we show
that in select major markets that we tested, this simplification introduced an error of less than
0.20% in the strategic payouts we computed relative to asserting feasibility and computing payouts
for all non-focal DMA stations. It had virtually no effect on naive payouts across all markets. At
the same time, computational speed increased by a factor of 15 to 20. To further illustrate how
we complete our simulations, Appendix Figure 12 shows the reverse auction process in detail for
two alternative strategy profiles of multi-license owners in Philadelphia, PA, for a given draw of
simulated valuations. Appendix Figure 13 graphically depicts the auction progress under the first
strategy profile by plotting the locations of licenses that withdraw and/or are frozen.
Restricting strategic bidding to the focal DMA, the Pittsburgh, PA, DMA has 4,601 strategy
profiles to consider, the largest number of any DMA in our data. The total sum of strategy profiles
across the 204 DMAs is 17,316, implying solving a total number of 1,731,600 simulated auctions.30
We recognize that restricting strategic bidding to the focal DMA is likely to create a lower bound on
the effect of strategic bidding by multi-license owners. In Section 5.4 we return to the Philadelphia
case study and explicitly allow a particular multi-license owner to strategically bid an additional
30In contrast, if we allowed multi-license owners to bid strategically within each repacking region, the number ofstrategy profiles would be a completely unmanageable 6.89 · 1044.
26

license from a neighboring DMA; we demonstrate large effects.
Despite the simplifications, our analysis is near the bound of what can be computed in a
reasonable amount of time. The over two million simulations in this paper were completed on a
combination of the Wharton High-Performance Computing Cluster and the Amazon EC2 Cloud
Computing Platform over a period of just under one month during the summer of 2016, typically
utilizing over 500 dedicated cores (without hyperthreading) simultaneously.
5 Results
5.1 Naive versus strategic bidding
We compare the outcome of the reverse auction under naive bidding with the outcome under
strategic bidding when we account for the ownership patterns in the data. Table 4 shows the main
results: payouts to broadcast TV licenses holders under naive and strategic bidding, broken down
into different subsets of DMAs. As there may be multiple equilibria when more than one firm in
a DMA controls multiple licenses, we present moments of the resulting payout distributions across
equilibria. In a given DMA, we record the minimum, mean, median, and maximum payout level
across equilibria for strategic bidding for each simulated set of reservation values. We then average
each of these four moments across simulation draws. Table 4 then reports the sum of the payouts
across particular groupings of DMAs for each moment. In the following, we focus on comparing
payouts under naive bidding to the average equilibrium payout under strategic bidding.31
The first thing to remark upon is that strategic bidding generally leads to higher payouts in
the reverse auction. This need not be the case: there exist equilibria in DMAs where total payouts
are lower due to strategic behavior, although higher for the firm engaged in supply reduction.32 At
the mean payout level across equilibria, strategic bidding is found to increase total payouts from
$16.999 billion to $20.740 billion, an increase of 22%. Moving down the table, we see that nearly
99% of payout increases are concentrated in DMAs with two or more multi-license owners. Further,
we see that DMAs in which private equity firms are active are an important source of increased
payouts. Those 18 DMAs are large, accounting for 70.4% of payouts in the base case; however,
they account for 95.7% of the total increase in payouts at the mean due to strategic bidding. In
addition, we see that there is some skew to the distribution, with some exceptionally large payout
increases at the high end of the distribution for certain strategic equilibria. For example, in the 18
private equity active DMAs, the average maximum strategic equilibrium payout across equilibria
is 51% greater than the payout under the naive base case. Panel B shows the large spillover effect
of strategic bidding: single-license owners, who have no incentive to reduce supply, see payout
increases of 19.1% at the mean strategic bidding equilibrium. While multi-licenses owners benefit
31In the rare cases where there is no pure strategy equilibrium, we assume firms revert to naive bidding.32A firm can selfishly increase its own profits through strategic bidding, but by withdrawing a license from the
auction, it also affects which other licenses are sold in. In some occasions, more expensive licenses are substitutedwith less expensive ones due to strategic bidding by others.
27

more in percentage terms, the level of payout increases is actually greater among single-license
owners.
Table 4 masks significant heterogeneity in the impact of strategic supply reduction. Even under
naive bidding, there are an average of just over 90 DMAs that see payouts of zero across simulations.
Under strategic bidding, an average of 23 DMAs, or just 11% of DMAs, show payout increases from
strategic bidding.33
Our simulations allow us to determine the profitability of strategic supply reduction for the
three private equity firms. Table 5 presents the results. As discussed in Section 3.2 these firms
have acquired TV stations with high broadcast volume but low valuations as going concerns. Even
under naive bidding, the firms stand to profit as their payouts in the reverse auction plus the value
of any unsold licenses substantially exceed their total acquisition costs.
The simulations bear out the implication of the model in Section 2.2 that a multi-license owner
sells stations with higher broadcast volume into the auction but withholds stations with lower
broadcast volume. Table 6 shows the average broadcast volume and reservation value of the licenses
owners decide to keep and sell under naive and strategic bidding simulations. Comparing attributes
of unsold stations under naive and strategic bidding, we see that owners on average keep stations
of lower value and sell stations of higher value under strategic bidding. This is counter-intuitive,
until one sees that the stations kept have lower broadcast volume, and so are less valuable in the
auction, while those sold have higher broadcast volume, making them particularly attractive to sell
into the auction. In general, we see that strategic behavior leads to a higher amount of broadcast
volume being acquired to reach the clearing target, increasing the total payouts.
There are two potential efficiency losses from strategic bidding by multi-license owners: first,
such behavior changes the set and number of licenses surrendered in the auction; second, such
behavior risks reducing the amount of spectrum that is repurposed in the auction.
The set of stations surrendered under strategic bidding differs from that under naive bidding, as
implied by Table 6. Therefore, strategic bidding by multi-license owners distorts the set of licenses
that are surrendered from a socially optimal set to a different set, allowing perhaps lower-value
licenses to remain on-air while higher-value licenses are surrendered. Such efficiency losses are
likely significant; our simulations indicate that the average license that remains unsold under naive
bidding has a reservation value of less than half of the reservation value of an unsold license in the
average strategic equilibrium.
In addition, there is a risk that strategic bidding by multi-license owners could cause a stage
of the auction to fail, leading to a reduction of the overall clearing target. As the forward auction
is outside of the scope of this paper, we cannot address this prospect numerically, although we
mention it as a possibility.
33On average, one DMA per simulation will see a decrease in payouts from strategic bidding.
28

Tab
le4:
Tota
lP
ayou
ts($
B)
toB
road
cast
TV
Lic
en
seH
old
ers
by
DM
AT
yp
e
Nai
veB
idd
ing
Str
ateg
icB
idd
ing
Pay
out
Incr
ease
Pan
elA
:D
MA
Pay
ou
ts($
B)
In:
#D
MA
sB
ase
Mea
nM
inM
edia
nM
axA
tM
ean
All
DM
As
204
16.9
9920.7
4018.5
1920.5
5423.3
0122
.0%
(0.7
51)
(0.8
98)
(0.8
76)
(1.2
35)
(1.6
86)
DM
As
wit
hM
ult
i-L
icen
seO
wn
ers
125
15.6
1119.3
5217.1
3019.1
6621.1
9324
.0%
(0.7
18)
(0.8
75)
(0.8
64)
(1.2
20)
(1.6
66)
DM
As
wit
hT
wo
orm
ore
Mu
lti-
Lic
ense
Ow
ner
s72
14.4
1018.1
0815.8
9217.9
2220.6
6325
.7%
(0.7
11)
(0.8
67)
(0.8
60)
(1.2
09)
(1.6
63)
Pri
vate
Equ
ity
Act
ive
DM
As
1811.9
7815.5
5813.3
8215.3
7218.0
7029
.9%
(0.7
04)
(0.8
53)
(0.8
61)
(1.2
03)
(1.6
49)
Pan
elB
:O
wn
erP
ayou
ts($
B)
Am
on
g:
Sin
gle
-Lic
ense
Ow
ner
s(w
ith
inD
MA
)-
12.0
0914.3
0912.1
1314.2
0116.5
5619.1
%(0.5
05)
(0.6
79)
(1.5
64)
(0.7
76)
(1.4
87)
Mu
lti-
Lic
ense
Ow
ner
s(w
ith
inD
MA
)-
4.9
816.
207
(5.4
96)
6.2
226.
859
24.6
%(0.3
63)
(0.3
67)
(0.5
84)
(0.4
27)
(0.4
40)
Note
s:In
the
case
of
naiv
ebid
din
g,
pay
outs
are
aver
aged
over
100
sim
ula
ted
sets
of
rese
rvati
on
valu
es.
In
the
case
of
stra
tegic
bid
din
g,
the
mom
ents
of
the
pay
out
dis
trib
uti
on
are
calc
ula
ted
acr
oss
all
poss
ible
equilib
ria
for
agiv
ensi
mula
ted
auct
ion
and
then
aver
aged
over
100
auct
ion
sim
ula
tions.
Sta
ndard
dev
iati
ons
of
the
mom
ents
acr
oss
the
100
sim
ula
tions
are
inpare
nth
eses
.T
he
mea
n,
min
,m
edia
n,
and
max
pay
outs
are
com
pute
dw
ithin
DM
A,
and
aggre
gate
dto
the
DM
Agro
upin
gunder
consi
der
ati
on
inP
anel
A.
InP
anel
B,
pay
outs
are
firs
taggre
gate
dam
ong
the
sets
of
single
-lic
ense
and
mult
i-lice
nse
sow
ner
s.T
he
sum
of
pay
outs
am
ong
the
two
sets
of
owner
sdoes
not
alw
ays
equal
the
valu
efo
r“A
llD
MA
s”in
Panel
A
since
stati
stic
sare
taken
am
ong
those
two
gro
ups
bef
ore
aver
agin
gand
rati
os
bet
wee
nth
etw
ogro
ups
diff
er
acr
oss
mark
ets.
29

Tab
le5:
Au
cti
on
Su
rplu
sto
Pri
vate
Equ
ity
Fir
ms
Tot
alT
otal
Pro
fits
#S
tati
ons
Pu
rch
ase
Pri
ce($
M)
Nai
ve($
M)
Str
ateg
ic($
M)
NR
J14
235.
5169
0.79
1,4
73.0
4(8
1.31
)(1
40.5
6)O
TA
2077
.05
446.
791,
237.
10(4
4.94
)(1
44.6
1)L
ocu
sPoin
t9
54.7
520
0.65
400.
44(2
4.6
4)(6
2.2
2)
Note
s:P
rofits
are
aver
ages
over
100
auct
ion
sim
ula
tions,
and
inth
eca
seof
stra
tegic
bid
din
g,
aver
ages
over
equilib
ria,
sum
med
acr
oss
all
DM
As
wher
eth
efirm
shold
lice
nse
s.T
ota
lpro
fits
are
defi
ned
as
tota
l
pro
ceed
sfr
om
the
auct
ion
for
stati
ons
that
sell,
plu
sth
ere
serv
ati
on
valu
esof
stati
ons
that
do
not
sell,
less
the
purc
hase
pri
ces
paid
by
the
firm
sfo
rth
est
ati
ons.
30

Tab
le6:
Sta
tion
Ch
ara
cte
rist
ics
for
Au
cti
on
Lic
en
ses
Bid
din
gS
trat
egy
Nai
veS
trat
egic
Lic
ense
Aver
ages
Un
sold
Sol
dU
nso
ldS
old
Bro
ad
cast
Vol
um
e(0
00s)
156.
893
214.
051
100.
554
343.
060
(2.9
20)
(8.8
53)
(4.5
44)
(18.
041)
Res
erva
tion
Val
ue
($M
)44
.959
8.84
532
.742
20.0
72(1.2
54)
(0.8
27)
(3.7
50)
(3.9
29)
Note
s:Sta
tist
ics
des
crib
eav
erages
of
stati
on
chara
cter
isti
csfo
rse
llin
gand
non-s
elling
lice
nse
sacr
oss
all
204
DM
As
and
100
auct
ion
sim
ula
tions
per
DM
A,
and
inth
eca
seof
stra
tegic
bid
din
g,
firs
tav
eraged
acr
oss
equilib
ria
for
each
auct
ion
sim
ula
tion.
Sta
ndard
erro
rsbase
don
100
sim
ula
tion
dra
ws
are
inpare
nth
eses
.
31

5.2 Case study: Philadelphia, PA
In this section we illustrate the impact of strategic bidding for a particular realization of valuations
for stations in the Philadelphia, PA repacking region. Figure 7 shows graphs of outcomes first
under naive, and then under strategic bidding. Both charts show all eligible UHF licenses in
the focal Philadelphia, PA, DMA ordered by their simulated reservation values in light gray on
the left y-axis. We further display on the second y-axis payouts in terms of base clock prices as
triangles; recall that the payout in terms of base clock maps to license-specific payouts on the left
y-axis through the broadcast volume of each license. Lastly, we display on the second y-axis the
firms’ bids in terms of base clock prices as squares. These correspond to the stations’ transformed
reservation prices and indicate the base clock price at which the station would drop out of the
auction, if it is not frozen at a higher base clock price. The first image shows the outcome under
naive bidding. In the second, we present a strategic equilibrium of this simulation where two
multi-license owners each are able to increase their own auction surplus by withdrawing one of
their licenses from the auction (these licenses are identified by strategic bids of $900, which is the
starting base clock price of the auction). Note that the withdrawal of two licenses increases payouts
for several other licenses, implying a positive spillover to those licensees, but the two firms find it
individually rational to withdraw licenses solely based on their own profit motives. Total payouts
in this DMA go from nearly $1.7 billion for 15 licenses under naive bidding to over $2.5 billion
for 16 licenses in the strategic equilibrium presented here. This example thus clearly indicates the
inefficiencies associated with strategic bidding: not only is it possible that the mix of stations that
sells in the auction is distorted (e.g., UniMas does not sell under naive bidding but does under
strategic bidding, while MyNetwork TV sells under strategic bidding but not under naive), but
strategic bidding may also result in the government needing to purchase a larger number of licenses
to reach its predetermined clearing target given the interference patterns between the stations that
are now not selling in the auction.
Appendix Figure 12 shows the precise details of these two simulations, with the naive bidding
simulation in the left column and strategic on the right. The figure shows the order in which licenses
withdraw from the auction and the base clock price at which they withdraw, labeling licenses by
their FCC Facility ID number, and including their network affiliation in parentheses. Importantly,
the figure emphasizes that we repack a large region around the DMA, by highlighting the few
licenses in the Philadelphia, PA, DMA in bold. The left column of the figure shows how major
network affiliates in large markets withdraw from the auction immediately, as starting base clock
prices are too low. For example, License #9610 is CBS New York, and it withdraws immediately
from the auction. Reading down the column, we see how licenses withdraw and how all remaining
licenses are then checked for feasibility in repacking. If a license can no longer be feasibly repacked
due to a withdrawal, its payout is frozen based on the current clock price. We only list freezes for
licenses in the focal Philadelphia, PA, DMA.
The right column of the figure shows how the strategic withdrawal of two licenses changes
the prices at which other licenses become frozen in the auction. For example, license #39884
32

Fig
ure
7:
Sam
ple
Ou
tcom
es
un
der
Naiv
ean
dS
trate
gic
Bid
din
gin
Ph
iladelp
hia
Note
s:D
ata
are
for
asi
ngle
sim
ula
tion
dra
wof
rese
rvati
on
valu
es.
Under
stra
tegic
bid
din
g,
two
stati
ons
wit
hdra
wfr
om
the
auct
ion
(eff
ecti
vel
yhav
ing
naiv
ebid
sab
ove
the
op
enin
gpri
ce).
This
rais
espay
outs
for
many
oth
erst
ati
ons
inth
ispart
icula
rsi
mula
tion.
The
stra
tegic
outc
om
esh
own
her
eis
an
equilib
rium
for
this
sim
ula
tion,
as
the
two
pri
vate
equit
yfirm
sth
at
wit
hdra
wlice
nse
sare
able
toin
crea
seth
eir
pro
fits
from
this
beh
avio
r.F
rom
the
left
,th
est
ati
ons
owned
by
NR
Jare
num
ber
s11
and
16
(Am
1and
Ind
affi
liati
ons)
,w
hile
the
ones
owned
by
Locu
sPoin
tare
inp
osi
tions
1and
17
(NB
CA
Cand
Ind
affi
liati
ons)
.
The
sim
ula
tion
takes
into
acc
ount
the
repack
ing
of
all
126
lice
nse
sin
the
Philadel
phia
repack
ing
regio
n.
33

becomes frozen by the withdrawal of license #73333 at a clock price of $298.15 in the naive bidding
simulation, but in the strategic simulation, it is frozen earlier by the withdrawal of license #63153
at a clock price of $444.89, increasing its payout by 49% even though its owner is not the firm
withdrawing licenses. The two multi-license owners who own pairs (#74464, #55305) and (#61111,
#72278), find withdrawing licenses a profitable strategy individually.34
5.3 Partial remedy
We have so far shown that strategic supply reduction may lead to increased payouts and efficiency
losses in the reverse auction. We next propose a change to the auction rules and show how it limits
the potential for rent-seeking. The model in Section 2.2 shows that strategically reducing supply
is more likely to be profitable if the increase in the closing base clock price from withholding a
license can be leveraged by selling a license with high broadcast volume into the auction. Our
proposal aims to weaken this mechanism by limiting the strategy space of multi-license owners.
In particular, we stipulate that a multi-license owner must first withdraw her highest broadcast
volume license. Once that has been withdrawn from the reverse auction, the owner may withdraw
her second highest broadcast volume license, and so on.
Table 7 shows how the rule change affects our main results. The increase in payouts from
strategic bidding are 80% less than in Table 4 at the mean. Interestingly, under this alternative
policy, the outcome under strategic bidding presented in Figure 7 for the Philadelphia, PA, DMA
would no longer involve feasible strategies since there, both firms withhold their lower broadcast
volume stations. This would thus cease to be an equilibrium outcome.
Efficiency requires that, for otherwise identical licenses, the licenses with the lowest reservation
values are sold into the auction. In the spirit of the literature on regulation where effort is not
verifiable (Laffont and Tirole, 1986), the rule change leverages the fact that broadcast volume,
unlike cash flows, is observed and contractible. Our estimates imply that broadcast volume is
positively correlated with reservation value: averaged across simulation runs the correlation is 0.47
overall and 0.44 within DMA.35 The rule change therefore mitigates efficiency losses by requiring
that licenses with higher broadcast volumes, and likely higher reservation values, are withdrawn
first from the reverse auction.
The rule change has two potential shortcomings, aside from legal considerations. First, a multi-
license owner may be able to circumvent the rule change by selectively entering her licenses into
the reverse auction in the first place. However, the rules of the auction may be further rewritten
to compel a multi-license owner to either participate with all her licenses in the auction or not at
all. Second, and perhaps more importantly, forcing lower broadcast volume licenses to sell before
34NRJ who withdraws #74464 foregoes a surplus on that license of $37.5 million = ($221.79-$106.71)*326127.3,which is the naive clock payout less reserve value measured in terms of base clock price times broadcast volume, inexchange for increasing the payout in terms of clock price for license #55305 from $221.79 to $298.15, which whenmultiplied by a broadcast volume of 570169.3 is $43.5 million. LocusPoint that withdraws #72278 loses nothing onthat license as it does not sell under naive bidding, but its withdrawal increases the payout to license #61111 by$23.8 million, by raising the freezing clock price from $72.66 to $221.79, given a broadcast volume of 159417.7.
35Within DMA correlations are averaged over 184 DMAs that have three or more stations.
34

Tab
le7:
Tota
lP
aym
ents
($B
)by
DM
AT
yp
eu
nd
er
Ru
leC
han
ge
Pay
ou
ts($
B)
un
der
:N
aive
Bid
din
gS
trat
egic
Bid
din
gP
ayou
tIn
crea
se#
DM
As
Bas
eM
ean
Min
Med
ian
Max
At
Mea
n
All
DM
As
204
16.9
9917.7
3517.0
9717.8
2618.3
434.
3%(0.7
51)
(0.7
53)
(0.7
29)
(0.8
40)
(0.8
34)
Mu
lti-
Lic
ense
Ow
ner
s12
515.6
1116.3
4715.7
0916.4
3716.9
554.
7%(0.7
18)
(0.7
15)
(0.6
94)
(0.8
06)
(0.7
98)
Tw
oor
mor
eM
ult
i-L
icen
seO
wn
ers
7214.4
1015.1
2914.4
9515.2
2015.7
345.
0%(0.7
11)
(0.7
11)
(0.6
90)
(0.7
97)
(0.7
99)
Pri
vate
Equ
ity
Act
ive
1811.9
7812.6
5612.0
3412.7
4713.2
495.
7%(0.7
04)
(0.6
98)
(0.6
88)
(0.7
79)
(0.7
90)
Note
s:D
ata
are
aver
ages
over
100
auct
ion
sim
ula
tions.
Sta
ndard
dev
iati
ons
acr
oss
100
sim
ula
tions
are
in
pare
nth
eses
.A
uct
ion
mec
hanis
mass
um
esth
at
mult
i-lice
nse
hold
ers
wit
hdra
wlice
nse
wit
hhig
hes
t
bro
adca
stvolu
me
firs
t.See
Note
sto
Table
4.
35

higher broadcast volume licenses may complicate the repacking process to the extent that licenses
with higher broadcast volume and potentially also higher interference count may no longer sell and
have to be repacked.
5.4 Multi-market strategies
Strategic bidding may extend beyond market borders if multi-license owners withhold a license in
a DMA from the reverse auction to drive up the closing base clock price in a neighboring DMA
where they also own a license. Here, we illustrate how such strategies may work continuing with the
Philadelphia, PA, case study. As mentioned above, it is not computationally feasible to consider
all multi-market strategies in a repacking region, given the prevalence of multi-license ownership
and the need to simulate over uncertainty in reservation values.
In late 2012 NRJ purchased WGCB-TV in the Harrisburg, PA, DMA for $9 million. While
NRJ owns no other TV stations in the Harrisburg, PA, DMA the firm had previously purchased
WTVE and WPHY in the Philadelphia, PA, DMA in late 2011 and early 2012 for $30.4M and
$3.5M respectively. WGCB-TV has a very high interference count and may interfere with 161
stations in the repacking process. A closer look shows that WGCB-TV is not actually located in
Harrisburg, PA, but in Red Lion, PA, towards both the Philadelphia, PA, and Baltimore, MD,
DMAs. Figure 8 shows how the broadcast contours of WGCB-TV and WTVE overlap. Hence, if
NRJ withdraws WGCB-TV from the reverse auction, this may sufficiently complicate the repacking
process to increase demand in the Philadelphia, PA, DMA, and potentially other DMAs.
Table 8 shows the effect on payouts in the Philadelphia, PA, focal DMA of allowing NRJ to
bid its license to WGCB-TV strategically in concert with its licenses in the Philadelphia, PA,
DMA. We continue to assume that all remaining multi-license owners in the Philadelphia, PA,
DMA, to the extent that they own licenses outside that focal market, consider strategic bidding for
their Philadelphia stations only. From a practical perspective, this relocates the license of WGCB-
TV from the Harrisburg DMA to the Philadelphia DMA for ownership purposes without actually
relocating the broadcast tower. This change alone increases the number of strategy profiles to
consider from 729 to 1701 for each simulation draw.
The first row in Table 8 shows Philadelphia’s results from our main results in Table 4. The
first and second rows show that the partial remedy proposed in Section 5.3 is very effective in this
DMA. The third row shows that total payouts can increase dramatically in this DMA if NRJ bids
its Harrisburg license strategically. The fourth row shows that the partial remedy is no longer
particularly effective in this situation, suggesting that our above estimate is likely an upper bound
of the true degree to which the remedy would restrain the extent to which strategic bidding can
influence payouts.
Note that all payouts in the table exclude any payout to WGCB-TV, so they are directly
comparable across scenarios. In particular, one can see that having an additional strategic lever is
valuable in the tail end of equilibrium payouts in this case study.
More generally, cross-market ownership can be seen as positive for the auction, as selling licenses
36

Figure 8: Multi-Market Strategy in the Mid-Atlantic
Notes: Map plots reception contours from FCC TV Query database for WGCB-TV (Harrisburg) in red
and WTVE (Philadelphia) in blue. Contour plots reflect reception of DTV signals from the broadcast
towers. Image via Google Maps.
should be complementary across markets if it allows a larger clearing target to be attained. However,
in this context, it has the potential to be negative if withdrawing WGCB-TV from the auction
sufficiently complicates repacking in Philadelphia: NRJ may find it worthwhile to withdraw WGCB-
TV from the auction if either the proceeds from selling WGCB-TV are low, or if NRJ’s increase in
profits from its Philadelphia licenses is large.
5.5 Partial participation
So far, we have conservatively assumed full participation on behalf of all eligible UHF licensees.
We now consider what payouts may be under reduced participation. In particular, the results in
Table 9 show total payouts when we assume that across simulation draws, both a) none of the
religious stations participate, and b) a random subset of 50% of non-commercial stations does not
participate, for a total of 253 non-participating licenses in each simulation draw. The results high-
light how important full participation is to the auction’s success. First, limited participation makes
the failure of the auction significantly more likely, as all of the licenses in the non-participating
group, and any other stations that were identified as participating but that have reservation values
in terms of the base clock price above the auction’s starting point, need to be repacked for the
auction to even be able to start. This means that in 4.2% of all 20,400 naive bidding simulations
under reduced participation, the auction immediately concluded as a failure, which never occurred
under full participation. It is immediately clear that low participation - before any strategic with-
drawal of licenses - can have dramatic effects on payouts, nearly doubling them. The first row of
37

Tab
le8:
Case
Stu
dy:
Ph
ilad
elp
hia
PA
DM
AM
ult
i-M
ark
et
Str
ate
gy
Pay
ou
ts($
B)
un
der
:N
aive
Bid
din
gS
trat
egic
Bid
din
gP
ayou
tIn
crea
seB
ase
Mea
nM
inM
edia
nM
axA
tM
ean
Ph
ilad
elp
hia
,B
ase
Case
2.1
722.
481
2.32
02.
499
2.61
414
.2%
(0.2
41)
(0.4
66)
(0.4
50)
(0.5
48)
(0.6
37)
Ph
ilad
elp
hia
,B
ase
Cas
e,R
emed
y2.1
722.
215
2.18
92.
223
2.23
12.
0%(0.2
41)
(0.2
94)
(0.2
44)
(0.3
28)
(0.3
33)
Ph
ilad
elp
hia
,N
RJ
Str
ateg
icw
ith
WG
CB
-TV
2.1
724.
065
2.14
13.
995
6.19
087
.2%
(0.2
41)
(0.2
01)
(0.3
22)
(0.2
58)
(0.5
25)
Ph
ilad
elp
hia
,N
RJ
Str
ate
gic
wit
hW
GC
B-T
V,
2.1
723.
803
2.17
23.
824
5.61
475
.1%
Rem
edy
(0.2
41)
(0.2
91(0.2
41)
(0.3
18)
(0.4
26)
Note
s:See
note
sto
Table
4.
We
dep
ict
tota
lpay
outs
under
NR
Jbid
din
gall
of
its
lice
nse
sin
the
Philadel
phia
repack
ing
regio
nst
rate
gic
ally
inth
eth
ird
and
fourt
hro
ws.
Pay
outs
inro
ws
3and
4do
not
incl
ude
any
pay
men
tsto
WG
CB
-TV
.
38

Table 9: Naive Outcomes under Reduced Participation
Payouts ($B) under: Naive Bidding Payout Increase from# DMAs Full Participation Limited Limited Participation
All DMAs, No-Fail Simulations 204 16.999 33.869 99.2%(0.751) (2.005)
No-Fail Positive Payout DMAs 45 5.545 10.341 86.5%(0.265) (0.867)
Notes: Data are averages over 100 auction simulations. Standard deviations across 100 simulations are in
parentheses. Limited participation means that no religious stations participate (108 licenses) and that a
random subset of 50% non-commercial stations do not participate (145 additional licenses). The “All
DMAs” row is conditional on auction non-failure. “No-Fail Positive Payout DMAs” is a set of markets that
always see positive payouts, yet never see the auction fail across 100 simulations.
Table 9 shows that, conditional on the auction not failing, payouts would effectively double due to
non-participation by religious and some non-commercial licensees. To avoid comparing subsets of
simulation draws from different markets, the second row limits the sample to DMAs that always
see strictly positive payouts and yet never see auction failure under lowered participation; the effect
is nearly as dramatic, with an 86.5% increase in payouts.
The fact that the mechanism is sensitive to participation leads us to a second recommendation.
The likely reason many small broadcasters would choose to remain on-air relates to “must-carry”
provisions in FCC regulations. While the regulations are fairly complex, they stipulate that a large
cable operator must carry any and all local broadcast stations, unless such a station has opted-
out and requested retransmission fees.36 Therefore, continuing to broadcast guarantees that many
small licenses will be carried on cable, which greatly broadens their reach or potential advertising
audience. One simple measure to increase participation, therefore, would be to allow broadcasters
to relinquish their spectrum licenses but retain their must-carry status, so that they can continue
to operate as businesses and reach viewers through cable systems.
5.6 Robustness of Repacking Approach
Here, we consider the effect of how our simulations limit repacking on outcomes. Our main results
for both naive and strategic bidding rely on simulations that do not assert the feasibility of repacking
of licenses outside the focal DMA, but instead assume that these licenses withdraw or are frozen
at the same time as when we assert feasibility for all stations in the entire region under naive
bidding. A more complete but computationally intensive analysis of strategic bidding would assert
feasibility for all regional licenses to determine at which points licenses withdraw or are frozen in
the auction under each strategy profile, in effect treating all licenses in the region as if they were
in the focal DMA. We denote the full analysis of bidding by all stations in the repacking region
36Any cable operator offering more than 12 channels must set aside one-third of their channel capacity for localcommercial broadcasters. Any cable operator offering more than 36 channels must carry all non-commercial andeducational broadcasters.
39

Table 10: Naive Outcomes under Robust Repacking
Payouts ($B) under: Naive Bidding
All DMAs 16.9994(0.7513)
All DMAs, 16.9655Robust Repacking (0.7330)
Notes: Data are averages over 100 auction simulations. Standard deviations across 100 simulations are in
parentheses. Robust repacking implies that payouts and feasibility were computed and asserted for all
licenses in the region, as opposed to only the focal DMA.
as “robust repacking” in the following. To assess the implication of our simplification, we perform
two exercises. First, we compare our naive repacking results to naive robust repacking results for
all DMA markets; second, we compare our strategic repacking results to strategic robust repacking
results for two important DMAs.
We first compare naive bidding outcomes when we robustly assert feasibility for all licenses in
the region to the above outcomes when assuming that licenses outside the focal DMA are frozen
or repacked at the same point in the auction as occurs under robust repacking, without explicitly
asserting feasibility. The latter simplified repacking procedure greatly decreases the computational
burden by more than an order of magnitude. Table 10 shows the results for all DMAs. The
assumption has a very limited effect on payouts under naive bidding, with robust repacking reducing
total payouts by just under 0.2%. In addition, the correlation between payouts in all 20,400
simulations is 0.9997.
We then consider how strategic bidding outcomes would change if we continued to account for
feasibility of all licenses in the region, instead of only those licenses in the focal DMA. To assess
these issues, we simulated the robust regional repacking for all strategy profiles for the New York,
NY, (729 strategy profiles for each simulation draw) and Washington, DC, (189 strategy profiles
for each simulation draw) DMAs, as doing so for all DMAs would not be computationally feasible.
Note that while we thus treat all licenses in the region as though they were part of the focal
DMA for repacking purposes, we continue to assume that strategic bidding occurs only between
licenses within the focal DMA, but not between all licenses a firm owns across the full repacking
region. Table 11 shows the results of this exercise, and affirms that the impact of the repacking
simplification on strategic outcomes is very small. Our intuition is that robust repacking is more
flexible and so leads to lower payouts, although the results in these two markets suggest that the
impact is negligible.
6 Conclusions
In this paper we explore ownership concentration as a means to seek rents in the context of the
U.S. government’s acquisition of broadcast TV licenses in the ongoing incentive auction. Ownership
concentration is an important policy concern as the FCC has worried about encouraging a healthy
40

Tab
le11:
Str
ate
gic
Ou
tcom
es
un
der
Rob
ust
Rep
ack
ing
Pay
outs
($B
)u
nd
er:
Tota
lN
aive
Bid
din
gS
trat
egic
Bid
din
gP
ayou
tIn
crea
seS
imu
lati
on
sB
ase
Mea
nM
inM
edia
nM
axA
tM
ean
New
York
,N
Y72,9
00
2.3
633.
086
2.36
33.
096
3.89
330
.6%
(0.2
16)
(0.2
95)
(0.2
16)
(0.3
30)
(1.0
13)
New
Yor
k,
NY
72,9
002.3
633.
086
2.36
33.
095
3.89
330
.6%
Rob
ust
Rep
ackin
g(0.2
16)
(0.2
96)
(0.2
16)
(0.3
30)
(1.0
13)
Wash
ingt
on
,D
C18,9
000.2
900.
327
0.31
70.
328
0.33
812
.9%
(0.0
71)
(0.0
65)
(0.0
63(0.0
67)
(0.0
85)
Wash
ingt
on
,D
C18,9
000.2
900.
326
0.31
60.
327
0.33
712
.9%
Rob
ust
Rep
ackin
g(0.0
71)
(0.0
65)
(0.0
63)
(0.0
66)
(0.0
084)
Note
s:M
om
ents
of
the
pay
out
dis
trib
uti
on
are
calc
ula
ted
acr
oss
all
poss
ible
equilib
ria
for
agiv
ensi
mula
ted
auct
ion
and
then
aver
aged
over
100
auct
ion
sim
ula
tions.
Sta
ndard
dev
iati
ons
of
the
mom
ents
acr
oss
the
100
sim
ula
tions
are
inpare
nth
eses
.R
obust
repack
ing
implies
that
pay
outs
and
feasi
bilit
yw
ere
com
pute
d
and
ass
erte
dfo
rall
lice
nse
sin
the
regio
n,
as
opp
ose
dto
only
the
foca
lD
MA
.P
ayout
incr
ease
per
centa
ges
are
com
pute
dw
ith
full
pre
cisi
on
and
som
aynot
corr
esp
ond
tova
lues
com
pute
dfr
om
this
table
.
41

supply of licenses in the reverse auction and has viewed outside investors as more likely to part
with their licenses than potentially “sentimental” owners. Our prospective analysis shows that this
is likely to give rise to strategic supply reduction and raise the cost of acquiring spectrum.
In particular, we argue that firms may engage in rent-seeking by attempting to reduce supply
of broadcast TV licenses in the reverse auction. We conduct a large-scale valuation exercise for all
UHF auction-eligible broadcast licenses in order to highlight the potential for strategic supply re-
duction and quantify the resulting increases in payouts and efficiency losses. The effect of ownership
concentration can be substantial, and this paper is the first attempt to quantify this effect.
For the auction’s initial clearing target of 126MHz, on which we base the simulations in this
paper, the first stage of the reverse auction resulted in a spectrum acquisition cost of $86.4B, far
exceeding the revenue the FCC was able to realize in the forward auction, a total of only $23.1B.
Our base specification shows instead payouts of only roughly $17B in the reverse auction, which
would have been low enough to end the incentive auction after the first stage.
While the goal of our paper is not to attempt to predict the exact reverse auction outcome,
our broad findings indicate that it is likely that both participation below 100% and strategic
bidding may have contributed to the failure to clear the opening target. Our results in Section
5.5 suggest that participation of less than 50% of eligible noncommercial stations nearly doubles
spectrum acquisition costs, even in the absence of any strategic bidding. Strategic supply reduction,
even when constrained to licenses in the same DMA market, increases broadcaster payouts by
22%, on average, as we show in Section 5.1. In a case study of cross-market strategic supply
reduction, as would have likely taken place in the auction itself, payouts due to strategic bidding
increased by a much more significant 87.2%. While computational constraints do not allow us to
investigate whether the particular Philadelphia case study is representative of the effect of cross-
market strategic supply reduction in other DMAs, the results in Section 5.4 suggest that our baseline
strategic supply reduction effects are likely a lower bound on the true extent of rent seeking that
could arise in the auction due to multi-license ownership.
The execution of the incentive auction, the most novel auction designed since the inception of
spectrum auctions, is an incredibly difficult task that, based on current indications, has been very
successfully tackled. We do not take a stand on whether any specific action would have altered the
bidding results in the reverse auction. For example, it is impossible for us to assess whether full
participation could ever have been achieved. We hope nevertheless that our work proves useful in
designing future auctions geared at repurposing spectrum toward more efficient use.
42
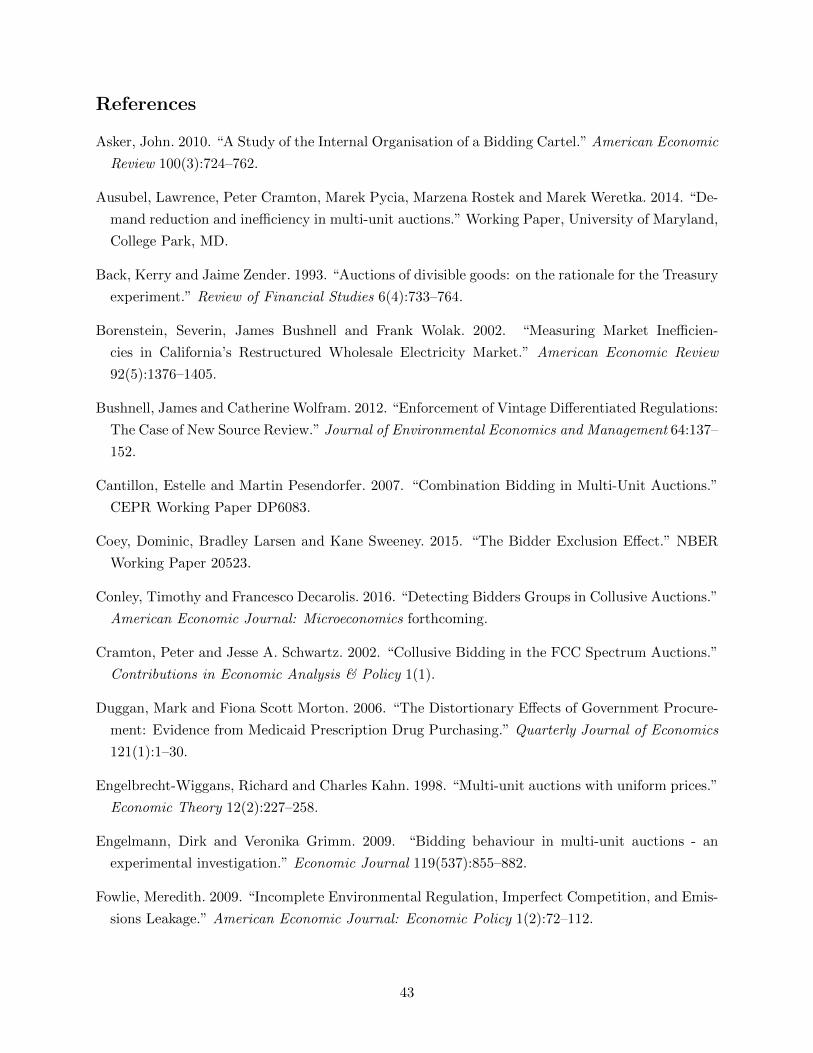
References
Asker, John. 2010. “A Study of the Internal Organisation of a Bidding Cartel.” American Economic
Review 100(3):724–762.
Ausubel, Lawrence, Peter Cramton, Marek Pycia, Marzena Rostek and Marek Weretka. 2014. “De-
mand reduction and inefficiency in multi-unit auctions.” Working Paper, University of Maryland,
College Park, MD.
Back, Kerry and Jaime Zender. 1993. “Auctions of divisible goods: on the rationale for the Treasury
experiment.” Review of Financial Studies 6(4):733–764.
Borenstein, Severin, James Bushnell and Frank Wolak. 2002. “Measuring Market Inefficien-
cies in California’s Restructured Wholesale Electricity Market.” American Economic Review
92(5):1376–1405.
Bushnell, James and Catherine Wolfram. 2012. “Enforcement of Vintage Differentiated Regulations:
The Case of New Source Review.” Journal of Environmental Economics and Management 64:137–
152.
Cantillon, Estelle and Martin Pesendorfer. 2007. “Combination Bidding in Multi-Unit Auctions.”
CEPR Working Paper DP6083.
Coey, Dominic, Bradley Larsen and Kane Sweeney. 2015. “The Bidder Exclusion Effect.” NBER
Working Paper 20523.
Conley, Timothy and Francesco Decarolis. 2016. “Detecting Bidders Groups in Collusive Auctions.”
American Economic Journal: Microeconomics forthcoming.
Cramton, Peter and Jesse A. Schwartz. 2002. “Collusive Bidding in the FCC Spectrum Auctions.”
Contributions in Economic Analysis & Policy 1(1).
Duggan, Mark and Fiona Scott Morton. 2006. “The Distortionary Effects of Government Procure-
ment: Evidence from Medicaid Prescription Drug Purchasing.” Quarterly Journal of Economics
121(1):1–30.
Engelbrecht-Wiggans, Richard and Charles Kahn. 1998. “Multi-unit auctions with uniform prices.”
Economic Theory 12(2):227–258.
Engelmann, Dirk and Veronika Grimm. 2009. “Bidding behaviour in multi-unit auctions - an
experimental investigation.” Economic Journal 119(537):855–882.
Fowlie, Meredith. 2009. “Incomplete Environmental Regulation, Imperfect Competition, and Emis-
sions Leakage.” American Economic Journal: Economic Policy 1(2):72–112.
43

Fox, Jeremy and Patrick Bajari. 2013. “Measuring the Efficiency of an FCC Spectrum Auction.”
American Economic Journal: Microeconomics 5(1):100–146.
Goeree, Jacob, Theo Offerman and Randolph Sloof. 2013. “Demand reduction and preemptive
bidding in multi-unit license auctions.” Experimental Economics 16(1):52–87.
Goolsbee, Austan. 2000. “What Happens When You Tax the Rich? Evidence from Executive
Compensation.” Journal of Political Economy 108(2):352–378.
Grimm, Veronika, Frank Riedel and Elmar Wolfstetter. 2003. “Low price equilibrium in multi-
unit auctions: the GSM spectrum auction in Germany.” International Journal of Industrial
Organization 21(10):1557–1569.
Hortacsu, Ali and Steven Puller. 2008. “Understanding strategic bidding in multi-unit auctions: a
case study of the Texas electricity spot market.” The RAND Journal of Economics 39(1):86–114.
Jun, Byoung and Elmar Wolfstetter. 2004. “Signaling equilibria in a multi-unit English clock
auction.” Working Paper, Korea University, Seoul.
Kagel, John and Dan Levin. 2001. “Behavior in multi-unit demand auctions: experiments with
uniform price and dynamic Vickrey auctions.” Econometrica 69(2):413–454.
Kawai, Kei and Jun Nakabayashi. 2015. “Detecting Large-Scale Collusion in Procurement Auc-
tions.” Working paper, UC Berkeley, Berkeley, CA.
Laffont, Jean-Jacques and Jean Tirole. 1986. “Using Cost Observation to Regulate Firms.” Journal
of Political Economy 94(3):614–641.
List, John and David Lucking-Reiley. 2000. “Demand reduction in multiunit auctions: evidence
from a sportscard field experiment.” American Economic Review 90(4):961–972.
Menezes, Flavio. 1996. “Multiple-unit English auctions.” European Journal of Political Economy
12(4):671–684.
Milgrom, Paul and Ilya Segal. 2014. “Deferred-acceptance auctions and radio spectrum realloca-
tion.” Working Paper, Stanford University, Stanford, CA.
Milgrom, Paul, Lawrence Ausubel, Jon Levin and Ilya Segal. 2012. “Incentive auction rules option
and discussion.” Working Paper, Stanford University, Stanford, CA.
Oyer, Paul. 1998. “Fiscal Year Ends and Nonlinear Incentive Contracts: The Effect on Business
Seasonality.” Quarterly Journal of Economics 113(1):149–185.
Porter, Robert and Douglas Zona. 1993. “Detection of Bid Rigging in Procurement Auctions.”
Journal of Political Economy 101(3):518–538.
44

Riedel, Frank and Elmar Wolfstetter. 2006. “Immediate demand reduction in simultaneous
ascending-bid auctions: a uniqueness result.” Economic Theory 29:721–726.
Weber, Robert. 1997. “Making more from less: strategic demand reduction in the FCC spectrum
auctions.” Journal of Economics and Management Strategy 6(3):529–548.
Wilson, Robert. 1979. “Auctions of shares.” Quarterly Journal of Economics 93(47):675–689.
Wolfram, Catherine. 1998. “Strategic Bidding in a Multiunit Auction: An Empirical Analysis of
Bids to Supply Electricity in England and Wales.” The RAND Journal of Economics 29(4):703–
725.
45

A Appendix: Data
A.1 Sample construction and primary variables
In this appendix, we describe how we construct the sample of DMAs and TV stations used and
discuss several details of the data sources we rely on. Our objective is to infer a TV station’s reser-
vation value going into the auction from its cash flow or population coverage scaled the appropriate
multiple. While the auction is scheduled for March 2016, we infer a TV station’s reservation value
as of 2012 as the latest year of availability for both the BIA and NAB data. Our analysis is further
made difficult by the fact that different data sources cover different TV stations.
A.1.1 DMAs
The U.S. is divided into 210 DMAs. DMAs are ranked annually according to market size as
measured by the total number of homes with at least one television (henceforth, TV households,
measured in thousand). Table 12 lists the top ten DMAs in 2012 along with some characteristics
from the BIA data.
Table 12: Top Ten DMAs (2012)
Rank DMA TV Households Station Count Income ($)
1 New York, NY 7,388 19 49,5182 Los Angeles, CA 5,570 24 36,9723 Chicago, IL 3,493 18 40,5004 Philadelphia, PA 2,993 19 42,0345 Dallas-Ft. Worth, TX 2,571 17 37,2156 San Francisco-Oakland-San Jose, CA 2,507 18 53,4487 Boston, MA 2,380 16 48,2948 Washington, DC 2,360 11 49,4959 Atlanta, GA 2,293 13 33,72610 Houston, TX 2,185 14 40,704
Notes: Includes all auction-eligible commercial full-power and low-power (class-A) TV stations.
Income is average per capita disposable personal income. Source: BIA.
A.1.2 TV stations
Table 13 shows counts of auction-eligible TV stations as of 2012, broken down by power output,
type of use, and type of service. There are a total of 2,166 auction-eligible TV stations. We focus
on the 1,672 UHF stations that the FCC includes in its repacking simulations.
A.1.3 BIA data
After restricting to full-power (primary and satellite) and low-power (class-A) stations, the BIA data
provides us with 24,341 station-year observations from 2003 to 2013. Commercial stations make up
19,595 observations and non-commercial stations, including dark stations, for 4,746 observations.
46

Table 13: TV station counts by power output and type of use and service (2012)
Type of Use and ServiceCommercial Non-commercialUHF VHF UHF VHF UHF VHF Total
Full-powerPrimary 950 292 281 104 1,231 396 1,627Satellite 57 55 0 0 57 55 112
Low-power (Class-A) 376 42 8 1 384 43 427
Total 1,772 394 1,672 494 2,166
Notes: Only stations that are eligible for participation in the incentive auction included. Primary
stations denote the owner’s main station in the DMA. Satellite stations are full-power relay
stations re-broadcasting for the primary stations. Non-commercial stations carry educational or
public broadcast programming.
For commercial stations, advertising revenue is missing for 6,058, or 30.9%, station-year obser-
vations. Table 14 shows the share of station-year observations with missing advertising revenue
for commercial stations. Advertising revenue is missing for almost all satellite stations because
BIA subsumes a satellite’s advertising revenue into that of its parent primary station.37 Miss-
ing values are further concentrated among low-power (Class-A) stations, among stations affiliated
with Spanish-language networks (Azteca America, Independent Spanish, Telemundo, Unimas, and
Univision) and other minor networks, and among independent stations. There are no discernible
patterns in missing values along other dimensions of the data such as the market size.
We impute advertising revenue for commercial stations where it is missing by regressing the log
of advertising revenue (in $ thousand) lnADjt on station, owner, and market characteristics Xjt.
We run this regression separately for each year from 2003 to 2013 and use it to predict advertising
revenue ADjt. We include in Xjt the log of the station’s population coverage (in thousand), an
indicator for whether the TV station has multicast sub-channels, power output fixed effects (primary
and class-A), fixed effects for the eleven affiliations in Table 14, fixed effects for the interaction of
affiliation groups (see Section A.2.1) with U.S. states, an indicator for whether the owner owns more
than one TV station in the same DMA, ownership category fixed effects (whether the owner owns
one, between two and ten, or more than ten TV stations across DMAs), the number of TV stations
in the DMA, the number of major network affiliates in the DMA, the wealth and competitiveness
indices for the DMA (see Section A.2.1), and the log of the number of TV households (in thousand)
in the DMA. Finally, we account for the contribution of any satellite stations to advertising revenue
by including in Xjt the number of satellite stations that belong to the primary station NSATjt .The
adjusted R2 is 0.99 in all years in logs and 0.75 on average in levels, suggesting that we capture
most of the variation in advertising revenue across stations and years.
37We enforce this convention for the 36 station-year observations where a satellite has non-missing advertisingrevenue. We manually link satellite stations to their parent primary stations because BIA does not provide thisinformation. The 114 satellite stations in Table 13 belong to 80 primary stations.
47

With the estimates in hand, we predict advertising revenue ADjt as ADjt = elnADjt+ σ2
2 to
account for the non-zero mean of the log-normally distributed error term with estimated variance
σ2. We proceed as follows: First, for a primary station we impute advertising revenue ADjt where
missing as ADjt. Second, we compute the contribution of satellite stations (if any) to the advertising
revenue of their parent primary station as ADjt −ADjt/eβSATN
SATjt , where βSAT is the estimated
coefficient for the number of satellite stations. For a primary station we net out the contribution of
satellite stations by replacing advertising revenue ADjt with ADjt/eβSATN
SATjt . Third, for a satellite
station we impute advertising revenue ADjt by allocating the contribution of satellite stations to
the advertising revenue of their parent primary station in proportion to the population coverage of
the satellite stations.
Table 14: Missing advertising revenue for commercial stations
Missing advertising revenueStation-year
countStation-year count %
Full-powerPrimary 13,490 937 6.95Satellite 1,252 1,216 97.12
Low-power (Class-A) 4,853 3,905 80.47
Major networksABC 2,497 420 16.82CBS 2,423 314 12.96Fox 2,272 318 14.00NBC 2,445 376 15.38
Minor networksCW 850 99 11.65MyNetwork TV 745 133 17.85United Paramount 269 37 13.75Warner Bros 267 24 8.99Spanish-language networks 1,747 563 32.23Other 3,159 1,781 56.38
Independent 2,921 1,993 68.23
Total 19,595 6,058 30.92
Notes: United Paramount and Warner Bros merged in 2006 to form CW. Spanish-language
networks include Azteca America, Telemundo, Univision, UniMas, and Independent Spanish
stations.
A.1.4 NAB data
NAB collects detailed financial information for commercial full-power stations. In 2012, NAB
received 785 responses on 1,288 originated questionnaires, corresponding to a response rate of
60.9%.
NAB reports the data at various levels of aggregation. Table 15 shows the resulting 66 tables
48

for 2012.38 The number of tables fluctuates slightly year-by-year because NAB imposes a minimum
of ten TV stations per aggregation category to ensure confidentiality.39 Note that a TV station
may feature in more than one table. For example, WABC-TV is the ABC affiliate in New York,
NY. Its data is used in calculating statistics for (1) markets of rank 1 to 10; (2) major network
affiliates; (3) all ABC affiliates; and (4) ABC affiliates in markets with rank 1 to 25.
For each aggregation category, NAB reports the mean, 1st, 2nd, and 3rd quartiles for cash
flow and detailed revenue source categories. We define non-broadcast revenue as the sum of total
trade-outs and barter, multicast revenue, and other broadcast related revenue. We further define
advertising revenue as the sum of local, regional, national, and political advertising revenues, com-
missions, and network compensations. Because we do not observe correlations between the detailed
revenue source categories, we can construct the mean of non-broadcast revenue and advertising rev-
enue but not the quartiles. We present sample moments of cash flow and non-broadcast revenue
for select aggregation categories in Table 16.40
A.2 Cash flows
A.2.1 Functional forms
We parameterize α (Xjt;β), RT (Xjt; γ), and F (Xjt; δ) as a function of station and market char-
acteristics Xjt as
α (Xjt;β) =9∑
a=1
βa0I(Affiliationjt = a) +2012∑s=2003
βs0I(t = s) + β1Foxjt · t+ β2CompIndexjt,
RT (Xjt; γ) = exp (γ0 + γ1t+ γ2 ln(MktSizejt)) ,
F (Xjt; δ) =δ0 + δ1WealthIndexjt +
3∑h=1
I(Groupjt = h) ·(δh2 ln(MktSizejt) + δh3 ln(MktSizejt)
2),
where I (·) is the indicator function. Affiliationjt refers to nine of the eleven affiliations41 in
Table 14 and Groupjt to groupings of affiliations (detailed below). MktSizejt is the number of TV
households in the DMA and WealthIndexjt and CompIndexjt are the wealth and competitiveness
indices for the DMA.42
38We exclude 15 aggregation categories that are defined by total revenue from each year’s NAB report because theBIA data is restricted to advertising revenue.
39Some years, in particular, break out United Paramount and Spanish-language networks but not other minornetworks. We conclude that the response rate of other minor networks is very low and thus exclude other minornetworks from most of the subsequent analysis.
40To validate the data, we compare the mean of advertising revenue from the NAB data to suitably averagedadvertising revenue from the BIA data. The resulting 662 pairs of means from the two data sources exhibit acorrelation of 0.92.
41We normalize the parameter on the indicator for Spanish-language networks to zero. We exclude any TV stationaffiliated with other minor networks from the estimation, see footnote 39. To predict the cash flow for such a TVstation from our parameter estimates, we use its station and owner characteristics Xjt and the parameter on theindicator for Independent.
42To parsimoniously capture market characteristics, we conduct a principal component analysis of the market-level variables prime-age (18-54) population, average disposable income, retail expenditures, advertising revenues,
49

Table 15: NAB Tables (2012)
Table Description Table Description
1 All Stations, All Markets 34 ABC, CBS, FOX, NBC, Markets 176+2 All Stations, Markets 1-10 35 ABC, All Markets3 All Stations, Markets 11-20 36 ABC, Markets 1-254 All Stations, Markets 21-30 37 ABC, Markets 26-505 All Stations, Markets 31-40 38 ABC, Markets 51-756 All Stations, Markets 41-50 39 ABC, Markets 76-1007 All Stations, Markets 51-60 40 ABC, Markets 101+8 All Stations, Markets 61-70 41 CBS, All Markets9 All Stations, Markets 71-80 42 CBS, Markets 1-2510 All Stations, Markets 81-90 43 CBS, Markets 26-5011 All Stations, Markets 91-100 44 CBS, Markets 51-7512 All Stations, Markets 101-110 45 CBS, Markets 76-10013 All Stations, Markets 111-120 46 CBS, Markets 101+14 All Stations, Markets 121-130 47 FOX, All Markets15 All Stations, Markets 131-150 48 FOX, Markets 1-5016 All Stations, Markets 151-175 49 FOX, Markets 51-7517 All Stations, Markets 176+ 50 FOX, Markets 76-10018 ABC, CBS, FOX, NBC, All Markets 51 FOX, Markets 101+19 ABC, CBS, FOX, NBC, Markets 1-10 52 NBC, All Markets20 ABC, CBS, FOX, NBC, Markets 11-20 53 NBC, Markets 1-2521 ABC, CBS, FOX, NBC, Markets 21-30 54 NBC, Markets 26-5022 ABC, CBS, FOX, NBC, Markets 31-40 55 NBC, Markets 51-7523 ABC, CBS, FOX, NBC, Markets 41-50 56 NBC, Markets 76-10024 ABC, CBS, FOX, NBC, Markets 51-60 57 NBC, Markets 101+25 ABC, CBS, FOX, NBC, Markets 61-70 58 CW, All Markets26 ABC, CBS, FOX, NBC, Markets 71-80 59 CW, Markets 1-2527 ABC, CBS, FOX, NBC, Markets 81-90 60 CW, Markets 26-5028 ABC, CBS, FOX, NBC, Markets 91-100 61 CW, Markets 51-7529 ABC, CBS, FOX, NBC, Markets 101-110 62 MNTV, All Markets30 ABC, CBS, FOX, NBC, Markets 111-120 63 MNTV, Markets 1-5031 ABC, CBS, FOX, NBC, Markets 121-130 64 MNTV, Markets 51+32 ABC, CBS, FOX, NBC, Markets 131-150 65 Independent, All markets33 ABC, CBS, FOX, NBC, Markets 151-175 66 Independent, Markets 1-25
Notes: Data comes from NAB annual directory for 2012. Market numbers refer to a market’s rank
in terms of size. NAB rules prohibit aggregation when there are too few respondents in a
particular grouping, which determines the market size ranges. Tables with total revenue breakouts
are excluded.
50

Table 16: Sample moments for cash flow and non-broadcast revenue for select aggre-gation categories (2012)
Cash Flow ($ million) Non-broadcastPercentile Revenue ($ million)
Mean 25th 50th 75th Mean
All Stations 7.798 1.243 3.752 9.178 2.977All Stations, Markets 101-110 4.120 1.704 3.619 6.444 2.102All Major Affiliates 9.244 1.936 4.929 10.901 3.326ABC Affiliates, Markets 1-25 32.400 15.090 27.150 42.460 7.596NBC Affiliates, Markets 101+ 3.652 1.293 3.283 5.901 1.883All CW Affiliates 3.929 0.355 1.798 3.224 2.884MyNetwork TV Affiliates, Markets 1-50 3.124 1.270 1.799 3.215 2.507All Independent Stations 2.786 -0.020 1.288 4.327 2.195
Notes: Data comes from NAB annual directory for 2012. A select few categories are reported (see
Table 15 for all categories). Non-broadcast revenues are constructed as the sum of total trade-outs
and barter, multicast revenues, and other broadcast related revenues. We thus only obtain the
mean as we lack information on the correlations of the respective distributions.
We allow the share α (Xjt;β) of advertising revenue retained as cash flow to vary flexibly by year
and network affiliation. We allow for a separate time trend for Fox affiliates as their profitability
grew substantially over time. The competitiveness index CompIndexjt accounts for differences in
the competitive environment across DMAs.
We specify RT (Xjt; γ) as an exponential function of a time trend and market size in light of
the rapid growth of retransmission fees. We make no attempt to separately estimate an error term
for non-broadcast revenue and assume it is one part of εjt in equation 6 due to additivity.43
Lastly, we let fixed cost F (Xjt; δ) vary flexibly with market size and the network affiliation. To
streamline the specification, we subsume the affiliations in Table 14 into three groups with similar
cost structures: (1) ABC, CBS, and NBC; (2) Fox, CW, and Warner Bros; (3) My Network TV,
United Paramount, Spanish-language networks, and Independents. We include the wealth index
WealthIndexjt in the fixed cost to reflect the differential cost of operating in different DMAs.
A.2.2 Data
We combine the station-level data on advertising revenue from BIA with the aggregated data from
NAB. The NAB data yields 3,313 moments across aggregation categories and the years from 2003
to 2012 as shown in Table 18.44 There are a total of 11,801 station-year observations from the BIA
data that meet NAB’s data collection and reporting procedure and therefore map into a table of a
number of primary TV stations, and number of major network affiliates. The first principal component, denoted asCompIndexjt, loads primarily on to prime-age population, advertising revenues, number of primary TV stations, andnumber of major network affiliates. The second principal component, denoted as WealthIndexjt loads primarily onto average disposable income and retail expenditures.
43We obtain very similar estimates when we separately estimate such an error term.44We drop the year 2013 from the BIA data as 2012 is the latest year of availability for the NAB data. We further
drop TV stations affiliated with other minor networks from the BIA data, see footnotes 39 and 41.
51
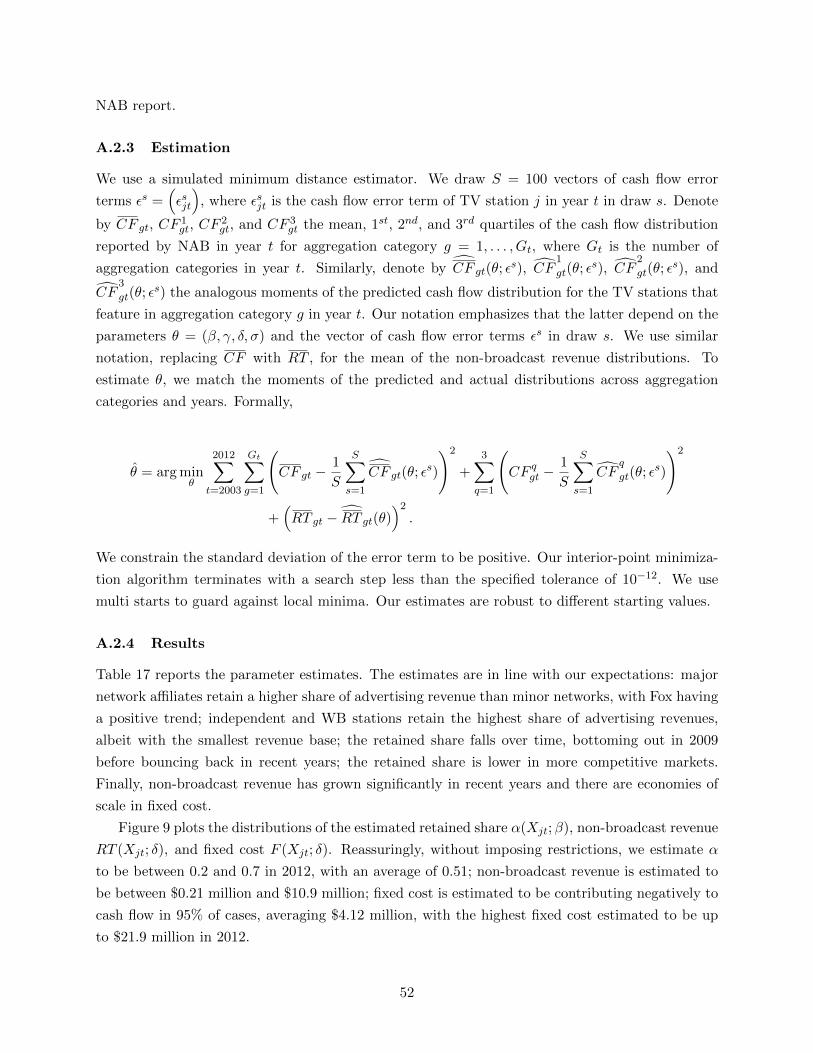
NAB report.
A.2.3 Estimation
We use a simulated minimum distance estimator. We draw S = 100 vectors of cash flow error
terms εs =(εsjt
), where εsjt is the cash flow error term of TV station j in year t in draw s. Denote
by CF gt, CF1gt, CF
2gt, and CF 3
gt the mean, 1st, 2nd, and 3rd quartiles of the cash flow distribution
reported by NAB in year t for aggregation category g = 1, . . . , Gt, where Gt is the number of
aggregation categories in year t. Similarly, denote by CF gt(θ; εs), CF
1
gt(θ; εs), CF
2
gt(θ; εs), and
CF3
gt(θ; εs) the analogous moments of the predicted cash flow distribution for the TV stations that
feature in aggregation category g in year t. Our notation emphasizes that the latter depend on the
parameters θ = (β, γ, δ, σ) and the vector of cash flow error terms εs in draw s. We use similar
notation, replacing CF with RT , for the mean of the non-broadcast revenue distributions. To
estimate θ, we match the moments of the predicted and actual distributions across aggregation
categories and years. Formally,
θ = arg minθ
2012∑t=2003
Gt∑g=1
(CF gt −
1
S
S∑s=1
CF gt(θ; εs)
)2
+
3∑q=1
(CF qgt −
1
S
S∑s=1
CFq
gt(θ; εs)
)2
+(RT gt − RT gt(θ)
)2.
We constrain the standard deviation of the error term to be positive. Our interior-point minimiza-
tion algorithm terminates with a search step less than the specified tolerance of 10−12. We use
multi starts to guard against local minima. Our estimates are robust to different starting values.
A.2.4 Results
Table 17 reports the parameter estimates. The estimates are in line with our expectations: major
network affiliates retain a higher share of advertising revenue than minor networks, with Fox having
a positive trend; independent and WB stations retain the highest share of advertising revenues,
albeit with the smallest revenue base; the retained share falls over time, bottoming out in 2009
before bouncing back in recent years; the retained share is lower in more competitive markets.
Finally, non-broadcast revenue has grown significantly in recent years and there are economies of
scale in fixed cost.
Figure 9 plots the distributions of the estimated retained share α(Xjt;β), non-broadcast revenue
RT (Xjt; δ), and fixed cost F (Xjt; δ). Reassuringly, without imposing restrictions, we estimate α
to be between 0.2 and 0.7 in 2012, with an average of 0.51; non-broadcast revenue is estimated to
be between $0.21 million and $10.9 million; fixed cost is estimated to be contributing negatively to
cash flow in 95% of cases, averaging $4.12 million, with the highest fixed cost estimated to be up
to $21.9 million in 2012.
52

Fig
ure
9:
Est
imate
dR
eta
ined
Sh
are
of
Ad
vert
isin
gR
evenu
eα
(Xjt
;β),
Non
-Bro
ad
cast
Revenu
eRT
(Xjt
;δ),
an
dF
ixed
CostF
(Xjt
;δ)
(2012) N
otes
:P
lots
are
dis
trib
uti
on
sof
esti
mate
dre
tain
edsh
are
of
ad
vert
isin
gre
ven
ueα
(lef
t),
non
-bro
adca
stre
venu
ein
doll
ars
(mid
dle
),an
dfi
xed
cost
ind
oll
ars
(rig
ht)
in2012.
Incl
ud
es1,1
72
com
mer
cial
full
-pow
erst
ati
on
sin
2012
use
din
the
cash
flow
esti
mati
on
.
53

Table 17: Cash Flow Parameters Estimates
Estimates
Retained share α(Xjt;β) of advertising revenueABC -0.035CBS -0.062Fox -0.382NBC -0.054CW -0.113MyNetwork TV -0.356United Paramount -0.364Warner Bros 0.013Spanish-language networks (normalized) 0Independent -0.210Fox × Trend 0.0182003 0.6922004 0.6662005 0.6422006 0.6302007 0.5992008 0.5672009 0.5292010 0.6002011 0.6192012 0.636CompIndex -0.021
Non-broadcast revenue RT (Xjt, γ) (log $)Intercept 6.513ln(MktSize) 0.527Trend 0.135
Fixed cost F (Xjt; δ) ($ million)Intercept 63.941WealthIndex 1.052Group 1 × ln(MktSize) -12.851Group 2 × ln(MktSize) -11.696Group 3 × ln(MktSize) -10.210Group 1 × ln(MktSize)2 0.643Group 2 × ln(MktSize)2 0.535Group 3 × ln(MktSize)2 0.419
σ ($ million) 1.030
Notes: Group 1 is ABC, CBS, and NBC; group 2 is Fox, CW, and Warner Bros; and group 3 is My
Network TV, United Paramount, Spanish-language networks, and Independents.
The cash flow model fits the data well. Figure 10 plots the predicted distributions of cash flow
and non-broadcast revenue, superimposed with the corresponding moments from the NAB data for
all TV stations in 2012. Cash flow is estimated to be between -$6.4 million and $127 million across
54

Table 18: Cash Flow and Non-Broadcast Revenue Moments and Fit Measures
Number of Mean Abs DeviationMoments Correlation $ million %
All 3313 0.98 0.91 18.11
Type
Cash flow, mean 663 0.99 0.89 13.161st quartile 662 0.97 0.90 35.242nd quartile 663 0.98 0.90 17.733rd quartile 663 0.98 1.36 15.16
Non-broadcast revenue, mean 662 0.84 0.49 28.65
AffiliationMajor network 1995 0.98 1.00 16.13Minor network 350 0.93 1.00 38.55Independent 110 0.73 0.95 62.31
Year
2003 329 0.98 1.03 19.522004 325 0.99 0.87 15.052005 330 0.98 0.95 19.172006 310 0.99 0.96 16.262007 344 0.98 0.90 19.682008 350 0.98 0.86 20.432009 330 0.98 0.66 23.082010 330 0.98 0.84 16.302011 335 0.97 0.90 18.682012 330 0.98 1.11 16.51
Market Rank
1-25 460 0.98 2.37 14.7426-50 385 0.96 0.94 15.9751-100 930 0.93 0.63 19.98101+ 799 0.87 0.47 32.21
Notes: Correlations refer to correlations between predicted and observed dollar magnitudes for a
particular subsample of distribution moments. Percent mean deviations measured as a share of
observed dollar magnitudes.
TV stations in 2012, with an average of $7.2 million (compared to $7.8 million reported by NAB).
The 25th ($1.6 million), 50th ($3.6 million), and 75th ($7.8 million) percentiles of the predicted
distribution are overlaid in red lines (dashed, dotted, and dash-dotted, respectively). The black
lines of the same patterns refer to the corresponding moments in the NAB data. Non-broadcast
revenue is estimated to average $3.0 million (compared to $3.0 million reported by NAB).
To further assess the fit of the cash flow model, Table 18 compares the cash flow and non-
broadcast revenue moments as reported in NAB to the corresponding predicted moments, broken
down type of moment, affiliation, year, and market rank. It provides three different measures of
fit, namely the correlation between actual and predicted moments as well as the absolute deviation
in millions of dollars and in percent magnitudes, and percent of absolute deviations. Overall, our
cash flow model predicts the 3,313 moments with a 0.98 correlation. Of the 330 moments from
2012, our predicted moments have a 0.98 correlation with the actual moments reported by NAB;
on average, our predicted moments miss the actual moments by $1.11 million, or 16.5%.
55

Fig
ure
10:
Est
imate
dC
ash
Flo
wan
dN
on
-Bro
ad
cast
Revenu
ew
ith
Mom
ents
(2012)
Not
es:
Plo
tsar
eke
rnel
den
siti
esof
esti
mate
dca
shfl
ows
(lef
t)an
dn
on
-bro
ad
cast
reve
nu
es(r
ight)
in20
12in
log
term
s.C
ash
flow
s(i
nd
oll
ars
)are
shif
ted
by
$15
mil
lion
toav
oid
neg
ati
venu
mb
ers.
Bla
ckli
nes
ind
icat
ed
ata
mom
ents
an
dre
dli
nes
ind
icate
mod
el-p
red
icte
dm
om
ents
.D
ata
mom
ents
are
from
the
all-
stat
ion
cate
gory
inN
AB
(yea
r2012,
tab
le1).
Incl
ud
es1,1
72
com
mer
cial
full
pow
erst
atio
ns
in20
12use
din
the
cash
flow
esti
mati
on
pro
ced
ure
.T
he
cash
flow
dis
trib
uti
on
is
plo
tted
from
one
sim
ula
tion
wit
hst
ati
on
-sp
ecifi
cer
rors
.
56

A.3 Multiples
A.3.1 Priors
Industry analysts give a range of $0.15 to $0.40 per MHz-pop for the stick multiple and a range of 10
to 12 for the cash flow multiple.45 Therefore, our prior is that the stick multiple is distributed log-
normally with mean µStickprior = −1.4 and standard deviation σStickprior = 0.5 (corresponding to a mean
of $0.25 per MHz-pop and a standard deviation of $1 per MHz-pop, thereby covering $0.15 to $0.40
per MHz-pop with probability 0.68). According to industry analysts, while the stick multiple is
believed to be much larger for larger markets, the cash flow multiple is believed to be symmetrically
distributed. Our prior is therefore that the cash flow multiple is distributed normally with mean
µCFprior = 11 and standard deviation σCFprior = 1.
A.3.2 Data
As discussed in Section 4.1, our data consists of 136 transactions between 2003 and 2012 based
on cash flow and 201 transactions between 2003 and 2013 based on stick value. For cash flow
transactions, we infer the cash flow multiple from the transaction price and the estimated cash flow
CF jt using equation 4. For stick value transactions, we infer the stick multiple from the transaction
price using equation 5.
A.3.3 Estimation
For cash flow transactions, we estimate the following model for the multiple to construct its condi-
tional likelihood function:
MultipleCFjt =βXjt + εjt, (7)
where Xjt includes owner, station, and market characteristics. Specifically, we include in Xjt an
indicator of whether a station has multicast sub-channels, the station’s population coverage (in
thousand), the wealth and competitiveness indices for the DMA, power output fixed effects (pri-
mary, satellite, and class-A), ownership category fixed effects (whether the owner owns one, between
two and ten, or more than ten stations across markets), fixed effects for the eleven affiliations in
Table 14, and a full set of year fixed effects. The adjusted R2 is 0.68 and we take σCFlikelihood = 4.52
to be the standard deviation of the 136 estimated residuals.
For stick value transactions, we estimate the following model:
lnMultipleStickjt =βXjt + εjt, (8)
45See “Opportunities and Pitfalls on the Road to the Television Spec-trum Auction,” Bond & Pecaro white paper, December 12, 2013, available athttp://www.bondpecaro.com/images/Bond Pecaro Spectrum White Paper 12122013.pdf, accessed on Novem-ber 15, 2015.
57

where we include in Xjt the log of the station’s output power, the log of the station’s population
coverage, the wealth and competitiveness indices for the DMA, power output fixed effects, ownership
category fixed effects, affiliation fixed effects, and year fixed effects. The adjusted R2 is 0.67 and
we take σSticklikelihood = 0.97.
A.3.4 Posteriors
With the estimates in hand, we can predict multiples for any TV stations. To obtain the posterior
for the cash flow, respectively, stick multiple, we update our prior with the conditional likelihood
function using Bayes rule as
µposterior =µpriorσ
2likelihood+µlikelihoodσ
2prior
σ2prior+σ
2likelihood
,
σ2posterior =σ2likelihoodσ
2prior
σ2prior+σ
2likelihood
,
where µCFlikelihood = MultipleCF
jt0 for cash flow transactions and µSticklikelihood = lnMultipleStick
jt0 for stick
value transactions and we set t0 = 2012. The posterior standard deviation of the cash flow multiple
is 0.98 and that of the stick multiple is 0.44. Because the posterior mean depends on Xjt, Figure
11 illustrates the estimated posterior distribution for the cash flow, respectively, stick multiple in
one particular simulation run for the 1,672 UHF licenses that the FCC includes in its repacking
simulations. The prior distributions are overlaid in red dashed lines.
B Algorithm details
There are N TV stations in the focal DMA and the DMAs in its repacking region. As in section
2.2, denote as vj the reservation value of TV station j and asϕj station j’s broadcast volume. We
order TV stations such that v1ϕ1≤ v2
ϕ2≤ . . . ≤ vN
ϕN. Breaking ties in favor of selling, we have that if
the base clock price P exceeds vNϕN
, then all stations 1, . . . , N would be willing to relinquish their
license. If the base clock price is vNϕN
> P ≥ vN−1
ϕN−1, then only stations 1, . . . , N − 1 relinquish their
license, while station N prefers to continue operating and drops out of the auction, at which point
it has to be repacked, and so on.
A given clearing target of spectrum maps into a certain number of TV station channels to be
cleared for wireless service. For example, the auction’s initial 126 MHz clearing target would have
corresponded to clearing 21 channels out of a total of 37 non-dedicated UHF channels in each DMA.
In some DMAs, this would be possible without purchasing spectrum from TV stations since not
all channels are allocated. Denote the channels available for repacking TV stations that choose to
continue operating after the reverse auction by R. For simplicity, we suppress the dependency of
R on the spectrum clearing target.
The repacking feasibility checker SATFC takes as inputs the remaining available channels R and
a set of TV stations X, together with their interference profile and the channels to which they could
58

Fig
ure
11:
Pri
or
an
dP
ost
eri
or
Dis
trib
uti
on
sof
Cash
Flo
wM
ult
iple
an
dS
tick
Mu
ltip
le
Not
es:
Pro
bab
ilit
yd
ensi
tyfu
nct
ion
for
the
pri
or
dis
trib
uti
on
sand
esti
mate
dp
ost
erio
r
dis
trib
uti
ons.
Plo
tted
from
on
esi
mu
lati
on
(on
est
ati
on
-sp
ecifi
cd
raw
for
each
stati
on
).
59

be repacked.46 Denote this as SATFC(X,R). It then returns one of three possible outcomes:SAT ,
UNSAT , or TIMEOUT . SAT denotes that the set of stations X could be satisfactorily repacked.
UNSAT indicates that is is not possible, leading to a station being frozen, while TIMEOUT
indicates that within the maximum amount of time allotted to one run of the feasibility checker,
it was not possible to ascertain whether repacking would be feasible. Based on testing, the FCC
has set set the TIMEOUT parameter to one minute, which we also use. Their testing found that
this time limit offered an efficient trade off between total computational burden and accuracy, and
interpret TIMEOUT as an UNSAT.
We partition the set of TV stations {1, . . . , N} into a set of “active” stations A, a set of “frozen”
(or “conditionally winning”) stations F , and a set of “inactive”stations I that, given the initial clock
price P = 900 immediate drop out of the auction (see Competitive Bidding Procedures for Broad-
cast Incentive Auction 1000, Including Auctions 1001 and 1002, Public Notice FCC 14-191, p. 105,
available at https://www.fcc.gov/document/broadcast-incentive-auction-comment-pn).
Finally, denote as POj the payout to TV station j from the reverse auction, expressed in terms
of the base clock price; the station’s ultimate selling price would be ϕjPOj . We iteratively solve the
reverse auction in Matlab interfacing with SATFC via a Java bridge. To initialize, we set P = 900,
and define the set of active stations A ={s ∈ {1, . . . , N}| vsϕs ≤ 900
}, the set of frozen stations
F = ∅, and the set of inactive stations I ={s ∈ {1, . . . , N}| vsϕs > 900
}. That is, all TV stations
with valuation less than or equal to 900 participate in the reverse auction. If SATFC(I,R) 6= SAT ,
then the remaining stations cannot be repacked. In this case, we declare the auction as failed and
set POs = 0 for all s ∈ {1, . . . , N}.Otherwise, we proceed as follows:
1. REPEAT
(a) For each s ∈ A run SATFC(I ∪ {s}, R).
i. If SATFC(I ∪ {s}, R) = UNSAT , station s cannot be repacked. Change its status
to frozen: set A← A \ {s}, F ← F ∪{s}. Its payout is the current base clock price:
POs = P .
(b) If A 6= ∅ then set s = maxs∈A( vsϕs ), P = vsϕs
, A← A \ {s}, I ← I ∪ {s}, and POs = 0.
2. UNTIL A = ∅
Step (i) changes the status of any currently active TV station that cannot be repacked in addition to
the currently inactive TV stations to frozen (p. 108 and pp. 112–113, FCC 14-191). If a TV station
is frozen, it receives a payout equal to the current base clock price P . P , in turn, is determined by
the TV station most recently marked as inactive (or, possibly, the opening base clock price of 900).
At the end of steps (a)–(b) we are guaranteed that changing the status of any remaining active
TV station to inactive preserves feasibility. Step (c) then finds the remaining active TV station
46We use Perl scripts to create repacking region-specific domain and interference files to use with the SATFCfeasibility checker to simulate the auction. This speeds up computation and decreases the amount of memory overheadrequired for large-scale parallel computing.
60

with the highest value and changes its status from active to inactive. This TV station receives a
payout of zero.
B.1 Illustration
61

Figure 12: Simulation Algorithm Examples
Notes: Checkmarks (X) indicate that all remaining active stations can feasibly be repacked when the listed station
withdraws. Crosses (7) indicate that at least one active license can no longer feasibly be repacked when the listed
station withdraws. Events concerning licenses in the focal DMA are in bold. Licenses are numbered by FCC ID
numbers. Prices are in terms of the base clock price.
62

Fig
ure
13:
Sim
ula
tion
Alg
ori
thm
Exam
ple
Map
s
Not
es:
Map
ssh
owco
nd
ense
dsi
mu
lati
on
pro
cess
from
Fig
ure
12.
Gre
enp
ins
den
ote
stati
ons
that
wit
hd
raw
from
the
auct
ion
and
are
lab
eled
wit
hth
eir
ran
kin
the
ord
erof
stati
on
wit
hd
raw
als
.R
edp
ins
den
ote
stati
on
sw
hose
pri
ceis
froz
enb
ecau
seth
eyca
nn
olo
nger
be
rep
ack
edgiv
enth
egre
enst
ati
on
s’w
ith
dra
wals
inp
rior
rou
nd
s.T
he
top
left
map
show
sth
atth
efi
rst
22
wit
hd
raw
als
inth
ere
gio
nare
pro
cess
edw
ith
no
con
stra
ints
vio
late
d.
Th
e23rd
lead
sto
ast
atio
nb
ein
gfr
ozen
inth
eto
pri
ght
map
.T
he
bott
om
left
map
show
sth
at
wit
hd
raw
als
24
thro
ugh
30
are
then
pro
cess
edw
ith
out
inci
den
t,b
ut
the
bott
om
right
show
sth
at
the
31st
stati
on
wit
hd
raw
ing
an
db
ein
g
rep
acke
dle
ads
toth
ep
rice
bei
ng
froze
nfo
ra
han
dfu
lof
oth
erst
ati
on
s.
63