Embed Size (px)
Citation preview

OXYGEN GENERATION THROUGH ELECTRICALLY STIMULATED O2 REDUCTION
ACROSS ION EXCHANGE MEMBRANES
A Major Qualifying Project Report
Submitted to the Faculty of
WORCESTER POLYTECHNIC INSTITUTE
In partial fulfillment of the requirements
for the Degree of Bachelor of Science
by
_________________________
Devin Churchman, CM
_________________________
Daniel Jones, CH
_________________________
Raj Patel, CM
April 30, 2014
Approved:
_________________________________
Professor Ravindra Datta, Major Advisor
_________________________________
Professor Stephen J. Kmiotek, Co-Advisor
_________________________________
Professor Drew Broduer, Co-Advisor

2
Table of Contents List of Tables ................................................................................................................................................. 4
List of Figures ................................................................................................................................................ 5
Abstract ........................................................................................................................................................ 6
1. Introduction .............................................................................................................................................. 7
2. Literature Review ................................................................................................................................... 10
2.1 Social Implications............................................................................................................................. 10
2.1.1 Diseases and Conditions ............................................................................................................ 10
2.1.2 Current Solutions ....................................................................................................................... 11
2.2 Chemistry .......................................................................................................................................... 13
2.2.1 Four Electron Oxygen Reduction Reactions ............................................................................... 13
2.2.2 Two Electron Oxygen Reduction Reactions ............................................................................... 14
2.3 Proton Exchange Membrane (PEM) ................................................................................................. 18
2.3.1 Introduction to PEMs ................................................................................................................. 18
2.3.2 Mechanism ................................................................................................................................. 19
2.3.3 Hydrogen Oxygen Fuel Cell ........................................................................................................ 23
2.3.4 Oxygen generation case studies ................................................................................................ 25
2.4 Anion-Exchange Membrane (AEM)................................................................................................... 33
2.4.1 Development .............................................................................................................................. 33
2.4.2 Mechanism ................................................................................................................................. 34
2.4.3 Benefits and Challenges ............................................................................................................. 36
2.4.4 Oxygen Generation Case Studies ............................................................................................... 37
3. Methodology .......................................................................................................................................... 38
3.1 Conceptual Design ............................................................................................................................ 38
3.2 Apparatus .......................................................................................................................................... 40
3.3 Materials ........................................................................................................................................... 42
3.4 Experimental ..................................................................................................................................... 43
4. Results & Discussion ............................................................................................................................... 47
4.1 Liquid Electrolysis .............................................................................................................................. 47
4.2 Vapor Electrolysis .............................................................................................................................. 48
4.3 Two Electron Oxygen Reduction ....................................................................................................... 52
4.4 Carbon Degradation .......................................................................................................................... 55

3
5. Conclusion and Recommendations ....................................................................................................... 57
5.1 Conclusion ......................................................................................................................................... 57
5.2 Recommendations ............................................................................................................................ 58
5.2.1 Use of Alternative Catalysts ....................................................................................................... 58
5.2.2 Fabricating Membranes ............................................................................................................. 60
5.2.3 Stacking ...................................................................................................................................... 61
5.2.4 Anion Exchange Membranes ..................................................................................................... 62
5.2.5 Mathematical Analysis ............................................................................................................... 62
Works Cited ................................................................................................................................................ 64
Appendix A: Results summary table .......................................................................................................... 68
Appendix B: MEA P1 Results ...................................................................................................................... 76
IR Spectroscopy of MEA P1 ................................................................................................................. 77
Appendix C: U.S Patent 5,211,984 for Membrane Catalyst Loading in MEA Fabrication (Wilson, 1993)78
Appendix D: Sample plot generated by COMSOL. .................................................................................... 82

4
List of Tables Table 2.1 A The Half Reaction and Overall Reaction for MA's O2 Concentrator (Ma & Yu, 1995) ............. 12
Table 2.2 A The Four Electron Oxygen Reduction Reactions ...................................................................... 13
Table 2.2 B Water Electrolysis .................................................................................................................... 14
Table 2.2 C The Two Step Production of Hydrogen Peroxide using Anthraquinone .................................. 15
Table 2.2 D The Two Electron Oxygen Reduction Reactions ...................................................................... 15
Table 3.3 A Summary of Tested MEAs ........................................................................................................ 43
Table 4.1 A MEA I2 Liquid Electrolysis Results ............................................................................................ 47
Table 4.2 A Vapor Electrolysis Results at Ambient Temperature ............................................................... 49
Table 4.2 B Vapor Electrolysis Results at Elevated Temperature ............................................................... 50
Table 4.3 A Test result for MEA P3 with He bubbled through H2O2 fed to the cathode and humidified air
fed to the anode ......................................................................................................................................... 54
Table 4.3 B Test results for MEA I2 with humidified air feed to the cathode and He bubbled through
H2O2 feed to the anode ............................................................................................................................. 55
Table 4.4 A Surface Carbon Degradation .................................................................................................... 56
5
List of Figures Figure 2.2 A Models for the Substitution of Carbon by Nitrogen Atoms at the Edges of the Carbon Sheets (Boehm et al., 1984) .................................................................................................................................... 18 Figure 2.3 A Sulfuric Acid Analog of Polymer Electrolyte (Sulfuric Acid Model)......................................... 19
Figure 2.3 B Chemical Structure of Nafion® (Zhou, et al 2007) .................................................................. 21
Figure 2.3 C Reverse micellar Cluster-Network Structure of Hydrated Nafion® ........................................ 22
Figure 2.3 D Proton Diffusion via (a) en masse or vehicle and (b) Grotthuss Mechanism. ........................ 23
Figure 2.3 E Sample Proton Exchange Membrane Fuel Cell Schematic (Lister & McLean, 2004) .............. 24
Figure 2.3 F Graphical representation for the oxygen concentration over time (Fujita, Nakamura & Muto,
1985) ........................................................................................................................................................... 26
Figure 2.3 G Change in voltage of the PEM Fuel Cell over time (Fujita, Nakamura & Muto, 1985). .......... 27
Figure 2.3 H Schematic view of the 25 cm2 cell for oxygen extraction (Eladeb et al., 2012) ..................... 29
Figure 2.3 I Current Density vs. Air Flow (Eladeb et al., 2012). ................................................................... 30
Figure 2.3 J Current Density vs. Cell Voltage (Eladeb et al., 2012) ............................................................. 31
Figure 2.3 K Current Density vs. Time (Eladeb et al., 2012) ........................................................................ 31
Figure 2.3 L O2 Outlet Flow vs. the Inlet O2 Flow over Current (Eladeb et al., 2012) ................................ 32
Figure 2.3 M Current Density vs. the ORR efficiency (Eladeb et al., 2012) ................................................. 33 Figure 2.4 A Schematic of dissociation and solvation of the pendant OH- groups within the pores of a
hydrated AEM (Grew et al., 2010) .............................................................................................................. 35 Figure 3.1 A Electrolysis Aided PEM Pump Model ...................................................................................... 38
Figure 3.1 B Two Electron Oxygen Reduction Reaction PEM Pump ........................................................... 39 Figure 3.2 A Example Schematic of Experimental Procedure ..................................................................... 40
Figure 3.2 B Diagram for the fuel cell where the cathode is receiving the humidified inlet while the anode
is receiving a dry inlet. In addition, the fuel cell is connected to the power supply and the Fuel Cell Test
System ......................................................................................................................................................... 40
Figure 3.2 C Overall Diagram of the Fuel Cell Test bed located in the Fuel Cell Center at Worcester
Polytechnic Institute ................................................................................................................................... 41
Figure 3.2 D HP power supply used for the experimental runs .................................................................. 42 Figure 6.1 A Overview of different electro catalysts for H2O2 production (Siahrostami et al., 2013) ...... 59 Figure 6.3 A Sample Fuel Cell Stack (Fuel Cell Store, 2013) ........................................................................ 61 Figure 6.4 A Sample Anion Exchange Membrane for metal cation-free alkaline fuel cell ......................... 62 Figure 6.5 A Geometry of a proton exchange membrane (PEM) modeled in COMSOL Multiphysics.
(COMSOL Multiphysics, 2014) .................................................................................................................... 63

6
Abstract Oxygen transport through a proton exchange membrane (PEM) fuel cell was examined
with the ultimate goal of creating a model for a portable oxygen generator. Water electrolysis by
four electron oxygen reduction (ORR) along with two electron ORR were tested using membrane
electrode assemblies (MEAs) with Pt/C, carbon (Printex L6), and PtIrB catalysts. Results in trials
for all configurations yielded small currents and little to no oxygen production. Based on this
study, it appears a vapor electrolysis PEM fuel cell oxygen pump and two electron oxygen
reduction based on Pt/C and Printex L6 are not feasible. Alternative catalysts for two electron
oxygen reduction on a PEM and alternative membranes may lead to more functional models of
the proposed electrochemical oxygen generator.
7
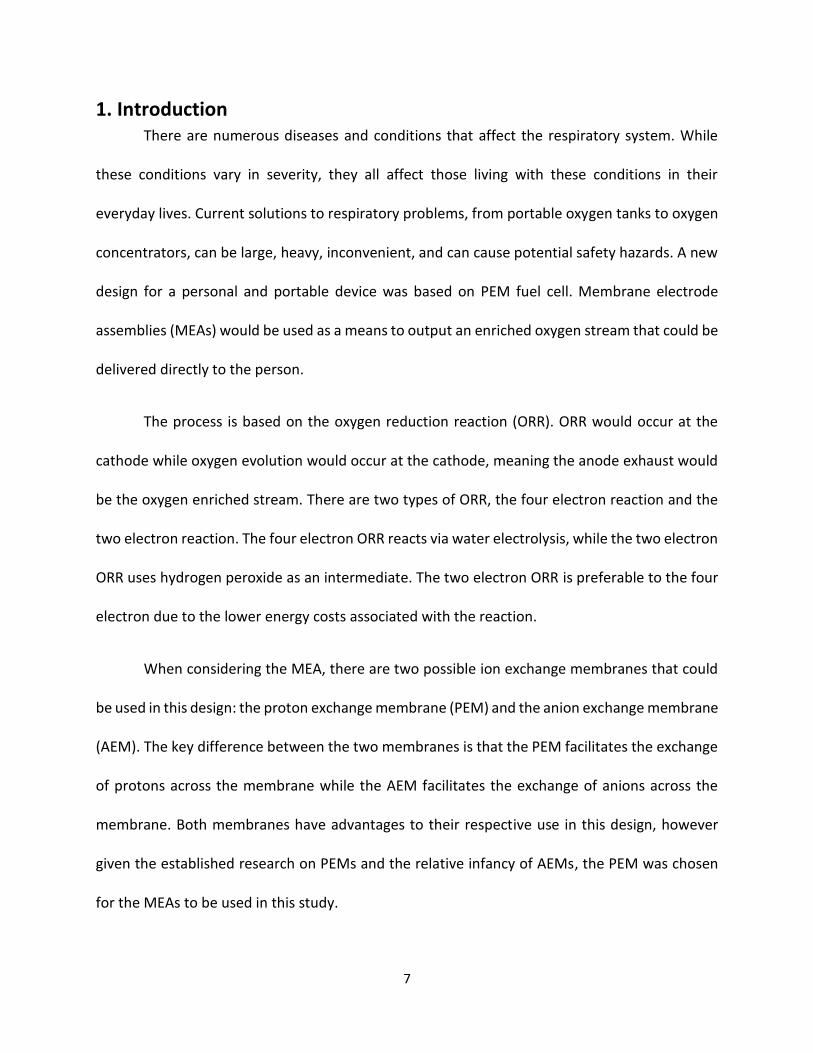
1. Introduction There are numerous diseases and conditions that affect the respiratory system. While
these conditions vary in severity, they all affect those living with these conditions in their
everyday lives. Current solutions to respiratory problems, from portable oxygen tanks to oxygen
concentrators, can be large, heavy, inconvenient, and can cause potential safety hazards. A new
design for a personal and portable device was based on PEM fuel cell. Membrane electrode
assemblies (MEAs) would be used as a means to output an enriched oxygen stream that could be
delivered directly to the person.
The process is based on the oxygen reduction reaction (ORR). ORR would occur at the
cathode while oxygen evolution would occur at the cathode, meaning the anode exhaust would
be the oxygen enriched stream. There are two types of ORR, the four electron reaction and the
two electron reaction. The four electron ORR reacts via water electrolysis, while the two electron
ORR uses hydrogen peroxide as an intermediate. The two electron ORR is preferable to the four
electron due to the lower energy costs associated with the reaction.
When considering the MEA, there are two possible ion exchange membranes that could
be used in this design: the proton exchange membrane (PEM) and the anion exchange membrane
(AEM). The key difference between the two membranes is that the PEM facilitates the exchange
of protons across the membrane while the AEM facilitates the exchange of anions across the
membrane. Both membranes have advantages to their respective use in this design, however
given the established research on PEMs and the relative infancy of AEMs, the PEM was chosen
for the MEAs to be used in this study.

8
Oxygen extraction has been accomplished using PEM electrolysis in some studies (Eladeb
et al., 2012), although this study was performed using liquid electrolysis as opposed to vapor
electrolysis, which is the ultimate goal of this design. It is important to compare these liquid
electrolysis results with the gathered vapor electrolysis results to assess the validity of the vapor
PEM electrolysis and its viability as an oxygen pump.
Experimental trials consisted of varying feeds, temperature conditions, and applied
voltages to the MEA being tested. A schematic of the experimental system can be seen in Figure
3.2A. Three sets of Nafion® 115 membranes were used with differing catalysts: Pt/C catalyst at
both the cathode and the anode, Printex L6 carbon catalyst at the cathode and Pt/C at the anode,
and Pt/C at the cathode and unsupported PtIrB at the anode. The voltage was set given the type
of ORR being pursued in the trial, voltages lower than 1.2 V being for the two electron ORR while
higher voltages were intended to induce the four electron ORR.
The experimental results proved that the initial goal of designing an oxygen generator had
been unsuccessful. Neither the Pt/C catalyst nor the Printex L6 catalyst was successful in fostering
the two electron ORR in the system. The MEAs loaded with the PtIrB, which were intended for
the vapor electrolysis trials, also failed to yield promising results. With little to no observable
oxygen evolution at the anode and very small sustainable current through the cell, it would
appear that vapor electrolysis is not an efficient method for the transport of oxygen through
PEM.
At the conclusion of this study, it was determined that none of the proposed designs as
tested in these experiments would yield any kind of practical and efficient oxygen generator
9
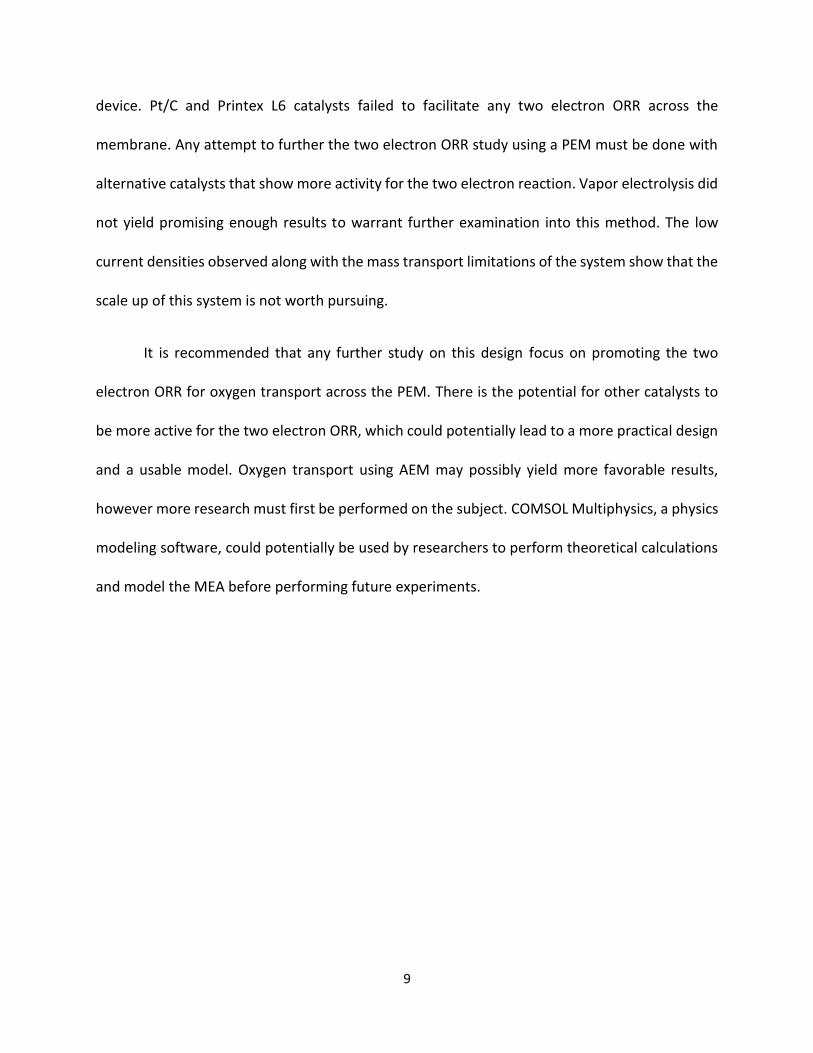
device. Pt/C and Printex L6 catalysts failed to facilitate any two electron ORR across the
membrane. Any attempt to further the two electron ORR study using a PEM must be done with
alternative catalysts that show more activity for the two electron reaction. Vapor electrolysis did
not yield promising enough results to warrant further examination into this method. The low
current densities observed along with the mass transport limitations of the system show that the
scale up of this system is not worth pursuing.
It is recommended that any further study on this design focus on promoting the two
electron ORR for oxygen transport across the PEM. There is the potential for other catalysts to
be more active for the two electron ORR, which could potentially lead to a more practical design
and a usable model. Oxygen transport using AEM may possibly yield more favorable results,
however more research must first be performed on the subject. COMSOL Multiphysics, a physics
modeling software, could potentially be used by researchers to perform theoretical calculations
and model the MEA before performing future experiments.

10
2. Literature Review
2.1 Social Implications There are a number of activities in society that people perform for personal and
professional reasons that have a negative effect on the respiratory system when performed
repeatedly over long periods of time. The most common way people damage their respiratory
system is smoking tobacco. Additionally, there are several materials used in industry that can
cause lung damage to those who work with the raw materials and those who use the final
product. All of these everyday activities can lead to numerous respiratory diseases and
conditions. Finally, air pollution causes respiratory ailments.
2.1.1 Diseases and Conditions
There are a variety of diseases and conditions that affect the respiratory system.
According to the UCSF Medical Center, these ailments are divided into four categories; 1)
occupational lung diseases which are caused by long term inhalation of industrial irritants such
as beryllium, silica, and asbestos; 2) chronic obstructive pulmonary disease (COPD), which is
primarily caused by years of tobacco smoking and includes the disease emphysema, which is the
fourth leading cause of death in the USA; 3) non-tuberculosis mycobacteria (NTM) which is
caused by a group of bacteria normally found in soil and water, and 4) interstitial lung disease
(ILD) the causes of which are mostly unknown (UCSF Medical Center, 2002). All of these ailments
damage the lung so that it cannot absorb the required amount of oxygen from the air into the
blood stream. As such, part of the treatment for these diseases is oxygen therapy, which is quite
simply to provide higher concentrations of oxygen to the patients so that their lungs can absorb
the necessary amount of oxygen. Oxygen therapy is tailored to the individuals exact condition so
that the amount of oxygen supplied varies from cases to case and can be anything from 30% to
11
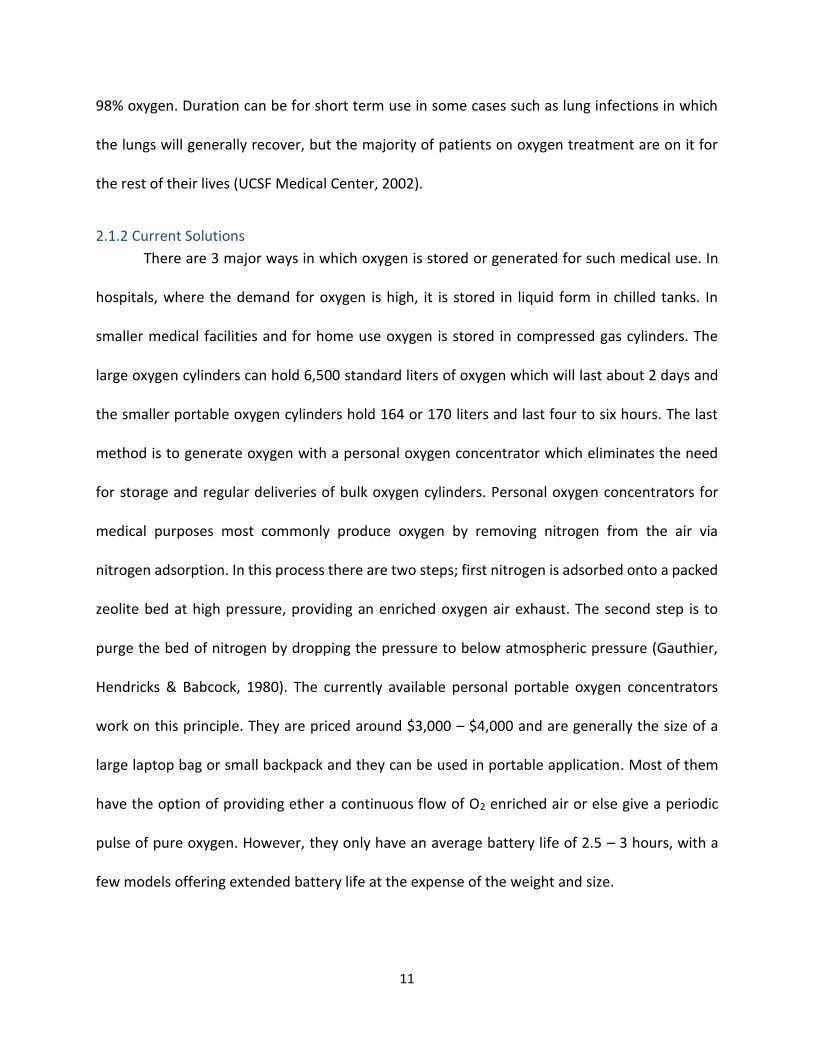
98% oxygen. Duration can be for short term use in some cases such as lung infections in which
the lungs will generally recover, but the majority of patients on oxygen treatment are on it for
the rest of their lives (UCSF Medical Center, 2002).
2.1.2 Current Solutions
There are 3 major ways in which oxygen is stored or generated for such medical use. In
hospitals, where the demand for oxygen is high, it is stored in liquid form in chilled tanks. In
smaller medical facilities and for home use oxygen is stored in compressed gas cylinders. The
large oxygen cylinders can hold 6,500 standard liters of oxygen which will last about 2 days and
the smaller portable oxygen cylinders hold 164 or 170 liters and last four to six hours. The last
method is to generate oxygen with a personal oxygen concentrator which eliminates the need
for storage and regular deliveries of bulk oxygen cylinders. Personal oxygen concentrators for
medical purposes most commonly produce oxygen by removing nitrogen from the air via
nitrogen adsorption. In this process there are two steps; first nitrogen is adsorbed onto a packed
zeolite bed at high pressure, providing an enriched oxygen air exhaust. The second step is to
purge the bed of nitrogen by dropping the pressure to below atmospheric pressure (Gauthier,
Hendricks & Babcock, 1980). The currently available personal portable oxygen concentrators
work on this principle. They are priced around $3,000 – $4,000 and are generally the size of a
large laptop bag or small backpack and they can be used in portable application. Most of them
have the option of providing ether a continuous flow of O2 enriched air or else give a periodic
pulse of pure oxygen. However, they only have an average battery life of 2.5 – 3 hours, with a
few models offering extended battery life at the expense of the weight and size.

12
In 1995, Ma and Yu (1995) published a paper on a novel electrochemical oxygen
concentrator designed for medium scale use in less developed areas. The device produced 36 L
of 99.5% pure O2 an hour. This was achieved through a 2 electron Oxygen Reduction Reaction
(ORR) mechanism resulting in oxygen being pumped from the cathode to the anode. The overall
reactions at the electrodes and the complete cell are provided in Table 2.1A. In the first reaction
air and electricity are fed to a carbon cathode where O2 is reduced to a hydro peroxide ion. Next
the hydro peroxide ion is decomposed on a Mn(NO3)2 6H2O mesh to produce oxygen and
hydroxide. The resulting hydroxide is then transferred through the 7 M KOH electrolyte to a nickel
mesh anode where it is oxidized to produce oxygen (Ma & Yu, 1995).
Table 2.1 A The Half Reaction and Overall Reaction for MA's O2 Concentrator (Ma & Yu, 1995)
Cathode Reaction O2 (air) + H2O + 2e- → HO2- + OH- Eq 1
Mn(NO3)2 6H2O mesh Reaction HO2- → ½ O2 + OH- Eq 2
Anode Reaction 2 OH- → ½ O2 + H2O + 2e- Eq 3
Overall Reaction O2 (cathode) → O2 (Anode) Eq 4
This provides an attractive alternative to other forms of oxygen production. When
compared to the traditional method of oxygen generation, water electrolysis, there are many
advantages. The first of which is a lower power requirement; Ma’s device uses a 2 electron ORR
which theoretically only requires 0.48V along with 2 e- consumed by the O2 being pumped,
whereas water electrolysis requires higher than 1.23V. Despite the lower energy consumption,
the O2 production remains equivalent to that in water electrolysis. Additionally this method does

13
not consume water. This system has reportedly been used in several hospitals in China with no
reduction in performance after 12 months of continuous use (Ma & Yu, 1995).
2.2 Chemistry The ORR is a reaction in which O2 gains electrons (e-). Oxygen reduction in aqueous
solution generally proceeds by one of two routes, a four e- or a two e- pathway. These reactions
are already widely used in electrochemistry for power generation and H2O2 production.
2.2.1 Four Electron Oxygen Reduction Reactions
The 4 e- ORR is most commonly used for power generation, via a fuel cell. The overall
reactions for four e- ORR in acidic and alkaline electrolyte can be seen in Table 2.2A. These
reactions are not spontaneous, comprise several steps, and generally require a catalyst. Many
different catalysts have been used and even more are being researched. Among these current
and developing catalysts are noble metals, carbon materials, quinone and derivatives, and
several transition metal compounds (Song & Zhang, 2008). However, the most common catalyst
used commercially today is Pt supported on carbon.
Table 2.2 A The Four Electron Oxygen Reduction Reactions
In Acidic aqueous solution O2 + 4H+ + 4e- → H2O 1.229 V
In Alkaline aqueous solution O2 + H2O + 4e- → 4OH 0.401 V
The reverse reaction of the 4 e- ORR is involved in water electrolysis, as seen in Table 2.2B.
Water electrolysis is the simple process of running a sufficient current through water to produce
hydrogen and oxygen. This is important to note for the purposes of our paper as this sets the
upper limit of our own study. Additionally, it tells us that if we proceed through the four e- ORR

14
we will produce hydrogen as well as oxygen, a rather undesirable outcome due to the explosive
nature of hydrogen.
Table 2.2 B Water Electrolysis
2 H2O → 2 H2 + O2 1.229 V
2.2.2 Two Electron Oxygen Reduction Reactions
Hydrogen peroxide is very important in industry as an effective and clean way to purify
waste water. For this reason, ways of improving hydrogen peroxide production are constantly
under study. Currently there are two primary methods of hydrogen peroxide generation. The
older method is the electrolysis of aqueous solutions of H2SO4, KHSO4, or NH4HSO4. More
commonly hydrogen peroxide is produced through the hydrogenation, reduction, and then
oxidation of anthraquinone derivatives, as seen in Table 2.2C. This is an efficient production
method as only hydrogen, atmospheric oxygen, and water are consumed (D. Considine (Ed.),
1974). However, an electrochemical method (Assumpcao et al, 2012) would have two primary
advantages over the anthraquinone method. Mainly that it would take less energy to acquire
protons from an acidic solution rather than generate H2 separately. Additionally it is believed that
an electrochemical method would be able to achieve a higher efficiency than the 90% conversion
rate that the anthraquinone method yields (Panizza & Cerisola, 2008).

15
Table 2.2 C The Two Step Production of Hydrogen Peroxide using Anthraquinone
Step 1 C6H4:(CO)2:C6H3R + H2 → C6H4:(COH)2:C6H3R
Step 2 C6H4:(COH)2:C6H3R + O2 → C6H4:(CO)2:C6H3R + H2O2
More recently the electrochemical generation of hydrogen peroxide has received greater
attention. The electrochemical generation of H2O2 utilizes the 2 e- ORR as can be seen in Table
2.2D. To produce H2O2 one needs a catalyst that will only reduce oxygen partially, otherwise the
H2O2 will be further reduced to water. Carbon is believed to be one of the best catalysts for this
reaction due to its large surface area, corrosion resistance, and low price. However carbon has
many forms which possess a large range of varying properties (Sudoh, Kitaguchi, & Koide, 1985).
Table 2.2 D The Two Electron Oxygen Reduction Reactions
In Acidic aqueous solution O2 + 2H+ + 2e- → H2O2 0.70 V
H2O2 + 2H+ + 2e- → 2 H2O 1.76 V
In Alkaline aqueous solution O2 + H2O + 2e- → HO2 - + OH- –0.065 V
HO2 - + H2O + 2e- → 3OH- 0.867 V
Soltani et al. (2012) have explored the idea of generating hydrogen peroxide in situ by
electrochemical means. For their experiment they used an undivided cell with a Pt anode and a
gas diffusion cathode (GDC), through which they feed oxygen at a rate of 1 L/min. They tested
several forms of carbon catalysts coated onto the GDC; including carbon black(CB) –PTFE,
powdered activated carbon(PAC) –PTFE, carbon nano tube(CNT)-PTFE, and CB-CNT-PTFE. After a
run time of 40 minute with an applied current of 200 mA they found that the CB-CNT-PTFE (123.5

16
µM) did the best and the PAC-PTFE (58.45 µM) did the worst. However, because the CB-PTFE
(112.3 µM) and CNT-PTFE (100.9 µM) preformed similarly and costs significantly less than the CB-
CNT-PTFE, they used the CB-PTFE as their catalyst for all subsequent experiments (Soltani et al.,
2012).
In addition to testing for an effective catalyst, they also tested the effects of initial pH,
electrolyte concentration, and applied current on the generation of hydrogen peroxide. They
tested initial pHs between pH 2 – pH 9 and found the best conditions were at pH 3 and above pH
7. Above pH 7 the hydrogen peroxide primarily exists as the hydroperoxide ion, which is stable in
basic solution. On the other hand, acidic solutions tend to reduce the hydrogen peroxide to water
and the catalyst will facilitate the formation of H2 from acidic protons in the solution. Next these
investigators examined H2O2 generation at different electrolyte concentrations. They used
Na2SO4 as there electrolyte and applied 300 mA to a range of concentrations: 0.01, 0.03, 0.05,
0.08, 0.1, and 0.15 M. They found that higher electrolyte concentrations lead to more H2O2 with
insignificant increases over 0.08 M. They also tried a range of applied currents from 30 mA to
300mA. Once again they found that increased current resulted in increased H2O2 production up
to 150 mA after which the increase in H2O2 concentration was insignificant. Finally Soltani et al.
notes that after ten 70 minute runs there is a slight decrease in the performance of their cell,
though they do not speculate why (Soltani et al., 2012).
Assumpcao et al. (2012) did a direct comparison of two types of carbon; Printex L6 and
Vulcan XC 72R. They found that Vulcan XC 72R transferred an average of 2.9 electrons per
molecule and produced 51% H2O2. This is not particularly surprising as Vulcan XC 72R is one of
the most common carbon supports used in modern fuel cell catalysts in which noble metals are
17
loaded onto carbon supports. On the other hand, they found Printex L6 transferred an average
of 2.2 electrons per molecule and produced 88% H2O2. To determine why there was such a
difference between these two carbons they looked at the composition of each. They found sulfur,
oxygen, and nitrogen in both carbons, with the majority of it appearing as oxygenated acids.
Additionally the Printex had more than two times the oxygenated acids compared to the Vulcan.
As more oxygenated acids increases the hydrophilicity of the carbon and this facilitates the
formation of H2O2, it is believed that this is the main reason for the difference in H2O2 production
(Assumpcao et al, 2012).
Boehm et al. (1984) has also explored the effectiveness of carbon as a catalyst for ORRs.
Their group looked at 4 forms of carbon and several methods of pretreatment. The 4 forms of
carbon are: Peat charcoal, wood charcoal, sugar charcoal, and carbon black. Each catalyst was
tested in the oxidation reaction of dilute sulfuric acid by O2. It was found that peat charcoal was
a good catalyst, wood charcoal was a poor catalyst, and carbon black and sugar charcoal showed
little to no activity. Next the catalysts were subjected to heat treatment before testing. It was
found that heat treatment increased the activity of all the catalysts, with optimal temperature
treatments being 1070K for the charcoals and 1170K for the carbon black. Additionally surface
treatments where evaluated. Generally, basic surface oxidants where found to slightly increase
the activity of the catalyst and acidic surface oxidants decreased the activity of the catalyst.
However, treatment with ammonium at elevated temperatures was found to dramatically
increase the catalysts activity. It is believed that heat treatment with ammonium resulted in
Nitrogen being incorporated into the outer layers of the carbon catalyst, as seen in Fig 2.2A. The
Nitrogen in the carbon structure increases the activity of the catalyst by giving its extra electrons

18
to the conduction band which in turn gives its electrons to the adsorbed molecules, making the
carbon atoms adjacent to the nitrogen atom more active (Boehm et al., 1984).
Figure 2.2 A Models for the Substitution of Carbon by Nitrogen Atoms at the Edges of the Carbon Sheets (Boehm et al., 1984)
2.3 Proton Exchange Membrane (PEM)
2.3.1 Introduction to PEMs
Since the proposed device is based on a PEM fuel cell, a background is provided here.
Proton electron membranes (PEM) were first seen in the 1960s within fuel cells as auxiliary power
source in the Gemini space flights (Lister & McLean, 2004). Stanley H. Langer and Robert G.
Haldeman of American Cyanamid Company were able to subsequently successfully use them to
purify oxygen using 11.2 mg/cm2 of Pt on a stainless mesh screen as the electrode, while
electrolyte was simply 5 disks of filter paper saturated in 23% of KOH solution (Langer &
Haldeman, 1964). Their experimental work was the ground-work for proving that four-electron
mechanisms are operative and feasible in oxygen pumping. In addition, their work provided a
basis for other studies to be conducted such as catalytic materials and oxygen electrode
mechanisms. However, major advances in terms of redesign and configuration of PEM fuel cells
did not occur till the 1980s. Researchers have constantly been looking to enhance the design and
have succeeded by trying to reduce the expensive platinum catalyst to finding alternative
catalysts.

19
2.3.2 Mechanism
Proton exchange membranes are a type of semipermeable membranes designed to
conduct protons whiles the membranes tend to be impermeable to gases such as hydrogen or
oxygen. PEM fuel cells are based off the normal membrane electrode assembly (MEA), whose
basic function involves hydrogen oxidation at the anode, OOR at the cathode anode and transfer
of protons through the PEM.
The early electrolytes were aqueous solutions of acids and bases. To reduce the Ohmic
resistance, these could be soaked on a thin porous disk or on a membrane. The basic concept of
the polymer electrolyte involves covalently binding the acid group to a polymer in the form of a
membrane rather than immobilizing the liquid acid electrolyte within a porous support layer that
is held there physically via capillary and surface forces so that leaking of the acid is avoided. Thus,
this concept avoids the dissolution, volatility, and migration acid electrolytes altogether. To
better understand this PEM concept, it has been exemplified schematically for the case of sulfuric
acid in Figure 2.3A, where one of the –OH groups in sulfuric acid is replaced by a polymer chain
R, resulting in a solid polymer electrolyte with a sulfonic acid group, i.e., R–SO3H.
Figure 2.3 A Sulfuric Acid Analog of Polymer Electrolyte (Sulfuric Acid Model)
When such a polymer electrolyte, also called ionomeric polymer, or simply an ionomer, is brought
in contact with water, hydronium ions, or hydrated protons, are formed by the following
reaction:

20
R – SO3H + H2O ↔ H3O+ + R – SO3 (2.3.1)
The reaction facilitates conduction of protons to occur in the aqueous phase. Thus, the polymer
electrolyte acts like an ordinary acidic electrolyte, except that not only does it anchor the acid
group, the resulting anion is not solvated, and thus does not participate in conduction, which is
carried out solely by the hydronium ions. Of course, anions and hydronium ions in PEM must stay
close together to maintain overall electrical neutrality within the ionomer. These two conditions
can be satisfied only if micelles or reverse micelles are formed, with water and the polymer as
the continuous phase, respectively. Thus, reverse micelles, or inverted micelles, are formed when
water is introduced into PEMs, as for example in Nafion®.
In principle, the polymer chain R may be selected from a wide range of possible options
and, hence, a number of different PEM materials have been investigated. In practice, R must be
electrochemically and thermally stable and should preferably be hydrophobic and/or cross-linked
to avoid excessive swelling in water (Mauritz & Moore, 2004). The early polymer electrolytes
developed were blends of polymer with a highly cross-linked polystyrene-based ionomer.
However, these materials were found to not possess adequate chemical stability under the harsh
oxidative environment in an operating fuel cell, because of the instability of the C–H bond in the
polymer. A stable ionomer with excellent conductivity was found in 1962, when DuPont
developed the Nafion® membrane, which is based on a highly chemically inert backbone
structure similar to PTFE, as shown in Figure 2.3B. The chemical inertness of Nafion® is due to the
fact that the C–F bonds in it are much more stable than the C–H bonds present in the
hydrocarbon-based membranes (Coms, 2008).

21
Figure 2.3 B Chemical Structure of Nafion® (Zhou, et al 2007)
The molecular mass (weight) of Nafion® depends upon m (5-13), n (~1000), and x (0-3) (Figure
2.3B), and is typically in the range of 105 – 106 Da. The properties that are typically used to
characterize Nafion® membranes, however, are the equivalent weight (EW) and the membrane
thickness. The EW is defined as the number of grams of dry Nafion® per mol of acid groups. Thus,
it is essentially the molecular weight (Da) of the anion –RSO3−. A typical value for Nafion® is 1100.
In fact, a Nafion® membrane is denoted by a number in which the first two digits represent its
EW, while the last denotes its nominal thickness. Thus, Nafion® 117 is a membrane with an EW
of 1100 and a nominal thickness of 0.007 in (178µm). Other common membranes are Nafion®115
(0.005 in. or 125µm) and Nafion® 112 (0.002 in. or 50µm) (Sigma Aldrich). While a thinner
membrane can provide better fuel cell performance due to lower resistance, it is less durable
than a thicker membrane and has a higher permeability to O2 and H2, resulting in more crossover.
The PFSA backbone is strongly hydrophobic, while the proton conducting sulfonic acid group is
highly hydrophilic and, thus, phase separation readily occurs when water is introduced into the
Nafion®, forming interconnected aqueous reverse micelles or clusters, roughly 4 nm in size and
interconnected by channels of roughly 1 nm size responsible for percolation, that contain water,
the anion, and the hydronium ions, as shown in Figure 2.3C, (Personal Notes by Prof. Datta).
22
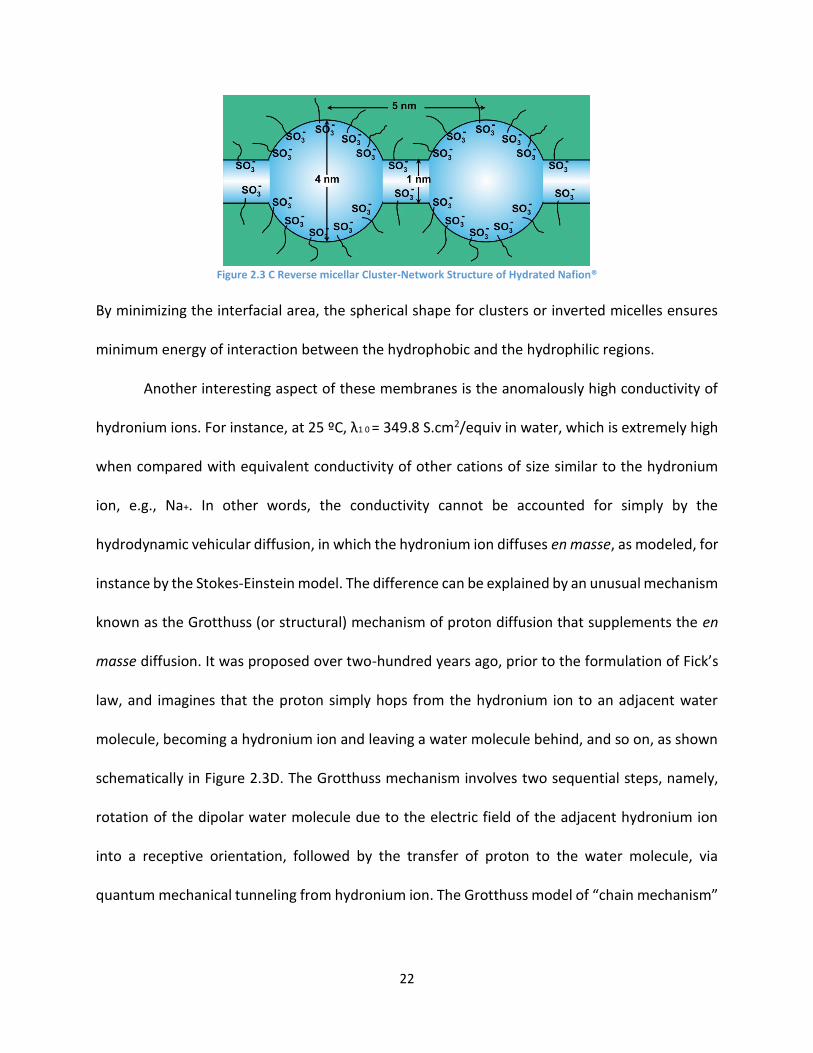
Figure 2.3 C Reverse micellar Cluster-Network Structure of Hydrated Nafion®
By minimizing the interfacial area, the spherical shape for clusters or inverted micelles ensures
minimum energy of interaction between the hydrophobic and the hydrophilic regions.
Another interesting aspect of these membranes is the anomalously high conductivity of
hydronium ions. For instance, at 25 ºC, λ1 0 = 349.8 S.cm2/equiv in water, which is extremely high
when compared with equivalent conductivity of other cations of size similar to the hydronium
ion, e.g., Na+. In other words, the conductivity cannot be accounted for simply by the
hydrodynamic vehicular diffusion, in which the hydronium ion diffuses en masse, as modeled, for
instance by the Stokes-Einstein model. The difference can be explained by an unusual mechanism
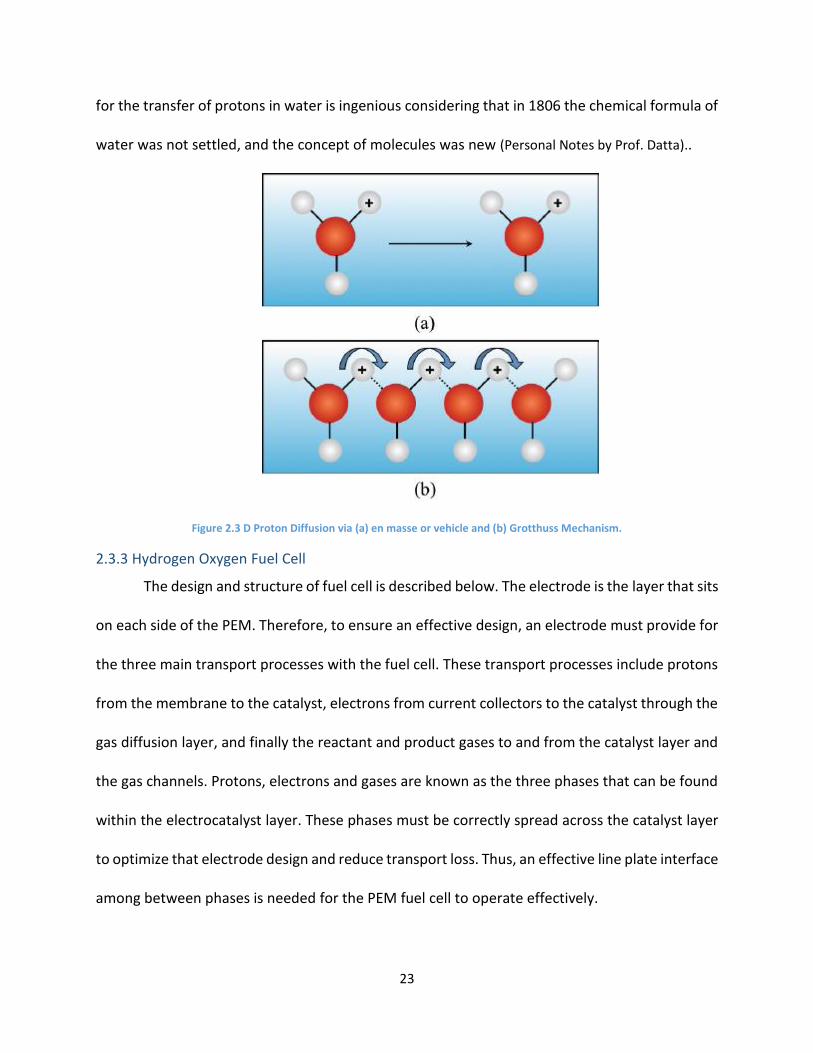
known as the Grotthuss (or structural) mechanism of proton diffusion that supplements the en
masse diffusion. It was proposed over two-hundred years ago, prior to the formulation of Fick’s
law, and imagines that the proton simply hops from the hydronium ion to an adjacent water
molecule, becoming a hydronium ion and leaving a water molecule behind, and so on, as shown
schematically in Figure 2.3D. The Grotthuss mechanism involves two sequential steps, namely,
rotation of the dipolar water molecule due to the electric field of the adjacent hydronium ion
into a receptive orientation, followed by the transfer of proton to the water molecule, via
quantum mechanical tunneling from hydronium ion. The Grotthuss model of “chain mechanism”
23
for the transfer of protons in water is ingenious considering that in 1806 the chemical formula of
water was not settled, and the concept of molecules was new (Personal Notes by Prof. Datta)..
Figure 2.3 D Proton Diffusion via (a) en masse or vehicle and (b) Grotthuss Mechanism.
2.3.3 Hydrogen Oxygen Fuel Cell
The design and structure of fuel cell is described below. The electrode is the layer that sits
on each side of the PEM. Therefore, to ensure an effective design, an electrode must provide for
the three main transport processes with the fuel cell. These transport processes include protons
from the membrane to the catalyst, electrons from current collectors to the catalyst through the
gas diffusion layer, and finally the reactant and product gases to and from the catalyst layer and
the gas channels. Protons, electrons and gases are known as the three phases that can be found
within the electrocatalyst layer. These phases must be correctly spread across the catalyst layer
to optimize that electrode design and reduce transport loss. Thus, an effective line plate interface
among between phases is needed for the PEM fuel cell to operate effectively.

24
The PEM is the central piece of the membrane electrode assembly (MEA) and exterior
layers on each side together form the electrode. The next layer is the Catalyst Layer as seen in
Figure 2.3E sits between membrane and gas diffusion layer (GDL), and is also known as the active
layer (Lister & McLean, 2004). The layer is the location where the half-cell electrode reaction takes
place in the PEM fuel cell. Adjacent to the catalyst layer, as seen in Figure 2.3E, is the gas diffusion
layer whose sole purpose is to ensure reactants diffuse effectively to the catalyst layer and also
transports electrons to and from the catalyst layer. In most cases, the layer is made up of porous
carbon paper or a graphite cloth, which is roughly 100-300 um thick (Lister & McLean, 2004).
Figure 2.3 E Sample Proton Exchange Membrane Fuel Cell Schematic (Lister & McLean, 2004)

25
PEMFC is fueled by hydrogen and the charge carrier is the hydrogen ion (H+). At the anode, the
hydrogen molecule is split into hydrogen ions and electrons. These hydrogen ions permeate
across the electrolyte to the cathode side. However, the electrons flow through an external path
and generate electrical power. Oxygen, usually in the form of air, is supplied to the cathode and
combines with the electrons and the hydrogen ions coming above the electrolyte layer to
produce water. The reactions at the electrodes are as follows:
Anode reaction: 2H2 → 4H+ + 4e-
Cathode reaction: O2 + 4H+ + 4e- → 2H2O
Overall cell reaction: 2H2 + O2 → 2H2O
2.3.4 Oxygen generation case studies
The following section will address many advances in this field of research. Significant
advances were not conducted until the 1980s. For instance, Yuko Fujita et al. (1985) conducted
a research study on an oxygen separator based on oxygen reduction at the air cathode. This study
specifically focused on the previous O2 separators that used a liquid electrolyte, and that there
was little published work on O2 separators that use a polymer electrolyte membrane. Thus, was
one of the first published studies using the Nafion® 117. Pt anode was plated onto the membrane
and Pt/C cathode was hot pressed onto the membrane. In addition, the series of experimental
testing was conducted on 10 cm2 and 100 cm2 active areas. Fujita et al. (1985) found the following
parameters which included operating temperature of 40o C water flowing to the anode and air
at STP that flows 4 L/min to the cathode (Fujita, 1985). With this setup, the output of the PEMFC
is 70.9 ml/min O2, with a concentration of 98.4%, and current efficiency of oxygen reduction or
φ of 91.3%.

26
The test method was to run on circulation mode in order to remove all O2 from 1 L of air.
It took 70 min to remove all O2 (final O2 concentration of 0.02%) as seen in Figure 2.3F. At this
scale, in flow through mode, a stream of 0.02% O2 can be achieved with a flow of 100 ml/min.
Figure 2.3 F Graphical representation for the oxygen concentration over time (Fujita, Nakamura & Muto, 1985)
Based on the Fujita study, the following conclusions can be made that: (a) water produced
at cathode is discarded, (b) water at anode is recycled and (c) air feed is humidified at 40o C. For
longevity tests, Figure 2.3G shows the 100 cm2 cell was used intermittently for 7.5 hours per day
at 200 mA/ cm2. In addition, the overall design is an effective O2 separator and includes the
following: lower φ and YO2 than Takenaka et al (1982), superior O2 separation than liquid
electrolyte systems, no decrease in performance over 100 days as seen in Figure 2.3G and that
humidified air doesn’t change the cells operation. Additional observations are that humidified air

27
doesn’t flood the cathode and recycling the water from the cathode doesn’t seem to build up
impurities.
Figure 2.3 G Change in voltage of the PEM Fuel Cell over time (Fujita, Nakamura & Muto, 1985).
Furthermore a more recent study conducted for O2 separation with PEM technology is
described next. The removal of O2 from the air is important as low O2 levels help prevent food
spoiling, metal corrosion, and are needed for some biological reactors. There are several non-
electrochemical ways to lower the O2 levels: adding N2, selective O2 combustion, O2 selective
reduction, selective adsorption, or membrane separation. However, there are more effective
electrochemical ways to remove O2 from air. Winnick (1990) reviewed electrochemical O2
extraction and Langer & Haldeman (1964) was able to recover pure O2 from air in alkaline and
acidic solutions. The equilibrium voltage of such a cell is 0, but the actual cell voltage is equal to
the 2 over potentials, plus the Ohmic drop across the cell. Additionally, General Electrics has
recently developed a similar system to provide O2 from high pressure air. Several patents also
28
describe processes where O2 is reduced to O2- and transported through an oxide lattice that is
missing oxygens (i.e. a solid oxide conductor). However, the current densities are below 100
mA/cm2 and the operating temperature is above 500o C. Tseung & Jasem (1981) imagined O2
extraction by its reduction to hydrogen peroxide on a graphite based cathode through 2 electron
ORR. Brillas et al. (1997), developed a 2 electron reduction path across a membrane using a
NiCo2O4 surface to reform O2 (current density is limited below 0.2 A/cm2 by the finite
concentration of peroxide). Recently using proton exchange membrane fuel cells (PEMFC), O2
extraction was reached with current densities of 0.6 A/cm2 and 0.015 M O2 per second per m2
membrane. Based on this information, Eladeb et al. (2012) conducted a series of experiments on
PEM fuel cells to garner a better understand on the performance of a PEMFC. Their goal was to
remove all O2 from a stream of air using PEM technology. To achieve this they used a standard
water electrolysis MEA, as seen in Figure 2.3H, to reduce oxygen from the inlet stream at the
cathode to water. The formed water is then electrolyzed at the anode yielding oxygen, protons,
and electrons. The protons are then recycled within the membrane for subsequent oxygen
reduction at the cathode (Eladeb et al. 2012).
The MEA was designed for water electrolysis and experiments took place between 50o
and 80o C. Liquid water was pumped to the anode compartment and heated before entering the
cell. The cell was operated at a fixed voltage or controlled current density using a PGSTAT
30autolab potensiostat connected to a 20 amp autolab booster (Eladeb et al., 2012).

29
Figure 2.3 H Schematic view of the 25 cm2 cell for oxygen extraction (Eladeb et al., 2012)
The current density vs. voltage was established in either potensiostatic or galvinostatic
modes so that the cell potential was below 1.4 v for long runs. Most measurements were carried
out with air but O2 was also used for comparison. O2 extraction was achieved repeatedly with a
fixed current density and cell voltage less than 1.4 v. During most runs in this study the cell voltage
stabilized after 10 to 30 minutes. Outlet gas composition was determined with gas
chromatography. The following results are for all experimental runs at T = 60o. Figure 2.3I shows
that the air flow rate affects the current density at 1.3 v. with the current density increasing with
the increase in flow rate (Eladeb et al., 2012).

30
Figure 2.3 I Current Density vs. Air Flow (Eladeb et al., 2012).
Figure 2.3J shows that the cell current density is an increasing function of the
voltage. These results are consistent with other research. Voltage and current density are
proportional. And we see better efficiency with pure O2. Figure 2.3K shows the stability of the
cell for long runs of up to 50 hours (Eladeb et al., 2012).
Figure 2.3L demonstrates that as inlet O2 flow increases the outlet O2 flow approaches
atmospheric composition (21% O2). This is expected and demonstrates the optimal flow rate for
the cell (lambda ~ 5-10). Furthermore, this graph indicates that at larger flow rates calculating
efficiency of the ORR will be imprecise, as demonstrated in Figure 2.3L. Despite low precision,
Figure 2.3L clearly shows a decrease of ORR efficiency as lambda increases. Furthermore, the
graph shows that the average ORR efficiency is between 70% and 100% (Eladeb et al., 2012).

31
Figure 2.3 J Current Density vs. Cell Voltage (Eladeb et al., 2012)
Figure 2.3 K Current Density vs. Time (Eladeb et al., 2012)

32
Figure 2.3 L O2 Outlet Flow vs. the Inlet O2 Flow over Current (Eladeb et al., 2012)
Figure 2.3M demonstrates that for current densities of 100 mA/cm2 or more a 90% or
higher ORR efficiency can be observed. The graph shows that current density has a positive effect
on ORR efficiency. Thus, this study proves the validity of using water electrolysis in a PEM fuel
cell like device for oxygen pumping (Eladeb et al., 2012).

33
Figure 2.3 M Current Density vs. the ORR efficiency (Eladeb et al., 2012)
2.4 Anion-Exchange Membrane (AEM)
2.4.1 Development
Alkaline fuel cells were developed in the 1930s by F. T. Bacon (Arges et al., 2010). Initial
fuel cells used a liquid electrolyte, commonly an aqueous solution of KOH due to its effectiveness
as a highly conducting alkaline hydroxide (Merle et al., 2011). These fuel cells suffered from
problems due to the use of the liquid electrolyte. The strong alkaline electrolytes result in its
reaction with carbon dioxide in air, resulting in the formation of carbonates and the

34
corresponding reduction of the connectivity of the electrolyte (Arges et al., 2010). This
deterioration is discussed further in the subsequent sections.
The recent development of anion exchange membranes has eliminated the need for a
liquid electrolyte and promoted the use of an anion exchange membrane as the medium for the
transport of hydroxide ions. In these membranes, as in proton exchange membranes, the
electrolytes are fixed to polymer chains (Arges et al., 2010). Progress on anion exchange
membranes and their use in fuel cells lags behind that of the proton exchange membranes.
Commercial production of anion exchange membranes has only begun recently, and research
concerning these membranes is currently being conducted. These membranes have proven to
resist contamination and maintain ionic conductivity in neutral environments over an extended
period of time (Vega et al., 2010). Such studies show that the anion exchange membranes are
able to operate at a reasonable level, even in ambient air, and are able to be a viable option to
the proton exchange membrane.
2.4.2 Mechanism
An anion exchange membrane consists of a fixed polymer backbone on which electrolytes
that have interchangeable anions are attached. Common anion exchange groups in anion
exchange membranes are quaternary ammonium, quaternary phosphonium, and tertiary
sulfonium (Merle et al., 2011) In the presence of a solvent, these fixed polymers become mobile
and are able to transfer charge. Like in a proton exchange membrane, ion transport in an anion
exchange membrane occurs via the Grotthuss mechanism. In this mechanism, hydroxide ions are
transported through the membrane along a chain of water molecules. The ion moves from one

35
molecule to another by means of the formation and cleavage of hydrogen bonds as seen in Figure
2.4A, making a tetrahedral water molecule with each bond formed (Merle et al., 2011).
Figure 2.4 A Schematic of dissociation and solvation of the pendant OH- groups within the pores of a hydrated AEM (Grew et al., 2010)
Anion exchange membrane fuel cells function in a very similar way to proton exchange
membrane fuel cells. The difference between the two lies in the ions that are transferred
between the cathode and the anode. Within the anion exchange membrane fuel cell, hydroxide
ions are produced through oxygen reduction at the cathode. This hydroxide ion is carried through
the membrane by way of the polymer electrolyte. Upon reaching the anode, the hydroxide ion
combines with hydrogen and form water. The electrons that are displaced during the hydrogen
oxidation return to the cathode where they participate in the reduction of oxygen that produces
the hydroxide ions. The flow of electrons from the anode to the cathode provides the electrical
energy that is produced by the fuel cell.

36
2.4.3 Benefits and Challenges
Anion exchange membranes have numerous advantageous aspects to their use. Among
these beneficial qualities are the capabilities of these membranes in fuel cells to operate using a
variety of fuels, generate high energy density, and they can be operated at moderate
temperatures. One of the largest benefits to using anion exchange membranes is the expensive
metal catalysts used in proton exchange membrane fuel cells are not essential for operation. This
is due to the higher reaction kinetics at the electrodes in the alkaline conditions of the anion
exchange membrane, especially for the oxygen reduction reaction, which translates into a higher
electrical efficiency and a lower cost (Merle et al., 2011). This allows either the use of a less
expensive catalyst or a lesser amount of the traditional platinum catalyst.
In general, many of the anion exchange membranes benefits are related to the reducing
the overall costs of operating a device using an anion exchange membrane. The ability to operate
at a lower temperature means less energy is required to maintain the unit at the desired
temperature. The ability to use a less expensive catalyst or a smaller amount of an expensive
catalyst also lowers the required costs associated with the process. While these benefits have
some promising attributes, several problems with the use of anion exchange membranes exist.
One issue with anion exchange membranes include the inability for hydroxide ions to
dissociate as strongly as hydrogen ions. While this can be enhanced with the increasing of the
number of cationic sites, this method ultimately leads to the deterioration of the membrane itself
(Arges et al., 2010). Another problem with the anion exchange membrane is the susceptibility of
the hydroxide groups to be neutralized by carbon dioxide. When the membrane is exposed to
air, the hydroxide ions are replaced with carbonate and bicarbonate ions (Varcoe et al., 2010),
which in turn reduces the pH. The reduction in pH slows the kinetics of the reactions at both the

37
cathode and the anode, and the larger carbonate and bicarbonate anions cause a decrease in the
conductivity of the membrane. This causes a decline in the efficiency and performance of the
membrane (Arges et al., 2010).
Another challenge facing anion exchange membranes at this time is the lack of research
and development in the area. Of course, this problem will solve itself over time as more research
concerning these membranes is conducted. At this time however, anion exchange membranes
fall far behind proton exchange membranes in terms of use in membrane electrode assemblies
(Arges et al., 2010). In addition, much of the research concerning anion exchange membranes
has occurred at the traditional conditions, including the use of expensive catalysts such as
platinum. In essence, many of these studies have not taken advantage of the inherent benefits
of an anion exchange membrane. Further studies that examine the anion exchange membrane
in more appropriate conditions are required to accurately compare the capabilities of the
membrane compared to that of the proton exchange membrane in fuel cells.
2.4.4 Oxygen Generation Case Studies
Due to the relatively young age of the anion exchange membrane, there have not been
any studies exploring the generation of oxygen using an anion exchange membrane. Considering
the research conducted on the generation of oxygen using a proton exchange membrane and the
recent developments in developing stable anion exchange membranes, it is very likely that
studies exploring this in anion exchange membranes will soon come to light. With the numerous
advantages of anion exchange membranes, including the use of cheaper catalysts and the ability
to function at lower operating temperatures, anion exchange membranes appear to be a possibly
very effective component in oxygen generation.
38
3. Methodology
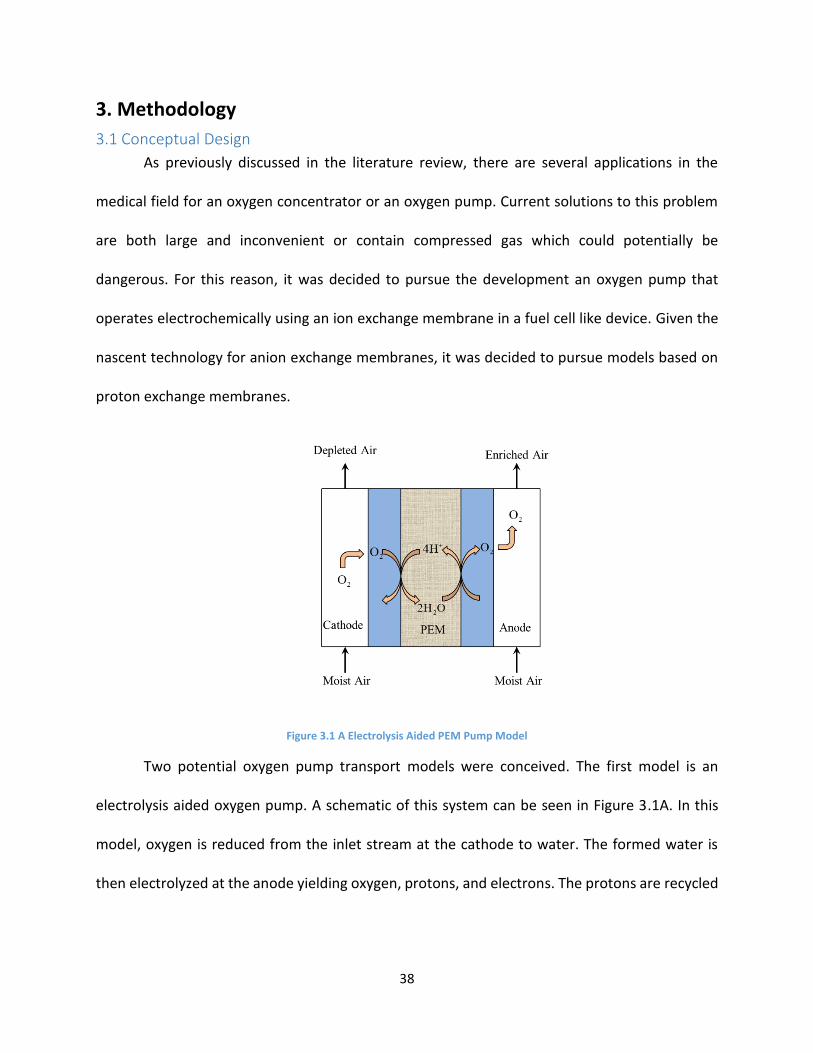
3.1 Conceptual Design
As previously discussed in the literature review, there are several applications in the
medical field for an oxygen concentrator or an oxygen pump. Current solutions to this problem
are both large and inconvenient or contain compressed gas which could potentially be
dangerous. For this reason, it was decided to pursue the development an oxygen pump that
operates electrochemically using an ion exchange membrane in a fuel cell like device. Given the
nascent technology for anion exchange membranes, it was decided to pursue models based on
proton exchange membranes.
Figure 3.1 A Electrolysis Aided PEM Pump Model
Two potential oxygen pump transport models were conceived. The first model is an
electrolysis aided oxygen pump. A schematic of this system can be seen in Figure 3.1A. In this
model, oxygen is reduced from the inlet stream at the cathode to water. The formed water is
then electrolyzed at the anode yielding oxygen, protons, and electrons. The protons are recycled

39
within the membrane for subsequent oxygen reduction at the cathode. The oxygen formed at
the anode is released in the anode exhaust stream as a part of the oxygen enriched stream.
Figure 3.1 B Two Electron Oxygen Reduction Reaction PEM Pump
The second conceptual model for oxygen transport is by way of the two electron oxygen
reduction reaction. A schematic of this process can be seen in Figure 3.1B. Oxygen from the
cathode inlet is reduced to hydrogen peroxide at the cathode. Hydrogen peroxide is transported
through the membrane and is electrolyzed at the anode, yielding oxygen, protons, and electrons.
The protons are recycled within the membrane, and the oxygen is released in the anode exhaust
stream as part of the oxygen enriched stream.

40
3.2 Apparatus
Figure 3.2 A Example Schematic of Experimental Procedure
Figure 3.2 B Diagram for the fuel cell where the cathode is receiving the humidified inlet while the anode is receiving a dry inlet. In addition, the fuel cell is connected to the power supply and the Fuel Cell Test System

41
The MEA was housed in the fuel cell assembly designed for a 5cm2 MEA as seen in the
Figure 3.2B and a sample process flow diagram has been provided in Figure 3.2A. Temperature
controlled humidifiers accompanied the test station to provide desired humidified inlets to the
fuel cell. In addition, both the anode and cathode were connected to the waste stream to ensure
no release of gases to the environment. Swagelok connections were used to ensure no leaks
occurred during the experimental runs. The testing station used to conduct the experimental
runs was located in the Fuel Cell Center at Worcester Polytechnic Institute as seen in Figure 3.2C.
Figure 3.2 C Overall Diagram of the Fuel Cell Test bed located in the Fuel Cell Center at Worcester Polytechnic Institute
Additionally, the test station contained the Fuel Cell Test System Series 89B, alongside a
computer interface which plotted the data recorded. This system, was also used to apply small
amounts of current (mA) during the activation of the each MEA. The Handi+, a portable battery-
powered oxygen sensor manufactured by Maxtec, was used to measure the O2 concentration in

42
the product stream with an accuracy of 0.1%. The sensor was calibrated before each MEA that
was tested using the oxygen or air tank in Goddard Hall’s Fuel Cell Center. The test bed shown in
Figure 3.2C contains other pieces of equipment such as valves, piping and pressure gauges which
were not necessarily a part of these experimental runs.
The HP 6651A power supply, as seen in Figure 3.2D, was used to apply voltage across the fuel cell
during the experimental runs.
Figure 3.2 D HP power supply used for the experimental runs
3.3 Materials
The experimental procedures in this study were carried out using various membrane
electrode assemblies (MEAs). Each MEA consisted of a Nafion® 115 membrane, a catalyst layer
on each side of the membrane, and a gas diffusion layer on each side of the membrane. All of the
MEAs tested had an active transport area of 5 cm2. Two types of MEAs were used for oxygen
transport studies, one with Printex L6 cathode loading and 1 mg Pt/C, the other with 1 mg Pt/C
loading on both the cathode and the anode. An MEA for electrolysis was also used in studies,
with 1 mg Pt/C loaded at the cathode and 3 mg PtIrB loaded at the anode. A complete summary
of the MEAs testing in this study can be seen in Table 3.3A.

43
Table 3.3 A Summary of Tested MEAs
MEA Name Membrane Cathode Catalyst
Anode Catalyst
Product # Supplier
P1 Nafion® 212 0.5 mg/cm2 Pt
on carbon 0.5 mg/cm2 Pt
on carbon 5L HP-A MEA
5cm2 FuelCellStore
P2 Nafion® 212 0.5 mg/cm2 Pt
on carbon 0.5 mg/cm2 Pt
on carbon 5L HP-A MEA
5cm2 FuelCellStore
P3 Nafion® 115 0.1 mg/cm2 Pt
on carbon 0.1 mg/cm2 Pt
on carbon Custom 5cm2
MEA FuelCellsEtc
C1 Nafion® 115 1 mg/cm2 Printex L6
0.1 mg/cm2 Pt on carbon
Custom 5cm2 MEA
FuelCellsEtc
C2 Nafion® 115 1 mg/cm2 Printex L6
0.1 mg/cm2 Pt on carbon
Custom 5cm2 MEA
FuelCellsEtc
I1 Nafion® 115 0.1 mg/cm2 Pt
on carbon 3 mg/cm2
PtIrB Custom 5cm2
MEA FuelCellsEtc
I2 Nafion® 115 0.1 mg/cm2 Pt
on carbon 3 mg/cm2
PtIrB Custom 5cm2
MEA FuelCellsEtc
In order to study the transport of hydrogen peroxide across the membrane, a 35%
solution of hydrogen peroxide was also obtained from Alfa Aesar. This was used to saturate inlet
streams with hydrogen peroxide in an effort to facilitate hydrogen peroxide transport through
the membrane.
Various additional materials were used in these experimental procedures. Rotameters
were purchased from Cole Parmer and had a flow range from 0 to 3 L/min. Compressed gas tanks
containing air, oxygen, hydrogen, and helium were used as the feed to the system. All tubing and
fittings were purchased through Swagelok.
3.4 Experimental
The first series of MEAs tested were the standard platinum supported on carbon. To
activate these, humidified hydrogen was fed to the anode and humidified air to the cathode for
a period of 1 – 3 hours. Following this, a current of 0.5 – 0.6 A was applied for 4 – 5 hours. The
final step in the activation was to apply varying currents between 0.4 A and 0.8 A for 15 – 20

44
minutes each, a total of four times. For the first MEA an ATR-IR spectrum was also taken in-
between each step of the activation. At the end of activation a polarization curve was taken by
scanning the current from 0 to 3 A in 0.05 A increments, holding each current for 60 seconds.
For MEA P1, the first set of experiments involved feeding humidified air to both sides of
the cell and applying a potential of 1.4 V for 20 minutes, then 1.5 V for 30 minutes. The next set
of experiments was to feed humidified He to both sides of the cell and apply 1.5 V for an hour,
then 1.6 V for 45 minutes. The final experiment was to feed heated humidified He to both sides
of the cell, this was accomplished by heating the humidifiers from 11o C to 27o C before beginning
the experimental run. Once the humidifiers were at 27o C a potential of 1.6 V was applied for 5
minutes, immediately followed by a potential of 1.8 V for 5 minutes, immediately followed by a
potential of 2.0 V for 1 hour. After the first 40 minutes of the experiment the humidifiers were
heated to 50o C. At the conclusion of these tests a polarization curve was taken, as described
above at the end of the activation, and compared to the first polarization curve to determine the
condition of the MEA.
For MEA P2, the first set of experiments involved feeding humidified He to the cathode
and dry He to the anode while applying potentials between 1.4 V and 2.0 V for 5 minute intervals.
The next set of experiments was to feed humidified air to the cathode and dry air to the anode
while applying various potentials between 1.3 V and 2.0 V for 5 minutes apiece. The final set of
experiments was to feed dry air to the anode and dry O2 to the cathode while applying potentials
between 0.8 V and 2.0 V for periods of time shorter than 10 minutes. At the conclusion of these

45
tests a polarization curve was taken, as described above at the end of the activation, and
compared to the first polarization curve to determine the condition of the MEA.
For MEA P3, only two experiments were run. First He with H2O and H2O2 vapor was fed
to the cathode and humidified air was fed to the anode while applying potentials between 1.0 V
and 1.2 V. Then humidified air was fed to the cathode and He with H2O and H2O2 vapor was fed
to the anode while applying potentials between 1.0 V and 1.2 V.
The next series of MEAs tested were the Printex L6 (carbon). To activate these, humidified
air was fed to both sides overnight, 12 – 20 hours. For MEA C1, the first set of experiments
involved applying potentials between 0.4 and 1.0 V while first feeding humidified air to both sides
and then dry air to both sides. The next set of experiments was to feed H2 to the Pt anode and
humidified air to the carbon cathode while varying the applied potential. The last set of
experiments preformed fed humidified O2 to the cathode and dry air to the anode while varying
the applied potential between 1.0 V and 0.4 V.
For MEA C2, the first set of experiments involved feeding humidified O2 to the cathode
and dry air to the anode while applying varying potentials between 1.3 V and 0.4 V. The next set
of experiments involved feeding first dry air then humidified air to the anode and He with H2O
and H2O2 vapor to the cathode while varying the applied potential. The third set of experiments
was to feed He with H2O and H2O2 vapor to the anode and humidified air to the cathode while
varying the potential.
The last series of MEAs tested were standard electrolysis MEAs that had solid Pt/Ir anodes
and Pt supported on carbon at the cathode. To activate these MEAs, humidified air was fed to
46
both sides for an hour. Next humidified air was fed to both sides for 4 – 5 hours and a constant
potential of 0.4 V to 0.5 V is applied. The last step was to apply varying potentials between 0.2 V
and 0.8 V for 20 minute periods while feeding humidified air to both sides. For MEA I1, the first
set of experiments was to feed humidified air to both sides of the cell while varying the applied
potential between 1.2 V and 1.8 V and varying the systems temperature between 11o C and 80o
C. The next set of experiments was to apply potentials between 1.0 V and 1.2 V while first feeding
humidified air to the cathode and He with H2O and H2O2 vapor to the anode; then switching the
feeds so that the He with H2O and H2O2 vapor is going to the cathode and the humidified air is
going to the anode. The final set of experiments involved feeding humidified O2 to the cathode
and liquid water to the anode while applying 1.4 V to 1.5 V.
The last membrane tested, MEA I2, was tested in four general areas. The first was testing
H2O2 electrolysis by feeding He with H2O2 vapor and H2O vapor to the anode and feeding
humidified air to the cathode while applying potentials between 0.8 V and 1.5 V. The second test
was performing liquid water electrolysis rather than vapor electrolysis, and was tested by feeding
liquid water to the anode and feeding humidified He to the cathode while applying various
potentials between 1.6 V and 2.5 V. The third test was vapor electrolysis, which was tested by
feeding both humidified He and air to both sides in turn while applying potentials between 1.2 V
and 2.0 V. The final test was an electrolysis driven oxygen pump which was tested by feeding
each in turn: dry O2, humidified O2, humidified air, and humidified He to the cathode and feeding
each in turn: humidified He, humidified air, and liquid water to the anode while applying
potentials between 1.2 V and 2.0 V. For the full tabularized list of tests and results on all MEAs,
please refer to Appendix A.
47
4. Results & Discussion
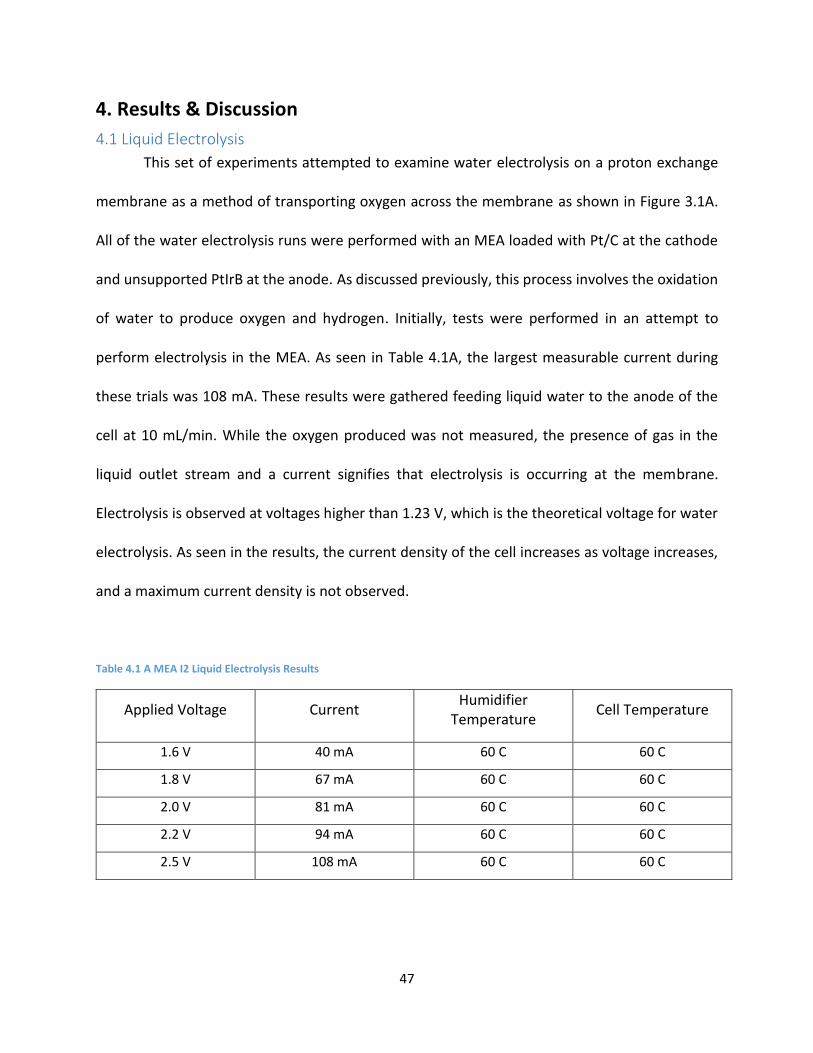
4.1 Liquid Electrolysis
This set of experiments attempted to examine water electrolysis on a proton exchange
membrane as a method of transporting oxygen across the membrane as shown in Figure 3.1A.
All of the water electrolysis runs were performed with an MEA loaded with Pt/C at the cathode
and unsupported PtIrB at the anode. As discussed previously, this process involves the oxidation
of water to produce oxygen and hydrogen. Initially, tests were performed in an attempt to
perform electrolysis in the MEA. As seen in Table 4.1A, the largest measurable current during
these trials was 108 mA. These results were gathered feeding liquid water to the anode of the
cell at 10 mL/min. While the oxygen produced was not measured, the presence of gas in the
liquid outlet stream and a current signifies that electrolysis is occurring at the membrane.
Electrolysis is observed at voltages higher than 1.23 V, which is the theoretical voltage for water
electrolysis. As seen in the results, the current density of the cell increases as voltage increases,
and a maximum current density is not observed.
Table 4.1 A MEA I2 Liquid Electrolysis Results
Applied Voltage Current Humidifier
Temperature Cell Temperature
1.6 V 40 mA 60 C 60 C
1.8 V 67 mA 60 C 60 C
2.0 V 81 mA 60 C 60 C
2.2 V 94 mA 60 C 60 C
2.5 V 108 mA 60 C 60 C

48
The measured current density for water electrolysis in this study is, however, inexplicably
much lower than published values for proton exchange membrane electrolysis (Eladeb et al.,
2012; Greenway et al., 2009). A potential cause for this problem is the formation of vapor bubbles
on the membrane at the site of water electrolysis. The formation of vapor bubbles in the liquid
feed to the cell can seriously hinder the mass transfer and hence the performance of the
electrolysis cell. While flowing bubbles can potentially provide transport of liquid water to the
membrane, too many bubbles can limit the contact area between the liquid water and the
surface of the membrane (Spurgeon & Lewis, 2011). This in turn reduces the amount of
electrolysis that occurs. It’s very likely that a limiting density can be reached, with the amount of
bubbles forming on the membrane limiting any increase in electrolysis, although such a limit was
not reached. The flow rate of liquid water may also have an effect on the formation of bubble at
the site of electrolysis. Due to the lack of a settable pump, this effect was unable to be measured.
Many studies opt for low liquid water flow rates when performing proton exchange membrane
electrolysis, although a higher flow rate may be more beneficial due to the likelihood of the flow
either pushing the forming vapor to the membrane or flushing it out of the system. It has been
shown that a higher stoichiometric ratio of water, associated with a higher flow rate, decreases
the current density in an electrolysis membrane (Greenway et al., 2009). It follows that proper
operation requires the correct balance between these two parameters. A more in-depth and
precise testing procedure would most likely provide a more favorable result.
4.2 Vapor Electrolysis
Vapor electrolysis was also examined in this study using a similar membrane, a Pt/C
catalyst at the cathode and unsupported PtIrB catalyst at the anode. The mechanism is exactly

49
the same as liquid electrolysis, with the exception that water vapor is used as the feed to the
system rather than liquid. More trials were attempted to create an oxygen pump using the same
membrane. The process would include oxygen reduction at the cathode and water electrolysis at
the anode to pass oxygen from the cathode to the anode as seen in Figure 3.1A. In these trials,
the current density and the change in oxygen composition were measured to assess the
performance of the cell. As seen in the results, these trials provided less than desirable results.
At most, the oxygen content of the outlet stream rose 0.3%. A summary table of the complete
results of these runs can be found in Appendix A.
Table 4.2 A Vapor Electrolysis Results at Ambient Temperature
Cathode Feed Anode Feed Applied
Voltage
Observed
Current
Change in Oxygen
Concentration
Humidified Air at
60 mL/min
Humidified Air at
40 mL/min
1.3 V 26 mA 0.05 %
1.4 V 40 mA 0.1 %
1.5 V 47 mA 0.1 %
1.6 V 53 mA 0.1 %
1.7 V 60 mA 0.1 %
1.8 V 67 mA 0.1 %

50
Table 4.2 B Vapor Electrolysis Results at Elevated Temperature
Cathode Feed Anode Feed Applied Voltage
Observed Current
Change in Oxygen Concentration
Humidifier Temperature
Humidified Air
at 235 mL/min
Humidified Air
at 235 mL/min
1.5 V 94 mA 0.2 % 61 C
1.5 V 94 mA 0.3 % 65 C
1.5 V 108 mA 0.1 % 71 C
1.5 V 163 mA 0.2 % 75 C
1.5 V 163 mA 0.2 % 80 C
As seen in the results, vapor electrolysis yields similar current densities to that of liquid
electrolysis. While vapor electrolysis avoid the problem of bubble formation which was discussed
earlier, there are a number of issues with vapor electrolysis. The majority of these problems stem
from the mass transport limitations that occur at higher current densities with water vapor
(Spurgeon & Lewis, 2011; Greenway et al., 2009; Fox & Colón-Mercado, 2011). A mass flux limit
is reached at relatively low values of electrolysis, as water molecules are unable diffuse any faster
through the membrane.
This mass flux limit could potentially be caused by two things. The first possible issue with
the system is the formation of water in the MEA. It is known that liquid water can be detrimental
to the operation of a PEM fuel cell, as the excess presence of water can smother the gas
electrodes and ultimately flood it (Pasaogullari & Wang, 2004). This can also be a serious issue at
the gas diffusion layer as well (Pasaogullari & Wang, 2004; Litster et al., 2006). When considering

51
these studies along with the conceptual model of the electrolysis aided oxygen pump, this could
be an issue for the oxygen reduction reaction. There is the possibility that too much water could
completely flood the gas diffusion layer. If too much water is created at the cathode and the gas
diffusion layer is also flooded, oxygen from the cathode inlet stream is prevented from passing
through to the catalyst. This could potentially be a cause for a mass flow limitation in the system.
While the presence of liquid water in the membrane is beneficial to the system, the level at which
it would have to be controlled may be an issue that prevents the design of an efficient system
based on an electrolysis aided pump.
Oxygen transport concerns through the gas diffusion layer is a topic of concern as well. It
has been shown that the presence of nitrogen in the cathode feed stream significantly reduces
the transport of oxygen across the gas diffusion layer (Benzinger et al., 2011). The presence of
the nitrogen takes up space in the gas diffusion layer and inhibits oxygen transport. This issue is
not unique to this design, as it is also an issue for air-fed PEM fuel cells. Normally operating fuel
cells do not seem to have a serious issue with this problem, so it is possible that this should be of
no concern in this case. It is more likely that this oxygen transport issue, when combined with
the liquid water problem discussed earlier, is a possible hindrance to the operation of the
electrolysis aided pump.
Relative humidity is another issue with vapor electrolysis, as the feed streams must be at
a relative humidity of 95% or higher, otherwise the electrolysis activity is greatly diminished
(Spurgeon & Lewis, 2011). It is assumed here that the relative humidity of the streams in this
experiment were of adequate values, although the humidity was never measured. This signifies

52
that the mass flux limitation is the limiting factor to these trials. Published results show that the
voltage at which this limit is reached lies between 1.6 and 2.0 V, at which the current density at
room temperature is varying between 40 mA/cm2 and 90 mA/cm2 (Spurgeon & Lewis, 2011;
Greenway et al., 2009). Using these numbers, the amount of oxygen that could be produced
through vapor electrolysis is roughly 1.6 mL/min. The efforts to scale this up to a practical design
would not be worthwhile, as the system would require too large of a housing, making it
impractical for the intended use as put forth by this study. Although vapor electrolysis can be
used to produce oxygen, its mass flow limitations at higher current densities and its requirement
for high relative humidity prove it to be impractical.
4.3 Two Electron Oxygen Reduction
This group of experiments examined the two electron oxygen reduction aided O2 pump
(as seen schematically in Figure 3.1B). The first set of experiments were on the carbon (Printex
L6) catalyzed MEAs. MEA C1 was tested by applying varying potentials between 0.4 V and 1.0 V
while feeding different gases to the cell. We tested dry air to both sides, humidified air to both
sides, and humidified O2 to the cathode with dry air to the anode. No current or change in percent
O2 where observed for all trials. This lack of generated current indicates that the desired 2 e- ORR
and O2 transfer was not achieved, as further supported by the static O2 levels observed during
the tests. After these tests, MEA C1 was run in fuel cell mode by feeding humidified O2 to the
cathode and dry H2 to the anode resulting in an OCV of 0.20 V. This OCV indicates a very low level
of electrochemical active and as such, prompted the end of testing on MEA C1.
MEA C2 was tested by applying potentials between 0.4 V to 1.3 V while feeding humidified
O2 to the cathode with dry air to the anode. No current or change in O2 levels were observed

53
below 1.2 V. However, small currents of 12 mA and 26 mA were observed at 1.2 V and 1.3 V
respectively, with no discernable change in percent O2 in the anode exhaust. The complete lack
of activity below 1.2 V indicates the desired O2 transfer was not achieved. Additionally the small
currents achieved at and above 1.2 V show that MEA C2 is electrochemically active and capable
of H2O2 electrolysis. Next MEA C2 was tested by applying potentials between 1.0 V and 2.5 V
while feeding humidified air to the anode with He bubbled through 35% H2O2 fed to the cathode.
Below 1.2 V there was no observable current or change in O2 levels. At higher potentials an
increase in current and decrease in O2 at the anode exhaust was observed up to 135 mA and –
4.2% O2 at 2.5 V, once again indicating that MEA C2 is electrochemically active and capable of
H2O2 electrolysis. The final testing for MEA C2 involved applying potentials between 1.0 V and
1.2 V while feeding humidified air to the cathode with He bubbled through 35% H2O2 to the
anode. For these final trials no change in current or O2 levels where observed.
The next MEA tested was a standard fuel cell MEA with Pt supported on carbon as the
catalyst for both sides. First varying potentials between 1.0 V and 1.2 V were applied while
humidified air was fed to the cathode and He bubbled through H2O2 was fed to the anode. No
change in O2 levels or current was observed. Next He bubbled through H2O2 was fed to the
cathode and humidified air was fed to the anode while potentials between 1.0 V and 1.2 V were
applied. Each of these trials generated a small current and a small decrease in O2 levels, as seen
in Table 4.3A. This small decrease in O2 levels at the anode coupled with potentials under 1.2 V
suggest that we are electrolyzing the supplied H2O2 at the cathode and transporting H+ across the
membrane to form H2 at the anode.
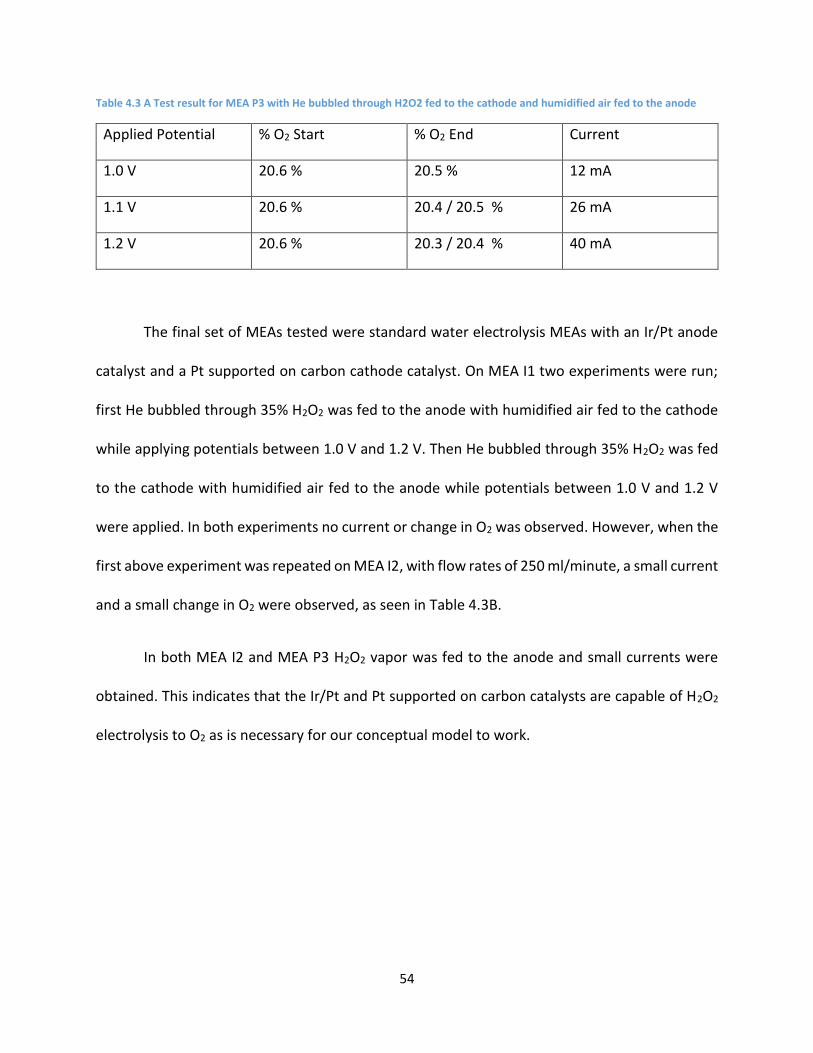
54
Table 4.3 A Test result for MEA P3 with He bubbled through H2O2 fed to the cathode and humidified air fed to the anode
Applied Potential % O2 Start % O2 End Current
1.0 V 20.6 % 20.5 % 12 mA
1.1 V 20.6 % 20.4 / 20.5 % 26 mA
1.2 V 20.6 % 20.3 / 20.4 % 40 mA
The final set of MEAs tested were standard water electrolysis MEAs with an Ir/Pt anode
catalyst and a Pt supported on carbon cathode catalyst. On MEA I1 two experiments were run;
first He bubbled through 35% H2O2 was fed to the anode with humidified air fed to the cathode
while applying potentials between 1.0 V and 1.2 V. Then He bubbled through 35% H2O2 was fed
to the cathode with humidified air fed to the anode while potentials between 1.0 V and 1.2 V
were applied. In both experiments no current or change in O2 was observed. However, when the
first above experiment was repeated on MEA I2, with flow rates of 250 ml/minute, a small current
and a small change in O2 were observed, as seen in Table 4.3B.
In both MEA I2 and MEA P3 H2O2 vapor was fed to the anode and small currents were
obtained. This indicates that the Ir/Pt and Pt supported on carbon catalysts are capable of H2O2
electrolysis to O2 as is necessary for our conceptual model to work.
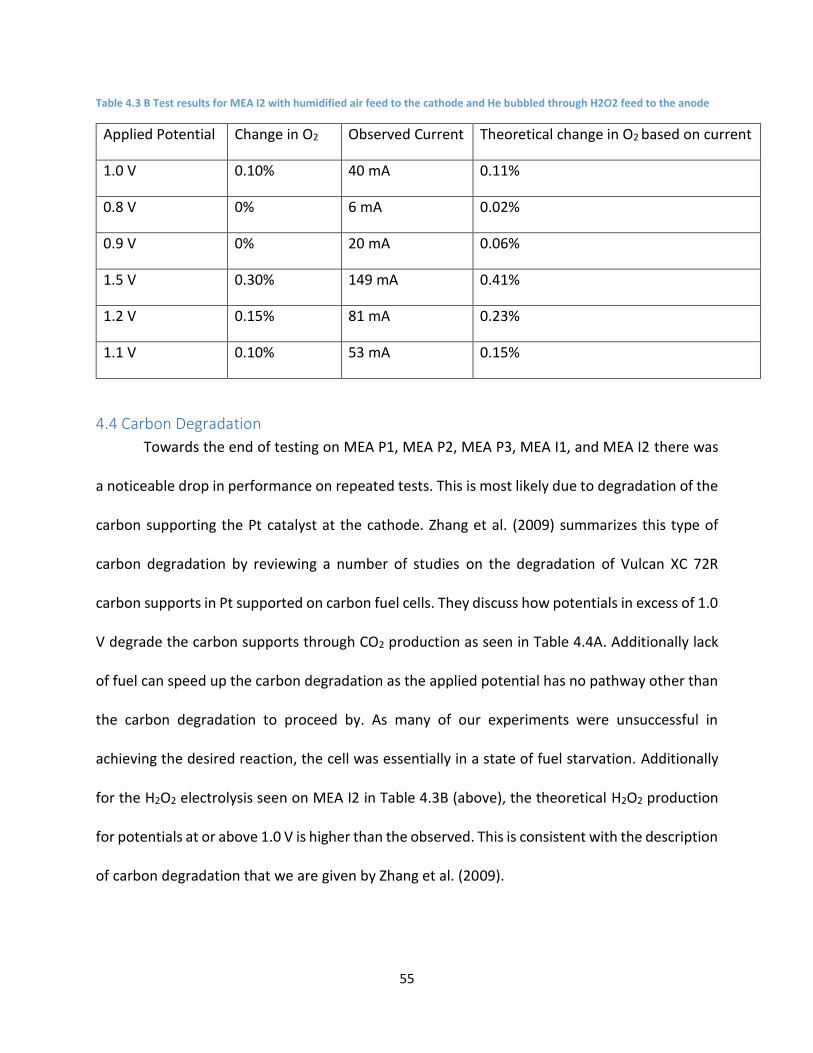
55
Table 4.3 B Test results for MEA I2 with humidified air feed to the cathode and He bubbled through H2O2 feed to the anode
Applied Potential Change in O2 Observed Current Theoretical change in O2 based on current
1.0 V 0.10% 40 mA 0.11%
0.8 V 0% 6 mA 0.02%
0.9 V 0% 20 mA 0.06%
1.5 V 0.30% 149 mA 0.41%
1.2 V 0.15% 81 mA 0.23%
1.1 V 0.10% 53 mA 0.15%
4.4 Carbon Degradation
Towards the end of testing on MEA P1, MEA P2, MEA P3, MEA I1, and MEA I2 there was
a noticeable drop in performance on repeated tests. This is most likely due to degradation of the
carbon supporting the Pt catalyst at the cathode. Zhang et al. (2009) summarizes this type of
carbon degradation by reviewing a number of studies on the degradation of Vulcan XC 72R
carbon supports in Pt supported on carbon fuel cells. They discuss how potentials in excess of 1.0
V degrade the carbon supports through CO2 production as seen in Table 4.4A. Additionally lack
of fuel can speed up the carbon degradation as the applied potential has no pathway other than
the carbon degradation to proceed by. As many of our experiments were unsuccessful in
achieving the desired reaction, the cell was essentially in a state of fuel starvation. Additionally
for the H2O2 electrolysis seen on MEA I2 in Table 4.3B (above), the theoretical H2O2 production
for potentials at or above 1.0 V is higher than the observed. This is consistent with the description
of carbon degradation that we are given by Zhang et al. (2009).
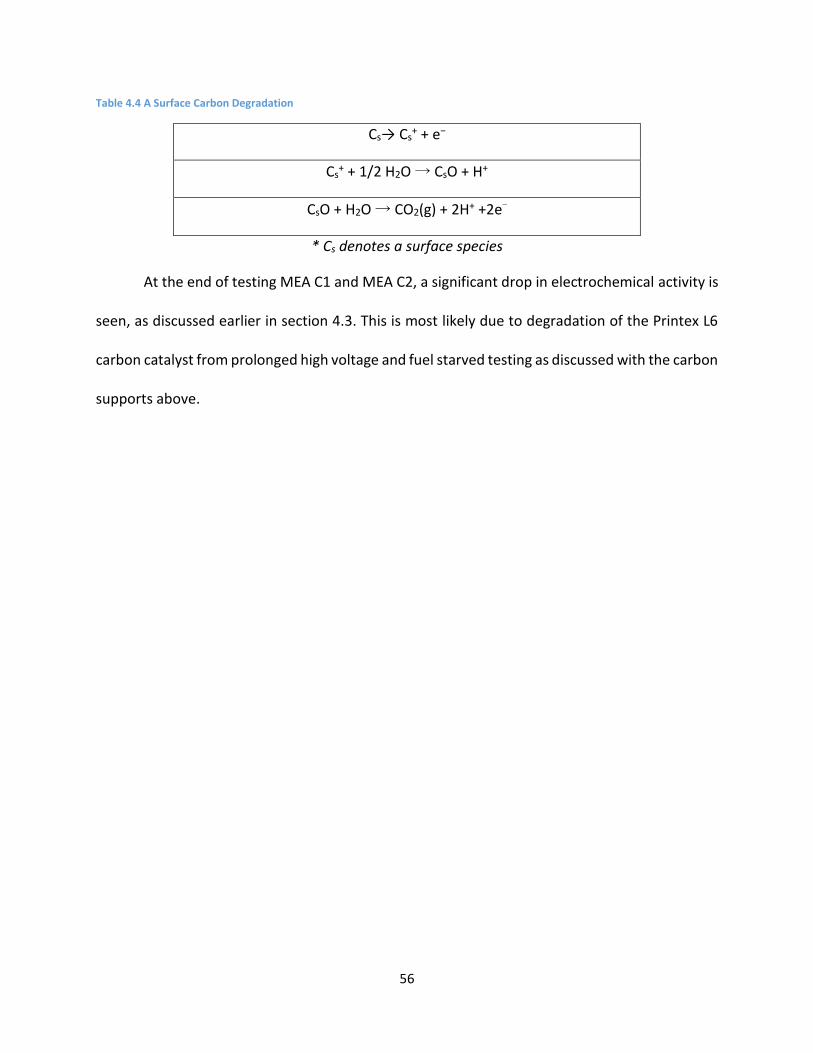
56
Table 4.4 A Surface Carbon Degradation
Cs→ Cs+ + e−
Cs+ + 1/2 H2O → CsO + H+
CsO + H2O → CO2(g) + 2H+ +2e−
* Cs denotes a surface species
At the end of testing MEA C1 and MEA C2, a significant drop in electrochemical activity is
seen, as discussed earlier in section 4.3. This is most likely due to degradation of the Printex L6
carbon catalyst from prolonged high voltage and fuel starved testing as discussed with the carbon
supports above.

57
5. Conclusion and Recommendations
5.1 Conclusion
In this study, oxygen transport through a proton exchange membrane fuel cell was
examined in an effort to develop an efficient and effective oxygen pump. The examined MEAs
were loaded with catalysts such as Pt/C, Printex L6, and PtIrB in varying combinations. Each MEA
was run under a varying number of conditions, including feed stream composition, applied
voltage, and temperature. The change in oxygen concentration of the outlet streams and the
generated current were observed and recorded.
As seen in the results for the vapor electrolysis trials, any significant oxygen generation at
the anode of the cell was unattainable in these experiments. The inability to sustain a large
current during vapor electrolysis inhibits the ability of the cell to transport oxygen across the
membrane. While increasing cell size, stacking multiple membranes, and increasing the cell
operating temperature could increase the oxygen yield, these changes to the cell would not make
it any more viable. The membrane area and stacking number of membranes required to achieve
significant oxygen transport would be too large for the design to be a compact and convenient
size. Increasing the temperature of the cell would inhibit the use of the cell as a safe personal
oxygen generator.
In terms of the two electron reduction transport of oxygen, neither the Pt/C catalyst nor
the Printex L6 catalyst was effective in promoting two electron reduction at the cathode. Oxygen
transport was comparable to that of the electrolysis aided pump, and as such neither system
would be suitable for this application. Based on these results, an attempted scale up of these
systems to achieve an effective full-size model would ultimately prove futile.

58
While the vapor electrolysis aided pump is most likely to be ineffective as a method of
oxygen transport, the two electron oxygen reduction method may show some promise in future
testing. The primary issue with the Pt/C and Printex L6 catalyst is that they failed to foster the
formation of hydrogen peroxide at the cathode of the cell. Further research has revealed a
number of catalysts that are more selective for and much more effective for the reduction of
oxygen to hydrogen peroxide. Any further research on this project must begin with the
examination of different catalysts for the oxygen reduction reaction. Subsequent design of the
device can most likely be successfully continued from that point.
5.2 Recommendations The encouraging preliminary results of this project should be followed up with additional
research as suggested to determine the feasibility of oxygen pumping across ion exchange
membrane for the development of an oxygen generator.
5.2.1 Use of Alternative Catalysts
When considering the use of catalysts to assist in this reaction, the following catalysts come
to mind: Pt/C, Pt/Ni and Pt/Ag. This project was only able to conduct preliminary testing on
carbon catalysts. Furthermore, the team has found related research suggesting a variety of
catalysts to test at the cathode side.
Research studies have shown promising results regarding the electrochemical reduction of
oxygen to hydrogen peroxide will be discussed next. For the PEM oxygen pump design, the
cathode side reaction involves the reduction of oxygen to (or production of) hydrogen peroxide.
It is evident that the reaction will require an active, selective and stable catalyst to catalyze the
reaction. Siahrostmi’s study shows Pt-Hg (mercury) to be promising through initial calculations

59
(Siahrostami et al., 2013). In addition, electrochemical measurements suggest Pt-Hg
nanoparticles shows more than an order of magnitude of improvement in mass activity as seen
in the Figure 6.1A below (Siahrostami et al., 2013). It can be seen from Figure 6.1A that the
activity of only platinum is very inefficient. Therefore, Siahrostami results and this project study
on carbon should be taken in consideration for further experiments.
Figure 6.1 A Overview of different electro catalysts for H2O2 production (Siahrostami et al., 2013)
Another study focusing on the anode side reactions suggests a possible catalyst layer that
could be studied to help control the production of H2O2. This study shows a decrease in cathode
open circuit voltage, OCV, correlates to the amount of H2O2 generated within the membrane
(Jung, 2007). The study confirms that a PEMFC with a Pt/ RuC layer at the anode, experiences a
high OCV thus suggesting a lower concentration of H2O2. Though Jung’s findings show do not

60
directly relate to this section, it important to understand potential relationships between testing
parameters.
5.2.2 Fabricating Membranes
As the alternative catalysts suitable for future tests are to be explored, a recommendation is
made to fabricate MEAs with these catalysts accessible commercially. When considering the
further testing of MEAs fabricating, MEAs in the lab will help ensure proper preparations of
membranes since the preparation procedure will be consistent for each MEA created. A sample
procedure has been provided in Appendix C. Further research describes some common
procedures used to load catalysts onto membranes such as the use of spray gun to apply the
platinum onto the membrane under an infrared lamp (Leimin et al., 2009). Additionally, a sputter
technique has been proven to be a useful method to apply minimal amounts (such as
nanoparticles) of platinum on PEMs especially onto Nafion® (Wee et al., 2010). This method could
potentially be adapted for to construct the Pt/Hg-C nanoparticles membrane previously
discussed. The primary benefit for fabricating membranes by hand is the freedom to test various
catalysts.

61
5.2.3 Stacking
If future results are more promising than those in this study, scale up would require testing
MEAs in series as seen in the Figure 6.3A, which will be important for the scale up requirement
for the oxygen generation device. In order to achieve the desired volumetric flow of enriched O2
multiple MEAs together otherwise, i.e., a fuel cell stack, will need to thoroughly investigate. The
project team suggests focusing on the total current density achieved, amount of O2 produced
and amount of time need to produce O2.
Figure 6.3A Sample Fuel Cell Stack (Fuel Cell Store, 2013) Figure 6.3 A Sample Fuel Cell Stack (Fuel Cell Store, 2013)

62
5.2.4 Anion Exchange Membranes
Figure 6.4 A Sample Anion Exchange Membrane for metal cation-free alkaline fuel cell
PEMs are not the only the type membranes viable for conducting such experiments. Anion
exchange membranes (AEM) behave similar to PEMs, however, instead of the proton (+) a
negative charge (-) passes across the membrane. The restriction on time did not allow for the
testing of AEM membranes, however, background section 2.4 on AEM will be useful for further
studies. Utilizing MEAs based on AEMs, which might prove to be more effective than based on
PEMs.
5.2.5 Mathematical Analysis
Mathematical analysis can be insightful. A useful recommendation for future researchers is
to develop a PEM fuel cell (PEMFC) model for oxygen pumping using COMSOL Multiphysics.
COMSOL Multiphysics is a software package that allows for an interactive environment for
modeling and simulating scientific and engineering problems. The model can be used a tool to

63
better understand the physics of PEMFC based oxygen pump. The following figure is an example
of the PEMFC modeled in COMSOL.
Figure 6.5 A Geometry of a proton exchange membrane (PEM) modeled in COMSOL Multiphysics. (COMSOL Multiphysics, 2014)
The makers of COMSOL have provided the following example of an analysis when modeling a
PEMFC: Ohmic Losses and Temperature Distribution in a Passive PEM Fuel Cell
A sample graph from the results of the case study above can be found in Appendix D. The main
recommendation for future researchers is to develop and use a COMSOL model as a tool to gain
a better understanding on the concept of the oxygen pump and testing parameters. In addition,
COMSOL can help provide a theoretical approach and provide a basis on what to expect before
conducting experimental in the laboratory.
64
Works Cited Arges, C.G., Ramani, V, and Pintauro, P.N. (2010). Anion Exchange Membrane Fuel Cells.
Electrochem. Soc. Interface. 19. 31-35.
Assumpção, M. H. M. T., De Souza, R. F. B., Rascio, D. C., Silva, J. C. M., Calegaro, M. L., Gaubeur,
I., Paixão, T. R. L. C., & Hammer, P. (2012). A comparative study of the electrogeneration of
hydrogen peroxide using vulcan and printex carbon supports. Carbon, 49(8), 2842–2851.
Benziger, J., Kimball, E., Mejia‐Ariza, R., & Kevrekidis, I. (2011). Oxygen mass transport limitations
at the cathode of polymer electrolyte membrane fuel cells. AIChE Journal, 57(9), 2505-2517.
Boehm, H. P., Mair, G., Stoehr, T., deRincon, A. R., & Tereczki, B. (1984). Carbon as a catalyst in
oxidation reactions and hydrogen halide elimination reactions. Fuel, 63(8), 1061-1063.
Brillas, E., A. Maestro, M. Moratalla, and J. Casado. "Electrochemical extraction of oxygen from
air via hydroperoxide ion." Journal of applied electrochemistry 27, no. 1 (1997): 83-92.
Choi, P., Jalani, N. H., Thampan, T. M., and Datta, R., “Consideration of Thermodynamic,
Transport, and Mechanical Properties in the Design of Polymer Electrolyte Membranes for Higher
Temperature Fuel Cell Operation,” J. Polymer Sci. B: Polymer Phys., 44, 2183 - 2200 (2006).
Coms, F. D. (2008). The chemistry of fuel cell membrane chemical degradation.ECS
Transactions, 16(2), 235-255.
COMSOL Blog. (n.d.). PEM Fuel Cell Modeling Examples. Retrieved April 23, 2014, from
http://www.comsol.com/blogs/pem-fuel-cell-modeling-examples/
Eladeb, Boulbaba, Caroline Bonnet, Eric Favre, and François Lapicque. "Electrochemical
extraction of oxygen using PEM electrolysis technology." Platinized titanium dioxide electrodes
for methanol oxidation and photo-oxidation: 211 (2012).
Fox, E. B., & Colón-Mercado, H. R. (2011). Mass transport limitations in proton exchange
membrane fuel cells and electrolyzers. Mass Transfer—Advanced Aspects.
Fuel Cell Store. (n.d.). FuelCellStore.com. Retrieved April 23, 2014, from
http://www.fuelcellstore.com/en/pc/viewcategories.asp?idCategory=8
Fujita, Y., Nakamura, H., & Muto, T. (1985). An electrochemical oxygen separator using an ion-
exchange membrane as the electrolyte. Journal of Applied Electrochemistry, 16(6), 935-940. doi:
10.1007/BF01006541
65
Greenway, S. D., Fox, E. B., & Ekechukwu, A. A. (2009). Proton exchange membrane (PEM)
electrolyzer operation under anode liquid and cathode vapor feed configurations. International
journal of hydrogen energy, 34(16), 6603-6608.
Grew, K. N., Chu, D., and Chiu, W. K. S., “Ionic Equilibrium and Transport in the Alkaline Anion
Exchange Membrane,” J. Electrochem. Soc., 157, B1024-B1032 (2010).
Gauthier, W. D., Hendricks, M. J., & Babcock, R. L. U.S. Patent and Trademark Office,
(1980). Oxygen enrichimient system for medical use (US4222750 A).
Hydrogen peroxide. In (1974). D. Considine (Ed.), Chemical and Process Technology Encyclopedia.
New York: McGraw-Hill Book Company.
Jung, U. H., Jeong, S. U., Chun, K., Park, K. T., Lee, H. M., Choi, D. W., & Kim, S. H. (2007). Reduction of hydrogen peroxide production at anode of proton exchange membrane fuel cell under open-circuit conditions using ruthenium–carbon catalyst. Journal of power sources, 170(2), 281-285. Langer, S. H., & Haldeman, R. G. (1964). Electrolytic Separation and Purification of Oxygen from
a Gas Mixture. The Journal of Physical Chemistry, 68(4), 962-963.
Leimin, X., Shijun, L., Lijun, Y., & Zhenxing, L. (2009). Investigation of a Novel Catalyst Coated Membrane Method to Prepare Low‐Platinum‐Loading Membrane Electrode Assemblies for PEMFCs. Fuel Cells, 9(2), 101-105. Litster, S., & McLean, G. (2004). PEM fuel cell electrodes. Journal of Power Sources, 130(1), 61-
76.
Litster, S., Sinton, D., & Djilali, N. (2006). Ex situ visualization of liquid water transport in PEM fuel
cell gas diffusion layers. Journal of Power Sources, 154(1), 95-105.
Ma, C. A., & Yu, W. G. (1995). An electrochemical device for oxygen production avoiding the
generation of hydrogen. Journal of Applied Electrochemistry,26(8), 881-885. doi:
10.1007/BF00683751
Mauritz, K. A., & Moore, R. B. (2004). State of understanding of Nafion®. Chemical
reviews, 104(10), 4535-4586.
Merle, G., Wessling, M., and Nijmeijer, K., “Anion Exchange Membranes for Alkaline Fuel Cells: A
Review,” J. Memb. Sci., 377, 1-35 (2011).
Panizza, M., & Cerisola, G. (2008). Electrochemical generation of h2o2 in low ionic strength media
on gas diffusion cathode fed with air. Electrochimica Acta, 54(2), 876–878. Retrieved from
http://www.sciencedirect.com/science/article/pii/S0013468608009390
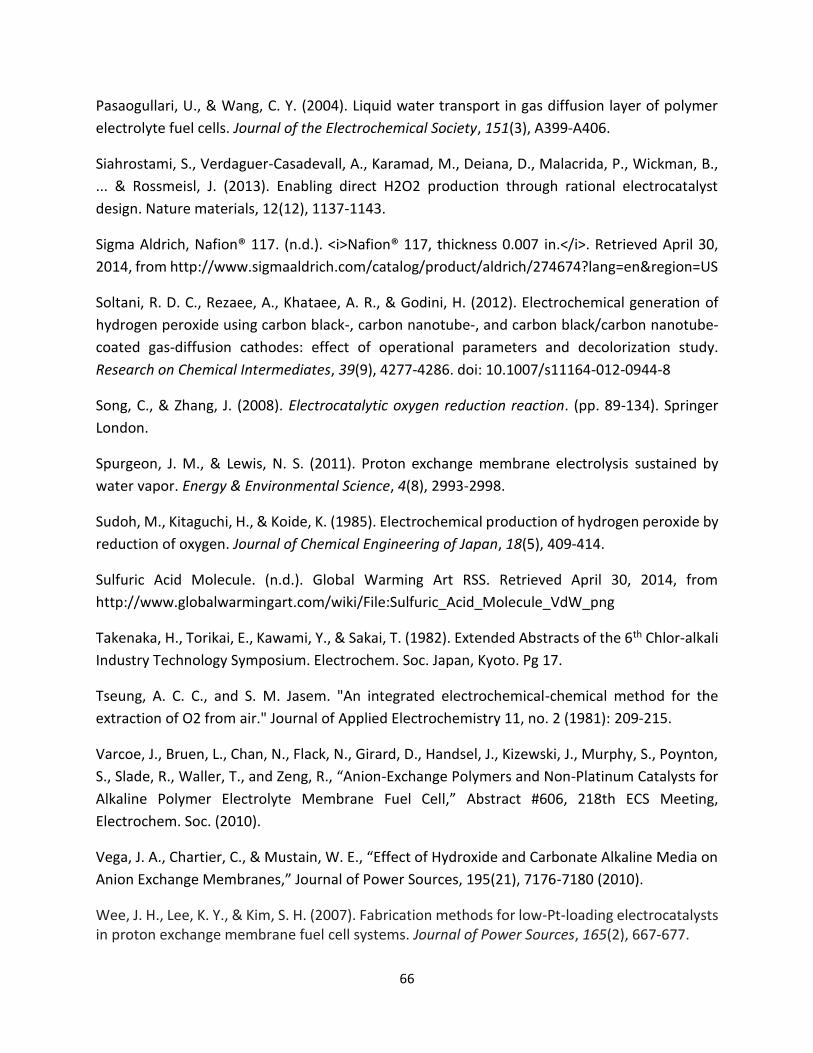
66
Pasaogullari, U., & Wang, C. Y. (2004). Liquid water transport in gas diffusion layer of polymer
electrolyte fuel cells. Journal of the Electrochemical Society, 151(3), A399-A406.
Siahrostami, S., Verdaguer-Casadevall, A., Karamad, M., Deiana, D., Malacrida, P., Wickman, B.,
... & Rossmeisl, J. (2013). Enabling direct H2O2 production through rational electrocatalyst
design. Nature materials, 12(12), 1137-1143.
Sigma Aldrich, Nafion® 117. (n.d.). <i>Nafion® 117, thickness 0.007 in.</i>. Retrieved April 30,
2014, from http://www.sigmaaldrich.com/catalog/product/aldrich/274674?lang=en®ion=US
Soltani, R. D. C., Rezaee, A., Khataee, A. R., & Godini, H. (2012). Electrochemical generation of
hydrogen peroxide using carbon black-, carbon nanotube-, and carbon black/carbon nanotube-
coated gas-diffusion cathodes: effect of operational parameters and decolorization study.
Research on Chemical Intermediates, 39(9), 4277-4286. doi: 10.1007/s11164-012-0944-8
Song, C., & Zhang, J. (2008). Electrocatalytic oxygen reduction reaction. (pp. 89-134). Springer
London.
Spurgeon, J. M., & Lewis, N. S. (2011). Proton exchange membrane electrolysis sustained by
water vapor. Energy & Environmental Science, 4(8), 2993-2998.
Sudoh, M., Kitaguchi, H., & Koide, K. (1985). Electrochemical production of hydrogen peroxide by
reduction of oxygen. Journal of Chemical Engineering of Japan, 18(5), 409-414.
Sulfuric Acid Molecule. (n.d.). Global Warming Art RSS. Retrieved April 30, 2014, from
http://www.globalwarmingart.com/wiki/File:Sulfuric_Acid_Molecule_VdW_png
Takenaka, H., Torikai, E., Kawami, Y., & Sakai, T. (1982). Extended Abstracts of the 6th Chlor-alkali
Industry Technology Symposium. Electrochem. Soc. Japan, Kyoto. Pg 17.
Tseung, A. C. C., and S. M. Jasem. "An integrated electrochemical-chemical method for the
extraction of O2 from air." Journal of Applied Electrochemistry 11, no. 2 (1981): 209-215.
Varcoe, J., Bruen, L., Chan, N., Flack, N., Girard, D., Handsel, J., Kizewski, J., Murphy, S., Poynton,
S., Slade, R., Waller, T., and Zeng, R., “Anion-Exchange Polymers and Non-Platinum Catalysts for
Alkaline Polymer Electrolyte Membrane Fuel Cell,” Abstract #606, 218th ECS Meeting,
Electrochem. Soc. (2010).
Vega, J. A., Chartier, C., & Mustain, W. E., “Effect of Hydroxide and Carbonate Alkaline Media on
Anion Exchange Membranes,” Journal of Power Sources, 195(21), 7176-7180 (2010).
Wee, J. H., Lee, K. Y., & Kim, S. H. (2007). Fabrication methods for low-Pt-loading electrocatalysts in proton exchange membrane fuel cell systems. Journal of Power Sources, 165(2), 667-677.

67
Wilson, M. S. (1993). U.S. Patent No. 5,211,984. Washington, DC: U.S. Patent and Trademark Office. Winnick, J. (1990). Electrochemical separation of Gases. Advances in Electrochemical Science and
Engineering, 1(3), 205-214.
Zhang, S., Yuan, X., Hin, J., Wang, H., Friedrich, A., & Schulze, M. (2009). A review of platinum-
based catalyst layer degradation in proton exchange membrane fuel cells. Journal of Power
Sources, 194, 588-600.
Zhou, X., Chen, Z., Delgado, F., Brenner, D., & Srivastava, R. (2007). Atomistic simulation of
conduction and diffusion processes in Nafion® polymer electrolyte and experimental validation.
Journal of The Electrochemical Society, 154(1), B82-B87.
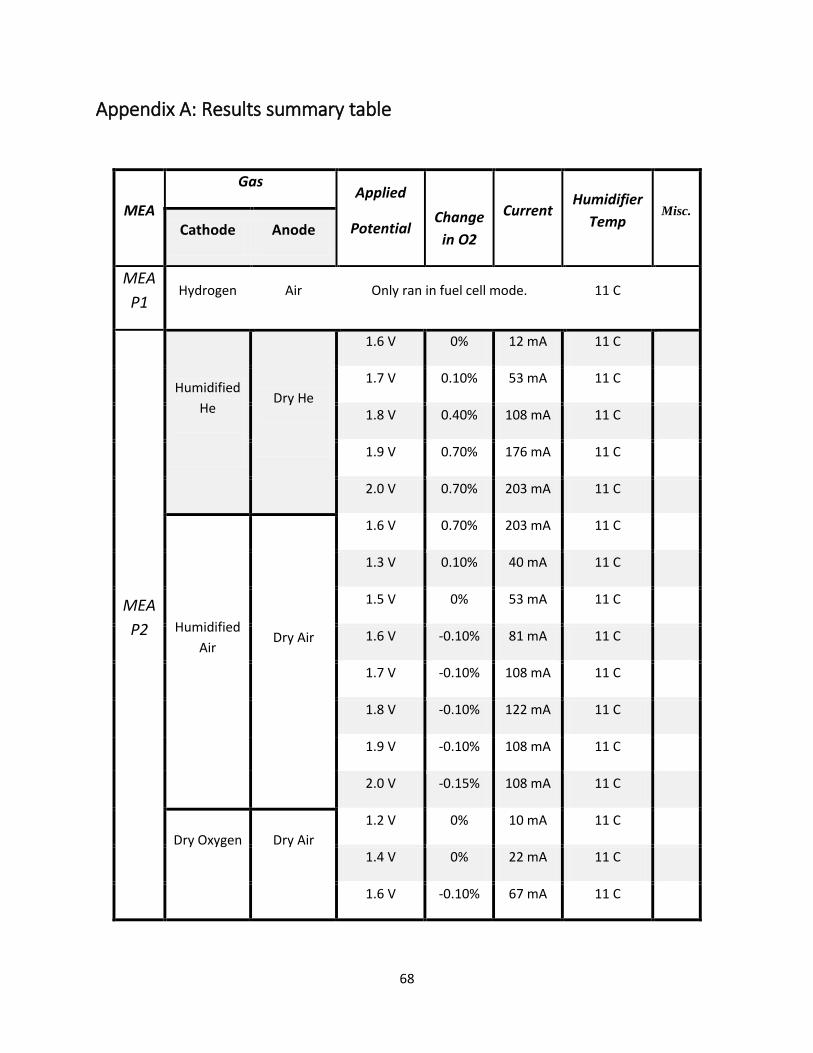
68
Appendix A: Results summary table
MEA
Gas Applied
Potential
Change
in O2
Current Humidifier
Temp Misc.
Cathode Anode
MEA
P1 Hydrogen Air Only ran in fuel cell mode. 11 C
MEA
P2
Humidified
He
Dry He
1.6 V 0% 12 mA 11 C
1.7 V 0.10% 53 mA 11 C
1.8 V 0.40% 108 mA 11 C
1.9 V 0.70% 176 mA 11 C
2.0 V 0.70% 203 mA 11 C
Humidified
Air
Dry Air
1.6 V 0.70% 203 mA 11 C
1.3 V 0.10% 40 mA 11 C
1.5 V 0% 53 mA 11 C
1.6 V -0.10% 81 mA 11 C
1.7 V -0.10% 108 mA 11 C
1.8 V -0.10% 122 mA 11 C
1.9 V -0.10% 108 mA 11 C
2.0 V -0.15% 108 mA 11 C
Dry Oxygen
Dry Air
1.2 V 0% 10 mA 11 C
1.4 V 0% 22 mA 11 C
1.6 V -0.10% 67 mA 11 C

69
1.8 V -0.10% 94 mA 11 C
2.0 V 0% 108 mA 11 C
0.8 V 0% 0 mA 11 C
1.0 V 0% 0 mA 11 C
1.2 V 0% 0 mA 11 C
1.4 V 0% 12 mA 11 C
1.8 V 0% 10 mA 11 C
MEA
C1
Humidified
Air
Humidified
Air 0.4 V - 1.0 V
0% for
all runs
0 A for
all runs 11 C
Dry Air Dry Air 0.4 V - 1.0 V 0% for
all runs
0 A for
all runs 11 C
Humidified
O2 Hydrogen
Run in fuel cell mode for 14
minutes 11 C
Humidified
O2 Dry Air 0.4 V - 1.0 V
0% for
all runs
0 A for
all runs 11 C
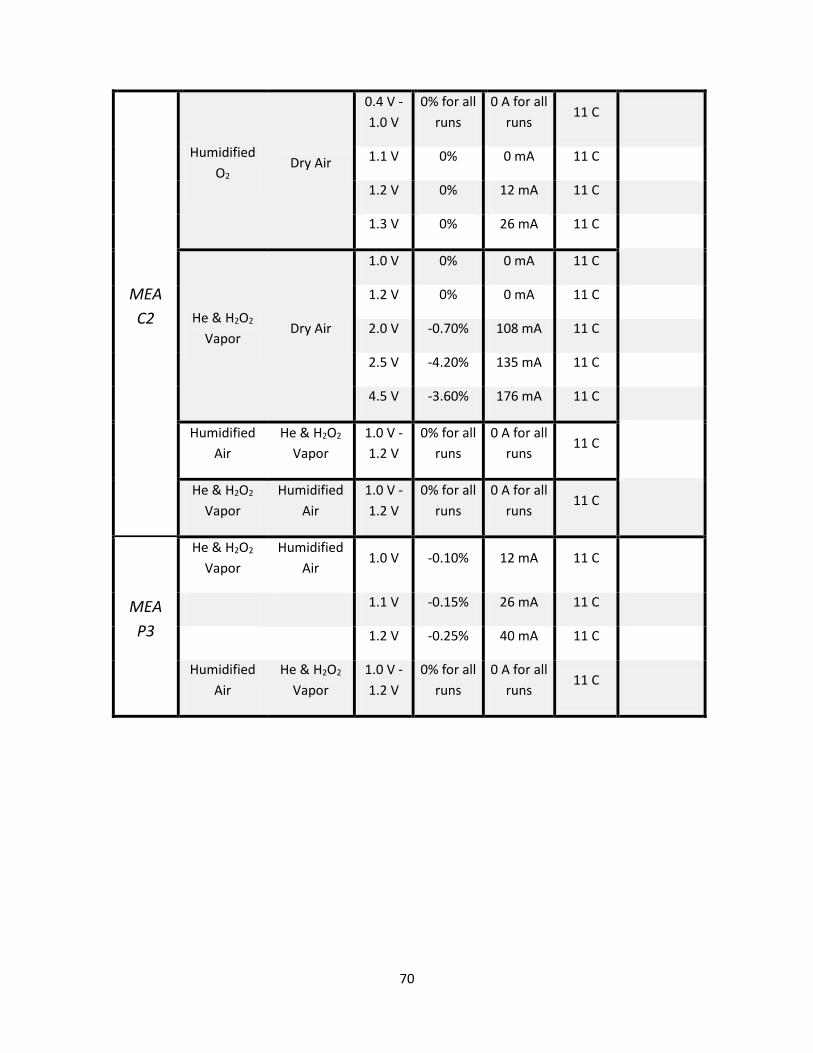
70
MEA
C2
Humidified
O2 Dry Air
0.4 V -
1.0 V
0% for all
runs
0 A for all
runs 11 C
1.1 V 0% 0 mA 11 C
1.2 V 0% 12 mA 11 C
1.3 V 0% 26 mA 11 C
He & H2O2
Vapor Dry Air
1.0 V 0% 0 mA 11 C
1.2 V 0% 0 mA 11 C
2.0 V -0.70% 108 mA 11 C
2.5 V -4.20% 135 mA 11 C
4.5 V -3.60% 176 mA 11 C
Humidified
Air
He & H2O2
Vapor
1.0 V -
1.2 V
0% for all
runs
0 A for all
runs 11 C
He & H2O2
Vapor
Humidified
Air
1.0 V -
1.2 V
0% for all
runs
0 A for all
runs 11 C
MEA
P3
He & H2O2
Vapor
Humidified
Air 1.0 V -0.10% 12 mA 11 C
1.1 V -0.15% 26 mA 11 C
1.2 V -0.25% 40 mA 11 C
Humidified
Air
He & H2O2
Vapor
1.0 V -
1.2 V
0% for all
runs
0 A for all
runs 11 C

71
MEA
I1
Humidified
Air
Humidified
Air
1.2 V 0% 40 mA 11 C
1.3 V 0.05% 26 mA 11 C
1.4 V 0.10% 40 mA 11 C
1.5 V 0.10% 47 mA 11 C
1.6 V 0.10% 53 mA 11 C
1.7 V 0.10% 60 mA 11 C
1.8 V 0.10% 67 mA 11 C
Humidified
Air
Humidified
Air
1.4 V 0% 40 mA 40 C
1.6 V 0% 40 mA 40 C
1.8 V 0% 53 mA 40 C
Humidified
Air
He & H2O2
Vapor
1.0 V - 1.2
V
0% for all
runs
0 A for all
runs 11 C
He & H2O2
Vapor
Humidified
Air
1.0 V - 1.2
V
0% for all
runs
0 A for all
runs 11 C
Humidified
Air
Humidified
Air
1.8 V 0% 12 mA 11 C
1.7 V 0% 12 mA 11 C Cell
Temp
1.6 V 0% 0 mA 11 C
Humidified
O2 Liquid Water 1.5 V NA 53 mA 11 C
FR = 63
ml/min
FR = 10
ml/min
Positive potential at
anode
Humidified
Air
Humidified
Air 1.4 V 0.20% 53 mA 80 C 60 C
FR = 60
ml/min
FR = 40
ml/min 1.5 V 0.20% 40 mA 80 C 60 C
Positive potential at anode

72
MEA
I1
(Cont.)
Humidified
Air
Humidified
Air 1.4 V -0.15%
12 mA 80 C
60 C
FR = 60
ml/min
FR = 40
ml/min
Positive potential at
cathode
Dry Oxygen Humidified
Air 1.4 V 0.10%
12 mA 80 C
60 C
FR = 40
ml/min
FR = 60
ml/min
Positive potential at
cathode
Humidified
O2 Liquid Water 1.4 V 0%
0 mA 80 C 60 C FR = 60
ml/min
FR = 10
ml/min
Positive potential at
cathode

73
MEA
I2
FR = 250
ml/min
FR = 250
ml/min 1.3 V 0.20% 81 mA 11 C
Positive potential at anode 1.2 V 0.20% 67 mA 11 C ml O2 per Min
Humidified
Air
He & H2O2
Vapor 1.0 V 0.10% 40 mA 11 C 0.27855
FR = 250
ml/min
FR = 250
ml/min 0.8 V 0% 6 mA 11 C 0.04178
Positive potential at anode
0.9 V 0% 20 mA 11 C 0.13927
1.5 V 0.30% 149 mA 11 C 1.037596
1.2 V 0.15% 81 mA 11 C 0.56406
1.1 V 0.10% 53 mA 11 C 0.369078
Humidified
Air
Humidified
Air 1.5 V 0.20% 84 mA 11 C
FR = 235
ml/min
FR = 235
ml/min 1.3 V 0.20% 53 mA 11 C
Positive potential at anode 1.2 V 0.15% 47 mA 11 C
1.0 V 0.10% 20 mA 11 C
Humidified
Air
Humidified
Air 1.5 V 0.20% 94 mA 61 C
FR = 235
ml/min
FR = 235
ml/min 1.5 V 0.30% 94 mA 65 C
Positive potential at anode
1.5 V 0.10% 108 mA 71 C
1.5 V 0.20% 163 mA 75 C
1.5 V 0.20% 163 mA 80 C

74
MEA
I2
.
Humidified
Air
Humidified
Air 1.5 V 0% 0 mA 11 C
FR = 235
ml/min
FR = 235
ml/min 1.3 V 0% 0 mA 11 C
Positive potential at
cathode 1.3 V 0% 0 mA 60 C
Dry Oxygen Humidified
Air 1.3 V 0% 0 mA 11 C
FR = 235
ml/min
FR = 235
ml/min Positive potential at cathode
Dry Oxygen Liquid Water 1.4 V 0% 0 mA 11 C Cell Temp
unheated
FR = 235
ml/min
Positive
potential at
cathode
1.4 V 0% 0 mA 11 C 60 C
Humidified
Air
Humidified
He 1.6 V 0% 0 mA 11 C 60 C
FR = 235
ml/min
FR = 235
ml/min 1.8 V 0% 0 mA 11 C 60 C
Positive potential at
cathode 2.0 V 0% 0 mA 11 C 60 C
Humidified
He
Humidified
He 1.3 V 0% 0 mA 60 C 60 C
FR = 2.4
ml/min
FR = 3.4
ml/min
Positive potential
at cathode
Humidified
He
Humidified
He 1.6 V 0.50% 72 mA 60 C 60 C
FR = 20
ml/min
FR = 17
ml/min 1.7 V 0% 0 mA 60 C 60 C
Positive potential at anode 1.8 V 0% 0 mA 60 C 60 C

75
MEA
I2
1.8 V 0% 0 mA 60 C 60 C
Humidified
He
Humidified
He 1.7 V 0% 0 mA 60 C 60 C
FR = 35
ml/min
FR = 35
ml/min 1.6 V 0% 0 mA 60 C 60 C
Positive potential at anode 1.5 V 0% 0 mA 60 C 60 C
Humidified
He
Humidified
He 1.6 V 0% 0 mA 60 C 60 C
FR = 63
ml/min
FR = 76
ml/min 1.8 V 0% 0 mA 60 C
60 C
Positive potential at anode
Humidified
He
Humidified
He 1.6 V 0% 0 mA 60 C 60 C
FR = 119
ml/min
FR = 146
ml/min 1.8 V 0% 0 mA 60 C
60 C
Positive potential at anode
Humidified
He Liquid Water 1.6 V NA 40 mA 60 C 60 C
FR = 80
ml/min
FR = 10
ml/min 1.8 V NA 67 mA 60 C 60 C
Positive potential at anode
2.0 V NA 81 mA 60 C 60 C
2.2 V NA 94 mA 60 C 60 C
2.5 V NA 108 mA 60 C 60 C
Humidified
O2 Liquid Water 1.5 V 0% 0 mA 60 C
60 C FR = 63
ml/min
FR = 10
ml/min Positive potential at cathode
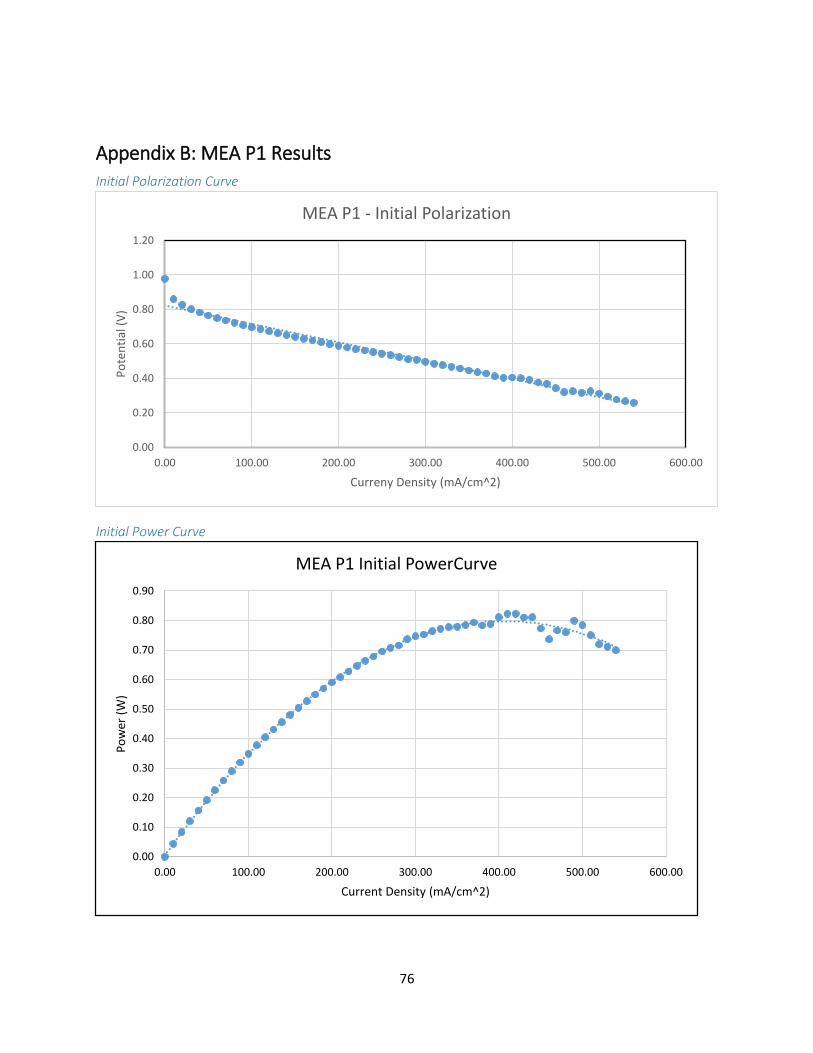
76
Appendix B: MEA P1 Results Initial Polarization Curve
Initial Power Curve
0.00
0.20
0.40
0.60
0.80
1.00
1.20
0.00 100.00 200.00 300.00 400.00 500.00 600.00
Po
ten
tial
(V
)
Curreny Density (mA/cm^2)
MEA P1 - Initial Polarization
0.00
0.10
0.20
0.30
0.40
0.50
0.60
0.70
0.80
0.90
0.00 100.00 200.00 300.00 400.00 500.00 600.00
Po
wer
(W
)
Current Density (mA/cm^2)
MEA P1 Initial PowerCurve

77
IR Spectroscopy of MEA P1
Before Experimental
IR Specs of MEA P1. The bottom three tests are the control taken of MEA-P1 initial after opened from packaging. The top blue IR spec was taken after the condition of the membrane.
After Experimental
MEA P1 IR post experimental runs. It can be seen there is relatively no activity at all.

78
Appendix C: U.S Patent 5,211,984 for Membrane Catalyst Loading in MEA
Fabrication (Wilson, 1993)

79
80
81

82
Appendix D: Sample plot generated by COMSOL.