Embed Size (px)
Citation preview
J. mar. bioL Ass. India, 1997, 39 (1 & 2) : 44 - 48
MEROPLANKTON PRODUCTION IN THE GULF OF MANNAR AND PALK BAY ON THE SOUTH EAST COAST OF INDIA
P. KRISHNAMOORTHY AND P. SUBRAMANIAN Department of Animal Science, School of life Sciences, Bharathidasan University,
Tirucltirappalli - 620 024 Tamil Nadu, India.
A study was carried out to understand the changes in the meroplankton produdion in the two adjoining seas, Gulf of Mannar (Site-I) and Palk Bay (Site-II). Fortnightly collections were made from tach station round the year. These two collection sites are closer to tach other but still varied in many phyaical oceanographic aspects. Numerical abundance of meroplankton were observed maximum during the month of November '93 (1,44,993 nosh3 at site I and 136,695 nos/m3 at site 11) and their minimum. were recorded during the month of July '94 at the site I (8814 nos/m3 and May '94 at the site I1 (10,094 noslm?. The metoplanktonic components include, nauplius, protozoea and mysis larvae of prawns such as Penrreus semisulcahm, P. merguiensis, P. indicus, P. monadon, zoea of branchyura, zoea of petrolisthes, zoea of Emerib, megalopa larvae, eggs, fish larvae, bivalves and gastropod larvae. The in-situ physicochemical variables such as pH, temperature, dissolved oxygen, salinity and electrical conductivity and nutrients like phosphate, nitrate and silicate were also estimated. The relationship between physicochemical variables and meroplankters is discussed.
~TRODUCIION MA'fErUAL AND METHODS
MeROpYANKTERs mainly represent the larvae of commercially important fin and shell fishes. A comparison biodivetsity of meroplankters in a biosphere reserve with a marine environment reveals the level of damage occurred in that area. Keeping this in mind two adjoining marine environs such as Gulf of Mannar bios~here
Gulf of Mannar and Palk bay are located at the latitude 9'15'N and longitude 79'10'E degree and situated at a distance of about 2 miles within the vicinity of Mandapam. The depth of water at the collection sites are about 2.5 fathoms. Regular fortnightly collection of water and plankton samples were made during
reserve) and Palk Bay (normal marin; enAron) are selected for.the present investigation (Fig.1). These two environs contrast from one another in physical characters such as wave action, airrent pattern, roughness etc. besides, seaweeds and coral communities. Since the available literature deals much about general planktonic components and not much of exclusive t meroplankton which indirectly reflect the productivity of any aquatic ecosystem, the present attempt has been made.
7'he authors wish to reconl their thanks L, 1 1 dl*' &m, m%'
to the Authorities of Bharathidasan University for facilities and Ministry of Environment and F, Map the stations in the gulf of Forests, New Delhi for financial assistance. and Palk Bay
IN IN THE GULP OF MANNAR
early houts of 0630-0800 hrs. for one year from November 1993 to October 1994. The in-situ, pH, dissolved oxygen, salinity, surface water and atmospheric temperature were observed and recorded using portable water analysis kit. Phosphate, Nitrate and Silicate were estimated by standard methods described by Strickland and Parsons (1972). Fifteen minutes sub-surface hauls were made for each plankton collection by a 50 cm mouth diameter net made of bolting silk cloth (no. 14. mesh size 60 p). The volume of filtered water was calculated by calibrating the speed of boat, water current and distance of towing and mouth area of the net ring.
After preserving the samples in 5% neutral formaldehyde, the volume of plznkton in each haul was determined. The meroplankton production was estimated through the numerical method using Sedgewick Rafter Cell counter.
The mean monthly variations of the in-situ hydrological conditions, nutrients and the meroplankton abundance, their species diveisity, species richness, evenness and dominance indices are presented here.
The atmospheric temperature ranged between 26.0 to 32.0°C at both the sites. the maximum value of 32.0°C was recorded during the month of May and low values of 27.3"C and 26°C in Novembeiat both the sites. Surface water temperature during this period ranged between 25.1 to 31.S°C. Maximum values of 313°C in the site I and 29.S°C were recorded at the site I1 in June and May respectively and minimum values of 27.3"C and 251°C in November at both the sites (Fig. 2). Marichamy et al., (1985), reported that both air temperature and surface water temperature steadily increased from winter (September- October) to summer (April-May). The appreciable reduction in temperature during this period, of November to January, may primarily be due to (i) the effect of rains and influx of rain water as evidenced by the lowering of salinity and (ii) incidence of the cold cyclonic climate and minimum solar radiation due to heavy clouds-covering during these rainy dayq.
marths 1993-1994 1 Sib-1 At.knp. 5110-II Llt.tmp. n SW-l rat . tomb.
Sito-ll rat. trmp. a Sib-l Salinity Sib-ll Sallnlty
no. 2 Monthly variations in the hydrographic parame@m
Mathew and Gopakumar (1986), observed the maximal value of surface water temperature in the month of April and the minimal in February at Minicoy island. Raghupmsaa(l957), reported the fall of temperature between November till January. The higher and lower temperature changes might be due to the fact that the water is affected to a large extent by land heating and cooling resulting in higher and lower values. The relatively slight fall in the surface water temperature during June-July coincides with the period of south-west monsoon. Blackburn (1965), reported the relationship between temperature and pelagic food supply. U i r ~ Oaygon ml /I
N O J F M A M J J A S O months 1893- 1894 - Slta - I DO + Site - 11 00
FIG. 3 Monthly variations in the dissolved oxygen
Salinity values fluctuated between 29.4 and 34.0 ppt at the sites I and 11. The maximum salinity of 33.5 and 34.0 ppt were recorded at the sites I and I1 during May and low values of 29.8 and 29.4 in November, (Fig. 2). 'Ihis would endorse the view of Jayaraman (1954), who observed higher salinity values during May-October, and low values between November and April. Similarly, Marichamy et al., (1985) stated that the surface salinity

46 P. KRISHNAMOORTHY AND P; SUBRAMANIAN
steadily increased from January-March and reached the peak in April-May, then declined gradually in the following months. The most important factors governing the seasonal distribution of salinity in these waters are the two monsoon driven current systems (Swell, 1932). This current brings in large amount of 'oceanic' water from the Indian Ocean and 'also from the southern part of the Arabian Sea. The peak of meroplanktonic biomass were observed during the low salinity of these waters. There exists an inverse relationship between salinity and the meroplankton productivity at both the sites. Mathew and Gopakumar (1986), reported that the presence of low saline water seen in the surface during November-December period contribute to the high productivity in the Minicoy island. Raghuprasad (1956) observed the same trend in Mandapam area.
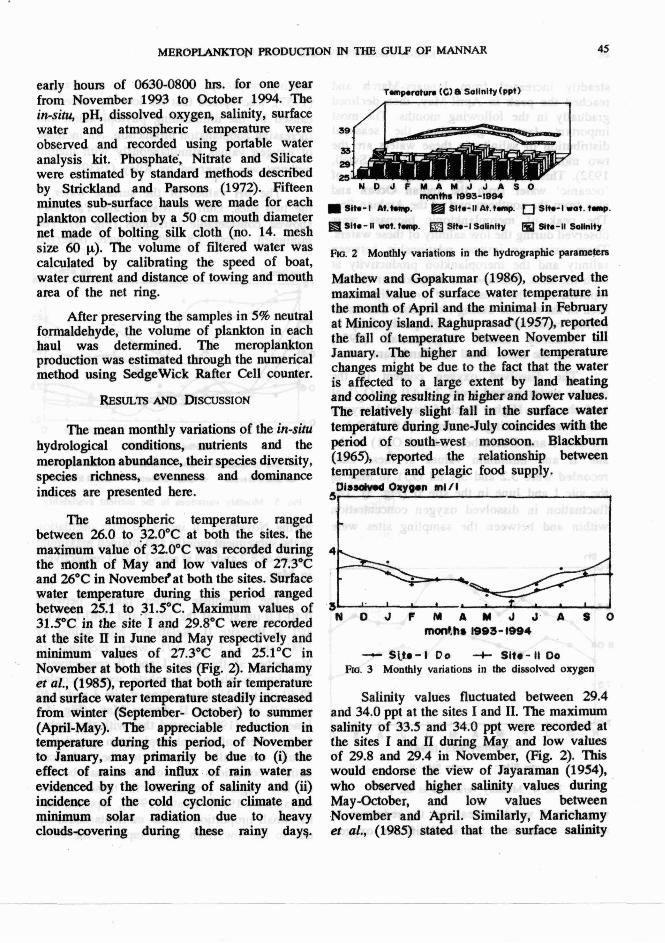
The dissolved oxygen content in the surface water ranged from 3.7-4.0 ml 02/1 at both the sites. Higher level of dissolved oxygen was observed during November (4.0 ml 02) at the site I and December (3.8 ml 0,/1) at the site 11 and minimum values at these sites recorded were 3.2 and 3.1 ml 02/1 in May in the site I and June in the site 11 (Fig. 3). The fluctuation in dissolved oxygen concentration within and between the sampling sites we=
7.0 N D J F M A M J J A S O
months ( 1993- 1994)
FIG. 4 Monthly variations in the pH
very low. It would reveal that the reduction in salinity enhances the solubility or oxygen
holding capacity of water. Kasthurirangan (1957, who opined that the low O2 value was caused by the diminishing phytoplankton and increasing zooplankton production. .h increase of oxygen values simultaneously with diatom outburst was observed by Riley (1939).
The pH values of the surface water at the two sites, Gulf of Mannar and Palk Bay showed considerable variations (Fig. 4). The minimum values 7.8 and 8.0 were observed
PIG. 5 Monthly variations in the nutrient availrbility
during November. It increased with oscillation in the subsequent months and attained maximum values of 8.2 and 8.9 at sites I and I1 respectively in May.
The phosphate values ranged between 0.40-1.0 pg at/l at the site I and 0.40-1.23 pg at11 at the site II. Relatively high values of 1.00 and 1.13 pg at11 were recorded in November at the sites I and 11 respectively. The low levels of phosphate were recorded (6.40 pg atmll) during June at site I and 0.40 pg at11 at the site I1 during May. (Fig. 5). Janet et al., (1987, stated that with the higher fresh water inflow, phytoplankton population would eventually respond to the enhanced nutrient conditions. The low level may be due to low orgnic production in these waters. (Jayamman 1954). Heath (1 976), reported that the small proportion of the nutfients could be due to the low fresh water input in the outer
MEROPLANKTON PRODUCTION IN THE GULF OF MANNAR 47
sounds in summer. The nitrate value at surface reached its peak of 0.61 and 0.63 pg at/l at sites I and 11 respectively during November, and the concentrations fluctuated from 0.45-0.63 pg at/l. The minimum concentration (0.50 and 0.45 pg at/l) was recorded during June at the site I and in July at the site 11 (Fig. 5). The variations in nitrate values might be due to the usual channel of utilization of nitrates -by the phytoplankton besides the activity of denitrifying bacteria utilizing the inorganic nitrates for their energy requirements, and that the nitrates in their turn @re progressively reduced to gaseous nitrogen (Jayaraman, 1954). Marichamy et al., (1985), stated that these nutrients have been utilised by the phytoplankton during their peak period of production.
Considerably high level of silicate (25.8 and. 25.6 pg atfl) were recorded during November at both the sites and minimum level of 23.5 pg at/l in May at the site I1 (Fig. 5). In general the silicate level in Palk Bay is higher than that of Gulf of Mannar. Similar result was reported by Jayaraman (1954), who . -
stated that the total annual turnover of silicate was higher in the Palk Bay than .that' in the Gulf of Mannar. The seasonal distribution of silicate was very much influenced by the presence of the two current systems. in this area. The incursion of the 'Oceanic' type, of water causes marked reduction whereas the freshwater influx increases the silicate. level. This would be the reason for the flourishing growth of corals in the Gulf of Mannar &her than in the Palk Bay.
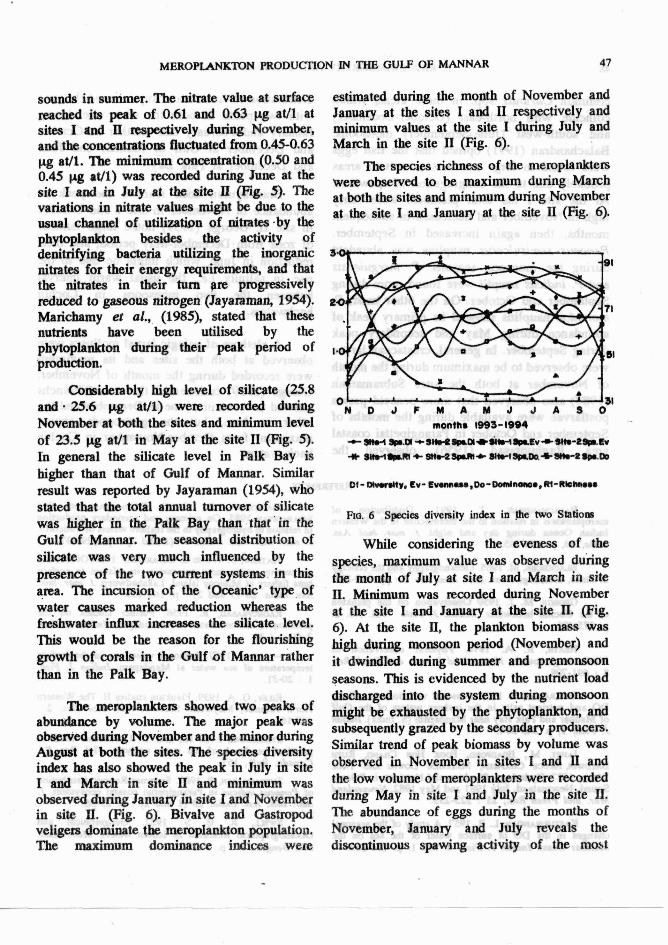
The meroplankters showed two peaks of abundance by volume. The major peak was observed during November and the minor during August at both the sites. The species diversity index has also showed the peak in July in site I and March in site 11 and minimum was observed during January in site I and November in site II. (Fig. 6). Bivalve and Gastropod veligers dominate the meropIankton population. The maximum dominance indices were
estimated during the month of November and January at the sites I and I1 respectively and minimum values at the site I during July and March in the site 11 (Fig. 6).
The species richness of the meroplankters were observed to be maximum during March at both the sites and minimum during November at the site I and January at the site 11 (Fig. 6).
" N D J F M ~ M J J A S O ~ months 1993- 1994
01- m, Cv- Ew+Ms~,Do-DonJn~#m,RI-Rl~k..m
Fro. 6 Species diversity index in the two Stations
While considering the eveness of the species, maximum value was observed duiing the month of July at site I and March in site 11. Minimum was recorded during November at the site I and January at the site 11. (Fig. 6). At the site 11, the plankton biomass was high during monsoon period (November) and it dwindled during summer and premonsoon seasons. This is evidenced by the nutrient load discharged into the system during monsoon might be exhausted by the phytoplankton, and subsequently grazed by the secondary producers. Similar trend of peak biomass by volume was observed in November in sites I and 11 and the low volume of meroplankters were recorded during May in site I and July in the site 11. The abundance of eggs during the months of November, January and July reveals the discontinuous spawing activity of the most

48 P. KRISHNAMOORTHY AND P. SUBRAMANIAN
common Caranax spp. in these areas, which coincide with northeast (October-December) and south-west (JuneSeptember) monsoons. Balachandran (1991) opined that the fish eggs were found in large numbers in certain areas probably due to the congregation of spawners. At the site I the total plankters were fairly high in November and decreased in subsequent months,.. then again increased in September. Penaeus semisukatus nauplius was abundant during the monsoon seasons. P. merguiensis and P. indicus nauplii were found more during September and October. On the bther hand, P. monodon nauplius showed its primary peak of abundance during May and secondary peak during September. In general, crustacean larvae were observed to be maximum during the month of November at both the sites Subramanian (1987) also observed that more penaeid prawn postlarvae were available during the months of September and October in Parangipettai ooastal area. Raghuprasad (1956), observed the
distribution of crustacean nauplii round the year with two peaks at both the sites, one during January and February and another in October and December at Gulf of Mannar and June and December at Palk Bay.
Branchyuran zoea reached the peak of abundance in November in site I and October in site 11. George (1959) noted large number of u>ea from Dekmber-May period, and their reduction in June, which might be due to the rise in salinity i.e., the usual warm interval between the two monsoons in Cochin backwaters.
A plethora of pelagic larval molluscs were observed at both the sites and its maximum were recorded during the month of November. George (1959) commented that lamellibranchs showed two maxima: one in December and the other in June, but the gastropods appear maximum from October-November in Cochin back waters.
-RAN,, T. 1991. Distribution of WCHAMY, R., C. P. GOPDUAW, AND POA mcroplanktcn in relahon to the thermocline in the Western SIRA-TAN 1985. On primary and secondary production Indian Ocean during &y and night. J. mar. biol. in relation to hydrography in the inshore waters of Tuticorin. India, 33, p. 278-285. J. mar. biol. Ass. India. 27 (1 and 2) : p. 129-137.
m ~ . , C. V. AND G. GOPAKUMAR 1986.Obe~atiod Bup M. '%'. Oceanography and the -logy on mrtain environment parameters in relation to surface
Oaanogr. Bid. Ann. : pp. 299-322. tuna fisherv at Minicov island. Labhadweep. J. mar. biol.
GBows; M. J. 1959 Observation on the plankton Ass. ~ndia.. 28 (1 and 2) : p.' 163-168.
of the Cochin backwater. Indian. J. Fish. Vol. No. 2. RAGHUPRASAD, R 1956. Further - studies on the p. 375-401. plankton of inshore waters off Mandapam. Indian J. Fish.
3 11) : 1-31. . , HEAIW, R. A. 1976. Physical observation of - 1957. Seasonal variations in the surface sou*' N-ald J' lud tempenturn of m water at Ma&pam. Indian J. Fish. 8 : 691-708.
1 : 20-31. JAYAWUY R 1954. Scmonal variations in salinity
DO and nutrient salts in the inshore waters of the Gulf of Mannar and Palk Bay near Mandapam (S. India). Indian J. Fish: 1, p. 345-364.
JANBI, .M., BBAMPRD, -K HOB -, RUlH BAIDWIN, BRUCE CHAIMm, M A ~ W DOWNS AND PAUL WOOD, 1987. Hydrology, Plankton and Nutrients in Pelorus Sound, Newzealand, July 1981 and May 1982. Newzealand Mar. and Fnsh Rtu., 21 : 223-233.
l h s m t n w ~ L R. 1957. A study of the seasonal changes in the DO of surbce water of the sea on the Malabar Coast. Indian J. Fish. 4. No. 1. p. 134-149.
RILBY, G. A. 1939, Plsnkton studia, 11. The Western North Atlantic, May-June 1939. J. mar. biol. Ass. 2 : 145-162.
S'llUCKlAND, J. D. H., AND T. R. PARSONS 1,972. A practical handbook of sea water analysis. Fish Rcs. Bd. Canada. Bull., 167.
SUBRA?(IV?AN, P. 1987. Spawner-Recruit distribution of Penaeus rndrcus io Parangipettai ooastal m y s t e m . J. mar. bid. Ass. India. 29 (1 and 2) : p. 23-36.
SWELL, R B. S. 1932. Geographical and Oceanographical Research in Indiatl waters. Mem. Asia. Soc. Bengal., 9 : p. 1-424.