Embed Size (px)
Citation preview

336 Plant Disease / Vol. 86 No. 4
P. F. J. Wolf and J. A. Verreet University of Kiel, Germany
An Integrated Pest Management System in Germany for the Control of Fungal Leaf Diseases in Sugar Beet
The IPM Sugar Beet Model
Only two crops are available for the pro-duction of sugar. Sugar cane is the most common in tropical areas, while sugar beet is the source in the more moderate climate conditions of central and western Europe. Currently, approximately 37% of world sugar is produced from sugar beet (3). In Germany, sugar beet cultivation still offers a high monetary return while profits for many other crops are decreasing. The mar-ket structure for sugar beet cultivation is based on European sugar beet market quo-tas, which have the goal of avoiding over-production by limiting cropping areas and keeping prices stable for European Union (EU)-produced sugar. In Germany, sugar beet is grown on 504,000 ha (24.7% of the European Union sugar beet area). The average German sugar yield in 1997–98 was 7.96 t/ha, rising to 11.1 t/ha in south-ern Bavaria. The production in Europe, as in Germany, is highly intensive and di-rected at achieving high yields and quality.
Sugar beet diseases pose serious threats to high production standards (Fig. 1). Cer-cospora beticola is the primary leaf patho-gen of sugar beets in Germany, especially in regions with frequent rainfall and aver-age daily temperatures of 20 to 25°C (5,6). Yield losses of 10 to 30% and recoverable sugar yield reductions of up to 50% have been observed for this disease (4,7,13–17,25,26). Economic losses may reach US$1,500/ha. Powdery mildew, caused by Erysiphe betae, is also common during hot, dry summers (2,8,10). However, sugar losses (about 5 to 15%) tend to be lower than for Cercospora leaf spot (1). Less important are leaf diseases caused by Ra-mularia beticola, Uromyces betae, and Phoma betae. These diseases normally appear late in the growing season or are slow to develop. Therefore, no control measures are required (7).
In the past, sugar beet leaf diseases were often controlled by applying fungicides on fixed-calendar schedules or growth stages. In many cases, these treatments were ap-plied without regard to cultivar resistance or weather conditions. Additionally, man-agement decisions were often adversely affected by poor disease diagnosis. A new approach was needed to provide adequate disease control while effectively reducing the chemical load on the environment (Ta-
ble 1). Sugar beet processors, as well as farmers, were interested in achieving high-quality crops because disease incidence increased impurities in molasses that influ-enced sugar solubility and reduced crystal-lization of sugar during the production process. After the scientific issues had been established, the sugar beet companies sup-ported the introduction of the integrated pest management (IPM) model in farming (Fig. 2).
Corresponding author: J. A. Verreet, Department of Phytopathology, University of Kiel, Germany; E-mail: [email protected]
Publication no. D-2002-0206-01F © 2002 The American Phytopathological Society
Fig. 1. Leaf damage caused by Cercospora beticola (right) compared with plot receiv-ing fungicide applications according to the integrated pest management (IPM) sugar beet model (left).
Table 1. Targets of the IPM (Integrated Pest Management) sugar beet model
Principles of development
� Scientific based research � Useful definitions for practical purposes � High acceptance by farmers
Impact of introduction into practical farming
� Optimal efficacy and economy of fungicide spraying � High quality of sugar beet for sugar production � Reduction of the chemical load on the environment

Plant Disease / April 2002 337
Disease Diagnosis: A Key Feature of the Model
Proper diagnosis is a key component of the IPM program. Leaf blotches caused by abiotic factors or bacteria may be confused with those caused by the more economi-cally important fungal diseases. Inaccurate diagnoses may lead to unnecessary fungi-cide applications. Symptom differentiation may be carried out macroscopically, but a hand lens (×10 magnification) is needed to unambiguously identify the causal agent (Fig. 3). Identification is primarily con-cerned with pathogens such as C. beticola and R. beticola, which cause foliar necro-sis. In contrast, powdery mildew and rust are easy to diagnose.
Steps in IPM Model Development
Our IPM model was developed to allow a flexible response to the variability of dis-ease occurrence from year to year resulting from differences in weather and cultivar selection. For example, Figure 4 illustrates the variability of sugar beet leaf diseases at three locations in Germany during a 3-year study. In 1994, powdery mildew was the dominant disease in northern Bavaria, whereas Cercospora leaf spot was the pri-mary disease in the wetter southern re-gions. Cultivar selection also influenced disease development in 1994. In particular, the cultivar Ribella was highly resistant to Cercospora leaf spot but was susceptible to powdery mildew. In 1995, both diseases were present at all sites. In 1996, powdery mildew was predominant at all sites, whereas the incidence of Cercospora leaf spot was relatively low.
In addition to accurate diagnosis, three other important steps had to be taken into account during the development of our IPM model:
��The achievement of optimum control by use of epidemic thresholds for tim-ing fungicide treatments (18,19,27,28)
��Setting tolerance limits for disease severity (economic damage threshold) at harvest time (21,23,28)
��Making yield risk forecasts on whether the epidemic would exceed the eco-nomic damage threshold (21,28)
Evaluation of Epidemic Thresholds
A goal of our model was to allow flexi-bility in timing of fungicide applications depending on the epidemic progress. The principles of timing fungicide applications for control of Cercospora leaf spot are illustrated in Figure 5. In general, epidem-ics were characterized by 3 parameters (22), which mark different phases of dis-ease development (Table 2). In the first phase, disease incidence (DIplant) increased until 100% of the plants were infected. This occurred within a 5-week period rela-tively early in the growing season. During
this phase, disease severity on individual plants remained low.
The second phase of the epidemic was associated with an increase in disease se-verity on individual plants. The leaf infec-tion rate (DIleaf) increased rapidly when DIplant > 70%. The final DIleaf was limited to a maximum level of 60 to 70%, because the beet plant continued to produce new, uninfected leaves until the end of the grow-ing season. The percent infected leaf area (DS) remained under 1% during the first and second phases of the epidemic. The DIplant = 50% (marked “a” in Figure 5) and DIleaf = 25% (marked “b” in Figure 5) were used to define thresholds for fungicide applications during the first two phases of the epidemic.
During the third phase, DS increased rapidly (up to 15% per week) as DIleaf ap-
proached 60 to 70%. Because DIplant and DIleaf were maximized, the parameter DS was used for defining fungicide application thresholds (DS = 2 or 10%) during the latter part of the epidemic. By the end of the growing season, about 60% of the green leaf area was necrotic as a result of Cercospora leaf spot (Fig. 5), but the total amount of necrosis was approximately 90% if the senescence of older leaves was included. At this level of infection, no fur-ther yield increases were possible with fungicide applications.
Figure 6 depicts the effects of fungicide applications timed according to the phases of the Cercospora leaf spot epidemic. Overall, fungicides applied early during the epidemic provided the best control. This indicates that fungicides should be applied before DIleaf = 25%. This threshold
Fig. 2. The integrated pest management (IPM) model implementation in Germany is directed by the sugar beet companies.
338 Plant Disease / Vol. 86 No. 4
corresponds with a DS = 0.2 to 0.4%. Fun-gicides, including newer generation prod-ucts such as the triazoles (cyproconazole, difenoconazole, epoxiconazole, flusilazole) and QoI inhibitors (azoxystrobin, kresoxim-methyl) were not effective in stopping a highly advanced epidemic. Evaluation of fungicide application thresholds for pow-dery mildew and Ramularia leaf spot was conducted in the manner described for Cercospora leaf spot, and in general, re-sults were similar.
Of course, the main objective of growers is to minimize sugar losses. To examine effects of Cercospora leaf spot on yield reduction, our field experiments included both untreated and disease-free control plots. The disease-free plots were treated with fungicides at 3- to 4-week intervals. These plots established the maximum yield potential and enabled us to assess the ef-fects of threshold-timed fungicide applica-tions on yield loss. For example, sugar losses caused by powdery mildew were minimized when fungicides were applied at first symptom appearance or at DIplant = 50% (Fig. 7). Even though there was vari-ability among locations, average losses were low (1 to 2%). In determining the effects of powdery mildew on sugar reduc-tion, only those studies with negligible Cercospora leaf spot development (DS values of AUDPC < 1) were included.
Sugar losses resulting from powdery mil-dew ranged from 0 to 15% (Fig. 7).
Evaluation of the Economic Damage Threshold
Despite the success of early fungicide sprays in reducing disease severity, the sprays created a new problem. In almost every case, the threshold for a fungicide application was reached even if the begin-ning of infection was delayed late into the season. In these cases, disease severity remained low and yield was not affected. In order to maintain a high performance of the model, i.e., applying fungicides only when needed, the tolerance limit of disease severity at harvest was evaluated. This tolerance limit or economic damage thresh-old was defined as the highest DS level that would not decrease economic profits. The economic damage threshold was de-duced from a disease-loss relationship by comparing the decrease of the recoverable sugar yield to DS at harvest (Fig. 8). The parameter “recoverable sugar yield” in-cluded quality factors (content of sugar, potassium, sodium, and α-amino-nitrogen) and yield (beet mass). For Cercospora leaf spot, a damage threshold limit of DS = 5% or alternatively an AUDPC = 1 was used. Up to this limit, recoverable sugar losses were negligible. There was a tendency toward slight losses of about 3% at DS <
5%, but the cost associated with fungicide applications outweighed the increases in recoverable sugars. Therefore, DS = 5% was defined as the economic damage threshold and was used as a basis for yield risk forecasts.
The same techniques were used to deter-mine economic damage thresholds for Ramularia leaf spot and powdery mildew. Disease development for Ramularia leaf spot and Cercospora leaf spot were similar in that both caused progressive leaf necro-sis. Therefore, the damage threshold DS = 5% was also used for Ramularia leaf spot. In contrast, powdery mildew incidence did not continue to increase during the growing season. Instead, the fungus rapidly colo-nized leaf tissue during the first part of the epidemic but then slowed as plants ma-tured. Therefore, DS values at the end of the season were not suitable for damage assessment. Instead, the parameter AUDPC = 2 was used for calculating the economic damage threshold.
Forecast of the Yield Risk Potential
The ability to forecast yield risk poten-tial was crucial to a realistic assessment of the necessity of fungicide treatments. In general, fungicide treatment and economic damage thresholds occur at different stages in the epidemic. For instance, Cercospora leaf spot needed at least 4 to 5 weeks to proceed from one phase of the epidemic to the next (22), even under favorable weather conditions and when susceptible cultivars were used (Fig. 9). Early in the epidemic, weekly increases in disease se-verity (∆-DS) were slight and increased strongly after the economic damage thresh-old was reached. Because of the delay between determination of fungicide treat-ment thresholds and economic damage thresholds, a prediction of the yield risk potential was required. This risk was calculated by regressing the beginning date of the epidemic to the DS at the end of the growing season. The beginning of the epidemic was defined as the time when 50% of the beet plants were infected (DS = 0.01%). We identified three yield risk periods based on when the Cercospora leaf spot epidemic began (Fig. 10). There was high risk of economic damage if the epidemic started in July to mid-August. The resulting disease severity was higher than the economic damage threshold DS = 5% in almost every case. Some risk of exceeding the damage threshold was still present in the period between mid- to late August if harvest was scheduled for October. There was no risk of exceeding the threshold if the first symptoms of Cercospora leaf spot appeared in September. The model was simplified fur-ther for making decisions concerning fungicide applications (Fig. 10, bottom), because growers are primarily interested in whether or not they have to spray. There-
Fig. 3. Diagnosis of foliar fungal diseases in sugar beet by eye (left) and with the aid of a pocket lens (right, ×10 magnification).
Plant Disease / April 2002 339
fore, a very simple scheme was developed in which the question of fungicide applica-tion was reduced to a “Yes” or “No” answer and was based on when the epidemic started.
The validity of forecasting the yield risk potential was confirmed by comparing the loss of recoverable sugar yield to the date on which the epidemic started (Fig. 11). Sugar losses up to 35% were caused by Cercospora leaf spot when the epidemic started in July (Fig. 11, left). Losses were significantly lower if disease started in
August and approached zero if the epi-demic began in September. Results for powdery mildew were similar to those for Cercospora leaf spot in relation to initiation of the epidemic. However, the damage potential for powdery mildew was lower (Fig. 11, right), with susceptible cultivars being mainly affected.
Implementing the Model Negative prognosis. Our objective was
to develop an IPM model that could be easily implemented by growers. To this end, we attempted to simplify scouting procedures for determining damage thresh-olds and timing of fungicide applications. We also tried to minimize the time growers needed to spend scouting their fields by employing a negative prognosis system based on empirical data.
In our studies, symptoms of Cercospora leaf spot were never observed before can-
opy closure, defined as the time when leaves on 90% of beet plants in adjacent rows began to touch (12,24). Therefore, scouting fields before this period was un-necessary. The frequency of canopy clo-sure followed a Gaussian function and occurred between the 23rd and 28th week (June through mid-July), with most cases in the 25th to 26th week (Fig. 12, top). Cercospora leaf spot epidemics started (DIplant = 50%) after the 26th week in sus-ceptible cultivars and the 30th week in quantitatively resistant cultivars. This dem-onstrated that the resistance delayed early stages of the epidemic (Fig. 12, middle). However, there was a wide range in time of disease onset in susceptible varieties, indicating that location, meteorology, crop-ping-measures, and inoculum situation also influenced development. Calculating from the time of canopy closure, the beginning of epidemic may, at the earliest, occur after
Fig. 5. Epidemic progress of Cercospora leaf spot on the highly susceptible culti-var Carla at Piering, Germany, in 1993 (19). Epidemic thresholds for disease incidence (DI) and disease severity (DS) are: a = 50% DIplant, b = 25% DIleaf, c = 2% DS, and d = 10% DS.
Fig. 4. Development of Cercospora leaf spot and powdery mildew on sugar beet cultivars at 3 locations in Germany, 1994 to 1996. AUDPC (area under disease progress curve) allows expression of entire season’s epidemic with one value, calculated by weekly data records (11): ( ) ( )∑ = −− −+= n
i iiii ttyy2 11 *2/AUDPC where yi = disease severity (%DS)/100, ti = date and ti–1 = interval of data record (days).
Table 2. Disease incidence parameters
Parameter Explanation
DIplant Disease incidence (plant) = average percentage of infected plants DIleaf Disease incidence (leaves) = average percentage of infected leaves DS Disease severity = average percentage of infected leaf area AUDPC Area Under Disease Progress Curve = % DS/100 * days (11)

340 Plant Disease / Vol. 86 No. 4
a period of 3 to 4 weeks in susceptible, and 6 to 7 weeks in resistant cultivars (Fig. 12, bottom). These results were recorded under conditions in southern Germany (72 case studies, 1993 to 1997). Even though can-opy closure helped predict the onset of Cercospora leaf spot, considerable variabil-ity remained. Sometimes the beginning of an epidemic was delayed 10 to 12 weeks after canopy closure. Even inclusion of climatic factors in the calculation did not
satisfactorily explain the remaining vari-ance (24).
The negative prognosis for powdery mil-dew was derived from an empirical exami-nation, which established the epidemic onset to be probable at mid-July at the earliest. The emergence of first symptoms was also variable, but climatic factors did not explain the remaining variance, possi-bly because the biology of the fungus is adapted to dry weather conditions. There-fore, the influence of the canopy closure in providing leaf wetness plays a limited role in powdery mildew development. In addi-tion, powdery mildew has not been shown to overwinter in central European climatic conditions. It is likely that the fungus is
introduced every year by windblown co-nidia from Mediterranean sugar beet grow-ing areas. Hence, the local climate is less important for the timing of the beginning of the epidemic (2).
Fig. 8. Disease loss (% recoverable sugar yield) relationship for Cercospora leaf spot where sugar loss (%) = –0.45 * DS, P = 0.05, r2 = 0.80.
Fig. 7. Loss of recoverable sugar (%) resulting from Erysiphe betae infection following a single, threshold-timed fun-gicide in comparison to untreated con-trol (Ktr) and disease-free (G) plots thatreceived three fungicide applications. Threshold-timed fungicide treatments were: a = first symptom appearance, b = 50% DIplant, c = 25% DIleaf, d = 40% DIleaf, e = 50% DIleaf.
Fig. 6. Efficacy of threshold-timed fungi-cide applications on development of Cercospora beticola. Treatments were applied at the disease incidence (DI) and disease severity (DS) thresholds of: a = 50% DIplant, b = 25% DIleaf, c = 2% DS, and d = 10% DS. Each point represents the mean of one field experiment.
Fig. 11. Forecast of recoverable sugar losses (%) depending on the beginning of epidemic caused by Cercospora beticola, A, and Erysiphe betae, B. Regression equations for Cercospora beticola sugar loss (%) = –35 * e[–0.052 * (x
– 194)], r2 = 0.75, and Erysiphe betae on susceptible (sugar loss (%) = –15 * e[–0.05
* (x – 194)], r2 = 0.30) and resistant cultivars (sugar loss (%) = –8 * e[–0.065 * (x – 194)], r2 = 0.08) where x = beginning of epidemic (Julian day).
Fig. 12. Frequency of canopy closure (top) and beginning of Cercospora leaf spot epidemic (middle) in relation to date. The beginning of epidemic is calculated from the canopy closure (bottom).
Fig. 10. Relationship between date atwhich the Cercospora leaf spot epidem-ic begins and disease severity at harvest. Regression equations for susceptible cultivars, DS (%) = 55.0 * [1 – 1/(1 + 63 * e[–0.181*(x – 194)])], r2 = 0.82, and resistantcultivars DS (%) = 17.6 * e[-0.079 * (x – 209)], r2 = 0.77, where x = beginning of epi-demic (Julian day). The boxes beneath the graph indicate the necessity of fungicide treatments based on the start of the epidemic. Regressions (P = 0.05).
Fig. 9. Progression of disease severity (DS) after exceeding the threshold for an initial fungicide treatment (average of n = 53 field studies), where ∆-DS is the weekly increase and cumulative (%-DS) is the total disease severity.

Plant Disease / April 2002 341
Definition of Thresholds in Practice
In order to simplify field assessment of disease threshold levels, an alternative method of disease scoring was developed. It was based on the percentage of infected leaves in a sugar beet field. Disease inci-dence was determined by inspecting one leaf from the middle of 100 plants while walking diagonally through the beet field (Fig. 13). With this procedure, the recorder notes only whether leaves are infected. In order to accommodate this sampling proce-dure, the established thresholds needed to be changed. We developed this system by using regressions for calculating the alter-native threshold levels (28). Figure 14 illustrates the decision system for fungicide
treatments based on leaf sampling. The model predicts that if 5% of leaves
are infected before mid-August, a fungi-cide should be applied. This strategy is valid for all of the foliar diseases. If thresh-olds are exceeded from mid- to late Au-gust, the damage risk is conditional on time of harvest for Cercospora leaf spot and powdery mildew. If harvest is sched-uled before the beginning of October and the cultivar is resistant to these diseases, then further fungicide applications are not needed. In case of later harvest, Figure 15 shows that there is still a risk of achieving the tolerance limit of DS = 5% by C. beti-cola if the DIleaf > 25% (DS = 0.2 to 0.4%) in the second half of August. This thresh-old corresponds to 40 to 50 infected leaves from a sample of n = 100. If this threshold
level is exceeded in September, no fungi-cide application is necessary. This thresh-old level is also used for determining whether a second fungicide application is required. Based on our experience, a sec-ond treatment is usually not required unless the epidemic begins in July.
The application of fungicides based on the IPM model effectively limited Cerco-spora leaf spot severity to levels below the tolerance limit of AUDPC = 1 (Fig. 16). Average sugar losses were less than 4% when compared with the fungicide-treated, disease-free control plots. These losses result mainly from the reduction of α-amino-nitrogen contents as side effects of the fungicides, even if there is no or only a slight disease incidence. The disease-free control plots required three fungicide ap-plications, whereas the mean number of applications in the IPM plots was <1. The slight loss in sugar was offset by the re-duced number of fungicide applications, which cost about US$60 to 80/ha.
Disease Monitoring Despite the practical aspects of the fore-
casting model, we were concerned that the system would not gain wide acceptance among farmers. The farmers are loosely organized, vary in educational background, and have many problems other than plant protection to consider. Therefore, in 1994, the University of Kiel in cooperation with the state advisory service established a disease monitoring service (25). Since 1996, monitoring in Germany has been organized by the sugar companies and supported by the German state advisory service. The model was also introduced in Austria in 2000 by the Novartis-Agro GmbH (now Syngenta) as a service for beet growers. Monitoring is conducted by scouts (200 in Germany, 40 in Austria) trained in diagnosing and scoring diseases. The disease monitoring is initiated as soon as the negative prognosis cannot exclude the beginning of an epidemic (Fig. 17). The weekly records are specified for each
Fig. 14. Scheme for determining timing of fungicide applications.
Fig. 13. Method of diagnosis and disease scoring.
Fig. 15. Cercospora beticola: Forecast of infected leaf area (% DS) at harvest depending on the time of exceeding the epidemic stage DIleaf = 25%. The regres-sion equation is DS (%) = 25 * e[–0.11 * (x –
225)], r2 = 0.75, where x = day of exceed-ing 25% DI.
342 Plant Disease / Vol. 86 No. 4
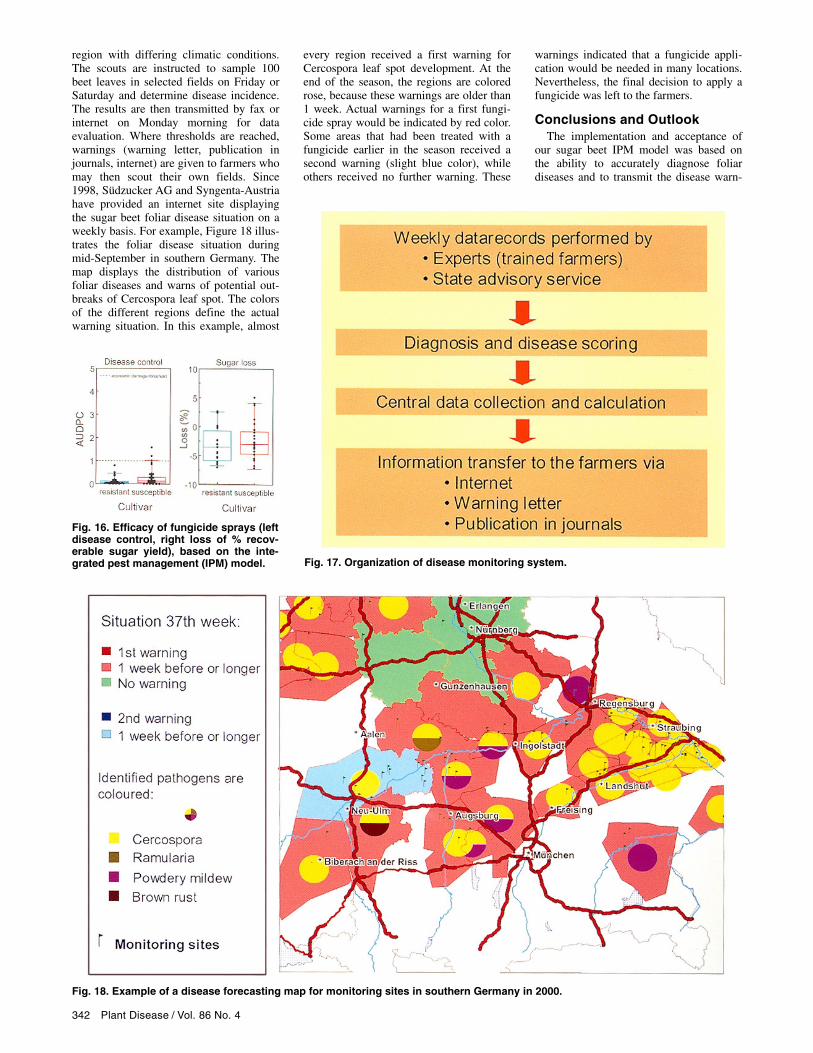
region with differing climatic conditions. The scouts are instructed to sample 100 beet leaves in selected fields on Friday or Saturday and determine disease incidence. The results are then transmitted by fax or internet on Monday morning for data evaluation. Where thresholds are reached, warnings (warning letter, publication in journals, internet) are given to farmers who may then scout their own fields. Since 1998, Südzucker AG and Syngenta-Austria have provided an internet site displaying the sugar beet foliar disease situation on a weekly basis. For example, Figure 18 illus-trates the foliar disease situation during mid-September in southern Germany. The map displays the distribution of various foliar diseases and warns of potential out-breaks of Cercospora leaf spot. The colors of the different regions define the actual warning situation. In this example, almost
every region received a first warning for Cercospora leaf spot development. At the end of the season, the regions are colored rose, because these warnings are older than 1 week. Actual warnings for a first fungi-cide spray would be indicated by red color. Some areas that had been treated with a fungicide earlier in the season received a second warning (slight blue color), while others received no further warning. These
warnings indicated that a fungicide appli-cation would be needed in many locations. Nevertheless, the final decision to apply a fungicide was left to the farmers.
Conclusions and Outlook The implementation and acceptance of
our sugar beet IPM model was based on the ability to accurately diagnose foliar diseases and to transmit the disease warn-
Fig. 17. Organization of disease monitoring system.
Fig. 18. Example of a disease forecasting map for monitoring sites in southern Germany in 2000.
Fig. 16. Efficacy of fungicide sprays (left disease control, right loss of % recov-erable sugar yield), based on the inte-grated pest management (IPM) model.

Plant Disease / April 2002 343
ing system to the farmer in a user-friendly system. In the past, misidentification of foliar diseases, particularly between leaf blotching caused by Pseudomonas syrin-gae and Cercospora leaf spot, often re-sulted in unnecessary fungicide treatments. Symptoms associated with P. syringae are already common in June but are temporary and originate from physical injuries such hail. Fungicide applications are neither necessary nor do they have any effect against the bacterium. Hence, accurate diagnosis at early stages of the epidemic is very important. The scouts were able to accurately diagnose diseases after an initial training and now have developed a reliable routine over six seasons. The most impor-tant advantage of the model is the potential for reducing or eliminating fungicide appli-cations. It must be conceded, however, that many farmers view a warning as a signal to start spraying without further monitoring on their own farms. Nevertheless, there is still an advantage compared with past sys-tems in that farmers are fully informed and take action only in a time of real risk. A future goal must be to improve farmer training so that the benefits of the model and how to use it become more apparent.
The scientific innovation of our model is the linking of the fungicide treatment and damage thresholds to develop forecasts of damage risk. The damage threshold alone is not suitable for optimization of timing fungicide applications, because even the new generation of fungicides is not effective in suppressing disease develop-ment once the damage threshold is reached. Therefore, there is a need to de-fine special thresholds that allow optimum fungicide efficacy (18,19,27). The yield risk potential forecast takes this into ac-count. In the future, the possibility of in-cluding weather data in the forecasting model will be considered. However, the question is how to make best use of these data. There currently is little advantage in including weather information in determin-ing damage-potential forecasts. The risk calculation is necessary at the time a threshold is reached. The period between deciding on a fungicide spray (beginning of epidemic) and the end of the growing season is at least 4 to 5 weeks. Currently, weather forecasts are not reliable over this length of time.
Almost the same factors we used in de-veloping our IPM sugar beet model are employed in the “Cercospora leaf spot model for sugar beet” developed by Win-dels et al. (9,20). Their model, which is used in Minnesota and North Dakota, al-ready has a history longer than 10 years and involved the cooperation of the sugar beet industry, producers, and university personnel. They also emphasize the impor-tance of accurate diagnosis. Based on the results of Shane and Teng (16,17), thresh-olds for fungicide sprays are given with a successive adaptation to the calendar.
These are nearly the same as those in our IPM model. The thresholds refer to differ-ent action zones, where, for instance, no fungicide has to be applied as long as the disease progress remains within the “safety” zone. There is a slight difference in determining the tolerance limit of dis-ease severity (economic damage threshold) at 3% instead of 5%. Furthermore, the Cercospora leaf spot model takes into ac-count the weather conditions during calcu-lation of daily infection values (DIV), and disease monitoring is considered to be suitable for implementation.
Weather data may be able to describe the probability of infection. But the target of predicting the onset of an epidemic in an individual beet field is difficult to achieve, because the influencing factors seem to be complex (24). From this point of view, the evolution of single beet fields and there-fore the disease development differs greatly, even in the same region with simi-lar weather conditions. Additional local effects from rivers, forests, or the geo-graphical inclinations of beet fields cannot be taken in account, because in such cases it would be necessary to have a weather station in every beet field. Overall, the different interactions result in a wide spread of epidemic onset times. This means that, in the final analysis, it is neces-sary to have a field-specific approach to fungicide treatments in order to achieve the target of flexible fungicide management with high economic and ecological effi-
cacy. In order to reach this goal, field observations are indispensable.
Acknowledgments We are thankful to the Bavarian State Ministry
for Agriculture and Nutrition and to the cura-torium for development of sugar beet growing in South-Germany for financial support. In addition, we thank the sugar beet and breeder companies as well as the chemical industry for technical support and cooperation and all individuals who helped on the development of the model. We thank G. M. Hoffmann (retired), who invented the IPM wheat, barley, sugar beet, and potato models, and had a considerable influence on the direction of the targeted scientific and applied research to develop and promote the introduction of the IPM models into practical agriculture.
Literature Cited 1. Ahrens, W., and Breustedt, E. 1984. Einfluß
des echten Rübenmehltaus auf den Zucker-ertrag im Trockenjahr 1983. Die Zuckerrübe, 33(1):42-44.
2. Ahrens, W. 1985. Maßnahmen zur Schadens-verhütung bei Befall mit dem Echten Rüben-mehltau (Erysiphe betae (Van.) Weltzien). IIRB, Brüssel, 1985. pp. 289-205.
3. Anonymous. 1998. Zucker in Zahlen. Wirt-schaftliche Vereinigung Zucker, Am Hofgar-ten 8, D-53113 Bonn.
4. Battilani, P., Beltrami, G., Meriggini, I., Ponti, A., Rossi, V., Rosso, F., Tugnoli, V., and Zocca, A. 1990. Nuovo indrizzi di difesa anticercosporica. Inf. Agrario 46(23):53-70.
5. Bleiholder, H., and Weltzien, H. 1972. Beiträge zur Epidemiologie von Cercospora beticola Sacc. an Zuckerrübe. II. Die Konid-ienbildung in Abhängigkeit von den Um-weltbedingungen Temperatur, relative Luft-feuchtigkeit und Licht. Phytopathol. Z. 73(1):46-68.
P. F. J. Wolf
Dr. Wolf, assistant in the Department of Plant Pathology at the University of Kiel, obtained his M.S. and Ph.D. degrees from the Technical University of Munich. His studies are focused on fungal leaf diseases in sugar beets with special emphasis on epidemiol-ogy, damage behavior, and modeling beet crop systems.
J. A. Verreet
Dr. Verreet is head of the Department of Phytopathology at the University of Kiel. He obtained his M.S. degree from the University of Bonn, and his Ph.D. and habilitation degrees from the Technical University of Munich. His studies deal with mycological problems of several crops (e.g., rape, sugar beet, cereals). His current in-terests center on using epidemiology as a basis for control measures.

344 Plant Disease / Vol. 86 No. 4
6. Bleiholder, H., and Weltzien, H. 1972. Beiträge zur Epidemiologie von Cercospora beticola an der Zuckerrübe. 3. Geopathol-ogische Untersuchungen. Phytopathol. Z. 73:69-86.
7. Cooke, D. A., and Scott, R. K. 1993. The Sugar Beet Crop - Science into practice. Chapman & Hal, London.
8. Drandarevski, C. A. 1969. Untersuchungen über den Echten Rübenmehltau Erysiphe betae (Vanha) Weltzien. III: Geophytopathologische Untersuchung. Phytopathol. Z. 65:201-218.
9. Jones, R. K., and Windels, C. E. 1991. A management Model for Cercospora leaf spot of sugar beet. Univ. Minn. Ext. Serv. AG-FO-5643-e.
10. Kolbe, W. 1986. 200 Jahre Pflanzenschutz im Zuckerrübenanbau (1784-1984). Bonn: Rhein. Land. Verlag.
11. Kranz, J., and Holz, F. 1993. Basics of Decision-Making and Planning for Integrated Pest Management (IPM). Zentralstelle für Ernährung und Landw., Feldafing und Tschor-tau.
12. Mischke, W. 1960. Untersuchungen über den Einfluß des Bestandesklimas auf die Ent-wickung der Rüben-Blattfleckenkrankheit (Cercospora beticola Sacc.) im Hinblick auf die Einrichtung eines Warndienstes. Bayer. Landw. Jb. 37(2):197-227.
13. Rossi, V., and Battilani, P. 1986. Impiego di variabili climatiche nella provisione delle infezioni primarie di Cercospora beticola Sacc. Inf. Fitopathol. 36(2):29-38.
14. Rossi, V., and Battilani, P. 1987. Dinamica delle epidemie di Cercospora beticola Sacc.
su Barbabietola da zucchero. Phytopathol. Mediterr. 26(3):114-119.
15. Rossi, V., and Battilani, P. 1990. Dinamica delle epidemie di Cercospora beticola Sacc. su Barbabietola da zucchero. III. Ruolo della suscettibilita varietale. Phytopathol. Mediterr. 29(2):114-119.
16. Shane, W. W., and Teng, P. S. 1983. Cer-cospora beticola infection prediction model. Sugarbeet Res. Ext. Rep. 23:174-179.
17. Shane, W. W., and Teng, P. S. 1985. Eval-uation and implementation of the Cercospora leafspot prediction model. Sugarbeet Res. Ext. Rep. 15:129-138.
18. Verreet, J. A., Wolf P. F. J., and Weis F. J. 1996. Bekämpfungsschwellen als Grundlage für eine integrierte Bekämpfung von Cerco-spora beticola - Das IPS-Modell Zuckerrübe. Proc. 59th IIRB Congr. pp. 55-69.
19. Weis, F.-J. 1998. Entwicklung eines Inte-grierten Pflanzenschutzsystems zur schwel-lenorientierten Bekämpfung von Cercospora beticola in der Zuckerrübenkultur - IPS-Modell-Zuckerrübe. Dissertation CAU Kiel, Agrimedia, agribusiness & food, Nr. 6. ISBN 3-86037-098-7.
20. Windels, C. E., Lamey, H. A., Hilde, D., Widner, J., and Knudsen, T. 1998. A Cerco-spora leaf spot model for sugar beet. Plant Dis. 82:716-726.
21. Wolf, P. F. J., Kraft, R., and Verreet, J.-A. 1998. Schadrelevanz von Cercospora beticola (Sacc.) in Zuckerrüben als Grundlage einer Verlustprognose. Z. Pflanzenkr. Pflanzen-schutz 105(5):462-474.
22. Wolf, P. F. J., and Verreet J. A. 1997.
Epidemiologische Entwicklung von Cerco-spora beticola (Sacc.) in Zuckerrüben. Z. Pflanzenkr. Pflanzenschutz 104(6):545-556.
23. Wolf, P. F. J., and Verreet, J. A. 1998. Einfluß des Cercospora-Befalls auf die Dynamik von Stoffproduktion und Ertragsentwicklung der Zuckerrübe. Mitt. Bio. Bund.-Anst. Land- und Forstwirtschaft 357:68.
24. Wolf, P. F. J., and Verreet, J. A. 2000. Möglichkeiten und Grenzen der Prognose von pilzlichen Blattkrankheiten der Zuckerrübe. Mitt. Bio. Bund.-Anst. Land- und Forstwirt-schaft 376:203-204.
25. Wolf, P. F. J., Weis F. J., and Verreet J. A. 1995. Grundlagen einer integrierten Bekämp-fung von Cercospora beticola in Zucker-rüben. Z. Pflanzenkr. Pflanzenschutz 102(6): 574-585.
26. Wolf, P. F. J., Weis, F. J., and Verreet J. A. 1995. Influence of different cropping systems and threshold values on the epidemiological behaviour of Cercospora beticola in sugar beet. Med. Fac. Landboww. Univ. Gent, 60/2b.
27. Wolf, P. F. J., Weis, F. J., and Verreet, J.-A. 2001. Bekämpfungsschwellen als Indikatoren des Fungizideinsdatzes zur Kontrolle des Blattbefalls von Cercospora beticola (Sacc.) in Zuckerrüben. Z. Pflanzenkr. Pflanzenschutz 108(3):244-257.
28. Wolf, P. F. J., Weis, F. J., Verreet, J.-A., Bürcky, K., Maier, J., and Tischner, H. 1998. IPS (Integriertes Pflanzenschutzsystem)-Modell Zuckerrübe - Entwicklungsschritte und Einführung in die Praxis. Gesunde Pflanzen 50(8):264-272.