Embed Size (px)
Citation preview


Indice
1. CHAIRMAN’S LETTER TO SHAREHOLDERS 2
2. BOARD OF DIRECTORS AND MANAGEMENT 4
3. THE BANK 6
• Brief Historical Summary
4. FINANCIAL SUMMARY 8
• Financial Summary Banco Security
• Consolidated Financial Summary Banco Security
5. ECONOMIC REVIEW 10
• Chile: Economic Indicators
6. BANCO SECURITY AND THE CHILEAN BANKING INDUSTRY 14
• Global View of Chilean Banking
• Banco Security’s activities and results
7. SUBSIDIARIES OF BANCO SECURITY 24
• Valores Security S.A. Corredores de Bolsa
• Administradora General de Fondos Security S.A.
8. FINANCIAL STATEMENTS 27
• Financial Statements of Banco Security
• Consolidated Financial Statements of Banco Security and Subsidiaries
• Summarized Financial Statements of the Subsidiaries
Contents

I am pleased to present to you the Annual Report of Banco Security for the year just ended.
The year 2003 was one in which we were able to begin to see the country’s economic prospects more
optimistically, a year in which the country began to rise above the stagnation affecting it for nearly half a
decade. While the figures for growth, domestic demand, investment, etc. showed no particularly important
changes, the most notable and uplifting were early signs of a greater dynamism in the economy in the second
half of the year. Added to this was the coming into effect of the free-trade agreement with the European
Union and the signing of the trade agreement with the United States, whose most tangible effects will be felt
in the second or third years. A third favorable element in the country’s economic prospects is the trend in the
global economy which, following the Iraq war early in the year, soon gave convincing signs of reactivation,
mainly from the United States. Among the more important indicators, we can mention that annual inflation
reached levels even below the target floor set by the Central Bank, which allowed interest rates to be held at
historically low levels. The unemployment rate has begun to decline but at a slower rate than expected, probably
due to the lack of flexibility in the labor laws. And lastly, the stock exchange had an exceptionally good year
with returns and trading volumes not seen for several years.
For Banco Security, the year 2003 was also a positive one, with strong growth in its loan portfolio and
results that reached record levels. This is no more than the result of years of work; confidence and a constant
strategy have enabled us to consolidate a clear market position as a niche bank with a service of excellence
widely recognized by our customers and competitors. Proof of this appeared in a survey published in the Diario
Financiero on October 10, 2003, showing Banco Security as the Chilean bank with the best quality of service.
The total loans of Banco Security at December 2003 were US$ 1,603.5 million, representing real growth
of 10.6% compared to 2002, a very positive result when compared with the 4.6% growth of the industry for
the same period, according to provisional figures published by the Superintendency of Banks and Financial
Institutions. Based on these, Banco Security ended the year with a market share of 2.87% of total financial
sector loans. In terms of results, the Bank’s net income for 2003 rose to US$ 22.2 million, representing an
increase of 31.0%, a return on equity of 16.5% and an efficiency ratio of 51.1%. It should be noted that these
achievements were not attributable to any particular area but to the combined efforts of each and every one
of the Bank’s areas.
Once again, it has been shown that the defined strategy of focusing on medium and large-sized businesses
and high-income individuals has been wise in terms of generating stable and growing revenues over time.
Even when size has implied a relative disadvantage in terms of efficiency, Banco Security has been able
to maintain its competitiveness which has allowed it to be highly successful in attracting and maintaining
customers. This is how Banco Security has been able to produce loan growth rates for so many years consistently
higher than the industry average.
Chairman’s letter to Shareholders
2 I Banco Security Annual Report 2003
1.

Banco Security Annual Report 2003 I 3
We have in recent years seen important changes in the Chilean financial sector, such as mergers, the
entry of new players, regulatory changes, technological advances in banking, etc., all of which have translated
into tougher competition. In this new environment, the traditional strengths of Banco Security, which are its
quality of service, good loan quality and high levels of efficiency and productivity, have acquired particular
relevance and, at the same time, have become a challenge for maintaining them. This has been achieved
thanks to Banco Security’s flexibility and professional capacity. It therefore continues to be among the banks
with the best loan quality, with a risk rating in October 2003 of 1.30% of loans compared to the 1.82%
average for the sector, and among the most efficient, with levels above the industry average and relatively
close to the largest banks. In addition, as has been traditional, it continues to be the bank with the highest
productivity in terms of loans per employee. It is not by chance that Banco Security appears in 11th place in
the ranking of the best Latin American banks prepared by the magazine América Economía in its issue of
November 21, 2003.
One of the pillars of Banco Security has been its people. It has always had a team of the highest level in
both professional and human terms, and I venture to say that this is the main reason for our achievements.
Neither is it a surprise for me but a source of pride that Banco Security has been recognized in 2003, for the
third consecutive year, among the «best 25 companies to work for in Chile». Along the same lines, a survey of
the «best companies for working women» carried out by El Mercurio, Ya magazine, Fundación Chile Unido and
Great Place to Work, sponsored by the Confederation of Production and Commerce, Banco Security was chosen
as among the 5 companies in Chile that provide the best facilities for mothers and that promote an optimum
relationship between the family and workplace.
Francisco Silva S.
Chairman
Board of Directors and Management of Banco Security
4 I Banco Security Annual Report 2003
BOARD OF DIRECTORS
Chairman Francisco Silva S.
Directors Hernán Felipe Errázuriz C.
Jorge Marín C.
Gustavo Pavez R.
Renato Peñafiel M.
Gonzalo Ruiz U.
Mario Weiffenbach O.
SENIOR MANAGEMENT
President Ramón Eluchans O.
Chief Assistant Executive Officer Margarita Hepp K.
Chief Corporate Banking Officer Christian Sinclair M.
Chief Investment & Finance Banking Officer Bonifacio Bilbao H.
Chief Risk Management Officer José Miguel Bulnes Z.
Chief Operating Officer Arturo Kutscher H.
Corporate Banking Officer Alejandro Arteaga I.
Middle Market & Branches Officer Adolfo Tocornal R-T.
Personal Banking & Mortgage Business Officer Gonzalo Baraona B.
Performance & Electronic Business Officer Marcial Letelier O.
International Relations Officer Claudio Izzo B.
Chief Administration Officer Manuel José Balmaceda A.
2.

Banco Security Annual Report 2003 I 5
COMMERCIAL MANAGERS AND AGENTS
Branches:
Temuco Branch Agent Felipe Schacht R.
Antofagasta Branch Agent Guillermo Delgado G.
Concepción Branch Agent Alberto Apel O.
Puerto Montt Branch Agent Francisco Zañartu F.
Quilicura Branch Agent David Díaz B.
Ciudad Empresarial Branch Agent Felipe Oliva L.
El Golf Branch Agent Patricio Gutiérrez P.
La Dehesa & Vitacura Platform Head José Pablo Jiménez U.
Private Banking Platform Head Constanza Pulgar G.
Business Platform:
Metropolitan Area Branches Assistant Manager René Melo B.
Businesses Assistant Manager Mauricio Parra L.
Large Corporations Assistant Manager Humberto Grattini F.
Corporations Assistant Manager Sebastián Covarrubias F.
Middle Market Assistant Manager Hernán Besa D.
Middle Market Assistant Manager Jorge Contreras W.
Leasing Area Assistant Manager Ignacio Lecanda R.
Personal Banking Assistant Manager Juan Carlos Ruiz V.
Large Corporations Agent José Luis Correa L.
Foreign Trade Business Agent Patricio Carvajal M.
Real Estate Area Agent Francisco Domeyko C.
Head Office Personal Banking Agent Margarita Jarpa del S.
Investment Platform:
Money Desk Assistant Manager Ricardo Turner O.

FORMAL INFORMATION
Name : BANCO SECURITY
Type of corporation : Banking Corporation
Objects : Carry out all the acts, contracts, operations and activities of a commercial bank in
accordance with current legislation.
Tax No. : 97.053.000-2
Domicile : Agustinas 621, Santiago, Chile
Telephone : (56-2) 270 4000
Fax : (56-2) 270 4001
Mail : [email protected]
Web : www.security.cl
Constitution : The corporation was formed under public deed dated August 26, 1981 signed before
Documents the notary Enrique Morgan Torres. The extract of this deed was published in the
Official Gazette on September 23, 1981.
6 I Banco Security Annual Report 2003
The Bank
3.

Banco Security Annual Report 2003 I 7
BRIEF HISTORICAL SUMMARY
• Banco Urquijo de Chile is formed in August 1981, a subsidiary of Banco Urquijo, Spain.
• In 1987, Security Pacific Corporation, a subsidiary of Security Pacific National Bank, Los Angeles, California,
acquired all the share capital of Banco Urquijo de Chile which then became known as Banco Security
Pacific. That year, Security Pacific National Bank formed a securities agency and stockbrokers which, in
1991, was sold to Banco Security, and which is today called Valores Security, Corredores de Bolsa.
• A leasing subsidiary is formed in 1990, called Leasing Security.
• In June 1991, Security Pacific Overseas Corporation sells 60% of the Bank to the present controlling
shareholders of Grupo Security, and then becomes known as Banco Security.
• The company Administradora de Fondos Mutuos Security is formed in 1992, a subsidiary of Banco Security.
• In 1994, Bank of America, the successor to Security Pacific National Bank, sells to Grupo Security the
remaining 40% of the share capital of Banco Security.
• In April 2001, the subsidiary Leasing Security is absorbed into Banco Security as a business unit.
• In September 2003, the subsidiary Administradora de Fondos Mutuos Security S.A. changes its name to
Administradora General de Fondos Security S.A

Results for the Year 1995 1996 1997 1998 1999 2000 2001 2002 2003
Gross Operating Income (Gross Margin) 28.1 29.8 32.5 36.5 44.4 46.6 56.4 61.3 66.4
Operating expenses 14.1 16.6 17.8 19.4 22.7 24.6 31.1 31.8 33.9
Net Operating Income (Net Margin) 14.0 13.2 14.8 17.1 21.7 22.0 25.3 29.5 32.5
Net Income 12.6 10.9 14.8 10.3 15.9 17.3 16.9 17.0 22.2
Year - End Balances 1995 1996 1997 1998 1999 2000 2001 2002 2003
Loans 630.7 762.6 955.0 1,024.0 1,080.1 1,275.2 1,316.4 1,442.7 1,603.5
Financial Investments 268.0 174.1 239.0 200.3 128.7 161.9 239.6 245.0 195.3
Productive Assets 898.6 936.6 1,194.0 1,224.3 1,208.8 1,437.0 1,556.0 1,687.7 1,798.8
Fixed Assets and Investment in Subsidiaries 31.5 36.5 37.4 39.0 44.4 47.3 29.7 35.0 45.5
Total Assets 1,054.2 1,216.9 1,308.8 1,413.7 1,382.7 1,633.3 1,751.9 1,894.3 1,992.5
Net Sight Deposits 31.8 47.6 44.6 37.8 52.2 52.6 83.0 85.4 96.5
Term Deposits & Borrowings 554.1 707.5 691.0 837.1 873.0 1,121.7 1,002.0 1,183.2 1,185.4
Borrowings fron abroad 113.1 123.7 66.6 78.5 72.8 16.4 137.6 149.2 154.6
Provision for Risk Assets 6.2 7.9 7.7 10.3 9.9 9.8 13.1 17.9 20.0
Capital & Reserves 76.2 77.1 80.5 103.2 103.2 122.3 126.5 128.1 129.8
Shareholders´ Equity 88.7 88.0 95.3 114.7 119.3 142.0 146.1 148.3 156.7
Indicators 1995 1996 1997 1998 1999 2000 2001 2002 2003
Productive Assets/Total Assets 85.24% 76.97% 91.22% 86.60% 87.42% 87.98% 88.81% 89.10% 90.28%
Net Income/Capital & Reserves 16.53% 14.11% 18.39% 9.89% 15.43% 13.84% 13.06% 12.92% 16.53%
Net Income/ Productive Assets 1.40% 1.16% 1.24% 0.84% 1.32% 1.20% 1.08% 1.01% 1.24%
Operating Expenses/Productive Assets 1.57% 1.77% 1.49% 1.58% 1.88% 1.71% 2.00% 1.88% 1.89%
Productive Assets/Number of Employees 4.6 4.5 5.1 4.8 4.3 4.4 4.5 5.4 5.8
Loans/Number of Employees 3.2 3.6 4.1 4.0 3.8 3.9 3.8 4.6 5.2
Leverage 13.7 14.7
Basle Index 9.8 12.3 12.3 11.7 11.3 11.6 11.2
Number of Employees 195 210 234 257 283 323 343 315 310
FINANCIAL SUMMARY BANCO SECURITYFigures in millions US$ as of December 2003
8 I Banco Security Annual Report 2003
Financial Summary
4.

CONSOLIDATED FINANCIAL SUMMARY BANCO SECURITYFigures in millions US$ as of December 2003
Banco Security Annual Report 2003 I 9
Results for the Year 1995 1996 1997 1998 1999 2000 2001 2002 2003
Gross Operating Income (Gross Margin) 38.8 40.0 42.8 44.8 58.0 59.6 64.1 72.6 78.7
Operating expenses 18.9 22.4 23.1 24.6 29.1 30.4 35.4 36.3 39.5
Net Operating Income (Net Margin) 19.9 17.6 19.7 20.2 28.9 29.2 28.7 36.3 39.2
Net Income 12.6 10.9 14.8 10.3 15.9 17.3 16.9 17.0 22.2
Year - End Balances 1995 1996 1997 1998 1999 2000 2001 2002 2003
Loans 689.5 834.2 1,034.2 1,107.5 1,157.8 1,348.4 1,316.4 1,442.5 1,603.5
Financial Investments 282.6 188.3 267.3 209.0 137.4 206.3 256.2 303.4 286.4
Productive Assets 972.1 1,022.5 1,301.5 1,316.5 1,295.2 1,554.7 1,572.6 1,745.9 1,890.0
Fixed Assets and Investment in Subsidiaries 14.5 20.2 17.9 20.0 23.8 24.6 20.8 21.0 25.3
Total Assets 1,111.3 1,288.1 1,399.3 1,493.6 1,460.1 1,746.4 1,763.1 1,941.8 2,067.7
Net Sight Deposits 37.7 47.6 44.6 37.7 52.2 52.6 83.0 83.1 96.2
Term Deposits & Borrowings 558.1 712.1 711.3 840.4 876.5 1,151.5 1,003.8 1,183.8 1,180.9
Borrowings fron abroad 87.2 123.7 66.6 78.5 72.8 16.4 137.6 149.2 154.6
Provision for Risk Assets 6.2 7.9 7.7 10.3 11.1 10.8 13.1 17.8 20.0
Capital & Reserves 76.2 77.1 80.5 103.2 103.2 122.3 126.5 128.1 129.8
Shareholders´ Equity 88.7 88.0 95.3 114.7 119.3 142.0 146.1 148.3 156.7
Indicators 1995 1996 1997 1998 1999 2000 2001 2002 2003
Productive Assets/Total Assets 87.47% 79.38% 93.01% 88.14% 88.71% 89.02% 89.19% 89.91% 91.40%
Net Income/Capital & Reserves 16.53% 14.11% 18.39% 9.89% 15.43% 13.84% 13.06% 12.92% 16.53%
Net Income/ Productive Assets 1.29% 1.06% 1.14% 0.78% 1.23% 1.11% 1.07% 0.97% 1.18%
Operating Expenses/Productive Assets 1.95% 2.19% 1.78% 1.87% 2.25% 1.96% 2.25% 2.08% 2.09%

D uring 2003, Chile found itself in a substantially improved global economic environment which
promises to lead to fuller reactivation during 2004. Following the uncertainty of the first quarter
because of the potential consequences of the war in Iraq, global, regional and domestic conditions
became more favorable and came even close to those of around 1997. Internally, while progress with the
“Pro Growth Agenda” continued to be slow, the arrival of trade agreements with the European Union and
the USA and the recovery in consumer confidence, fed greater economic expectations. Monetary policy
supported this process with greater degrees of expansion which stimulated a recovery in private spending.
The high degree of credibility in macro policies, based on inflation targets with a floating exchange rate and
fiscal solvency, allowed the Central Bank to continue to reduce the reference interest rate to 2.25% by the
end of the year, a level that continues to stand out as the lowest among emerging economies. Overall, the
fall in potential growth and unutilized capacity has limited the degree and speed of the recovery.
External Environment
Until the first half of 2003, world economic growth remained below its historic level, affected by
stagnation in Europe, Japan and Latin America and only compensated by the dynamism in emerging Asia
and the recovery in the USA. But the scenario became more positive from mid year. The fast ending of the
Iraq war, the consequent stabilization of oil prices, the control of Asian flu and the orthodox policies of
President Lula in Brazil cleared away the principal risks facing the global economy. The recovery process
therefore began to gather pace in the third quarter, causing price increases in the commodities, stock and
bond markets. According to IMF calculations, world growth in 2003 was close to 3.5%, one percentage point
more than in the previous two-year period. USA remained as one of the global motors, with growth of over
3% supported by high growth potential and the extension of expansive monetary and fiscal conditions. The
dynamism of emerging Asia was again the result of explosive growth rates in China (9%) and India (8%). To
the benefit of Chile, with its exports well diversified by destination, the global expansion became more
balanced in the second half with faster growth in Japan, the bouncing back of Latin America and some
evidence of recovery in Europe.
Another of the important changes on the world scene, with positive implications for Chile and the rest
of the emerging economies, was the weakening of the US dollar against other currencies especially following
the end of the Iraq war. The dollar, by the end of 2003, had devalued in multilateral terms by almost 20%
from its peak value seen in February 2002. Its biggest fall was against the euro, moving from US$0.85 per
euro to US$1.25 per euro, but it also declined against other important currencies. As usual, this was
accompanied by an increase in prices for raw materials, a situation that also promoted the global reactivation
process.
In the case of copper, its price rose from around US$0.7 per pound in late 2002 to almost a dollar per
pound at the end of 2003. This extended, with less intensity, to other commodities relevant to Chile and led
to a significant improvement in the terms of trade which benefited from the stabilization of oil prices at
around US$30 (Brent), later reaching a maximum of US$34 in March. This improvement in macroeconomic
10 I Banco Security Annual Report 2003
Economic Review
5.

and financial conditions reintroduced upward pressure on the peso and other regional currencies, leading to
a recovery in gross capital flows. Chile’s sovereign risk premium thus declined from 180 to 90 basis points,
supported also by structural factors such as expectations of an up-grade in its credit rating, a greater fiscal
transparency and the coming into force of trade agreements. The cost of external financing therefore remains
at historically low levels as short-term dollar rates remained close to 1% while the 10-year US Treasury
bond was held at a ceiling of 4.5%, although with ups and downs.
Internal Scene
The better external scenario described above took place basically in the second half so its positive
effects on activity were only partially reflected in the figures for 2003, with the most part impacting 2004.With
quarterly growth relatively flat throughout the year, average GDP grew by around 3.2%, still below its
potential rate. Income per capita therefore remained at about US$4,500, also expected to grow in 2004.
Regarding economic sectors, growth was similar between tradables and non-tradables, with just mining
(6%) standing out, benefiting from the copper production cuts made the previous year. In fact, the prop of
the non-tradable sectors, internal demand, saw similar growth to that of GDP. The financial sector in parti-
cular consolidated its recovery begun in 2002, stimulated by low interest rates, better expectations and a
high level of competition. The behavior of personal loans was even better than the previous year, with
increases of 17% in real terms for consumer loans and 12% for housing loans. As a result, home spending
was the most notable variable in total spending, with expansion of between 3.5% and 4% also supported by
the recovery in domestic incomes, the fall in unemployment and the stock market recovery. However, the
stagnation in domestic investment and the expansion of funding sources (bonds, commercial paper and
even companies seeking new quotations on the stock market) left commercial lending much unchanged.
The labor market also showed a clearly more favorable performance in 2003 compared to the previous
four years. 165 thousand new jobs were created which, in a context of a strong recovery in the workforce,
led to a fall in unemployment from 8.9% to 8.5%. This recovery was seasonally confined to the first half and
its composition was led by self-employed workers. The recovery lost dynamism from mid year due to the
acceleration seen in real wages related to the unexpected deflation.
With respect to the external accounts, the improvement in the terms of trade, linked to a gradual
recovery in domestic spending, prolonged the slack in this area, resulting in a trade surplus of about US$ 3
billion. Exports again stood out in this performance, with a 15% increase in dollar terms and 7% in volume
to make a total of almost US$21 billion. The deficit in the balance of payments current account therefore
persisted at below 1% of GDP. The public sector contributed a consolidated deficit of around 2% of GDP to
this result, which was more than offset by the savings surplus of the private sector (with respect to its
investment). In any event, fiscal policy played a less expansive role than in previous years, with spending
growth below 2% in real terms. As a result, the official balance of the central government, which includes as
income the drawings made from the Copper Compensation Fund (strictly speaking, a form of financing that
should be booked “below the line”), closed the year with a deficit of 0.8% of GDP. According to the authorities,
Banco Security Annual Report 2003 I 11

this result would have been again consistent with a structural surplus of 1% of GDP if it assumed that there
is a breach between effective and potential product of about 4.5% and that the long-term copper price is
US$0.9.
Inflation rates during 2003 were particularly volatile, mainly reflecting the behavior of the exchange
rate and the international fuel price. The accumulated inflation rate for the first quarter was 2.1% when, as
a result of uncertainty about the course of the Iraq war, oil was around US$34 a barrel and the dollar had
risen from Ch$700 at the end of 2002 to Ch$758 in March. But from April onward, a moderate reduction in
oil prices and a strong appreciation of the peso led to deflationary pressures that returned the 12-month
inflation rate to 1.1% in December, the lowest level in 68 years. This trend was also determined by the
continued slack in capacity, reducing trading margins and a limited increase in nominal wages. Underlying
inflation (excluding perishables and fuels) increased by just 1.6% during the year, below the level of the year
before (1.8%). Reduced inflation together with its associated restrictive impact on real interest rates, led the
Central Bank to deepen the expansive nature of its monetary policy by reducing its reference rate by 25
basis points in January and 50 points in December, to a level of 2.25%. Nominal rates for longer terms
adjusted to these reductions and to expectations of the prolongation of the expansive monetary policy. The
BCP-5 rate, which fluctuated around 6% during much of the year, closed in December at slightly over 4.5%.
Rates on UF-indexed instruments, while showing a high volatility in line with inflation, consolidated at
historically low levels. The yield on BCU-5 (previously PRC-8) paper began and ended the year at 3.25%,
although passing close to 2.5% in March when demand for UF securities intensified as a result of accelerating
inflation.
Conclusion
A better external environment, moderate reactivation, slack in the external accounts, a firmer stock
market, peso appreciation and lower inflation characterize the Chilean economic performance in 2003.
Most of these trends should be passed on to 2004 when, with the wind firmly behind it, growth could result
at more than the revised potential rate (4%), as the Central Bank has suggested.
12 I Banco Security Annual Report 2003

Banco Security Annual Report 2003 I 13
Economic Review
CHILE: ECONOMIC INDICATORS
1999 2000 2001 2002 2003
GDP (US$ billions) 73.0 74.9 68.3 66.4 71.4GDP per capita (US$) 4,861.0 4,922.0 4,432.0 4,261.0 4,525.0Real GDP growth (%) -1.0 4.4 3.1 2.1 3.2Domestic Spending Growth -5.8 5.7 2.1 1.9 3.2 Private spending -1.0 3.7 2.7 1.7 3.5 Investment in fixed capital -18.2 7.7 2.5 1.4 2.3
Terms of trade 100.1 103.1 99.2 100.5 102.7Copper price (US$ cents per lb.) 71.3 82.2 71.6 70.7 80.7Oil price(US$ a barrel) 16.4 28.5 24.0 25.2 30.9
Trade balance (US$ billions) 2.4 2.1 2.1 2.5 2.9Current account (US$ billions) -0.3 -1.1 -1.3 -0.6 -0.4Balance of payments (US$ billions) -0.6 0.3 -0.6 0.2 -0.1
Total savings (domestic + external), % of GDP 20.9 21.8 21.9 21.9 22.5 Gross domestic saving 21.0 20.6 20.0 21.1 22.0 Central government 1.5 2.3 2.2 2.0 2.1 Rest (private sect., Central Bk, & state entities) 19.6 19.1 17.8 19.1 19.9 External savings -0.1 1.2 1.9 0.9 0.5
Inflation Dec-Dec (%) 2.3 4.5 2.6 2.8 1.1Underlying inflation Dec-Dec (%) 2.1 3.4 3.2 1.8 1.6Relevant external inflation (Central Bank avrge %) -1.4 2.4 -1.9 -4.1 10.4
Monetary policy rate (avrge, Dec % in Ch$) 8.8 8.3 6.5 3.0 2.4BCU-5 rate 360 days (avrge Dec % in UF) 6.7 5.9 4.9 3.2 3.0
Exchange rate (avrge Ch$/US$) 508.8 539.5 634.9 688.9 691.4Exchange rate (avrge Dec. Ch$/US$) 538.2 574.6 669.1 701.9 602.9Real exchange rate (Central Bank avrge 1996=100) 97.1 101.5 113.0 114.9 123.6
Employment growth (%) -2.2 1.1 0.3 1.1 3.1Workforce growth (%) 1.5 0.3 0.3 0.9 2.6Unemployment rate (%) 9.8 9.2 9.0 8.9 8.5Change in real wages (%) 2.4 1.4 1.6 2.1 1.0
Total net foreign liabilities (US$ billions) 28.7 29.3 29.5 28.0 28.4Total net foreign liabilities (% GDP) 39.4 39.2 43.2 42.1 39.7Total net foreign liabilities (% exports) 138.4 127.8 132.5 125.5 111.5

T he following is a brief analysis of changes in the banking industry during 2003 in terms of the
principal events of the year, growth in lending and the results. We shall then analyze the perfor
mance of Banco Security in this context.
GLOBAL VIEW OF CHILEAN BANKING
The principal macroeconomic indicators in 2003, like GDP growth, domestic demand,
unemployment, investment, etc. showed no very important changes, but, starting in the second
half, numerous signs of reactivation appeared in Chile and in the global economy. In addition, with
the coming into effect of the free-trade agreement with the European Union, the signing of the
agreement with the United States and the low levels of inflation that have enabled the Central
Bank to maintain an expansive monetary policy, the economic prospects from 2004 onward are
quite positive. All this directly affects the banking industry, explaining the moderate growth in
loans during 2003 and the more optimistic forecasts for 2004. It is therefore fairly symptomatic
that the increased growth in 2003 has been mainly in consumer and housing loans. It should also
be remembered that the difficult economic situation the country lived through from 1998 to
2003 forced banks to make special efforts to improve efficiency and reduce and control their risks,
thus placing them in an enviable position for facing 2004 and thereafter.
There have been numerous changes in the Chilean financial sector in recent years and 2003
was no exception. The most notable factors during the year were:
• The entry of new players: in April 2003, the Supertintendency of Banks and Financial Institutions
was requested to approve a banking license for Banco Paris which obtained a provisional one 3
months later. In July, a further request was presented for the creation of Banco Penta, led by the
group of that name. Also, early in the year, Banco Conosur began operating after previously
being a finance company, and Banco Momex opened its doors in August.
• Changes of ownership of certain banks, like Banco Sudameris being bought early in the year by
Banco de Desarrollo, Consour which was bought by Banco de Crédito e Inversiones, and Banco
Santiago Express which passed to Almacenes París.
• Modifications to the regulatory framework which included banks being authorized to offer
customers incentives other than interest. Discussions also progressed concerning the capital
markets law II.
• Consolidation of the merged banks that began to show improved levels of efficiency and
profitability.
• Lastly, the banking mechanization process continued with a constant increase in the number of
Banco Security and the Chilean Banking Industry
14 I Banco Security Annual Report 2003
6.

users of electronic channels, and large investments by some banks in new equipment and systems.
The number of customers connected to internet exceeds 600 thousand (220 thousand in 2000)
and electronic transactions represented 50% of the total.
Lending
The provisional banking industry figures for 2003 show a growth in total loans of 4.6%. While this
is higher than in 2002, it continues to be below the real annual average of 11.8% seen between 1990
and 1997. However, this is no more than confirmation of the direct correlation between the behavior
of the economy and that of the financial sector, as the graph shows.
The following points are noted
from analyzing the detail of changes
in loans during 2003:
• Highest growth was in interbank
lending (57.6%) and personal
banking products, with consumer
and housing loans showing a
significant recovery (16.8% and
12.4% respectively).
• The most relevant negative changes
were in lines of credit and
overdrafts (-10.4%) following by
foreign trade finance (-6.4%).
• The past-due portfolio fell by 6.2%, reflecting a lower risk resulting from the country’s better economic
conditions.
• Assets previously booked by leasing and factoring subsidiaries continued to grow at very high rates
(15.4% and 32.2% respectively) due among other things to the progressive incorporation of these
subsidiaries into their respective bank parents.
Banco Security Annual Report 2003 I 15
1994 1995 1996 1997 1998 1999 2000 2001 2002 2003
Loans Growth vs. GDP Growth Source: INE and SBIF
0%
5%
10%
15%
Loans
GDP
4.9%
5.7%
17.9%
10.6%
11.5%
7.4%
13.0%
6.6%
4.7% 2.7% 4.6% 4.6%
3.2% -1.0% 4.4% 3.1% 3.2%2.1%
4.3% 1.6%
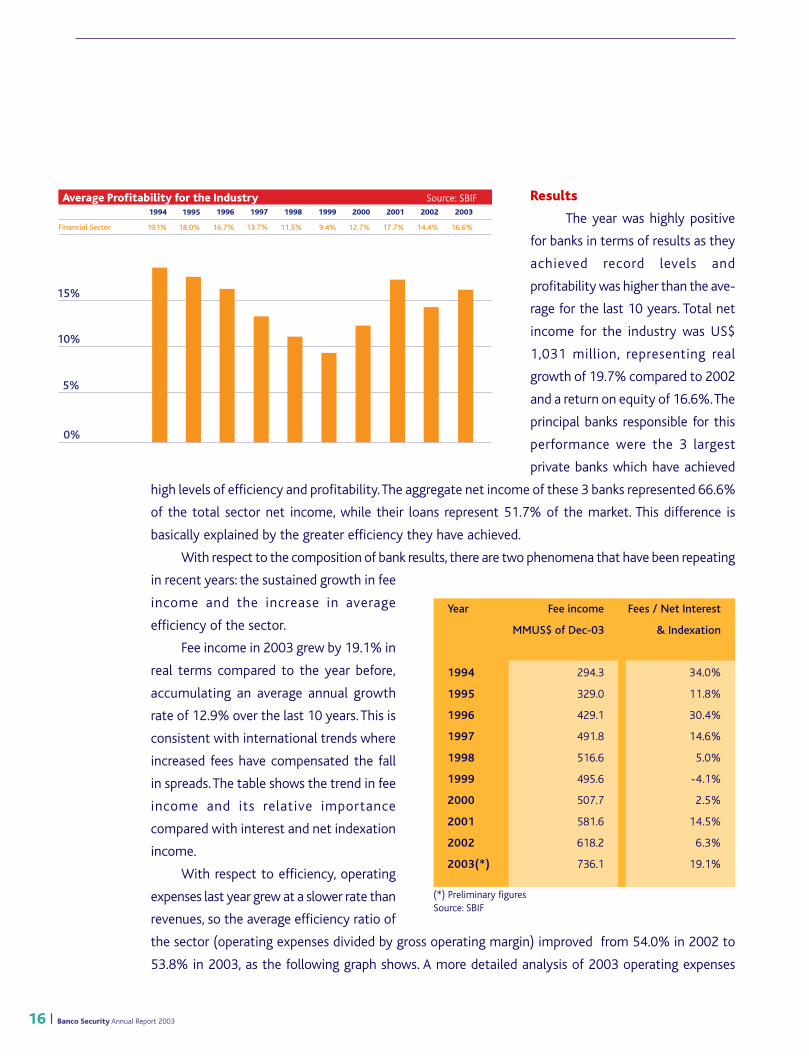
Results
The year was highly positive
for banks in terms of results as they
achieved record levels and
profitability was higher than the ave-
rage for the last 10 years. Total net
income for the industry was US$
1,031 million, representing real
growth of 19.7% compared to 2002
and a return on equity of 16.6%. The
principal banks responsible for this
performance were the 3 largest
private banks which have achieved
high levels of efficiency and profitability. The aggregate net income of these 3 banks represented 66.6%
of the total sector net income, while their loans represent 51.7% of the market. This difference is
basically explained by the greater efficiency they have achieved.
With respect to the composition of bank results, there are two phenomena that have been repeating
in recent years: the sustained growth in fee
income and the increase in average
efficiency of the sector.
Fee income in 2003 grew by 19.1% in
real terms compared to the year before,
accumulating an average annual growth
rate of 12.9% over the last 10 years. This is
consistent with international trends where
increased fees have compensated the fall
in spreads. The table shows the trend in fee
income and its relative importance
compared with interest and net indexation
income.
With respect to efficiency, operating
expenses last year grew at a slower rate than
revenues, so the average efficiency ratio of
the sector (operating expenses divided by gross operating margin) improved from 54.0% in 2002 to
53.8% in 2003, as the following graph shows. A more detailed analysis of 2003 operating expenses
16 I Banco Security Annual Report 2003
(*) Preliminary figuresSource: SBIF
Year Fee income Fees / Net Interest
MMUS$ of Dec-03 & Indexation
1994 294.3 34.0%
1995 329.0 11.8%
1996 429.1 30.4%
1997 491.8 14.6%
1998 516.6 5.0%
1999 495.6 -4.1%
2000 507.7 2.5%
2001 581.6 14.5%
2002 618.2 6.3%
2003(*) 736.1 19.1%
1994 1995 1996 1997 1998 1999 2000 2001 2002 2003
Financial Sector
Average Profitability for the Industry Source: SBIF
18.0% 16.7% 13.7% 11.5% 12.7% 17.7%19.1% 9.4% 14.4% 16.6%
0%
5%
10%
15%
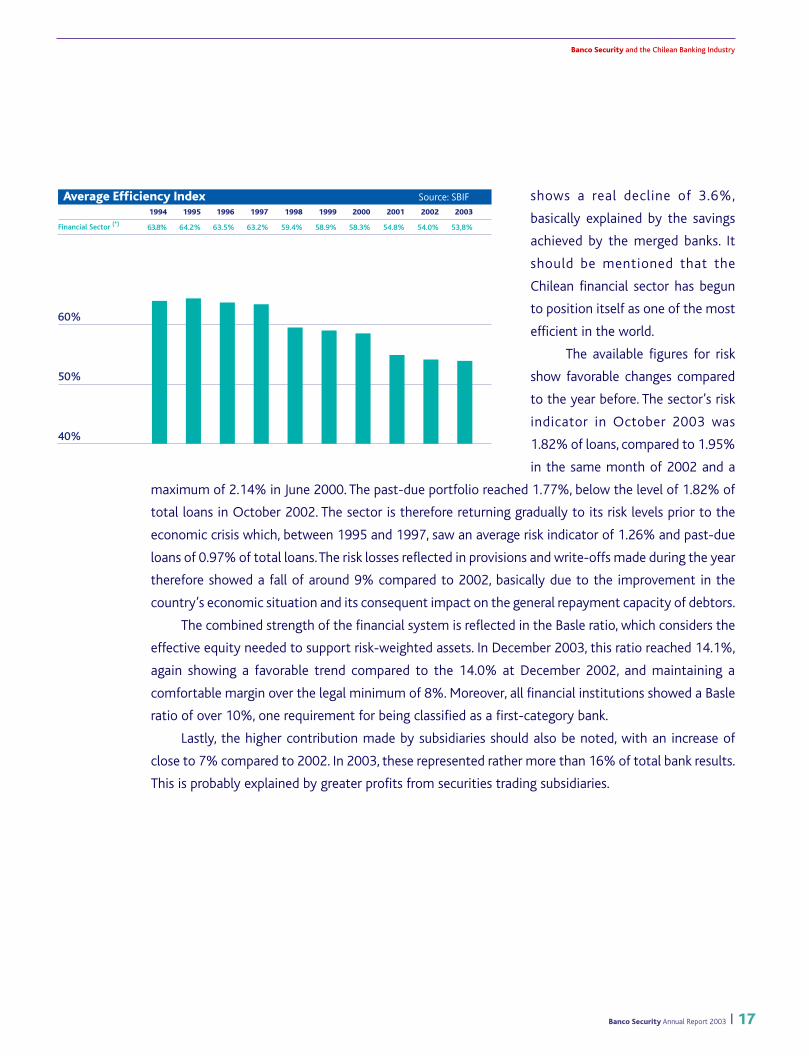
shows a real decline of 3.6%,
basically explained by the savings
achieved by the merged banks. It
should be mentioned that the
Chilean financial sector has begun
to position itself as one of the most
efficient in the world.
The available figures for risk
show favorable changes compared
to the year before. The sector’s risk
indicator in October 2003 was
1.82% of loans, compared to 1.95%
in the same month of 2002 and a
maximum of 2.14% in June 2000. The past-due portfolio reached 1.77%, below the level of 1.82% of
total loans in October 2002. The sector is therefore returning gradually to its risk levels prior to the
economic crisis which, between 1995 and 1997, saw an average risk indicator of 1.26% and past-due
loans of 0.97% of total loans. The risk losses reflected in provisions and write-offs made during the year
therefore showed a fall of around 9% compared to 2002, basically due to the improvement in the
country’s economic situation and its consequent impact on the general repayment capacity of debtors.
The combined strength of the financial system is reflected in the Basle ratio, which considers the
effective equity needed to support risk-weighted assets. In December 2003, this ratio reached 14.1%,
again showing a favorable trend compared to the 14.0% at December 2002, and maintaining a
comfortable margin over the legal minimum of 8%. Moreover, all financial institutions showed a Basle
ratio of over 10%, one requirement for being classified as a first-category bank.
Lastly, the higher contribution made by subsidiaries should also be noted, with an increase of
close to 7% compared to 2002. In 2003, these represented rather more than 16% of total bank results.
This is probably explained by greater profits from securities trading subsidiaries.
Banco Security and the Chilean Banking Industry
Banco Security Annual Report 2003 I 17
1994 1995 1996 1997 1998 1999 2000 2001 2002 2003
Financial Sector (*) 64.2% 63.5% 63.2% 59.4% 58.3% 54.8%
Average Efficiency Index Source: SBIF
63.8% 58.9% 54.0% 53,8%
40%
50%
60%

Conclusion
It can finally be concluded that the most difficult years for the Chilean banking sector have passed.
Even though 2003 was not a particularly good year, clearly reflected in the low loan growth rates,
especially of commercial loans, it was a positive year in terms of future prospects for the economy in
general and the financial sector in particular. Beginning in the second half of the year, there were
encouraging signs of economic reactivation which quickly affected the sector with an improvement in
risk indicators and thus asset losses. If, in addition to the new economic scenario, the adjustment that
banks have made to face the crisis is taken into account, it is be expected that 2004 and subsequent
years will be very favorable, possibly with results and returns approximating or exceeding the historic
highs.
BANCO SECURITY’S ACTIVITIES AND RESULTS
Strategy
The Chilean banking industry has continued to show great dynamism, with new ownership changes, the
entry of new players, greater efficiency, increasingly more aggressive commercial strategies, better technologies,
etc., all of which have increased competitiveness progressively and significantly. In this context, Banco Security
has made important efforts to improve its efficiency without affecting service quality. This has enabled it to
maintain its market position with a clear differentiation from its competitors.
The strategy of Banco Security is to offer personalized, integral, competitive and timely solutions to the
financial needs of large and medium-sized companies and of high-income individuals, providing them with a
service of excellence that allows us to retain them for long periods of time. The Bank therefore provides them
with a complete range of financial products and services with top-level technological support in all its channels
and with all the necessary support for giving customers complete satisfaction.
In order to implement this strategy correctly, Banco Security has organized its activities into three busi-
ness areas: Corporate Banking, Personal Banking and Investment Banking.
• Corporate Banking is Banco Security’s most traditional business area and concentrates approximately
83% of its total loans at December 2003, and contributes around 63% of revenues. This area is itself
divided into:
- Corporate Banking, focused on the largest private and public-sector companies in Chile, with sales
exceeding US$25 million, and including real-estate companies.
18 I Banco Security Annual Report 2003
- Middle Market Banking, dedicated to companies with sales of between US$5 million and US$25
million annually, through its branches in Santiago and the regions.
• Personal Banking is oriented to attracting and attending high-income individuals, today
concentrating a little below 17% of total Bank loans and contributing about 20% of its revenues.
This area is structured in the following way:
- Preferential Banking and Private Banking, specialized in attending high-income individuals who
demand an optimum quality of service.
- Mortgage business, concentrated on attracting and attending high-income customers who require
mortgage financing.
During 2003, this area continued expanding aggressively, gaining customers and business attracted by the
recognized quality of service and wide variety of products offered. The stock of loans at December grew by
33% compared to 2002 while the number of checking account holders rose to 11,120.
• Investment Banking is an area that has traditionally been of great relevance in the business and
results of the Bank, complementing the service provided by the commercial areas. This is made up of:
- The Money Desk which operates actively in currency and securities trading in both the domestic and
foreign markets, and manages the Bank’s exposure to currencies, maturities and interest rates.
- International Management, dedicated to exploring foreign financial markets and seeking finance
for the foreign trade business in which Banco Security has maintained an important participation over the
years.
In recent years, Banco Security has made important efforts both in the development and introduction of
new products and in the incorporation of the latest technological advances in the industry, in order to make
available to companies and individual customers all the tools necessary for an optimum management of their
resources. This has placed Banco Security in a privileged position together with other banks choosing modernization
and has led the Bank’s Personal Banking area to have one of the most “technologized” customer portfolios in
the Chilean banking sector.
An important investment was made in 2003 to replace the Bank’s main hardware with the latest generation
technology, and great efforts were made to introduce numerous innovations in the information and
communications systems, all of which have significantly improved capacity, reliability and response times of
the Bank’s different systems and electronic channels (internet, WAP and telephonic banking). This has permitted
Banco Security Annual Report 2003 I 19
Banco Security and the Chilean Banking Industry

continued progress in the structural changes begun in 2002 for transforming branches into “transactional
centers” and for creating centralized “business platforms” from which commercial executives provide the
personalized attention and financial support required by customers and which characterizes Banco Security.
Loans performance
Banco Security’s total loans at December 31, 2003 reached US$ 1,603.5 million, representing a
real increase of 10.6% over 2002, according to provisional figures published by the Superintendency of
Banks and Financial Institutions. This increase is significantly greater than that shown by the banking
sector over the same period,
amounting to 4.6%. Banco Security
therefore has a market share of
2.87% of total loans and occupies
9th place out of 26 banks operating
in Chile.
With respect to the
composition of the loan portfolio,
there were no large changes except
for the growth in mortgage loans:
• Commercial loans, consistent with
the Bank’s strategy, represented
64.5% of the Bank’s total loans
(66.2% in 2002).
• Foreign trade financing made up 8.1% of the total.
• Outstanding leasing agreements represented 6.5%.
• Contingent assets made up 4.6% of loans.
• Consumer loans granted by Personal Banking made up 0.8%.
• Placements of credit notes comprised 10.1% of the portfolio.
Results
The results of Banco Security for 2003 were very satisfactory, reflecting the strength and maturity
achieved over the years. The consolidated results of the Bank and its subsidiaries was US$ 22.2 million,
which represents real growth of over 30% compared to 2002 and a return on equity of 16.5%. These
figures are the result of a good performance by all the Bank’s three business areas, notable being the
good results from managing currency and maturity mismatches and the growth in Personal Banking
which, having passed its break-even point, is now an important contributor to the results, without
20 I Banco Security Annual Report 2003
1994 1995 1996 1997 1998 1999 2000 2001 2002 2003
Financial Sector
Banco Security Laon Growth vs. Financial Sector Source: SBIF
8.9% 21.7% 25.4% 2.4% 18.1% 4.2%27.3% 5.5% 9.0% 10.6%
4.9% 17.9% 11.5% 13.0% 4.7% 2.7% 4.6% 4.3% 1.6% 4.6%
0%
8%
24%
16%
Banco Security
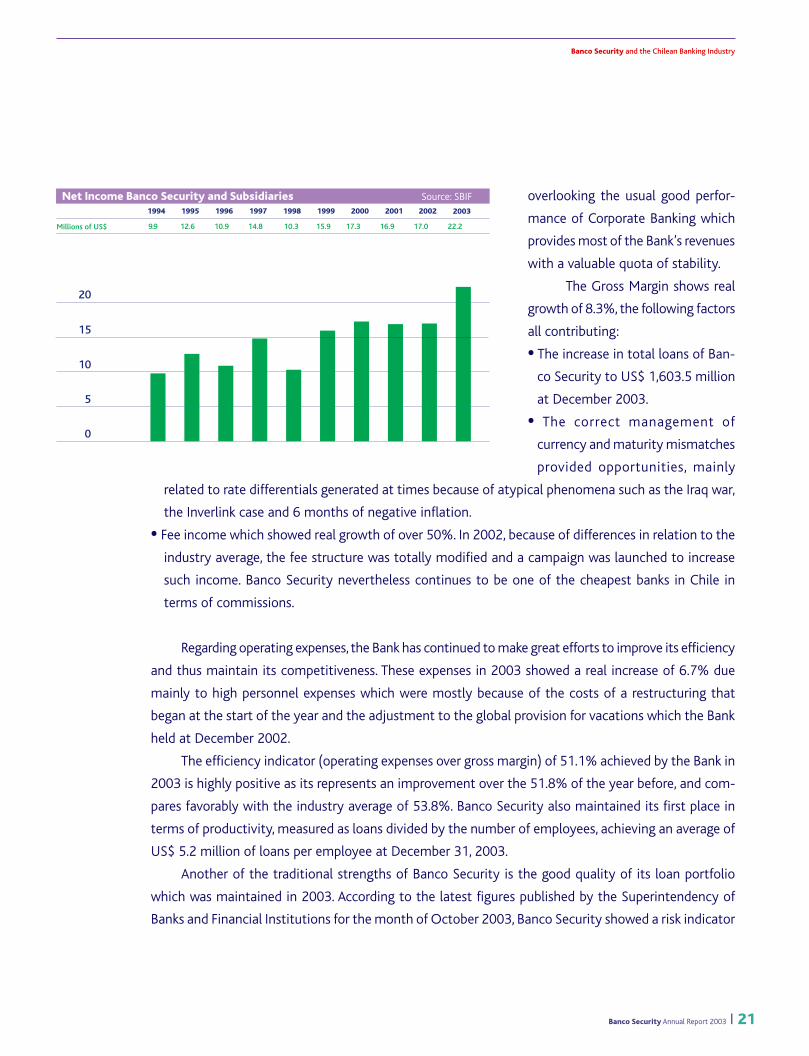
overlooking the usual good perfor-
mance of Corporate Banking which
provides most of the Bank’s revenues
with a valuable quota of stability.
The Gross Margin shows real
growth of 8.3%, the following factors
all contributing:
• The increase in total loans of Ban-
co Security to US$ 1,603.5 million
at December 2003.
• The correct management of
currency and maturity mismatches
provided opportunities, mainly
related to rate differentials generated at times because of atypical phenomena such as the Iraq war,
the Inverlink case and 6 months of negative inflation.
• Fee income which showed real growth of over 50%. In 2002, because of differences in relation to the
industry average, the fee structure was totally modified and a campaign was launched to increase
such income. Banco Security nevertheless continues to be one of the cheapest banks in Chile in
terms of commissions.
Regarding operating expenses, the Bank has continued to make great efforts to improve its efficiency
and thus maintain its competitiveness. These expenses in 2003 showed a real increase of 6.7% due
mainly to high personnel expenses which were mostly because of the costs of a restructuring that
began at the start of the year and the adjustment to the global provision for vacations which the Bank
held at December 2002.
The efficiency indicator (operating expenses over gross margin) of 51.1% achieved by the Bank in
2003 is highly positive as its represents an improvement over the 51.8% of the year before, and com-
pares favorably with the industry average of 53.8%. Banco Security also maintained its first place in
terms of productivity, measured as loans divided by the number of employees, achieving an average of
US$ 5.2 million of loans per employee at December 31, 2003.
Another of the traditional strengths of Banco Security is the good quality of its loan portfolio
which was maintained in 2003. According to the latest figures published by the Superintendency of
Banks and Financial Institutions for the month of October 2003, Banco Security showed a risk indicator
Banco Security Annual Report 2003 I 21
1994 1995 1996 1997 1998 1999 2000 2001 2002 2003
Millions of US$
Net Income Banco Security and Subsidiaries Source: SBIF
12.6 10.9 14.8 10.3 17.3 16.99.9 15.9 17.0 22.2
0
10
15
5
20
Banco Security and the Chilean Banking Industry

22 I Banco Security Annual Report 2003
1994 1995 1996 1997 1998 1999 2000 2001 2002 2003(*)
Risk Indicator Banco Security vs. Financial Sector Fuente: SBIF
0.0%
1.0%
2.0%
(*) October 2003
Financial Sector 1.3%1.6% 1.3% 1.2% 1.5% 2.0% 2.1% 1.9% 2.0% 1.8%
Banco Security 0.5% 0.6% 0.8% 0.6% 0.9% 1.1% 0.8% 1.0% 1.2% 1.3%
of 1.30%, being, jointly with one
other bank, the one with the lowest
risk out of all the medium and large
banks, and comfortably exceeding
the industry average of 1.82%. This
and the positive evolution of the
country’s economy during the year,
explains the lower losses (provisions
for risk assets less recoveries of loans
written off) suffered by the Bank in
2003 which amounted to US$ 10.3
million, a real fall of 16.4% compared
to 2002.
In terms of solvency, the Basle ratio (effective equity over risk-weighted assets) of Banco Security
maintained a comfortable margin over the 10% level required by current local regulations for qualifying
as a first-category bank and, even more so, over the minimum of 8%. For Banco Security, this ratio was
11.2%, below the average of 14.1% for the banking sector. The Bank’s basic capital at the same time
represented 6.5% of its total assets, much higher than the minimum of 3% required by the General
Banking Law.
The subsidiaries of Banco Security, Valores Security Corredores de Bolsa and Administradora Ge-
neral de Fondos Security, were important contributors to the Bank’s results as in previous years. Income
from its investments in related companies amounted to US$ 5.9 million at December 2003, an increase
of 14.0% over 2002 and representing 26.4% of the Bank’s consolidated net income.
Branches
Banco Security has 9 offices in Santiago (Head Office, Providencia, El Golf, Vitacura, La Dehesa,
Panamericana, Quilicura, Santa Elena and Ciudad Empresarial) and 4 regional branches (Antofagasta,
Concepción, Temuco and Puerto Montt). This weak geographic coverage directly reflects the Bank’s
strategic definition as large and medium-sized companies and high-income individuals value service

Banco Security Annual Report 2003 I 23
Banco Security and the Chilean Banking Industry
quality and are usually intensive users of electronic channels rather than the branches. On the other
hand, time has shown that the low investment in offices was a wise decision as the development and
massification of electronic channels has reduced and will continue to reduce the importance of
geographic coverage, particularly for the objective segments of Banco Security. What was an important
disadvantage some years ago is gradually becoming an advantage because of the greater flexibility
offered by low investments in branches.
Other Important Events
As occurred in 2001 and 2002, Banco Security was chosen for the hall of fame of the “25 best
companies to work for in Chile” in a survey conducted by the Great Place to Work Institute. This again
confirms the permanent concern of the senior management to offer the Bank’s staff an optimum
working environment which has enabled it to have a top-flight human team that is widely recognized
in the market. This distinction is a source of pride for Banco Security, first because it places it in a unique
place in the banking sector and second because it consolidates itself in a position where multinational
companies usually figure. As if this were not enough, a survey carried out by El Mercurio, the magazine
Ya, Fundación Chile Unido and Great Place to Work, and sponsored by the Confederation of Production
and Commerce on “the best companies for mothers to work” chose Banco Security as among the 5
companies in Chile providing the best facilities for mothers to work.
T he year 2003 was a good one for Valores Security S.A., Corredores de Bolsa in terms of results. With
a record net income of US$ 4.0 million, it exceeded the good results obtained the previous year with
an increase of 16.8%. This represents a return of 41.4% on the company’s equity and a contribution
to the consolidated results of Banco Security of 18.0%.
Valores Security operates mainly in two business areas: fixed income and variable income. The first
corresponds basically to securities trading, foreign currency trading and US dollar futures contracts, while
the variable income operations cover share trading, the collection of stock exchange duties and the
management of its own portfolio. The performance of these areas in 2003 was as follows:
• The fixed-income area generated net revenues of US$ 6.5 million in what was a quite special year with
respect to interest rate behavior both in Chile and abroad and to the uncertainties caused by the Inverlink
case.
• The variable-income area generated revenues of US$ 0.4 million, representing only 5.9% of the company’s
income. While this business gave birth to the company in 1987, it has remained relegated to second place
as a result of the growth of the fixed-income business in recent years.
The year 2003 will be remembered among other things for the vigorous reactivation of the stock
market, provoked by a greater market optimism concerning economic expectations for the coming year.
Following years of low and even negative returns and trading volumes constantly falling, 2003 ended with
increases of 46.2% in the General Stock Price Index (IGPA) and 48.5% in the Selective Stock Price Index
(IPSA), returns not seen for 10 years, and a 140% growth in trading volumes. As a result, the market
capitalization of companies traded on the exchange reached US$85,676.2 million, surpassing GDP.
Valores Security could not ignore what was happening on the stock market and increased its share
trading by almost 40% to US$ 308.2 million and its variable-income revenues by over 30%. The company
thus occupied 13th place out of the 38 stockbrokers operating on the local market, with a 1.14% participation
in the volumes traded on the Santiago Stock Exchange and the Chilean Electronic Exchange.
Subsidiaries of Banco Security
VALORES SECURITY S. A., CORREDORES DE BOLSA
BOARD OF DIRECTORS
Chairman Ramón Eluchans O.
Directors Bonifacio Bilbao H.
Javier Gómez C.
Enrique Menchaca O.
Luis Montalva R.
MANAGEMENT
President Nicolás Ugarte B.
Chief Operating Officer Juan Adell S.
Investments Assistant
Manager Cristián Pinto M.
24 I Banco Security Annual Report 2003
7.

Banco Security Annual Report 2003 I 25
T he mutual funds industry is highly competitive. There are 17 management companies of which 11
are bank subsidiaries, 2 are related to stockbrokers and 4 are related to insurance companies.
According to the latest figures of the fund managers association at December 2003, total funds
managed by the industry rose to US$8,408 million while the number of participants rose to 428,287, an
increase of 11.8% for the year, thus confirming the return to growth of previous years. The good stock market
performance, the introduction of Voluntary Pension Savings, better economic prospects, portfolio diversification
and the appearance of “tailor-made” mutual funds explain, among other factors, the sector’s good year.
The more important events affecting the industry during 2003 were:
•At the start of the year, the industry suffered from the effects of the uncovering of the Inverlink case. As a
result of the uncertainty caused by the precautionary measures imposed by the courts, assets managed
fell by about 17% between February and April (20.0% compared to December 31, 2002) and then recovered
slowly to close the year 4% higher than the previous year.
• A total of 45,241 new participants were added during 2003.
• Managed assets relating to Voluntary Pension Savings grew significantly and by November 2003 had
achieved a 5.4% share of total mutual fund assets with funds of US$ 874.0 million.
• The types of funds that saw the greatest growth during the year were in variable income (equities), directly
reflecting the reactivation and stock market returns.
Administradora General de Fondos Security S.A. was formed in May 1992 as a mutual funds mana-
ger and a subsidiary of Banco Security. In September 2003, it widened its objects and changed its name
to the present one. It has grown consistently since its formation in terms of number of funds, assets
managed (US$ 323.3 million at December 2003) and number of participants. The funds and their assets
managed at the end of 2003 are:
• Security Check, a short-term fixed-income fund designed for medium and large companies. Assets managed
at December 31, 2003: US$ 55.8 million.
BOARD OF DIRECTORS
Chairman Francisco Silva S.
Directors Carlos Budge C.
Felipe Larraín M.
Renato Peñafiel M.
Gonzalo Ruiz U.
MANAGEMENT
President Alfredo Reyes V.
Commercial Officer Juan Pablo Lira T.
Investment Assistant
Manager Rodrigo Fuenzalida B.
ADMINISTRADORA GENERAL DE FONDOS SECURITY S.A.

26 I Banco Security Annual Report 2003
MUTUAL FUNDS
Figures in millions of US$ as of December 2003 1997 1998 1999 2000 2001 2002 2003
Mutual Funds Industry 4,017.4 2,638.5 3,947.5 4,727.4 5,838.6 8,126.3 8,457.2
Admin. General de Fondos Security 115.5 109.9 169.5 181.4 207.9 393.6 323.3
Market share 2.9% 4.2% 4.3% 3.8% 3.6% 4.8% 3.8%
• Security First, a medium and long-term fixed-income fund with assets managed at December 31, 2003
of US$ 46.6 million.
• Security Premium, a short-term fixed-income fund designed for individuals and small companies, with
assets managed at December 31, 2003 of US$ 15.9 million
• Security Acciones, an equity fund with Series A and B, and assets managed at December 31, 2003 of US$
27.4 million
• Security Global Investment, a fund, also with Series A and B, that can invest all its resources abroad.
Assets managed at December 31, 2003 are US$ 2.1 million
• Security Gold, a fixed-income fund designed for people with a medium and long-term investment horizon.
Assets managed at December 31, 2003 are US$ 77.1 million.
• Security Explorer, an international equity fund, with Series A and B, and with assets managed at December
31, 2003 of US$ 1.5 million
• Security Bond, a fund invested in Chilean and foreign long-term bonds, with assets managed at December
31, 2003 of US$ 47.7 million.
• Security Plus, a short-term fund focused on businesses and individuals, with assets managed at December
31, 2003 of US$49.3 million.
The difference between the Series A and B is that the Series B refer to participants’ Voluntary Pensions
Savings.
Administradora General de Fondos Security obtained very satisfactory results in 2003, with a net
income of US$1.9 million, representing a real increase of 8.5% over 2002 and a return on equity of 35.1%.
In terms of assets managed, the average at December 2003 is US$ 323.3 million, a fall of 17.0% with
respect to the year before and representing a market share of 3.8% (4.84% in 2002) and 7th place out of
the 17 managers operating in the market. The good yields obtained on the different funds managed gave
the 10,453 participants growth of 17.4%, above the industry average.
It is also notable that Administradora General de Fondos Security had attracted assets under the
Voluntary Pensions Savings scheme at November of close to US$ 5.5 million, almost 12% of the total
managed by mutual funds.
Changes in total assets managed by the mutual funds industry and the market share of Administrado-
ra General de Fondos Security over the last 7 years are shown in the following table:
Financial Statements of Banco Security 29
Consolidated Financial Statements of Banco Security and Subsidiaries 53
Summarized Financial Statements of the Subsidiaries 77
Financial Statements
Banco Security Annual Report I 27
8.

Contents
Balance Sheets 30
Statements of Income 32
Statements of Cash Flows 33
Notes to the Financial Statements 34
Report of the Independent Accountants 51
ThCh$ = Thousands of Chilean pesos
MCh$ = Millions of Chilean pesos
UF = Unidad de Fomento (an official inflation-indexed monetary unit)
US$ = United States dollars
ThUS$ = Thousands of US dollars
Financial Statements of Banco SecurityAt December 31, 2003 and 2002, including the Report of the Independent Accountants
Banco Security Annual Report 2003 I 29

The accompanying notes form are an integral part of these financial statements
2003 2002
Assets MCh$ MCh$
Liquid Assets 84,979.3 94,520.4
Loans:
Commercial 619,717.4 572,659.6
Foreign trade 77,685.7 91,558.4
Consumer 7,266.6 5,721.4
Mortgage 96,693.3 50,342.9
Leasing contracts 62,637.6 55,215.7
Contingent 44,525.2 47,338.8
Other outstanding loans 43,618.5 34,188.1
Past-due 9,038.8 7,764.4
Total Loans 961,183.1 864,789.3
Less: allowance for loan losses (11,960.8) (10,711.2)
Total loans-net 949,222.3 854,078.1
Other loan operations:
Loans to financial institutions – 3,622.6
Securities trading 882.3 –
Total other loan operations 882.3 3,622.6
Investments:
Banco Central de Chile and Treasury Securities 348.6 10,216.8
Other financial investments 95,484.0 122,181.3
Trading securities 11,366.2 3,611.1
Assets for leasing 5,431.0 2,536.0
Assets received in settlement or adjudicated 3,550.0 4,693.7
Total investments 116,179.8 143,238.9
Other assets 15,853.8 18,998.0
Fixed assets:
Premises and equipment 14,645.8 11,927.1
Investments in related companies 12,604.2 9,080.6
Total fixed assets 27,250.0 21,007.7
Total assets 1,194,367.5 1,135,465.7
30 I Banco Security Annual Report 2003
(In millions of Chilean pesos - MCh$)
Balance Sheets as of December 31, 2003 and 2002

The accompanying notes form are an integral part of these financial statements
2003 2002
Liabilities and Shareholders’ Equity MCh$ MCh$
Liabilities:
Deposits and other obligations:
Checking accounts 57,853.2 51,185.0
Time and demand deposits 665,658.0 635,251.0
Other demand and term liabilities 44,894.6 73,980.0
Liabilities arising from trading securities 10,908.1 3,376.0
Mortgage notes 100,636.2 50,460.0
Contingent liabilities 45,031.7 48,178.0
Total deposits and other liabilities 924,981.8 862,430.0
Bonds:
Ordinary bonds 9,489.1 10,633.4
Subordinated bonds 35,813.1 36,381.1
Total bonds 45,302.2 47,014.5
Borrowings from financial institutions and Banco Central de Chile:
Other obligations with Banco Central de Chile 446.6 667.3
Domestic borrowings 3,109.4 784.2
Foreign borrowings 92,643.2 89,442.3
Other borrowings 20,753.1 17,411.1
Total borrowings from financial institutions 116,952.3 108,304.9
Other liabilities 13,199.4 28,851.9
Total liabilities 1,100,435.7 1,046,601.3
Shareholders’ equity:
Capital and reserves 77,790.5 76,800.8
Other equity accounts 2,815.2 1,894.3
Net income for the year 13,326.1 10,169.3
Total shareholders’ equity 93,931.8 88,864.4
Total liabilities and shareholders’ equity 1,194,367.5 1,135,465.7
Banco Security Annual Report 2003 I 31

The accompanying notes form are an integral part of these financial statements
(In millions of Chilean pesos - MCh$)
Statements of Income for the years ended December 31, 2003 and 2002
2003 2002
MCh$ MCh$
Operating revenues:
Interest and indexation income 56,841.6 78,604.5
Gain from trading securities 1,894.0 3,176.2
Commission income 3,795.1 2,475.9
Exchange income-net 5,266.3 –
Other operating income 1,363.9 755.4
Total operating revenue 69,160.9 85,012.0
Less:
Interest and indexation expense (26,969.3) (45,793.6)
Loss from trading securities (874.1) (1,810.6)
Commission expense (223.4) (44.4)
Exchange loss-net – (277.3)
Other operating expenses (1,296.5) (325.3)
Operating margin 39,797.6 36,760.8
Remuneration and personnel expenses (8,957.6) (7,759.7)
Administrative and other expenses (9,262.9) (9,173.6)
Depreciation and amortization (2,111.6) (2,115.0)
Net operating margin 19,465.5 17,712.5
Provisions for assets at risk (6,551.2) (7,635.1)
Recovery of written off loans 368.3 241.9
Operating income 13,282.6 10,319.3
Other income (expense)
Non-operating income 1,188.5 1,653.0
Non-operating expenses (1,608.1) (1,745.3)
Equity in income of related companies 3,524.3 3,090.8
Monetary correction (502.7) (1,621.7)
Income before income tax 15,884.6 11,696.1
Income taxes (2,558.5) (1,526.8)
Income after income taxes 13,326.1 10,169.3
Net income for the year 13,326.1 10,169.3
32 I Banco Security Annual Report 2003

The accompanying notes form are an integral part of these financial statements
(In millions of Chilean pesos - MCh$)
Statements of Cash flows for the years ended December 31, 2003 and 2002
2003 2002
MCh$ MCh$
Cash flows from operating activities:
Net income for the year 13,326.1 10,169.3
Charges (Credits) to income that do not representing cash flows:
Depreciation and amortization 2,111.6 2,115.0
Provisions for assets at risk 6,551.2 7,635.1
Equity in income of related companies (3,524.3) (3,090.8)
Monetary correction 502.7 1,621.7
Other (Credits) charges to income that do not represent cash flows (990.6) 2,098.5
Net change in interest, indexation and commissions accrued
on assets and liabilities 1,764.5 (1,146.4)
Net cash provided by operating activities 19,741.2 19,402.4
Cash flows from investing activities:
Changes in assets affecting cash flows:
Net increase in loans (110,120.7) (95,261.2)
Net decrease in other loan operations 3,566.9 4,528.1
Decrease (Increase) in investments 28,487.8 (10,103.6)
(Increase) Decrease in leased assets (2,935.0) 158.9
Purchases of fixed assets (4,830.3) (2,321.7)
Sales of investments in related companies – 466.9
Sale of assets received in settlement of loans 2,232.8 5,667.2
Net (Increase) decrease in other assets and liabilities (12,570.8) 6,799.5
Net cash used in investing activities (96,169.3) (90,065.9)
Cash flows from financing activities:
Increase in checking accounts 6,701.0 1,449.4
Increase in time and demand deposits 35,538.1 95,159.0
(Decrease) Increase in other term and demand liabilities (29,230.8) 13,802.2
Increase (Decrease) in other liabilities arising from trading activities 7,583.9 (29,679.7)
Increase in short-term foreign borrowings 3,110.8 6,849.8
Mortgage notes issued 47,920.5 17,989.8
Bonds issued (1,712.3) (2,553.0)
Long-term bank loans obtained – 14,383.0
Payment of long-term loans – (31,823.0)
Increase in other short-term liabilities 5,526.9 –
Dividends paid (9,061.7) (9,137.7)
Net cash provided by financing activities 66,376.4 76,439.8
Net (Negative) positive cash flow for the year (10,051.7) 5,776.3
Effect of inflation on cash and cash equivalents 510.6 1,249.8
Net increase (decrease) in cash and cash equivalents during the year (9,541.1) 7,026.1
Cash and cash equivalents at beginning of the year 94,520.4 87,494.3
Cash and cash equivalents at end of year 84,979.3 94,520.4
Banco Security Annual Report 2003 I 33
NOTE1. SUMMARY OF SIGNIFICANT ACCOUNTING POLICIES
a. Information provided
The financial statements have been prepared in accordance with accounting regulations issued by the
Superintendence of Banks and Financial Institutions (hereinafter, the Superintendence). Such regulations concur with
generally accepted accounting principles in Chile, except for the investments in subsidiaries, which are recorded in one
line on the balance sheet using the equity method of accounting, and therefore have not been consolidated on a line by
line basis. This treatment does not modify the net income for the year or the shareholders’ equity.
These financial statements have been issued solely for the purpose of making a stand - alone individual analysis
of the Bank, and accordingly, should be read in conjunction with the consolidated financial statements.
The 2002 Chilean peso amounts have been price level restated for changes in the Consumer Price Index (CPI)
used for monetary correction (1.0%).
b. Interest and indexation
The amounts recorded in the balance sheet for loans, investments, and liabilities include interest and indexation
accrued until year end. However, the Bank has taken the conservative position of discontinuing the accrual of interest
and indexation on high-risk and past-due loans.
c. Monetary correction
Shareholders’ equity, fixed assets, and other non-monetary assets and liabilities have been monetarily corrected
on the basis of variations in the Chilean Consumer Price Index (IPC). The applications of monetary correction resulted
in a net charge to income of MCh$502.7 in 2003 (MCh$1,621.7 in 2002).
The income statements of the Bank are not monetarily corrected.
d. Foreign Currency
Assets and liabilities denominated in foreign currency are stated in Chilean pesos at the exchange rate prevailing
at year-end (Ch$599.42 per US$1 in 2003 and Ch$712.38 per US$1 in 2002).
The net gain from exchange loss and income of MCh$5,266.3 (net loss of MCh$277.3 in 2002) shown in the
income statement includes the net gains and losses on foreign exchange transactions, as well as the recognition of the
effects of exchange rate variations on net assets or liabilities denominated in foreign currency.
e. Conversion
Assets and liabilities denominated in Unidades de Fomento (inflation index-linked units of account) are stated
at the following year-end rates: $16,920.00 in 2003 and $16,744.12 in 2002.
f. Financial investments
The financial investments that are traded in the secondary market are stated at market value, in accordance
with instructions of the Superintendence. These instructions call for recognition of adjustments to market value against
income for the year, unless permanent investments are involved, in which case, under certain limitations, the
(In millions of Chilean pesos - MCh$)
Notes to the Financial Statements
34 I Banco Security Annual Report 2003

aforementioned adjustments can be made directly against the “Fluctuation in value of financial investments” in the
shareholders’ equity accounts.
The application of the adjustment to permanent portfolio resulted in a net credit of MCh$939.7 (MCh$314.5 in
2002) to equity.
Other financial investments are stated at cost plus accrued interest and indexation.
g. Premises and equipment
Premises and equipment are valued at monetarily corrected cost and shown net of accumulated depreciation.
Depreciation is calculated using the straight-line method over the useful lives of the assets.
h. Investments in related companies
The shares or rights in related companies in which the Bank has ownership equal to, or greater than, 10%, or in
which it can elect or appoint at least one of the members of the Board or management, are recorded in assets using the
equity method of accounting.
i. Provisions for assets at risk
The Bank has established all the provisions that are required to cover the risk of loss on assets, in accordance
with the standards issued by the Superintendence. The assets are shown net of such provisions or in the case of loans,
as a deduction therefrom.
j. Voluntary provisions
In accordance with the General Banking Law, financial institutions are allowed to establish voluntary provisions,
which can be computed as capital, for complying with capital several requirements contained in that Law. The provisions
recorded at year-end and their effects on net income are presented in the balance sheet and statement of income.
k. Deferred taxes
The effects of deferred taxes arising from temporary differences between the tax and the book basis are recorded
on an accrual basis in conformity with Technical Bulletin N¡ 60 of the Chilean Institute of Certified Public Accounts and
its supplements, and the Superintendence’s instructions.
l. Employee vacation
The annual cost of employee vacations and benefits is recorded on the accrual basis.
m. Cash and cash equivalents
For purposes of the statement of cash flows, cash and cash equivalents include the balance of “Liquid Assets”, in
accordance with the rules established in Chapter 18-1 of the Superintendence’s compendium of regulations.
Banco Security Annual Report 2003 I 35

NOTE 2. TRANSACTIONS WITH RELATED PARTIES
In accordance with the General Banking Law in Chile and the Superintendence’s instructions, individuals and
companies that are related, directly or indirectly, to the Bank’s owners or management are considered related parties.
a. Loans to related parties
At December 31, 2003 and 2002, loans to related parties are as follows:
Current portfolio Past due portfolio Total Collateral (*)
2003 2002 2003 2002 2003 2002 2003 2002
MCh$ MCh$ MCh$ MCh$ MCh$ MCh$ MCh$ MCh$
Individuals 3,719.3 90.9 – – 3,719.3 90.9 3,219.2 516.6
Operating companies 28,934.4 17,178.2 – 14.0 28,934.4 17,192.2 16,795.0 10,929.3
Investment companies 17,385.0 6,524.9 – – 17,385.0 6,524.9 4,455.3 4,026.1
Totals 50,038.7 23,794.0 – 14.0 50,038.7 23,808.0 24,469.5 15,472.0
(*) Includes only those guarantees that are admitted by Article 84 of the General Banking Law for purposes of establishing the individual credit limits defined bythe Law. The guarantees are valued in accordance with the Superintendence’s instructions.
Notes to the Financial Statements
36 I Banco Security Annual Report 2003

b. Other transactions with related parties
During 2003 and 2002, the Bank entered into the following transactions in excess of UF1,000 with related
parties:
Credit Debit
to income to income
2003 2002 2003 2002
Company Description MCh$ MCh$ MCh$ MCh$
Invest Security S.A. Advisory services – – 683.3 757.5
Seguros de Vida Security Previsión S.A. Office rentals 20.0 16.9 – –
Seguros Security Previsión Generales S.A. Office rentals 10.1 6.0 – –
Asesorías Security S.A. Office rentals – 23.1 – –
Global Security S.A. Advisory services – – 521.7 523.7
Virtual Security S.A. Advisory services – – 1,679.1 1,821.2
Inmobiliaria Security S.A. Advisory services – – 180.5 –
Factoring Security S.A. Advisory services – – 33.6 –
The Bank has a price balance and progress billing for MCh$4,805.1 (MCh$1,176.2 in 2002) with Inmobiliaria
Security S.A., maturing in 2004.
These transactions were realized on prevailing market terms.
NOTE 3. INVESTMENTS IN RELATED COMPANIES
Participation in the companies
Under the heading of fixed assets, there are investments in affiliates amounting to MCh$12,604.2 (MCh$9,080.6 in
2002), the detail of which is as follows:
Owner ship Investment
Company interest Equity value Income
2003 2002 2003 2002 2003 2002 2003 2002
% % MCh$ MCh$ MCh$ MCh$ MCh$ MCh$
Valores Security S.A.
Corredores de Bolsa 99.900 99.900 8,198.8 5,797.7 8,190.6 5,791.8 2,398.8 2,053.8
Administradora General
de Fondos Security S.A. 99.990 99.990 4,336.5 3,210.8 4,336.1 3,208.7 1,125.5 1,037.0
Sub total 12,526.7 9,000.5 3,524.3 3,090.8
Shares and rights
in other companies 77.5 80.1 – –
Total 12,604.2 9,080.6 3,524.3 3,090.8
Banco Security Annual Report 2003 I 37

NOTE 4. ALLOWANCES
a. Allowances for assets at risk
At December 31, 2003, the Bank has accrued allowances for a total of MCh$12,388.8 (MCh$10,905.1 in 2002)
which correspond to the minimum allowances required by the Superintendence to cover possible losses.
During each year, the changes in the allowances are as follows:
Allowances for
Assets
received in Other
Loans settlement assets Total
MCh$ MCh$ MCh$ MCh$
Historical balances, December 31, 2001 7,575.3 30.7 601.0 8,207.0
Provisions applied (4,529.6) (30.7) (409.0) (4,969.3)
Provisions established 7,559.5 – – 7,559.5
Balances, December 31, 2002 10,605.2 – 192.0 10,797.2
Updated balances for comparative purposes 10,711.2 – 193.9 10,905.1
Historical balances, December 31, 2002 10,605.2 – 192.0 10,797.2
Provisions applied (4,959.6) – – (4,959.6)
Provisions established 6,315.2 – 236.0 6,551.2
Balances, December 31, 2003 11,960.8 – 428.0 12,388.8
In the opinion of the Bank’s Board, the allowances established cover all possible losses that might result from
non-recovery of assets, based on the information examined by the Bank.
b. Voluntary provision
The Bank does not have voluntary reserves at December 31, 2003 and 2002.
Notes to the Financial Statements
38 I Banco Security Annual Report 2003
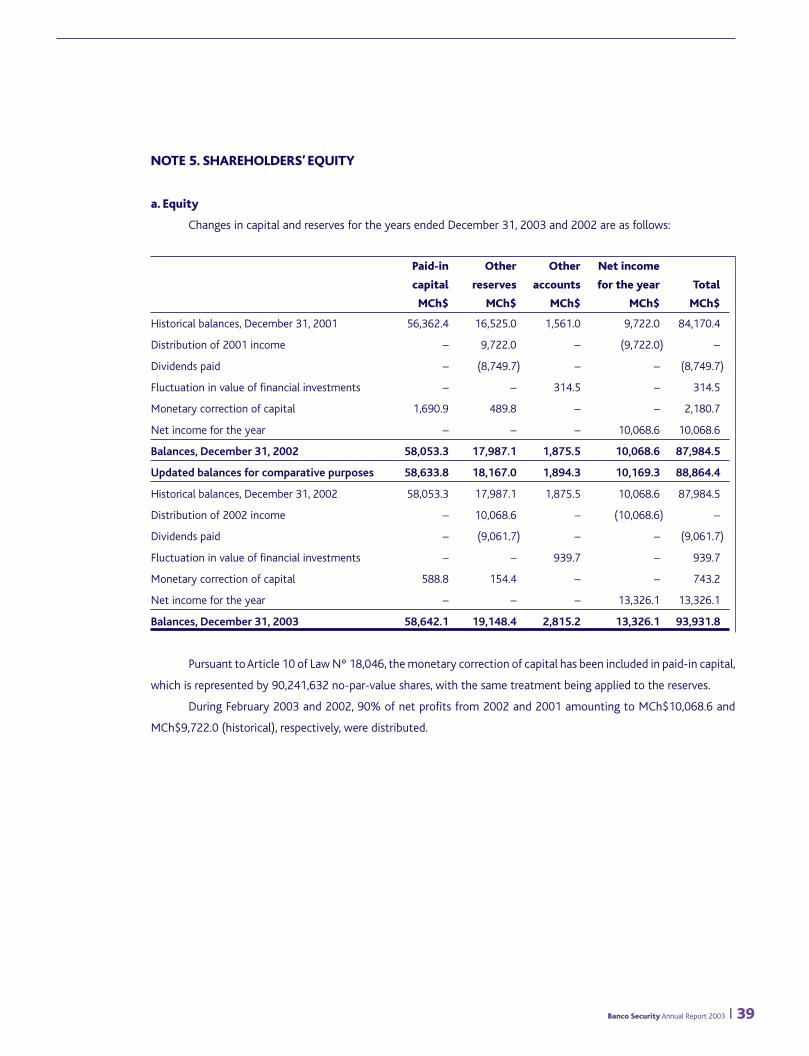
NOTE 5. SHAREHOLDERS’ EQUITY
a. Equity
Changes in capital and reserves for the years ended December 31, 2003 and 2002 are as follows:
Paid-in Other Other Net income
capital reserves accounts for the year Total
MCh$ MCh$ MCh$ MCh$ MCh$
Historical balances, December 31, 2001 56,362.4 16,525.0 1,561.0 9,722.0 84,170.4
Distribution of 2001 income – 9,722.0 – (9,722.0) –
Dividends paid – (8,749.7) – – (8,749.7)
Fluctuation in value of financial investments – – 314.5 – 314.5
Monetary correction of capital 1,690.9 489.8 – – 2,180.7
Net income for the year – – – 10,068.6 10,068.6
Balances, December 31, 2002 58,053.3 17,987.1 1,875.5 10,068.6 87,984.5
Updated balances for comparative purposes 58,633.8 18,167.0 1,894.3 10,169.3 88,864.4
Historical balances, December 31, 2002 58,053.3 17,987.1 1,875.5 10,068.6 87,984.5
Distribution of 2002 income – 10,068.6 – (10,068.6) –
Dividends paid – (9,061.7) – – (9,061.7)
Fluctuation in value of financial investments – – 939.7 – 939.7
Monetary correction of capital 588.8 154.4 – – 743.2
Net income for the year – – – 13,326.1 13,326.1
Balances, December 31, 2003 58,642.1 19,148.4 2,815.2 13,326.1 93,931.8
Pursuant to Article 10 of Law Nº 18,046, the monetary correction of capital has been included in paid-in capital,
which is represented by 90,241,632 no-par-value shares, with the same treatment being applied to the reserves.
During February 2003 and 2002, 90% of net profits from 2002 and 2001 amounting to MCh$10,068.6 and
MCh$9,722.0 (historical), respectively, were distributed.
Banco Security Annual Report 2003 I 39

b. Minimum basic capital and effective equity
According to the General Banking Law, a financial institution’s minimum basic capital may not be lower than
3% of its total assets, while the effective equity may not be lower than 8% of its risk weighted assets. At each year-end,
the Bank’s situation is as follows:
At December 31,
2003 2002
MCh$ MCh$
Basic capital (*) 80,605.7 78,695.1
Total assets 1,240,642.0 1,167,402.3
Percentages 6.50% 6.74%
Effective equity (**) 112,580.0 111,365.9
Risk weighted assets 1,007,614.0 959,091.3
Percentages 11.17% 11.61%
(*) For these purposes, equivalent to paid-in capital and reserves.(**) Pursuant to Article 66 of the General Banking Law, in order to determine effective shareholders’ equity, amounts corresponding to investments in companies
and capital assigned to foreign branches must be deducted, whereas subordinated bonds and voluntary provisions, up to certain limits, should be included.
Notes to the Financial Statements
40 I Banco Security Annual Report 2003

NOTE 6. INVESTMENTS
At December 31, 2003 and 2002, the Bank had the following balances included under investments:
a. Financial Investments
At December 31, 2003
(*) Classification according to issuers or those obliged to pay. The abovementioned amounts include MCh$11,366.2 (MCh$3,611.1 in 2002) for securities soldunder repurchase agreements.
(**) Permanent portfolio include securities whose adjustment to market value is charged to the “Fluctuation in value of financial investments” account, asdescribed in Note 1f.
b. Other investments
2003 2002
ThCh$ ThCh$
Assets for leasing 5,431.0 2,536.0
Assets received in settlement or adjudicated (*) 3,550.0 4,693.7
Totals 8,981.0 7,229.7
(*) The amount shown on the balance sheet represents the estimated realizable value of these assets taken as a whole.
In addition to those assets received in settlement of loans that are recorded as assets, none exist that had been
written-off and have yet to be sold.
Banco Security Annual Report 2003 I 41
Type of portfolio Adjustments to market value
Non- Credit (Charge) Credit (Charge)
Permanent (**) permanent Sub total to income to equity Total
2003 2002 2003 2002 2003 2002 2003 2002 2003 2002 2003 2002
MCh$ MCh$ MCh$ MCh$ MCh$ MCh$ MCh$ MCh$ MCh$ MCh$ MCh$ MCh$
Securities (*)
Banco Central de Chile 150.2 179.8 11,099.3 13,382.5 11,249.5 13,562.3 251.2 390.6 6.9 9.3 11,507.6 13,962.2
Local financial institutions 7,849.6 5,259.4 45,837.7 30,383.9 53,687.3 35,643.3 539.9 108.0 255.9 276.5 54,483.1 36,027.8
Other investments in Chile 3,387.0 1,584.4 8,198.5 34,121.1 11,585.5 35,705.5 280.1 244.4 59.2 (96.7) 11,924.8 35,853.2
Investments abroad 19,914.6 37,514.3 2,808.3 10,946.5 22,722.9 48,460.8 331.2 – 2,493.2 1,705.2 25,547.3 50,166.0
Mortgage notes issued – – 3,698.3 – 3,698.3 – 37.7 – – – 3,736.0 –
Total 31,301.4 44,537.9 71,642.1 88,834.0 102,943.5 133,371.9 1,440.1 743.0 2,815.2 1,894.3 107,198.8 136,009.2

NOTE 7. MATURITIES OF ASSETS AND LIABILITIES
a. Maturities of loans and financial investments
The following is a breakdown of loans and financial investments at December 31, 2003 and 2002, classified
through their maturity. Balances include accrued interest at year-end.
(1) Considers only those loans outstanding at year-end that fall due within the indicated periods. Consequently, excluded are contingent loans and loanstransferred to the past-due portfolio, as well as delinquent debts that have not been transferred to the past-due portfolio amounting to MCh$1,984.9(MCh$1,813.5 in 2002), of which MCh$696.2 (MCh$595.9 in 2002) have been delinquent less than 30 days.
(2) Includes securities classified as permanent investments, as described in Note 1f, without considering adjustments to market value, and non-transferable notes.(3) Includes all other financial investments, with their respective adjustment at market value.
Due within More than 1 year More than 3 year More than
one year but up to 3 years but within 6 years 6 years Total
2003 2002 2003 2002 2003 2002 2003 2002 2003 2002
MCh$ MCh$ MCh$ MCh$ MCh$ MCh$ MCh$ MCh$ MCh$ MCh$
Loans (1):
Commercial and other 473,619.5 453,344.6 92,099.6 75,822.9 107,889.5 104,329.5 128,065.7 118,311.3 801,674.3 751,808.3
Mortgage – – 220.3 183.9 2,117.3 832.3 94,355.7 49,326.7 96,693.3 50,342.9
Consumer 2,023.4 1,306.7 3,367.9 2,839.5 1,033.6 1,045.0 841.7 530.2 7,266.6 5,721.4
Other lending operations:
Loans to other financial
institutions – 3,622.6 – – – – – – – 3,622.6
Credits arising from
trading securities 882.3 – – – – – – – 882.3 –
Financial investments:
Permanent portfolio (2) 386.1 11,116.4 10,588.0 3,463.8 2,568.0 15,563.8 17,759.3 14,393.9 31,301.4 44,537.9
Non-permanent portfolio (3) 73,082.2 89,577.0 – – – – – – 73,082.2 89,577.0
Notes to the Financial Statements
42 I Banco Security Annual Report 2003

b. Maturities of deposits, borrowings and other financing operations
The information detailed below shows deposits, borrowings and other liabilities through their maturity.
Balances include interest accrued at year-end.
(*) Excludes all sight and contingent obligations.
Due within Over 1 year Over 3 years Over
one year up to 3 years up to 6 years 6 years Total
2003 2002 2003 2002 2003 2002 2003 2002 2003 2002
MCh$ MCh$ MCh$ MCh$ MCh$ MCh$ MCh$ MCh$ MCh$ MCh$
Deposits and other liabilities (*):
Time and demand deposits 620,046.2 559,704.0 37,830.9 63,586.6 7,780.9 11,960.4 – – 665,658.0 635,251.0
Liabilities arising from trading securities 10,908.1 3,376.0 – – – – – – 10,908.1 3,376.0
Mortgage notes – – 224.4 185.2 2,122.5 834.9 98,289.3 49,439.9 100,636.2 50,460.0
Obligations for bonds issued 1,165.4 1,086.1 791.3 385.2 1,968.0 3,407.7 41,377.5 42,135.5 45,302.2 47,014.5
Loans from financial institutions
and Banco Central de Chile:
Other obligations with the
Banco Central de Chile 446.6 – – 667.3 – – – – 446.6 667.3
Loans from local financial institutions 3,109.4681.1 – 103.1 – – – – 3,109.4784.2
Obligations abroad 92,643.2 89,442.3 – – – – – – 92,643.2 89,442.3
Other obligations 779.0 719.9 1,844.1 4,281.7 8,492.9 4,813.1 9,637.1 7,596.4 20,753.1 17,411.1
Banco Security Annual Report 2003 I 43
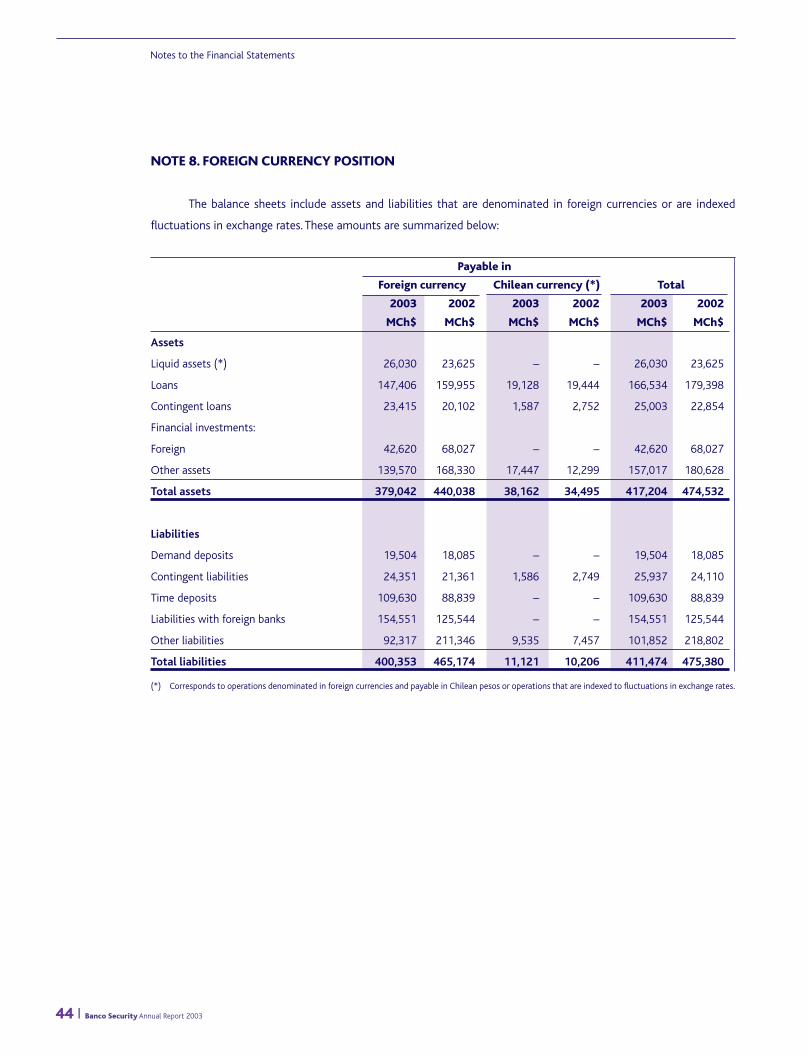
NOTE 8. FOREIGN CURRENCY POSITION
The balance sheets include assets and liabilities that are denominated in foreign currencies or are indexed
fluctuations in exchange rates. These amounts are summarized below:
Payable in
Foreign currency Chilean currency (*) Total
2003 2002 2003 2002 2003 2002
MCh$ MCh$ MCh$ MCh$ MCh$ MCh$
Assets
Liquid assets (*) 26,030 23,625 – – 26,030 23,625
Loans 147,406 159,955 19,128 19,444 166,534 179,398
Contingent loans 23,415 20,102 1,587 2,752 25,003 22,854
Financial investments:
Foreign 42,620 68,027 – – 42,620 68,027
Other assets 139,570 168,330 17,447 12,299 157,017 180,628
Total assets 379,042 440,038 38,162 34,495 417,204 474,532
Liabilities
Demand deposits 19,504 18,085 – – 19,504 18,085
Contingent liabilities 24,351 21,361 1,586 2,749 25,937 24,110
Time deposits 109,630 88,839 – – 109,630 88,839
Liabilities with foreign banks 154,551 125,544 – – 154,551 125,544
Other liabilities 92,317 211,346 9,535 7,457 101,852 218,802
Total liabilities 400,353 465,174 11,121 10,206 411,474 475,380
(*) Corresponds to operations denominated in foreign currencies and payable in Chilean pesos or operations that are indexed to fluctuations in exchange rates.
Notes to the Financial Statements
44 I Banco Security Annual Report 2003

NOTE 9. TRANSACTIONS WITH DERIVATIVE INSTRUMENTS
Transactions for the purchase and sale of foreign currency futures and other derivative products at year-end, are
summarized below:
a. Contracts for the purchase and sale of foreign currency futures, and interest rates:
Amount of the contracts
Number of Up to More than
operations 3 months 3 months
2003 2002 2003 2002 2003 2002
Type of future operation ThUS$ ThUS$ ThUS$ ThUS$
Local market:
Purchase of Chilean peso futures 59 39 69,599.9 37,450.0 51,345.6 93,682.0
Sales of Chilean peso futures 77 75 27,803.1 16,154.4 46,950.0 149,219.5
Sales of fgoreign currency forwards 7 6 3,276.8 6,271.4 634.7 3,367.2
Foreign markets:
Purchase of foreign currency forwards 7 6 3,299.3 6,263.2 525.8 3,360.0
The amount refers to either the US dollar futures bought or sold, or the equivalent in US dollar of foreign
currency futures bought or sold, or the US dollar basis associated with interest rate futures, as appropriate. The terms
correspond to the duration of the contracts from the transaction date.
b. Contracts on the value of “Unidad de Fomento” (Inflation index-linked units of accounts):
Contract amounts
Nº of Up to More than
operations 3 months 3 months
2002 2003 UF UF
Purchase of UF/Chilean peso forwards 4 5 1,200,000 200,000
Banco Security Annual Report 2003 I 45

NOTE 10. CONTINGENCIES, COMMITMENTS AND RESPONSIBILITIES
Commitments and responsibilities accounted for in memorandum accounts - The Bank has recorded the following
balances in memorandum accounts, which are related to commitments or responsibilities related to the business
activity:
2003 2002
MCh$ MCh$
Mortgage and pledge guarantees 628,478.3 498,392.9
Credit lines obtained 205,325.2 245,611.6
Securities and drafts in guarantee 198,868.1 128,004.0
Securities held in custody 440,968.7 62,005.9
Loans approved but not disbursed 54,361.0 44,653.3
Foreign collections 23,172.8 27,263.2
The above summary list includes only the more important balances. Contingent loans and liabilities are stated
on the balance sheet.
NOTE 11. COMMISSION
Commission income and expense shown in the statements of income are as follows:
Income Expenses
2003 2002 2003 2002
MCh$ MCh$ MCh$ MCh$
Commissions earned/paid on:
Collection of documents 418.4 651.3 – –
Letters of credit, guarantees, securities
and other contingent loans 502.3 397.2 – –
Credit cards 347.6 213.1 – –
Lines of credit 126.6 66.6 – –
Loan commissions 1,024.0 389.1 – –
ATM commissions 75.0 – 181.5 36.7
Current accounts 606.1 269.6 – –
Private Banking – 224.8 – –
Others 695.1 264.2 41.9 7.7
Totals 3,795.1 2,475.9 223.4 44.4
The commissions earned on mortgage note transactions are included in “Interest and Indexation Income” in the
statement of income.
Notes to the Financial Statements
46 I Banco Security Annual Report 2003

NOTE 12. NON-OPERATING INCOME
The detail of non-operating income is as follows:
2003 2002
MCh$ MCh$
Sales of fixed asset – 67.5
Recovery of xpenses 632.7 816.9
Rents received 80.7 78.5
Recovery of written-off received in settlement 119.9 47.1
Others 355.2 643.0
Total 1,188.5 1,653.0
NOTE 13. NON-OPERATING EXPENSES
The detail of non-operating expenses is as follows:
2003 2002
MCh$ MCh$
Loss on sale of assets received in settlement 631.2 696.7
Write-off of assets received in settlements 416.8 725.0
Loss on assets recovered in leasing 551.0 309.7
Others 9.1 13.9
Total 1,608.1 1,745.3
NOTE 14. INCOME TAX
The Bank has recorded a provision for First Category Income Tax of MCh$2,558.5 (MCh$1,526.8 in 2002).
Banco Security Annual Report 2003 I 47

NOTE 15. DEFERRED TAXES
As explained in Note 1k, the Bank has applied the accounting criteria of Technical Bulletin N¡60 of the Chilean
Institute of Certified Public Accountants and its supplements.
The deferred taxes on temporary differences are presented below:
2003: Balance at
January 1, December 31,
2003 2003
(historical)
Item MCh$ MCh$
Debtor differences:
Loan portfolio, global provision 1,015.8 1,203.9
Provision for assets recovered 28.1 24.6
Provision for leasing contracts 101.9 103.3
Leased taxable assets 6,758.3 8,901.8
Adjustment of non-permanent investments to market 133.9 119.8
Written-off assets received in settlement 308.6 70.9
Others 20.5 205.3
Sub total 8,367.1 10,629.6
Complementary account (3,714.7) (3,608.4)
Net difference 4,652.4 7,021.2
Credit differences:
Leasing contracts (9,020.4) (10,648.4)
Depreciation of fixed assets (560.6) (569.0)
Others (48.4) (59.6)
Sub total (9,629.4) (11,277.0)
Complementary accounts 5,962.0 5,628.0
Net difference (3,667.4) (5,649.0)
Notes to the Financial Statements
48 I Banco Security Annual Report 2003
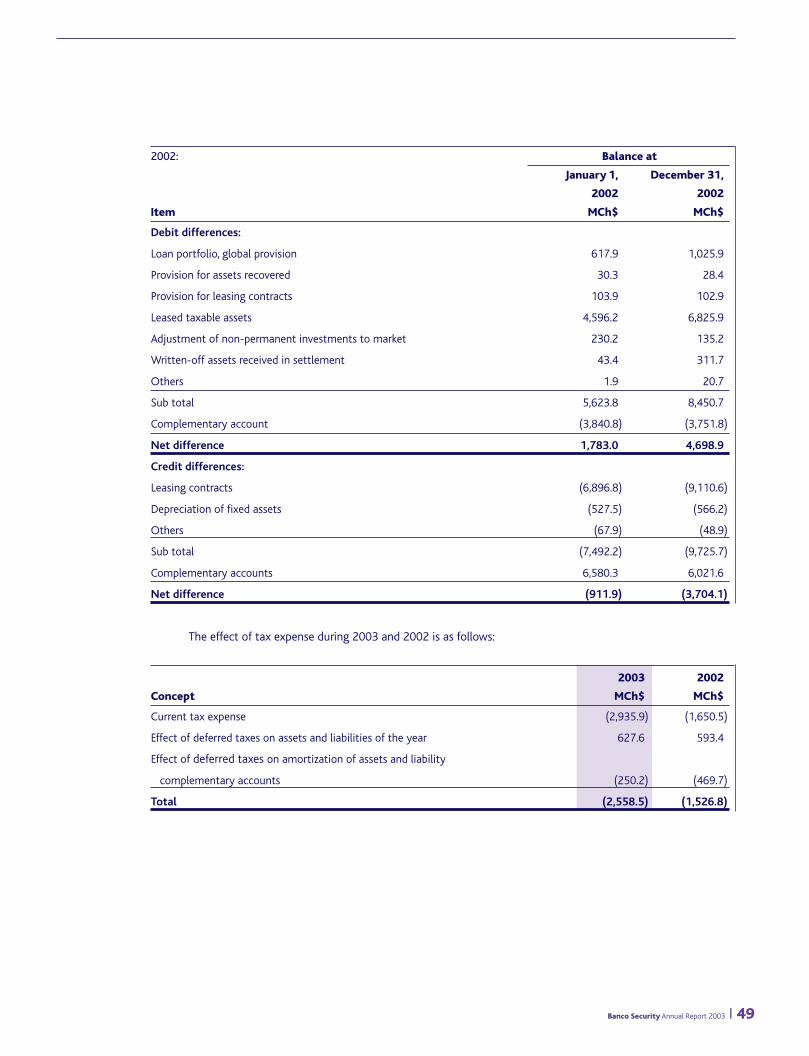
2002: Balance at
January 1, December 31,
2002 2002
Item MCh$ MCh$
Debit differences:
Loan portfolio, global provision 617.9 1,025.9
Provision for assets recovered 30.3 28.4
Provision for leasing contracts 103.9 102.9
Leased taxable assets 4,596.2 6,825.9
Adjustment of non-permanent investments to market 230.2 135.2
Written-off assets received in settlement 43.4 311.7
Others 1.9 20.7
Sub total 5,623.8 8,450.7
Complementary account (3,840.8) (3,751.8)
Net difference 1,783.0 4,698.9
Credit differences:
Leasing contracts (6,896.8) (9,110.6)
Depreciation of fixed assets (527.5) (566.2)
Others (67.9) (48.9)
Sub total (7,492.2) (9,725.7)
Complementary accounts 6,580.3 6,021.6
Net difference (911.9) (3,704.1)
The effect of tax expense during 2003 and 2002 is as follows:
2003 2002
Concept MCh$ MCh$
Current tax expense (2,935.9) (1,650.5)
Effect of deferred taxes on assets and liabilities of the year 627.6 593.4
Effect of deferred taxes on amortization of assets and liability
complementary accounts (250.2) (469.7)
Total (2,558.5) (1,526.8)
Banco Security Annual Report 2003 I 49
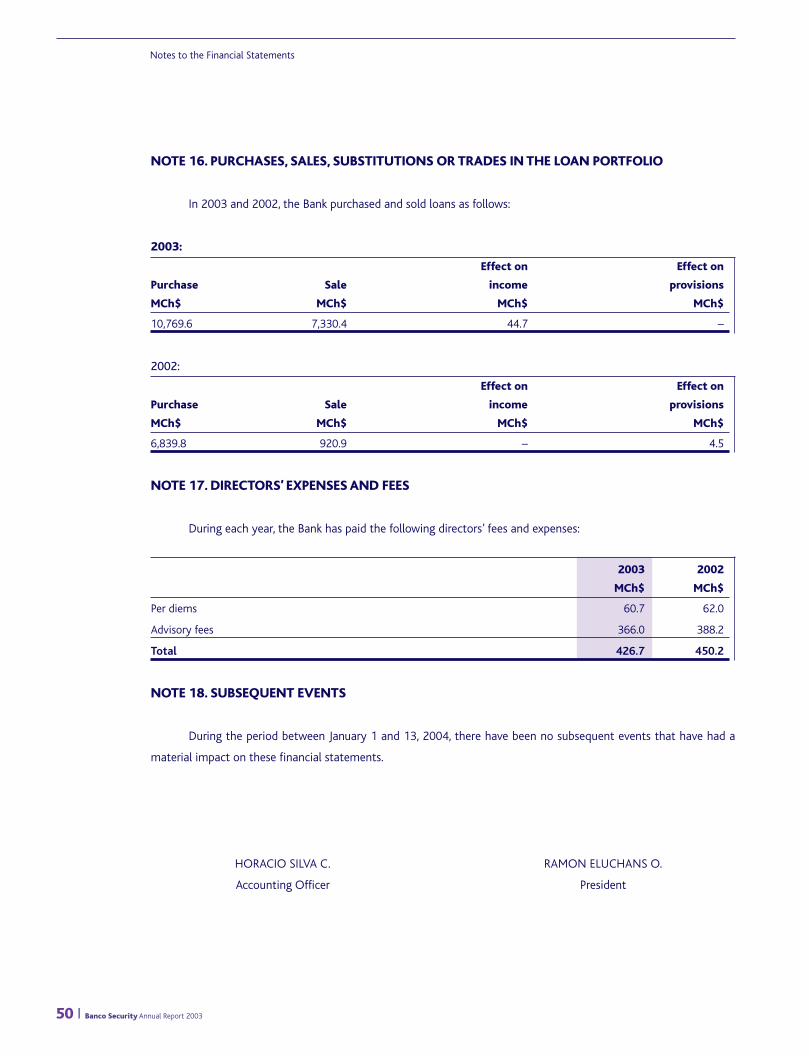
Notes to the Financial Statements
NOTE 16. PURCHASES, SALES, SUBSTITUTIONS OR TRADES IN THE LOAN PORTFOLIO
In 2003 and 2002, the Bank purchased and sold loans as follows:
2003:
Effect on Effect on
Purchase Sale income provisions
MCh$ MCh$ MCh$ MCh$
10,769.6 7,330.4 44.7 –
2002:
Effect on Effect on
Purchase Sale income provisions
MCh$ MCh$ MCh$ MCh$
6,839.8 920.9 – 4.5
NOTE 17. DIRECTORS’ EXPENSES AND FEES
During each year, the Bank has paid the following directors’ fees and expenses:
2003 2002
MCh$ MCh$
Per diems 60.7 62.0
Advisory fees 366.0 388.2
Total 426.7 450.2
NOTE 18. SUBSEQUENT EVENTS
During the period between January 1 and 13, 2004, there have been no subsequent events that have had a
material impact on these financial statements.
HORACIO SILVA C. RAMON ELUCHANS O.
Accounting Officer President
50 I Banco Security Annual Report 2003
To the Shareholders of
Banco Security
We have audited the balance sheets of Banco Security as of December 31, 2003 and 2002, and the related statements
of income and of cash flows for the years then ended. These financial statements (including the related notes) are the
responsibility of the Bank’s management. Our responsibility is to express an opinion on these financial statements
based on our audits.
We conducted our audits in accordance with auditing standards generally accepted in Chile. Those standards require
that we plan and perform the audit to obtain reasonable assurance about whether the financial statements are free of
material misstatement. An audit includes examining, on a test basis, evidence supporting the amounts and disclosures
in the financial statements. An audit also includes assessing the accounting principles used and significant estimates
made by the Bank’s management, as well as evaluating the overall presentation of the financial statements. We believe
that our audits provide a reasonable basis for our opinion.
The present financial statements have been prepared to reflect the stand - alone financial position of Banco Security,
on the basis of the criteria described in Note 1 to the financial statements, before consolidating the financial statements
of the subsidiaries detailed in Note 3 to the financial statements. Therefore, in order for these stand - alone financial
statement to be fully understood, they should be red analyzed in conjunction with the consolidated financial statements
of Banco Security and subsidiaries, which are required by accounting principles generally accepted in Chile.
In our opinion, such stand - alone financial statements present fairly, in all material respects, the financial position of
Banco Security as of December 31, 2003 and 2002 and the results of its operations and its cash flows for the years then
ended , in conformity with the basis of accounting described in Note 1 to the financial statements.
The translation of the financial statements into English has been made solely for the convenience of readers outside
Chile.
January 13, 2004
Independent Auditors’ Report
Banco Security Annual Report 2003 I 51
Deloitte & Touche
Sociedad de Auditores y Consultores Ltda.
RUT: 80.276.200-3
Av. Providencia 1760
Pisos 6, 7, 8 y 9
Providencia, Santiago
Chile
Fono: (56-2) 270 3000
Fax: (56-2) 374 9177
e-mail: [email protected]
www.deloitte.cl


Contents
Balance Sheets 54
Statements of Income 56
Statements of Cash Flows 57
Notes to the Financial Statements 58
Report of the Independent Accountants 75
ThCh$ = Thousands of Chilean pesos
MCh$ = Millions of Chilean pesos
UF = Unidad de Fomento (an official inflation-indexed monetary unit)
US$ = United States dollars
ThUS$ = Thousands of US dollars
At December 31, 2003 and 2002, including the Report of the Independent Accountants
Consolidated Financial Statements of Banco Security and Subsidiaries
Banco Security Annual Report 2003 I 53
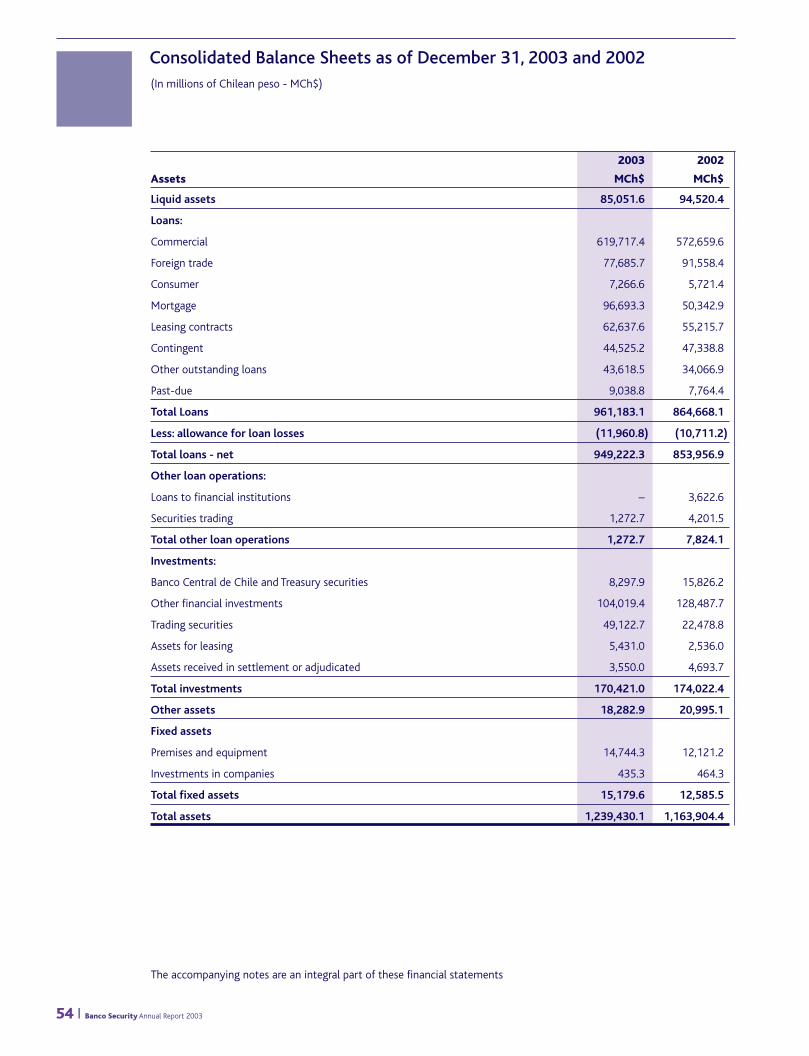
2003 2002
Assets MCh$ MCh$
Liquid assets 85,051.6 94,520.4
Loans:
Commercial 619,717.4 572,659.6
Foreign trade 77,685.7 91,558.4
Consumer 7,266.6 5,721.4
Mortgage 96,693.3 50,342.9
Leasing contracts 62,637.6 55,215.7
Contingent 44,525.2 47,338.8
Other outstanding loans 43,618.5 34,066.9
Past-due 9,038.8 7,764.4
Total Loans 961,183.1 864,668.1
Less: allowance for loan losses (11,960.8) (10,711.2)
Total loans - net 949,222.3 853,956.9
Other loan operations:
Loans to financial institutions – 3,622.6
Securities trading 1,272.7 4,201.5
Total other loan operations 1,272.7 7,824.1
Investments:
Banco Central de Chile and Treasury securities 8,297.9 15,826.2
Other financial investments 104,019.4 128,487.7
Trading securities 49,122.7 22,478.8
Assets for leasing 5,431.0 2,536.0
Assets received in settlement or adjudicated 3,550.0 4,693.7
Total investments 170,421.0 174,022.4
Other assets 18,282.9 20,995.1
Fixed assets
Premises and equipment 14,744.3 12,121.2
Investments in companies 435.3 464.3
Total fixed assets 15,179.6 12,585.5
Total assets 1,239,430.1 1,163,904.4
(In millions of Chilean peso - MCh$)
Consolidated Balance Sheets as of December 31, 2003 and 2002
The accompanying notes are an integral part of these financial statements
54 I Banco Security Annual Report 2003
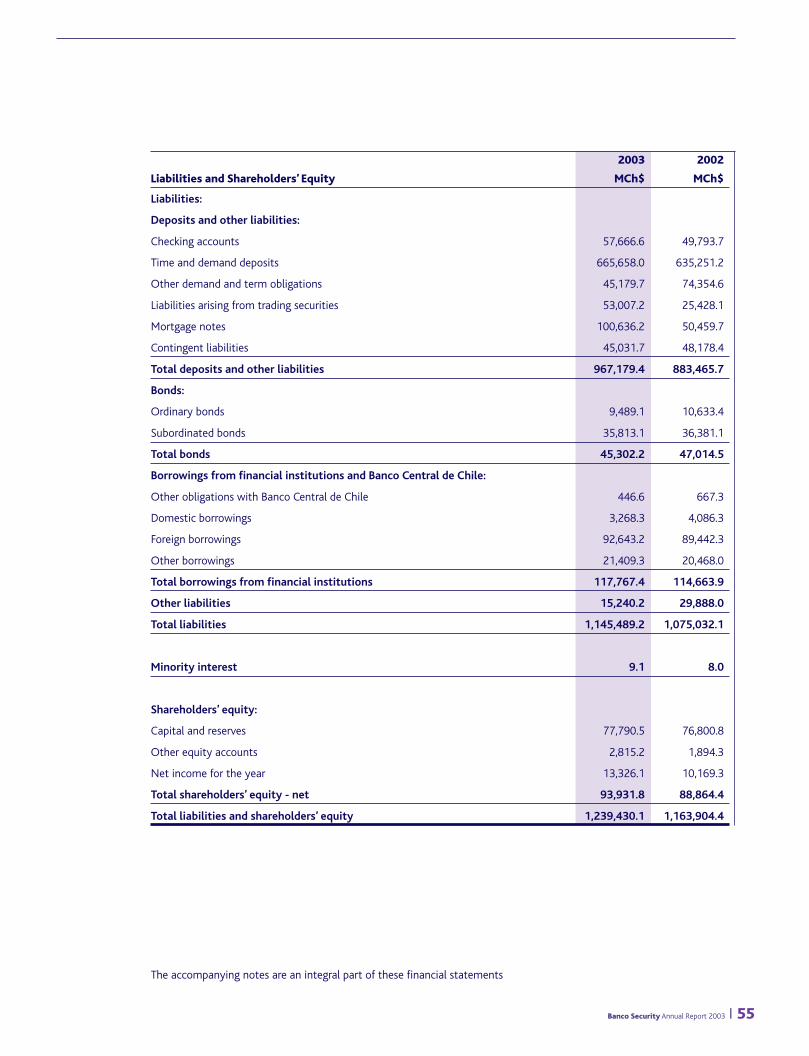
2003 2002
Liabilities and Shareholders’ Equity MCh$ MCh$
Liabilities:
Deposits and other liabilities:
Checking accounts 57,666.6 49,793.7
Time and demand deposits 665,658.0 635,251.2
Other demand and term obligations 45,179.7 74,354.6
Liabilities arising from trading securities 53,007.2 25,428.1
Mortgage notes 100,636.2 50,459.7
Contingent liabilities 45,031.7 48,178.4
Total deposits and other liabilities 967,179.4 883,465.7
Bonds:
Ordinary bonds 9,489.1 10,633.4
Subordinated bonds 35,813.1 36,381.1
Total bonds 45,302.2 47,014.5
Borrowings from financial institutions and Banco Central de Chile:
Other obligations with Banco Central de Chile 446.6 667.3
Domestic borrowings 3,268.3 4,086.3
Foreign borrowings 92,643.2 89,442.3
Other borrowings 21,409.3 20,468.0
Total borrowings from financial institutions 117,767.4 114,663.9
Other liabilities 15,240.2 29,888.0
Total liabilities 1,145,489.2 1,075,032.1
Minority interest 9.1 8.0
Shareholders’ equity:
Capital and reserves 77,790.5 76,800.8
Other equity accounts 2,815.2 1,894.3
Net income for the year 13,326.1 10,169.3
Total shareholders’ equity - net 93,931.8 88,864.4
Total liabilities and shareholders’ equity 1,239,430.1 1,163,904.4
The accompanying notes are an integral part of these financial statements
Banco Security Annual Report 2003 I 55

2003 2002
MCh$ MCh$
Operating revenue
Interest and indexation income 58,478.3 81,315.0
Net gains from trading securities 10,408.8 10,629.5
Commission income 4,260.0 2,657.5
Exchange income - net 6,526.8 367.0
Other operating income 4,082.9 1,111.1
Total operating revenue 83,756.8 96,080.1
Less:
Interest and indexation expenses (27,941.6) (47,837.5)
Loss from trading securities (7,016.1) (4,325.6)
Commission expense (299.2) (44.4)
Other operating expenses (1,296.5) (325.3)
Gross operating margin 47,203.4 43,547.3
Remuneration and personnel expenses (11,014.1) (9,408.2)
Administrative and other expenses (10,521.0) (10,191.9)
Depreciation and amortization (2,164.3) (2,164.2)
Net operating margin 23,504.0 21,783.0
Provisions for assets at risk (6,551.2) (7,663.6)
Recovery of written off loans 368.3 241.9
Operating income 17,321.1 14,361.3
Other income and expenses:
Non-operating income 1,363.6 1,703.1
Non-operating expenses (1,608.1) (1,990.0)
Equity in income of related companies 41.9 44.5
Monetary correction (579.7) (1,854.1)
Income before income taxes 16,538.8 12,264.8
Income taxes (3,211.4) (2,093.2)
Income before minority interest 13,327.4 10,171.6
Minority interest (1.3) (2.3)
Net income for the year 13,326.1 10,169.3
The accompanying notes are an integral part of these financial statements
(In millions of Chilean peso - MCh$)
Statements of Income for the years ended December 31, 2003 and 2002
56 I Banco Security Annual Report 2003

2003 2002
MCh$ MCh$
Cash flows from operating activities:
Net income for the year 13,326.1 10,169.3
Charges (Credits) to income that do not represent cash flows:
Depreciation and amortization 2,164.3 2,164.2
Provisions for assets at risk 6,551.2 7,663.6
Equity in income of related companies (41.9) (44.5)
Minority interest 1.4 2.3
Monetary correction 579.7 1,854.1
Other charges that do not represent cash flows 462.5 2,142.9
Net change in interest. indexation and commissions
accrued on assets and liabilities 1,764.5 (1,146.4)
Net cash provided by operating activities 24,807.8 22,805.5
Cash flows from investment activities:
Net increase in loans (114,306.9) (95,801.3)
Net decrease in other loan operations 3,566.9 4,528.1
Net decrease (increase) in investments 26,161.5 (10,273.0)
Decrease in leased assets – 158.9
Purchases of fixed assets (4,857.6) (2,395.3)
Sale of fixed assets – 9.2
Decrease of investments in related companies – 466.8
Dividends received from investments in related companies 92.5 50.0
Sale of assets received in settlement of loans 2,232.8 5,667.2
Net decrease (increase) in other assets and liabilities (5,145.9) 6,005.3
Net cash used in investing activities (92,256.7) (91,584.1)
Cash flows from financing activities:
Net increase in checking accounts 6,701.0 1,449.4
Net increase in time and demand deposits 35,538.1 95,159.0
Net increase (decrease) of other sight of term liabilities (29,230.8) 13,802.2
Net increase (decrease) from obligations arising from trading securities 7,583.9 (29,679.7)
Increase in short-term foreign borrowings 135,296.4 14,481.8
Mortgage notes issued 47,920.5 17,989.8
Redemption of bonds (1,712.3) (2,553.0)
Increase (decrease) of loans from financial institution - net (99.1) 102,798.9
Payment of other long-term loans (135,449.3) (129,637.5)
Dividends paid (9,061.7) (9,137.7)
Net cash used in financing activities 57,486.7 74,673.2
Net total cash flow for the year (9,962.2) 5,894.6
Effect of inflation on cash and cash equivalents during the year 493.4 231.6
Net increase (decrease) in cash and cash equivalents (9,468.8) 6,126.2
Cash and cash equivalents at beginning of year 94,520.4 88,394.2
Cash and cash equivalents at end of year 85,051.6 94,520.4
The accompanying notes are an integral part of these financial statements
(In millions of Chilean peso - MCh$)
Statements of Cash flows for the years ended December 31, 2003 and 2002
Banco Security Annual Report 2003 I 57

NOTE 1. SUMMARY OF SIGNIFICANT ACCOUNTING POLICIES
a. Information provided
The financial statements have been prepared in accordance with accounting regulations issued by the
Superintendence of Banks and Financial Institutions (hereinafter, the Superintendence). Such regulations concur with
generally accepted accounting principles in Chile.
b. Basis of consolidation
The consolidated group comprises Banco Security (hereinafter “the Bank”) and its subsidiaries listed below :
Ownership
2003 2002
% %
Valores Security S.A. Corredores de Bolsa 99.900 99.900
Administradora General Fondos Security S.A. 99.990 99.990
Assets of subsidiaries represent in total 4.6% of the consolidated balance sheet (3.3% in 2002), and revenue of
such subsidiaries represents 20% of the consolidated revenues (14.9% in 2002).
In the consolidation process, all significant intercompany balances and transactions have been eliminated.
The 2002 Chilean peso amounts have been price-level restated for changes in the CPI (Chilean Consumer Price
Index) by 1.0%.
c. Interest and indexation
The amounts recorded in the balance sheet for loans, investments, and liabilities include interest and indexation
accrued until year end.
However, the Bank has taken the conservative position of discontinuing the accrual of interest and indexation
on high-risk and past-due loans.
d. Monetary correction
Shareholders’ equity, fixed assets, and other non-monetary balances have been monetarily corrected, considering
the changes in the Chilean Consumer Price Index (CPI). The application of monetary correction resulted in a net charge
to income of MCh$579.7 (MCh$1,854.1 in 2002).
The income statements of Banco Security are not monetarily corrected.
e. Conversion
Assets and liabilities in inflation index-linked units of accounts (UF) are stated at their year end conversion rate
of $16,920.00 ($16,744.12 in 2002).
(In millions of Chilean pesos - MCh$)
Notes to the Consolidated Financial Statements
58 I Banco Security Annual Report 2003

f. Foreign currency
Assets and liabilities denominated in foreign currency are stated in Chilean pesos at the exchange rate prevailing
at year end $599.42 per US$1 ($712.38 per US$1 in 2002).
The net gain from foreign exchange of MCh$6,526.8 (net gain of MCh$367.9 in 2002) shown in the consolidated
income statements includes the net gains obtained from foreign exchange transactions, as well as the recognition of
the effects of exchange rate variations on net assets or liabilities denominated in foreign currency.
g. Financial investments
Long–term investments that are traded in the secondary market of the Bank are stated at market value, in
accordance with instructions of the Superintendence of Banks and Financial Institutions. Such instructions call for the
recognition of the adjustments to market value against income for the year, unless permanent investments are involved,
in which case, with certain limitations, the aforementioned adjustments can be made directly against the “Fluctuation
in value of financial investments” equity account.
The application of the adjustment to market value resulted in a net credit of MCh$939.7 (M$314.5 (historical)
in 2002) to equity.
Other financial investments are stated at cost plus accrued interest and indexation.
h. Premises and equipment
Premises and equipment are stated at monetarily corrected cost and are shown net of accumulated depreciation.
Depreciation is calculated using the straight-line method over the useful lives of the assets.
i. Provisions for assets at risk
The Bank has established all the provisions that are required to cover the risk of loss on assets, in accordance
with the standards issued by the Superintendence of Banks and Financial Institutions. The assets are shown net of such
provision, or in the case of loans, as a deduction therefrom.
j. Voluntary provisions
In accordance with the General Banking Law, financial institutions may establish special provisions, called
“Voluntary provisions”, which can be considered as part of the equity for purposes of complying with certain regulations
of the General Banking Law. The amount and effect on income are shown directly on each year’s consolidated balance
sheet and the consolidated statement of income, respectively.
k. Deferred taxes
The effects of deferred taxes arising from differences between the tax and the book bases are recorded on the
accrual basis in conformity with Technical Bulletin Nº 60 of the Chilean Institute of Certified Public Accounts and its
supplements and according to instructions of the Superintendence of Banks and Financial Institutions.
Banco Security Annual Report 2003 I 59

l. Employee vacations
The annual cost of employee vacations and benefits is recorded on the accrual basis.
m. Cash and cash equivalents
For purposes of the statement of cash flows, cash and cash equivalents include the balance of “Liquid Assets”, in
accordance with the rules established in Chapter 18-1 of the Superintendence’s Compendium of Regulations.
NOTE 2. RELATED PARTY TRANSACTIONS
In accordance with the General Banking Law and the Superintendence’s instructions, individuals and companies
that are related, directly or indirectly, to the Bank’s owners or management are considered related parties.
a. Loans to related parties
At December 31, 2003 and 2002, loans to related parties are as follows:
Current portfolio Past-due portfolio Total Guarantees (*)
2003 2002 2003 2002 2003 2002 2003 2002
MCh$ MCh$ MCh$ MCh$ MCh$ MCh$ MCh$ MCh$
Individuals 3,719.3 90.9 3,719.3 90.9 3,219.2 516.6
Operating companies 28,934.4 17,178.2 14.0 28,934.4 17,192.2 16,795.0 10,929.3
Investment companies 17,385.0 6,524.9 17,385.0 6,524.9 4,455.3 4,026.1
Total 50,038.7 23,794.0 – 14.0 50,038.7 23,808.0 24,469.5 15,472.0
(*) Includes only those guarantees that are admitted by Article 84 of the General Banking Law for purposes of establishing the individual credit limits defined bythe Law. The guarantees are valued in accordance with the Superintendence’s instructions.
Notes to the Consolidated Financial Statements
60 I Banco Security Annual Report 2003

b. Other transactions with related parties
During 2003 and 2002, the Bank entered into the following transactions in excess of UF1,000 with related
parties:
Credit Charge
to income to income
2003 2002 2003 2002
Company Description MCh$ MCh$ MCh$ MCh$
Invest Security S.A. Advisory services – – 792.1 757.5
Seguros Vida Previsión S.A. Office rentals 20.0 16.9 – –
Seguros Security Previsión Generales S.A. Office rentals 10.1 6.0 – –
Global Security S.A. Advisory services 184.9 – 521.7 523.7
Virtual Security S.A. Advisory services – – 1,707.7 1,821.2
Inmobiliaria Security S.A. Advisory services – – 180.5 –
Factoring Security S.A. Advisory services – – 33.6 –
These transactions were realized on prevailing market terms.
The Bank has a price balance and progress billing for MM$4,805.1 (MM$1,176.2 in 2002) with Inmobiliaria
Security S.A. maturing in 2004.
Banco Security Annual Report 2003 I 61

NOTE 3. ALLOWANCES
a. Allowances for assets at risk
At December 31, 2003, the Bank has accrued allowances for a total of MCh$12,388.8 (MCh$10,905.1 in 2002)
which correspond to the minimum provisions required by the Superintendence to cover possible losses.
During each year, the changes in the allowances are as follows:
Provisions for
Assets
received
in Other
Loans settlement assets Total
MCh$ MCh$ MCh$ MCh$
Historical balances, December 31, 2001 7,575.3 30.7 601.0 8,207.0
Provisions applied (4,529.6) (30.7) (409.0) (4,969.3)
Increase in provisions 7,559.5 – – 7,559.5
Balances, December 31, 2002 10,605.2 – 192.0 10,797.2
Update balances for comparative purposes 10,711.2 – 193.9 10,905.1
Historical balances, December 31, 2003 10,605.2 – 192.0 10,797.2
Provisions applied (4,959.6) – – (4,959.6)
Increase in provisions 6,315.2 – 236.0 6,551.2
Balances, December 31, 2003 11,960.8 – 428.0 12,388.8
In the opinion of the Board of Directors, the allowances established cover all possible losses that might result
from non-recovery of assets, based on the information examined by the Bank.
b. Voluntary provisions
The Bank does not have voluntary reserves at December 31, 2003 and 2002.
Notes to the Consolidated Financial Statements
62 I Banco Security Annual Report 2003

NOTE 4. SHAREHOLDERS’ EQUITY
a. Equity
Changes in the shareholders’ equity during each year are summarized as follows:
Paid-in Other Other Net income
capital reserves accounts for the year Total
MCh$ MCh$ MCh$ MCh$ MCh$
Balances, December 31, 2001, historic 56,362.4 16,525.0 1,561.0 9,722.0 84,170.4
Distribution of 2001 income – 9,722.0 – (9,722.0) –
Dividends paid – (8,749.7) – – (8,749.7)
Fluctuation in value of financial investment – – 314.5 – 314.5
Monetary correction 1,690.9 489.8 – – 2,180.7
Net income for the year – – – 10,068.6 10,068.6
Balances, December 31, 2002 58,053.3 17,987.1 1,875.5 10,068.6 87,984.5
Update balances for comparative purposes 58,633.8 18,167.0 1,894.3 10,169.3 88,864.4
Balances, December 31, 2002, historic 58,053.3 17,987.1 1,875.5 10,068.6 87,984.5
Distribution of 2002 income – 10,068.6 – (10,068.6) –
Dividends paid – (9,061.7) – – (9,061.7)
Fluctuation in value of financial investment – – 939.7 – 939.7
Monetary correction 588.8 154.4 – – 743.2
Net income for the year – – – 13,326.1 13,326.1
Balances, December 31, 2003 58,642.1 19,148.4 2,815.2 13,326.1 93,931.8
Pursuant to Article 10 of Law Nº 18,046, the monetary correction of capital has been included in Paid-in Capital,
which is represented by 90,241,632 no-par-value shares with the same treatment being applied to the reserves.
During February of 2003 and 2002, 90% of net profits from 2002 and 2001 of MCh$10,068.6 and MCh$9,722.0
(historical), respectively were distributed.
b. Minimum basic capital and effective equity
According to the General Banking Law, a financial institution’s minimum basic capital may not be lower than
3% of its total assets, while the effective equity may not be lower than 8% of its risk weighted assets. At December 31,
2003, the Bank has the following parameters: 6.5% (6.74% in 2002) and 11.17% (11.61% in 2002), respectively.
Following Circular Letter Nº 3,178 of the Superintendence dated June 7, 2003, the Bank has determined its
minimum basic capital, total assets, effective equity and risk weighted assets based on the Bank’s consolidated balance
sheet.
Banco Security Annual Report 2003 I 63

NOTE 5. INVESTMENTS
At December 31, 2003 and 2002, the Institution has the following balances in financial investments:
a. Financial investments
At December 31, 2003
(*) Classification according to issuers or those obliged to pay. This amount includes, in total, MCh$49,122.7 (MCh$22,478.8 in 2002) for securities sold underrepurchase agreements.
(**) Permanent investments include securities whose adjustment to market value is charged to the “Fluctuation in value of financial investments” account, asdescribed in Note 1g.
b. Other investments
2003 2002
MCh$ MCh$
Assets for leasing 5,431.0 2,536.0
Assets received in settlement or adjudicated (*) 3,550.0 4,693.7
Total 8,981.0 7,229.7
(*) The amount shown on the balance sheet corresponds to the estimated realizable value of these assets taken as a whole.
In addition to those assets received in settlement of loans or adjudicated that are recorded as assets, none exist
that had been written-off and have yet to be sold.
Notes to the Consolidated Financial Statements
64 I Banco Security Annual Report 2003
Type of portfolio Adjustments to market value
Non Credit (charge) Credit (charge)
Permanente (**) permanente Sub total to income to equity Total
2003 2002 2003 2002 2003 2002 2003 2002 2003 2002 2003 2002
MCh$ MCh$ MCh$ MCh$ MCh$ MCh$ MCh$ MCh$ MCh$ MCh$ MCh$ MCh$
Securities (*)
Banco Central de Chile 150.2 179.8 41,456.8 20,064.4 41,607.0 20,244.2 251.2 390.6 6.9 9.3 41,865.1 20,644.1
Local financial institutions 7,849.6 5,259.4 60,724.1 33,391.9 68,573.7 38,651.3 539.9 108.0 255.9 276.5 69,369.5 39,035.8
Other investments in Chile 3,387.0 1,584.4 17,195.8 55,214.7 20,582.8 56,799.1 280.1 244.4 59.2 (96.7) 20,922.1 56,946.8
Investments abroad 19,914.6 37,514.3 2,808.3 10,946.5 22,722.9 48,460.8 331.2 – 2,493.2 1,705.2 25,547.3 50,166.0
Mortgage notes issued – – 3,698.3 – 3,698.3 – 37.7 – – – 3,736.0 –
Total 31,301.4 44,537.9 125,883.3 119,617.5 157,184.7 164,155.4 1,440.1 743.0 2,815.2 1,894.3 161,440.0 166,792.7

NOTE 6. ANALYSIS OF ASSETS AND LIABILITIES BY MATURITY
a. Maturity of loans and financial investments
The information below shows loans and financial investments through maturity. The balances, which include
accrued interest at December 31, 2003 and 2002, are as follows:
(1) Considers only those loans outstanding at year end that fall due within the indicated periods. Consequently, excluded are contingent loans and loanstransferred to the past-due portfolio, as well as delinquent debts that have not been transferred to the past-due portfolio amounting to MCh$1,984.9(MCh$1,813.5 in 2002), of which MCh$696.2 (MCh$595.9 in 2002) have been delinquent less than 30 days.
(2) Includes securities classified as permanent investments, as described in Note 1 g, without adjustments to market value, and non-transferable notes.(3) Includes all other financial investments, with adjustments to market value.
Due within More than 1 year More than 3 year More than
one year but within 3 years but within 6 years 6 years Total
2003 2002 2003 2002 2003 2002 2003 2002 2003 2002
MCh$ MCh$ MCh$ MCh$ MCh$ MCh$ MCh$ MCh$ MCh$ MCh$
Loans (1):
Commercial and other 473,619.5 453,223.4 92,099.6 75,822.9 107,889.5 104,329.5 128,065.7 118,311.3 801,674.3 751,687.1
Mortgage – – 220.3 183.9 2,117.3 832.3 94,355.7 49,326.7 96,693.3 50,342.9
Consumer 2,023.4 1,306.7 3,367.9 2,839.5 1,033.6 1,045.0 841.7 530.2 7,266.6 5,721.4
Other loans:
Other financial institutions – 3,622.6 – – – – – – – 3,622.6
Loans from trading securities 1,272.7 4,201.5 – – – – – – 1,272.7 4,201.5
Financial investments:
Permanent investments (2) 386.1 11,116.4 10,588.0 3,463.8 2,568.0 15,563.8 17,759.3 14,393.9 31,301.4 44,537.9
Non-permanent investments (3) 131,059.4 120,360.5 – – – – – – 131,059.4 120,360.5
Banco Security Annual Report 2003 I 65
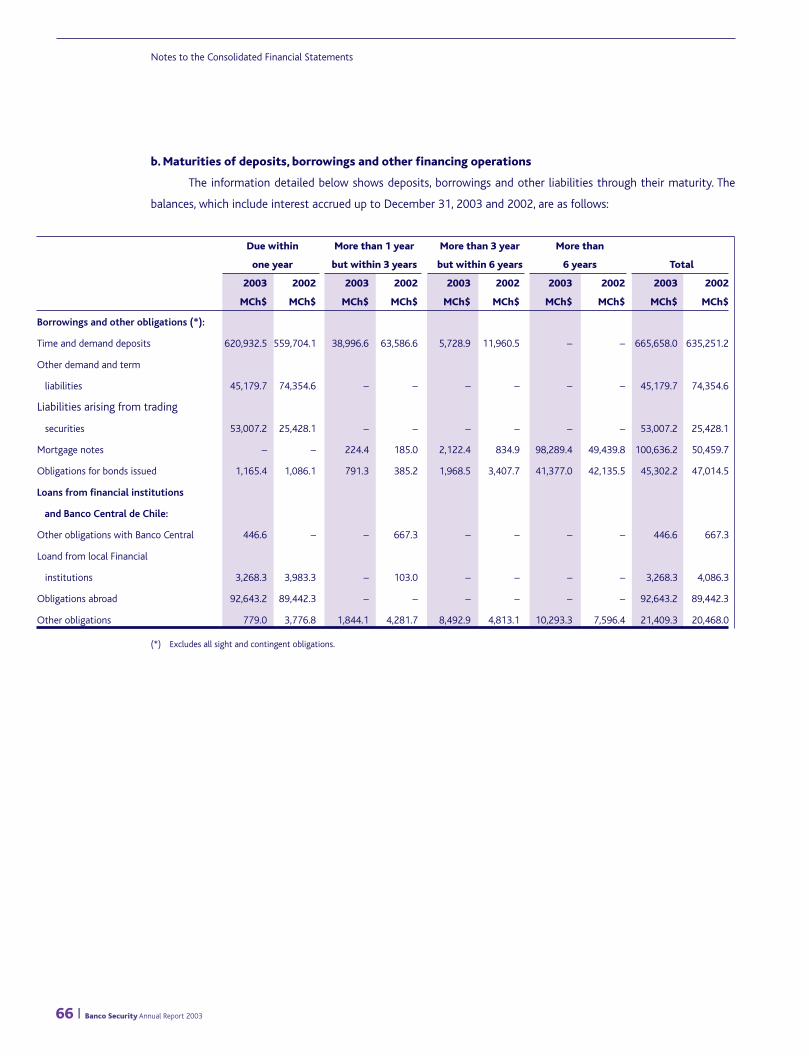
b. Maturities of deposits, borrowings and other financing operations
The information detailed below shows deposits, borrowings and other liabilities through their maturity. The
balances, which include interest accrued up to December 31, 2003 and 2002, are as follows:
(*) Excludes all sight and contingent obligations.
Due within More than 1 year More than 3 year More than
one year but within 3 years but within 6 years 6 years Total
2003 2002 2003 2002 2003 2002 2003 2002 2003 2002
MCh$ MCh$ MCh$ MCh$ MCh$ MCh$ MCh$ MCh$ MCh$ MCh$
Borrowings and other obligations (*):
Time and demand deposits 620,932.5 559,704.1 38,996.6 63,586.6 5,728.9 11,960.5 – – 665,658.0 635,251.2
Other demand and term
liabilities 45,179.7 74,354.6 – – – – – – 45,179.7 74,354.6
Liabilities arising from trading
securities 53,007.2 25,428.1 – – – – – – 53,007.2 25,428.1
Mortgage notes – – 224.4 185.0 2,122.4 834.9 98,289.4 49,439.8 100,636.2 50,459.7
Obligations for bonds issued 1,165.4 1,086.1 791.3 385.2 1,968.5 3,407.7 41,377.0 42,135.5 45,302.2 47,014.5
Loans from financial institutions
and Banco Central de Chile:
Other obligations with Banco Central 446.6 – – 667.3 – – – – 446.6 667.3
Loand from local Financial
institutions 3,268.3 3,983.3 – 103.0 – – – – 3,268.3 4,086.3
Obligations abroad 92,643.2 89,442.3 – – – – – – 92,643.2 89,442.3
Other obligations 779.0 3,776.8 1,844.1 4,281.7 8,492.9 4,813.1 10,293.3 7,596.4 21,409.3 20,468.0
Notes to the Consolidated Financial Statements
66 I Banco Security Annual Report 2003
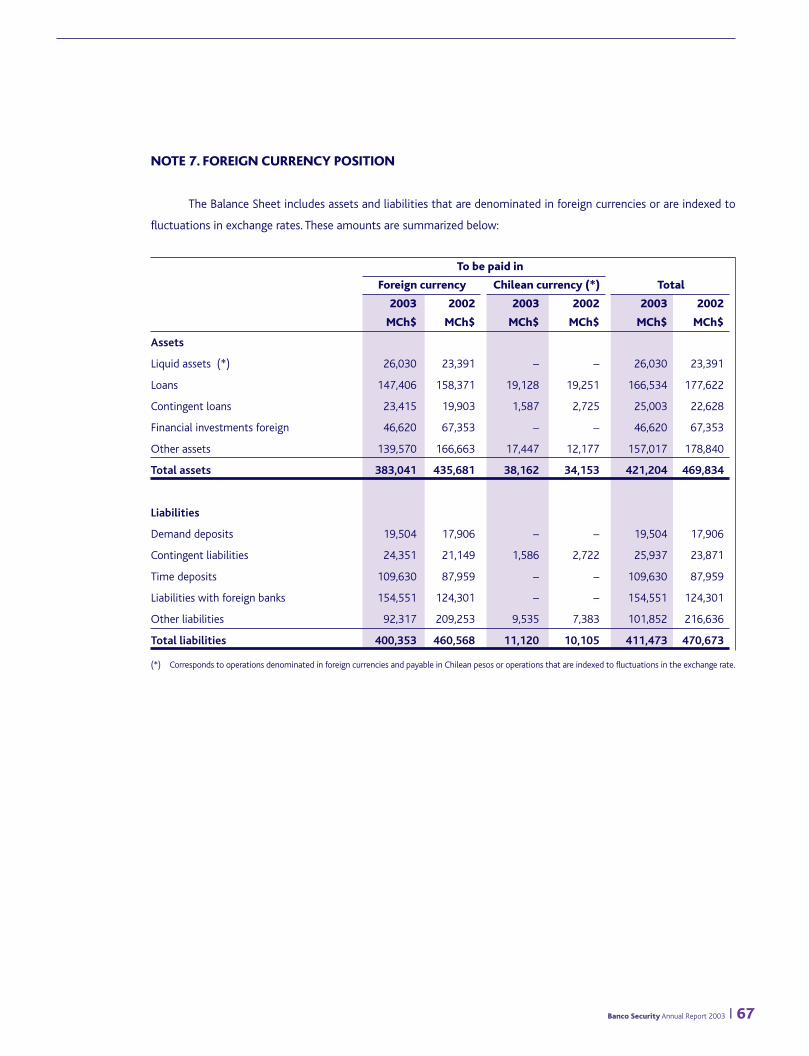
NOTE 7. FOREIGN CURRENCY POSITION
The Balance Sheet includes assets and liabilities that are denominated in foreign currencies or are indexed to
fluctuations in exchange rates. These amounts are summarized below:
To be paid in
Foreign currency Chilean currency (*) Total
2003 2002 2003 2002 2003 2002
MCh$ MCh$ MCh$ MCh$ MCh$ MCh$
Assets
Liquid assets (*) 26,030 23,391 – – 26,030 23,391
Loans 147,406 158,371 19,128 19,251 166,534 177,622
Contingent loans 23,415 19,903 1,587 2,725 25,003 22,628
Financial investments foreign 46,620 67,353 – – 46,620 67,353
Other assets 139,570 166,663 17,447 12,177 157,017 178,840
Total assets 383,041 435,681 38,162 34,153 421,204 469,834
Liabilities
Demand deposits 19,504 17,906 – – 19,504 17,906
Contingent liabilities 24,351 21,149 1,586 2,722 25,937 23,871
Time deposits 109,630 87,959 – – 109,630 87,959
Liabilities with foreign banks 154,551 124,301 – – 154,551 124,301
Other liabilities 92,317 209,253 9,535 7,383 101,852 216,636
Total liabilities 400,353 460,568 11,120 10,105 411,473 470,673
(*) Corresponds to operations denominated in foreign currencies and payable in Chilean pesos or operations that are indexed to fluctuations in the exchange rate.
Banco Security Annual Report 2003 I 67

NOTE 8. TRANSACTIONS WITH DERIVATIVE INSTRUMENTS
Transactions for the purchase and sale of foreign currency futures and other derivative products at year end, are
summarized below:
a. Contracts for the purchase and sale of foreign currency futures, and interest rates:
Amount of the contracts
Number of Up to More than
operations three months three months
2003 2002 2003 2002 2003 2002
Type of futures operation ThUS$ ThUS$ ThUS$ ThUS$
Local market:
Future purchase of foreign currency in Chilean pesos 59 39 69,599.9 37,450.0 51,345.6 93,682.0
Future sale of foreign currency in Chilean pesos 77 75 27,803.1 16,154.4 46,950.0 149,219.5
Forwards in foreign currency (sales) 7 6 3,276.8 6,271.4 634.7 3,367.2
Foreign markets:
Forwards in foreign currency (purchases) 7 6 6.0 6,263.2 525.8 3,360.0
The amounts refer to either the US dollar futures bought or sold, the equivalent in US dollars of foreign currency
futures bought or sold, or the US dollar basis associated with interest rate futures, as appropriate. The terms correspond
to the duration of the contracts from the transaction date.
b. Contracts on the value of “Unidad de Fomento” (Inflation index-linked units of accounts):
Amount of the contracts
Nº of Forum 1 to Over
operation 3 months 3 months
2003 2002 UF UF
Purchase of UF/Chilean pesos forwards 5 4 1,200,000 200,000
Notes to the Consolidated Financial Statements
68 I Banco Security Annual Report 2003

NOTE 9. CONTINGENCIES, COMMITMENTS AND RESPONSIBILITIES
a. Commitments and responsibilities recorded in the Bank’s memorandum accounts
The Institution has recorded the following commitments and responsibilities in memorandum accounts related
to the business activity:
2003 2002
MCh$ MCh$
Mortgage and pladge guarantees 628,478.3 498,392.9
Credit lines obtained 205,325.2 245,611.6
Securities and notes in guarantee 198,868.1 128,004.0
Securities held in custody 440,967.7 62,005.9
Loans approved put not disbursed 54,361.0 44,653.3
Foreign collections 23,172.8 27,263.2
The above summary list includes only the more important balances. Contingent loans and liabilities are stated
on the balance sheet.
b. Direct commitments of the subsidiary Valores Security S.A. Corredores de Bolsa
Guarantees for overdraft lines: At December 31, 2003 the Company has overdraft lines approved with the
following Banks: Sudamericano, Bice, Citibank, BHIF, Security and Santander, to which effect promissory notes have
been signed for ThCh$140,000.0, ThCh$2,500,000, ThUS$3,000, ThCh$1,500,000, ThCh$2,100,000 and ThCh$8,500,000,
respectively.
Banco Security Annual Report 2003 I 69

NOTE 10. COMMISSION
Commission income and expense shown in the statements of income are as follows:
Income Expenses
2003 2002 2003 2002
MCh$ MCh$ MCh$ MCh$
Commission earned or paid on:
Stock exchange transactions 428.9 175.5 – –
Mutual fund transactions 33.6 6.1 – –
Collection of documents 418.4 651.3 – –
Letters of credit, guarantees, pledges and other
contingent loans 502.3 397.2 – –
Credit cards 347.6 213.1 – –
Lines of credits 126.6 66.6 – –
Credit commissions 1,024.0 – – –
ATM commissions 75.0 – 181.5 36.7
Checking accounts 606.1 269.6 – –
Private banking – 224.8 – –
Others 697.5 653.3 117.7 7.7
Total 4,260.0 2,657.5 299.2 44.4
Commissions earned on mortgage note transactions are included in “Interest and Indexation Income” in the
consolidated statement of income.
NOTE 11. NON-OPERATING INCOME
The detail of non-operating income is as follows:
2003 2002
MCh$ MCh$
Sales of fixed assets – 67.5
Recovery of expenses 632.7 816.9
Rentals received 69.1 61.8
Recovery of written-off assets received payment 119.9 47.2
Financial advisory services 173.7 –
Others 368.2 709.7
Total 1,363.6 1,703.1
Notes to the Consolidated Financial Statements
70 I Banco Security Annual Report 2003

NOTE 12. NON-OPERATING EXPENSES
The amount of non-operating expenses shown in the income statements is as follows:
2003 2002
MCh$ MCh$
Loss on sale of assets received in settlement 631.2 696.7
Write-offs assets received in settlements 416.8 725.0
Loss for assets recovered in leasing 551.0 309.7
Others 9.1 258.6
Total 1,608.1 1,990.0
NOTE 13. INCOME TAX
The Bank and its subsidiaries have recorded a provision for First Category Income Tax, of MCh$3,211.4
(MCh$2,093.2 in 2002)
Banco Security Annual Report 2003 I 71

NOTE 14. DEFERRED TAXES
As explained in Note 1k, the Bank and its subsidiaries have applied the accounting criteria of Technical Bulletin
Nº60 of the Chilean Institute of Certified Public Accountants and its Supplements.
Deferred taxes on temporary differences are presented below:
2003: Balance at
January 1, December 31,
2003 2003
(historic)
Item MCh$ MCh$
Debit differences:
Global loan loss provision 1,015.8 1,203.9
Provision for assets recovered 28.1 24.6
Provision for leasing contracts 101.9 103.3
Leased tax assets 6,758.3 8,901.8
Adjustment to market of non-permanent investments 133.9 119.8
Written-of assets received in settlement 308.6 70.9
Others 149.2 334.2
Sub total 8,495.8 10,758.5
Complementary account (3,714.7) (3,608.4)
Net difference 4,781.1 7,150.1
Credit differences:
Lease contracts (9,020.4) (10,648.4)
Depreciation of fixed assets (560.6) (569.0)
Others (48.4) (59.6)
Sub total (9,629.4) (11,277.0)
Complementary accounts 5,962.0 5,628.0
Net difference (3,667.4) (5,649.0)
Notes to the Consolidated Financial Statements
72 I Banco Security Annual Report 2003

2002: Balance at
January 1, December 31,
2002 2002
(historic)
Item MCh$ MCh$
Debit differences:
Global loan loss provision 617.9 1,026.0
Provision for assets recovered 30.3 28.4
Provision over leasing contracts 103.9 102.9
Leasing tax assets 4,596.2 6,825.9
Adjustment to market of non-permanent investments 230.2 135.2
Written-off assets received in settlement 43.4 311.7
Others 36.2 151.6
Sub total 5,658.1 8,581.7
Complementary account (3,840.8) (3,751.8)
Net difference 1,817.3 4,829.9
Credit differences:
Lease contracts (6,896.8) (9,110.6)
Depreciation of fixed assets (527.5) (566.2)
Others (67.9) (48.9)
Sub total (7,492.2) (9,725.7)
Complementary account 6,580.3 6,021.6
Net difference (911.9) (3,704.1)
Tax expense during 2003 and 2002 is as follows:
Item 2003 2002
MCh$ MCh$
Current tax expense:
Provision for income tax (665.3) (688.3)
Adjustment for tax expense (2,921.4) (1,642.0)
Total current tax (3,586.7) (2,330.3)
Deferred taxes:
Effect for deferred assets or liabilities of the year 625.5 706.8
Effect for amortization of complementary accounts of assets and liabilities (250.2) (469.7)
Total (3,211.4) (2,093.2)
Banco Security Annual Report 2003 I 73

NOTE 15. PURCHASES, SALES, SUBSTITUTIONS OR TRADES IN THE LOAN PORTFOLIO
In 2003 and 2002, the Bank sold loan portfolio as follows:
2003:
Effect on Effect on
Purchase Sale income provisions
MCh$ MCh$ MCh$ MCh$
10,769.6 7,330.4 44.7 –
2002:
Effect on Effect on
Purchase Sale income provisions
MCh$ MCh$ MCh$ MCh$
6,839.8 920.9 – 4.5
NOTE 16. DIRECTORS’ EXPENSES AND FEES
During 2003 and 2002, the Bank has paid the following directors’ fees and expenses:
2003 2002
MCh$ MCh$
Per diem 60.7 62.0
Advisory services fees 366.0 388.2
Total 426.7 450.2
NOTE 17. SUBSEQUENT
During the period at January 1 and 13, 2004, which the issue date of these financial statement, no events have
occurred which may significantly affect them.
HORACIO SILVA C. RAMON ELUCHANS O.
Accounting Officer President
Notes to the Consolidated Financial Statements
74 I Banco Security Annual Report 2003

To the Shareholders of
Banco Security
We have audited the consolidated balance sheets of Banco Security and subsidiaries as of December 31, 2003 and
2002, and the related consolidated statements of income and of cash flows for the years then ended. These consolidated
financial statements (including the related notes) are the responsibility of the Bank’s management. Our responsibility
is to express an opinion on these consolidated financial statements based on our audits.
We conducted our audits in accordance with auditing standards generally accepted in Chile. Those standards require
that we plan and perform the audit to obtain reasonable assurance about whether the financial statements are free of
material misstatement. An audit includes examining, on a test basis, evidence supporting the amounts and disclosures
in the financial statements. An audit also includes assessing the accounting principles used and significant estimates
made by the Bank’s management, as well as evaluating the overall consolidated financial statement presentation. We
believe that our audits provide a reasonable basis for our opinion.
In our opinion, such consolidated financial statements present fairly, in all material respects, the financial position of
Banco Security and subsidiaries as of December 31, 2003 and 2002 and the results of their operations and their cash
flows for the years then ended, in conformity with generally accepted accounting principles in Chile and regulations
issued by the Superintendence of Banks and Financial Institutions.
The translation of the financial statements into English has been made solely for the convenience of readers outside
Chile.
January 13, 2004
Independent Auditors’ Report
Banco Security Annual Report 2003 I 75
Deloitte & Touche
Sociedad de Auditores y Consultores Ltda.
RUT: 80.276.200-3
Av. Providencia 1760
Pisos 6, 7, 8 y 9
Providencia, Santiago
Chile
Fono: (56-2) 270 3000
Fax: (56-2) 374 9177
e-mail: [email protected]
www.deloitte.cl


Contents
Valores Security S.A., Corredores de Bolsa 78
Administradora General de Fondos Security S.A. 79
ThCh$ = Thousands of Chilean pesos
MCh$ = Millions of Chilean pesos
UF = Unidad de Fomento (an official inflation-indexed monetary unit)
US$ = United States dollars
ThUS$ = Thousands of US dollars
At December 31, 2003 and 2002.
Summarized Financial Statements of the Subsidiaries of Banco Security
Banco Security Annual Report 2003 I 77

Balance Sheet
2003 2002
Assets MCh$ MCh$
Current 156,752.2 96,736.6
Premises & equipment 90.2 97.1
Other assets 376.7 399.1
Total Assets 157,219.1 97,232.8
Liabilities
Current 149,020.3 91,435.1
Capital & reserves 5,797.7 3,741.8
Net income for the year 2,401.2 2,055.9
Total Liabilities & Shareholders’ Equity 157,219.2 97,232.8
Statement of Income
Operating income 2,818.1 2,420.6
Non-operating income 32.7 14.9
Income before tax 2,850.8 2,435.5
Income tax (449.6) (379.6)
Net income for the year 2,401.2 2,055.9
Summarized Financial Statements at December 31, 2003 and 2002.
Valores Security S.A., Corredores de Bolsa
78 I Banco Security Annual Report 2003

Balance Sheet
2003 2002
Assets MCh$ MCh$
Current 4,542.9 3,538.3
Other assets 88.2 84.1
Total Assets 4,631.1 3,622.4
Liabilities
Current 294.7 411.6
Capital & reserves 1,201.1 1,201.1
Retained earnings 2,009.7 972.4
Net income for the year 1,125.6 1,037.3
Total Liabilities & Shareholders’ Equity 4,631.1 3,622.4
Statement of Income
Operating income 1,140.5 1,049.0
Non-operating income 199.1 175.2
Income before tax 1,339.6 1,224.2
Income tax (214.0) (186.9)
Net income for the year 1,125.6 1,037.3
Summarized Financial Statements at December 31, 2003 and 2002.
Administradora General de Fondos Security S.A.
Banco Security Annual Report 2003 I 79


Head Office
Agustinas 621 - Santiago
Phone: (56-2) 270 4000
Fax: (56-2) 270 4001
Web: www.security.cl
e-mail: [email protected]
Providencia branch
Av. 11 de Septiembre 2289 - Providencia
Phone: (56-2) 233 1580
Fax : (56-2) 251 5925
El Golf branch
Hendaya 60 - Las Condes
Phone: (56-2) 270 4100
Fax: (56-2) 232 8739
Vitacura branch
Av. Nueva Costanera 3750 - Vitacura
Phone: (56-2) 207 0719
Fax: (56-2) 207 5890
La Dehesa branch
Av. La Dehesa 1744 - Lo Barnechea
Phone: (56-2) 2168701
Fax: (56-2) 2168699
Panamericana Norte branch
Av. Presidente E. Frei M. 3016 - Renca
Phone: (56-2) 641 6055
Fax : (56-2) 641 5640
Santa Elena branch
Santa Elena 2400 - San Joaquín
Phone: (56-2) 555 0081
Fax: (56-2) 555 7798
Quilicura branch
Panamericana Norte 9950 L. 4 - Quilicura
Phone: (56-2) 738 6650
Fax: (56-2) 738 6654
Ciudad Empresarial branch
Av. Santa Clara 354 - Santiago
Phone: (56-2) 738 4170
Fax: (56-2) 738 4308
Antofagasta branch
Av. San Martín 2511 - Antofagasta
Phone: (56-55) 28 2824
Fax: (56-55) 22 1771
Concepción branch
O‘Higgins 428 - Concepción
Phone: (56-41) 22 6801
Fax: (56-41) 22 4237
Temuco branch
Manuel Bulnes 701 - Temuco
Phone: (56-45) 23 6300
Fax: (56-45) 21 1359
Puerto Montt branch
Guillermo Gallardo 132 - Puerto Montt
Phone: (56-65) 29 4000
Fax: (56-65) 29 4001
Leasing Module
Miraflores 178 5th floor - Santiago
Phone: (56-2) 270 4000
Fax: (56-2) 270 4008
Web: www.security.cl
e-mail: [email protected]
Subsidiary Companies
Valores Security S.A., Corredores de Bolsa
Miraflores 178 6th floor - Santiago
Phone: (56-2) 270 4000
Fax: (56-2) 270 4657
Web: www.security.cl
e-mail: [email protected]
Administradora General de Fondos Security S. A.
Miraflores 178 6th floor - Santiago
Phone: (56-2) 270 4000
Fax: (56-2) 270 4015
Web: www.security.cl
e-mail: [email protected]
Addresses of Banco Security and Subsidiaries
Banco Security Annual Report 2003 I 81

diseño y producción berthelon & asociadosimpresión litografía valente