Embed Size (px)
Citation preview

Pioneering High Energy Nuclear Interaction eXperimentUsing PHENIX to identify hadrons produced in “Little Big Bangs”
at RHIC
J. Burward-HoyState University of New York at Stony Brook
for the PHENIX Collaboration
The Stony Brook Group:
R. Averbeck, S. Butsyk, A. Drees, T.K. Hemmick, J. Heuser, R. Hutter, M. Marx, F. Matathias, F. Messer, V. Pantuyev, B. Jacak, J. Jia, S.C.Johnson†, J. Velkovska, M. Velkovsky
†Lawrence Livermore National Laboratory
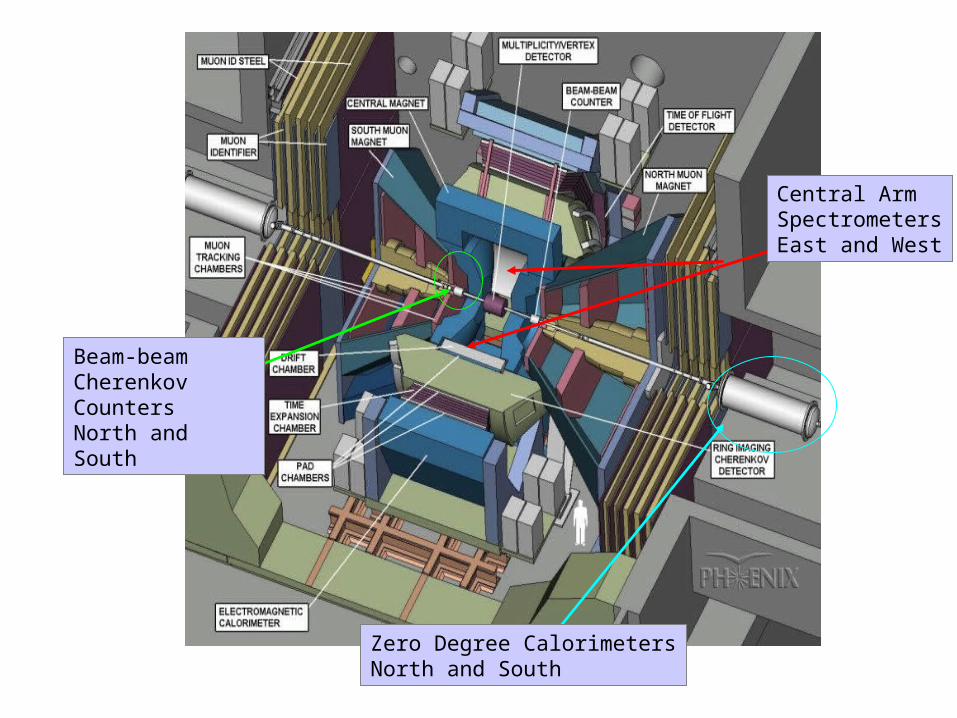
Central ArmSpectrometersEast and West
Beam-beam Cherenkov CountersNorth and South
Zero Degree CalorimetersNorth and South

Gold atoms are stripped of their electrons and then accelerated to relativistic speeds. Dipole magnets focus the ions beams to cross and collide at the center of the PHENIX detector situated on the Relativistic Heavy-Ion Collider (RHIC) ring at Brookhaven National Laboratory (BNL). Due to Lorentz contraction, the ions are flat like pancakes and pass through each other “before they realize it.” The time scale of the physics in the collision is in fermi where 1 fm = 10-15 cm. The collision simulates what happened 10s after the Big Bang. A new state of matter called a Quark Gluon Plasma is predicted to exist at these high energy densities. Most of the produced energy is carried away by hadrons as the system expands and cools. The momentum spectra of hadrons are therefore sensitive to the dynamics of the collision and are measured in PHENIX for pions, kaons, and protons. The data are a subset of the 2000 Summer runs at RHIC and the results were presented at the Quark Matter 2001 Conference at Stony Brook by J. Velkovska.
“Little Big Bangs” at RHIC
Au ion in yellow ring in RHIC
Au ion in blue ring in RHIC
GeVsE cm 130
Cartoon of two Au ionsafter passing througheach other in a relativisticcollision
Spectator nucleonsTo collision axis detectors
Produced , K, p to central arm detectors
Participant nucleons
Collision axis
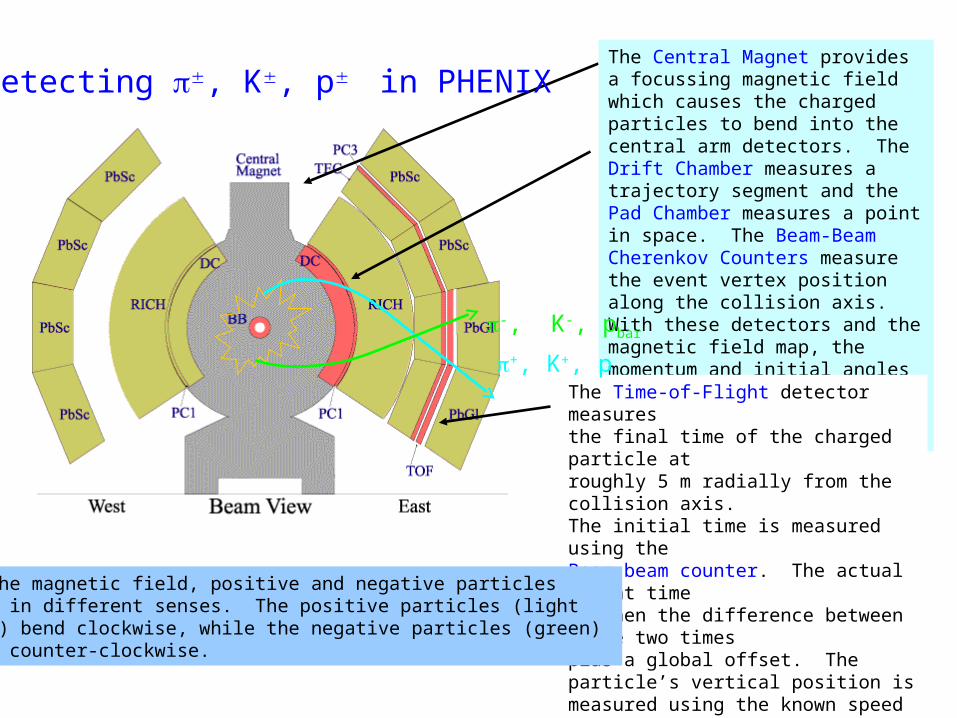
The Central Magnet provides a focussing magnetic field which causes the charged particles to bend into the central arm detectors. The Drift Chamber measures a trajectory segment and the Pad Chamber measures a point in space. The Beam-Beam Cherenkov Counters measure the event vertex position along the collision axis. With these detectors and the magnetic field map, the momentum and initial angles of each charged particle at the event vertex is determined.
The Time-of-Flight detector measuresthe final time of the charged particle at roughly 5 m radially from the collision axis.The initial time is measured using the Beam-beam counter. The actual flight timeis then the difference between these two times plus a global offset. The particle’s vertical position is measured using the known speed of light in the scintillating material and the time difference measured across it. The location of the slat along the horizontal and along the collision axis defines the other coordinates of the particle’s space point.
+, K+, p
-, K-, pbar
In the magnetic field, positive and negative particlesbend in different senses. The positive particles (lightblue) bend clockwise, while the negative particles (green) bend counter-clockwise.
Detecting , K, p in PHENIX
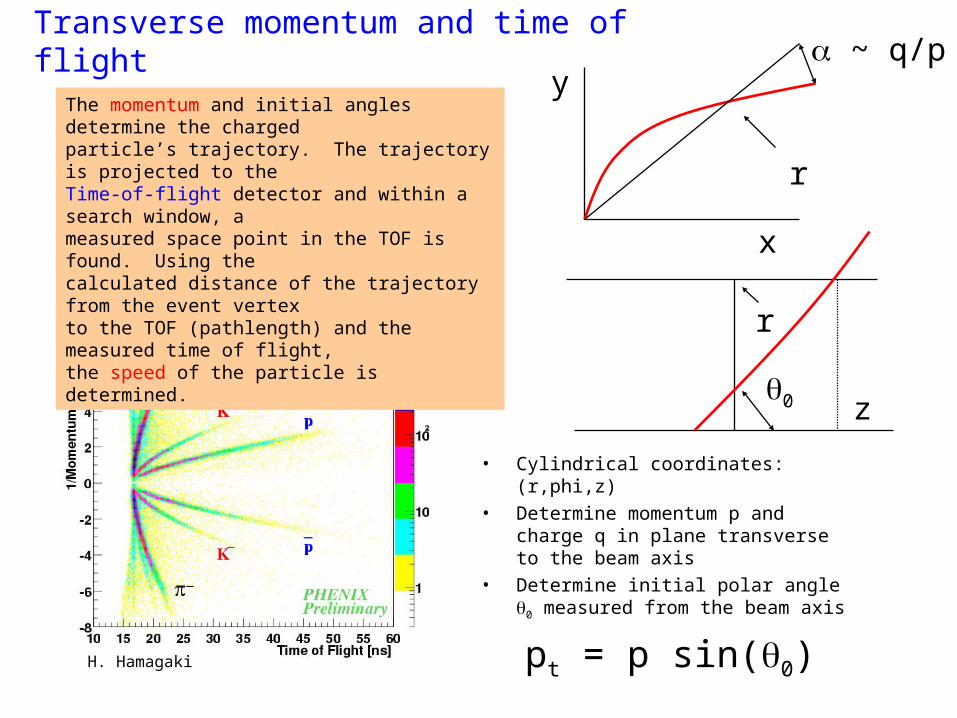
Transverse momentum and time of flight
• Cylindrical coordinates: (r,phi,z)
• Determine momentum p and charge q in plane transverse to the beam axis
• Determine initial polar angle 0 measured from the beam axis
pt = p sin(0)
x
y ~ q/p
r
z
r
0
H. Hamagaki
The momentum and initial angles determine the charged particle’s trajectory. The trajectory is projected to the Time-of-flight detector and within a search window, a measured space point in the TOF is found. Using the calculated distance of the trajectory from the event vertexto the TOF (pathlength) and the measured time of flight,the speed of the particle is determined.
0-5%
5-10%10-15%
15-20%20-25%
25-30%
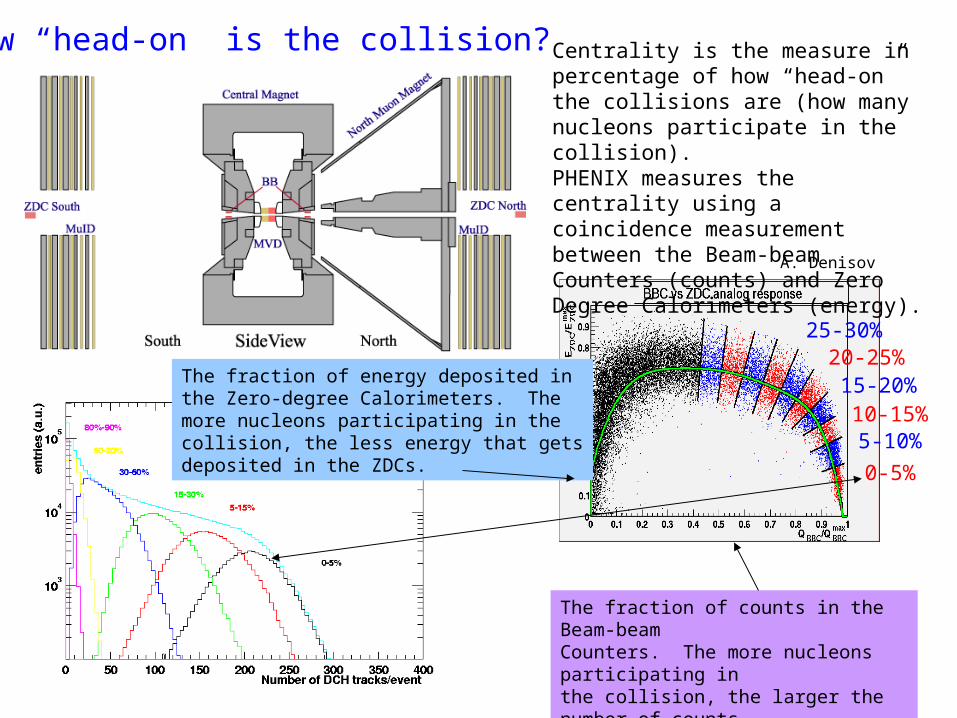
Centrality is the measure in percentage of how “head-on” the collisions are (how many nucleons participate in the collision).PHENIX measures the centrality using a coincidence measurement between the Beam-beam Counters (counts) and Zero Degree Calorimeters (energy).
How “head-on” is the collision?
The fraction of counts in the Beam-beam Counters. The more nucleons participating in the collision, the larger the number of counts recorded in the BBCs.
A. Denisov
The fraction of energy deposited in the Zero-degree Calorimeters. Themore nucleons participating in thecollision, the less energy that getsdeposited in the ZDCs.
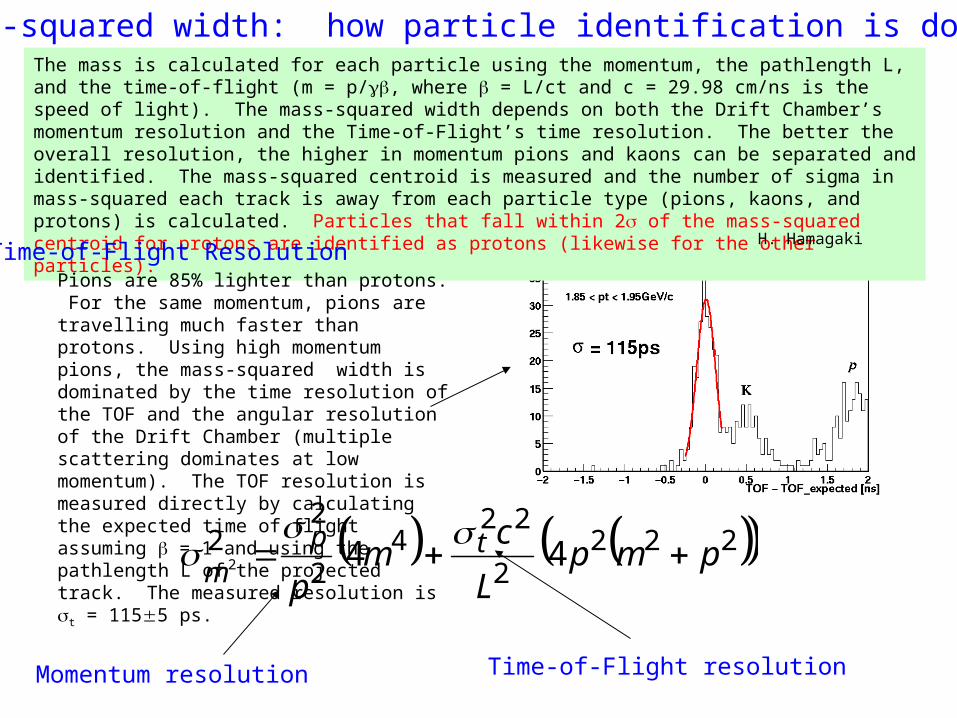
The mass is calculated for each particle using the momentum, the pathlength L, and the time-of-flight (m = p/, where = L/ct and c = 29.98 cm/ns is the speed of light). The mass-squared width depends on both the Drift Chamber’s momentum resolution and the Time-of-Flight’s time resolution. The better the overall resolution, the higher in momentum pions and kaons can be separated and identified. The mass-squared centroid is measured and the number of sigma in mass-squared each track is away from each particle type (pions, kaons, and protons) is calculated. Particles that fall within 2 of the mass-squared centroid for protons are identified as protons (likewise for the other particles).
Pions are 85% lighter than protons. For the same momentum, pions are travelling much faster than protons. Using high momentum pions, the mass-squared width is dominated by the time resolution of the TOF and the angular resolution of the Drift Chamber (multiple scattering dominates at low momentum). The TOF resolution is measured directly by calculating the expected time of flight assuming = 1 and using the pathlength L of the projected track. The measured resolution is t = 1155 ps.
The mass-squared width: how particle identification is done.
2222
224
2
22 442 pmp
L
cm
ptp
m
H. Hamagaki
Momentum resolution Time-of-Flight resolution
Time-of-Flight Resolution
pm
2
2
21
1
Kp
Kpmsp
11
2
2
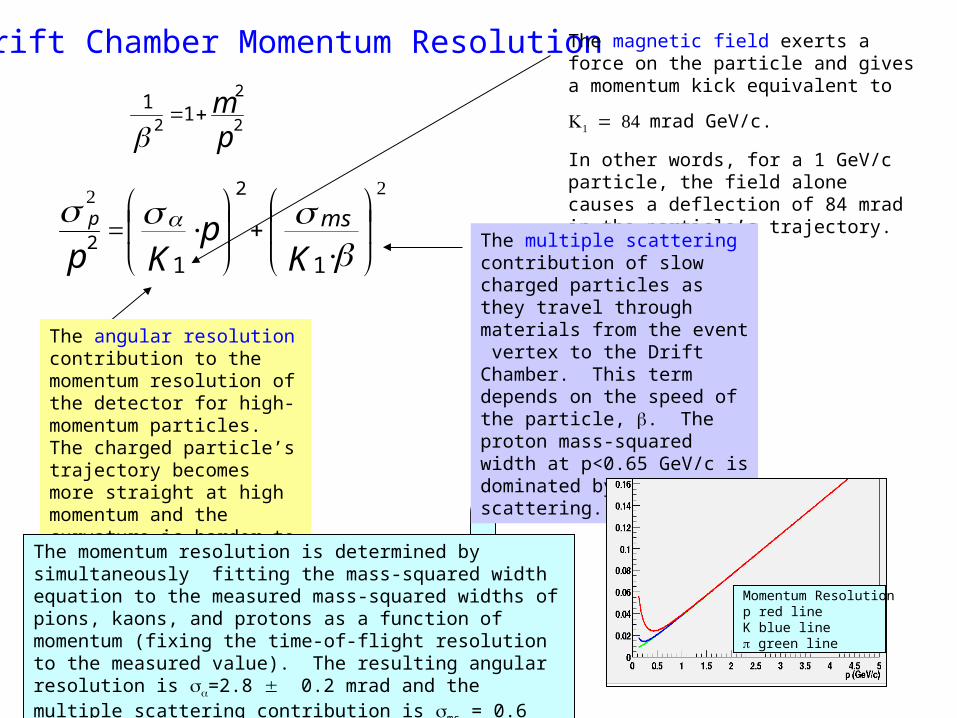
Drift Chamber Momentum Resolution The magnetic field exerts a force on the particle and gives a momentum kick equivalent to
mrad GeV/c.
In other words, for a 1 GeV/c particle, the field alone causes a deflection of 84 mrad in the particle’s trajectory.
The multiple scattering contribution of slow charged particles as they travel through materials from the event vertex to the Drift Chamber. This term depends on the speed of the particle, . The proton mass-squared width at p<0.65 GeV/c is dominated by multiple scattering.
The angular resolution contribution to the momentum resolution of the detector for high-momentum particles. The charged particle’s trajectory becomes more straight at high momentum and the curvature is harder to measure.
The momentum resolution is determined by simultaneously fitting the mass-squared width equation to the measured mass-squared widths of pions, kaons, and protons as a function of momentum (fixing the time-of-flight resolution to the measured value). The resulting angular resolution is =2.8 0.2 mrad and the multiple scattering contribution is ms = 0.6 (0.1) mrad GeV/c.
Momentum Resolutionp red lineK blue line green line
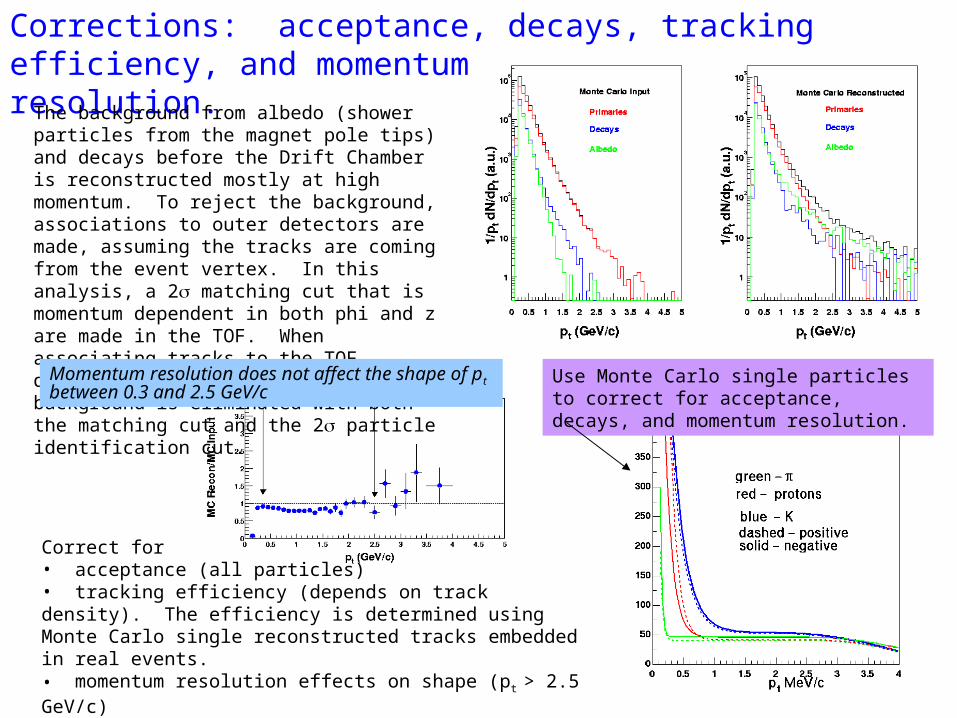
Correct for• acceptance (all particles)• tracking efficiency (depends on track density). The efficiency is determined using Monte Carlo single reconstructed tracks embedded in real events.• momentum resolution effects on shape (pt > 2.5 GeV/c)• background (albedo and decays pt<1 GeV/c for pions and kaons)
Corrections: acceptance, decays, tracking efficiency, and momentumresolution.
The background from albedo (shower particles from the magnet pole tips) and decays before the Drift Chamber is reconstructed mostly at high momentum. To reject the background, associations to outer detectors are made, assuming the tracks are coming from the event vertex. In this analysis, a 2 matching cut that is momentum dependent in both phi and z are made in the TOF. When associating tracks to the TOF detector, most of the high momentum background is eliminated with both the matching cut and the 2 particle identification cut.
Use Monte Carlo single particles to correct for acceptance, decays, and momentum resolution.
Momentum resolution does not affect the shape of p t between 0.3 and 2.5 GeV/c

All negative charged tracks (open symbols) as measured in the Drift Chamber and Pad Chambers (h-) compared to the total sum of negative pions, kaons, and anti-protons (from functional fits to the spectra on the left) using the TOF for particle identification.
pT (GeV/c) pT (GeV/c)
Transverse momentum spectra of pions, kaons, and protons.
Protons can be identified up to 4 GeV/c in transverse momentum (pt). The pions and kaons can be separated up to 2 GeV/c. The pion and proton spectra are quite different in shape.
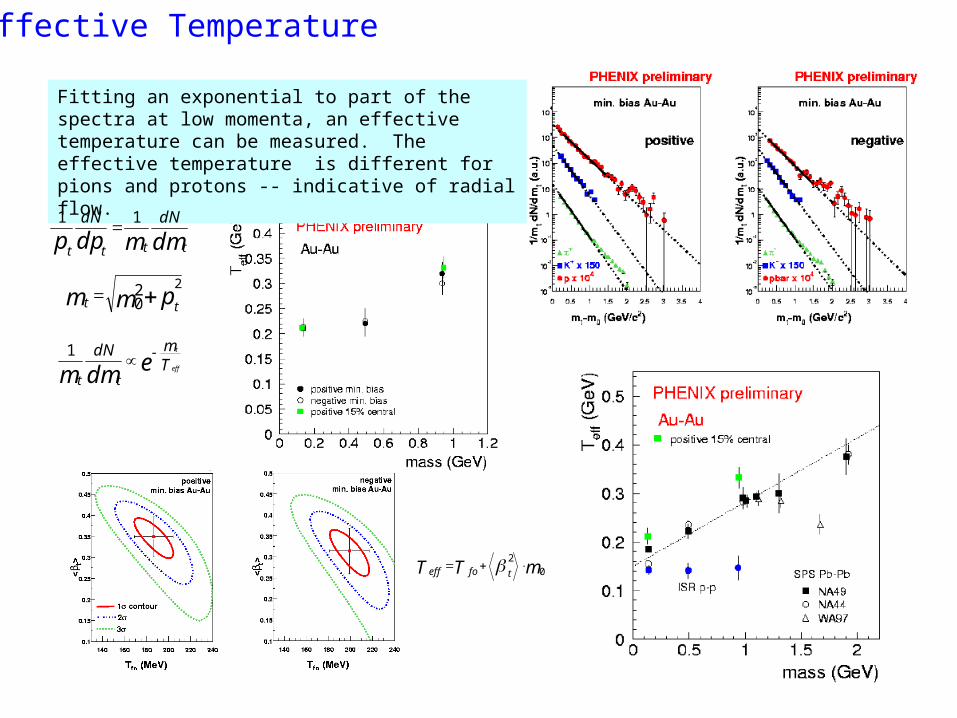
Fitting an exponential to part of the spectra at low momenta, an effective temperature can be measured. The effective temperature is different for pions and protons -- indicative of radial flow.
Effective Temperature
pmm tt 20
2
dmmdpp tttt
dNdN 11
edmm TmdN
eff
t
tt
1
mTT tfoeff 02
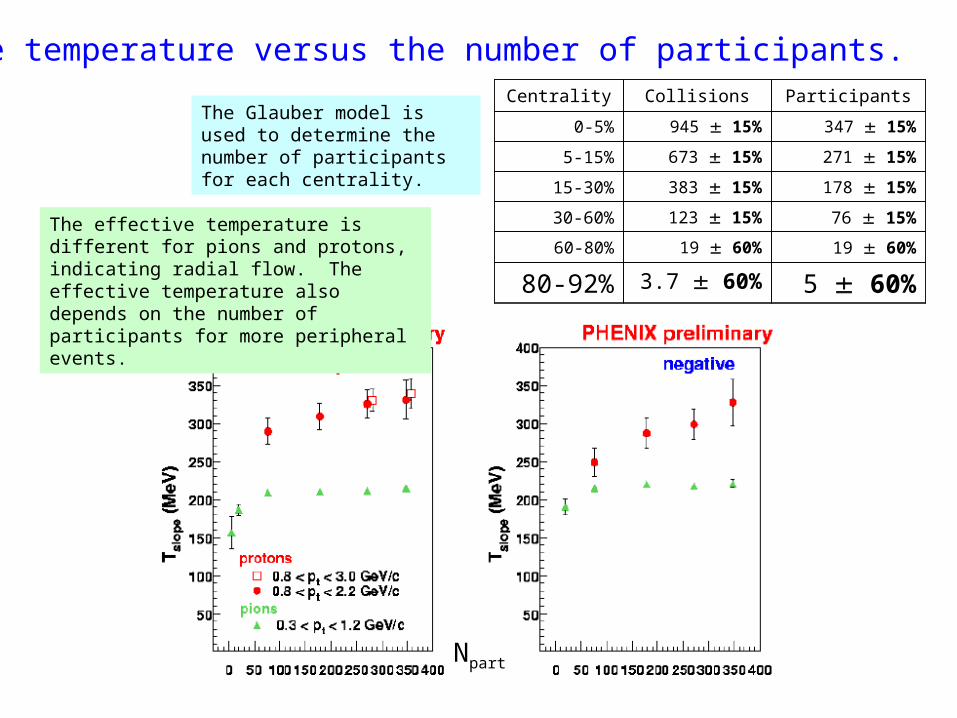
The effective temperature is different for pions and protons, indicating radial flow. The effective temperature also depends on the number of participants for more peripheral events.
5 60%3.7 60%80-92%
19 60%19 60%60-80%
76 15%123 15%30-60%
178 15%383 15%15-30%
271 15%673 15%5-15%
347 15%945 15%0-5%
ParticipantsCollisionsCentrality
Effective temperature versus the number of participants.
The Glauber model is used to determine the number of participants for each centrality.
Npart

The shape of transverse momentum spectra.
The pt spectra can be described in shape by either exponentials (higher centralities) or power-law functions (more peripheral collisions). Collective motion from multiple rescattering of particles at freeze-out (whenthe particles no longer interact later in the collision) dominates the spectra at low p t for the most central collisions. Hard scattering and other hard processes occurring earlier in the collision dominate the spectra at high p t.
More exponentialMore concave
Npart
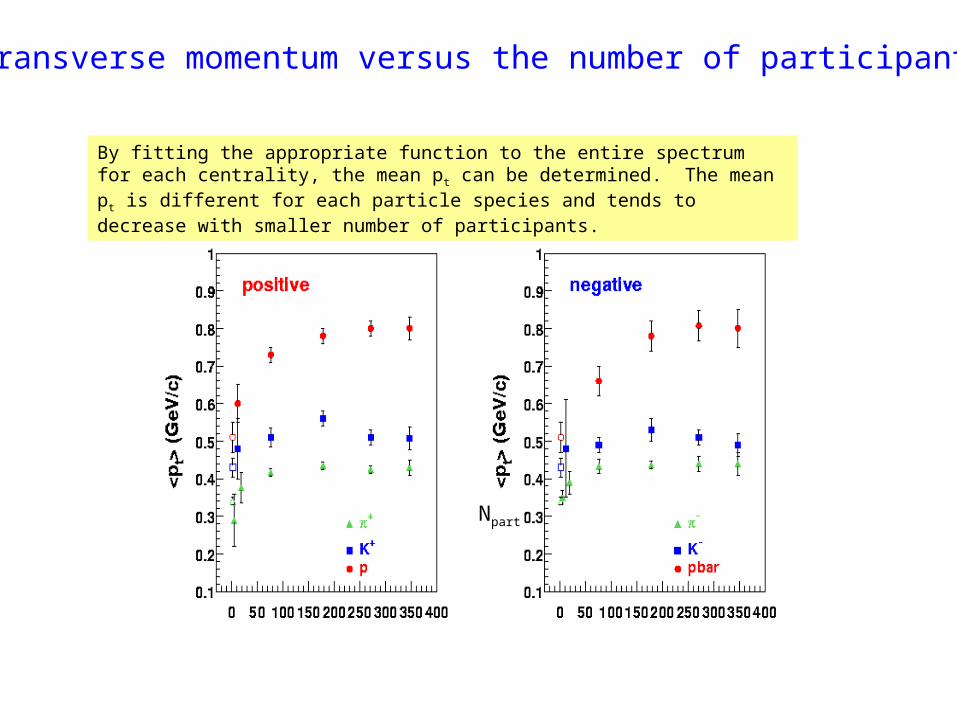
By fitting the appropriate function to the entire spectrum for each centrality, the mean p t can be determined. The mean pt is different for each particle species and tends to decrease with smaller number of participants.
Mean transverse momentum versus the number of participants.
Conclusion• Pions, kaons, and protons, have been measured in PHENIX in Au-Au collisions at 130 GeV center-
of-mass energy using the East-arm central tracking detectors and the Time-of-Flight detector for particle identification. The data are a subset of the Summer 2000 runs.
• The measured detector resolutions and mass-squared centroids are used to calculate the mass-squared widths as a function of momentum for particle identification. Pions and kaons can be separated out to 1.5 GeV/c in momentum using 2 momentum-dependent matching cuts to the TOF and 2 momentum-dependent particle identification cuts. The transverse momentum distributions are dominated by protons which are measured out to 4 GeV/c. The pion and proton spectra are quite different in shape.
• Event centrality is determined by using a correlation measurement between the Beam-beam counters and Zero-degree calorimeters. The transverse momentum spectra for pions appear to be more exponential in shape at momenta less than 1 GeV/c for the most central events and become more power-law in shape for the more peripheral.
• The Glauber model is used to determine the number of participants in each event centrality selection. Across participant number, the effective temperature is different for protons and pions. This dependence of temperature on particle mass indicates radial flow. The mean transverse momentum is also different for each particle type and appears to saturate with increasing participant number.
• All of these results are preliminary. The current systematic uncertainties are estimates and need to be determined more accurately. The statistics will improve when the entire Summer 2000 data are analyzed. These results were presented at the Quark Matter 2001 Conference at Stony Brook by J. Velkovska.