Embed Size (px)
Citation preview

International Journal of Computer Science & Information Technology (IJCSIT) Vol 7, No 2, April 2015
DOI:10.5121/ijcsit.2015.7214 159
EMOTION INTERACTION WITH VIRTUAL REALITY
USING HYBRID EMOTION CLASSIFICATION
TECHNIQUE TOWARD BRAIN SIGNALS
Faris A. Abuhashish1, Jamal Zraqou2, Wesam Alkhodour2, Mohd S. Sunar1 and Hoshang Kolivand1
1Magicx, Universiti Teknologi Malaysia, Johor Bahru, Malaysia2Department of Multimedia, Isra University, Amman, Jordan
ABSTRACT
Human computer interaction (HCI) considered main aspect in virtual reality (VR) especially in the context of emotion, where users can interact with virtual reality through their emotions and it could be expressed in virtual reality. Last decade many researchers focused on emotion classification in order to employ emotion in interaction with virtual reality, the classification will be done based on Electroencephalogram (EEG) brain signals. This paper provides a new hybrid emotion classification method by combining self-assessment, arousal valence dimension and variance of brain hemisphere activity to classify users’ emotions. Self-assessment considered a standard technique used for assessing emotion, arousal valence emotion dimension model is an emotion classifier with regards to aroused emotions and brain hemisphere activity that classifies emotion with regards to right and left hemisphere. This method can classify human emotions, two basic emotions is highlighted i.e. happy and sad. EEG brain signals are used to interpret the users’ emotional. Emotion interaction is expressed by 3D model walking expression in VR. The results show that the hybrid method classifies the highlighted emotions in different circumstances, and how the 3D model changes its walking style according to the classified users’ emotions. Finally, the outcome is believed to afford new technique on classifying emotions with feedback through 3D virtual model walking expression.
KEYWORDS
3D Virtual Model, Virtual Reality, Walking, BCI, Emotion .
1. INTRODUCTION
Adding emotions to HCI interaction, makes it more enchanting and life like. Emotions play an important role in our daily life the same as HCI applications. To accomplish this in an effective way, we need to dive into the player’s emotion. Brain computer interface (BCI) is a device that gives an in-depth inside view of the player’s emotion and synchronizes this emotion with a 3D VH simultaneously. The literature on BCI control suggests it as new interaction technology for common and simple game within the entertainment domain in VR. BCI has been proposed by [1] to be used as main interaction device by both normal and disabled people. [2] uses emotions to enhance the interaction with games in VR. [3] portray the used of emotion in interaction process, and revealed the latest techniques used to classify human emotions. [4] [5] [6] classified human emotion based on EEG signals along with arousal valence dimension model, they classified eight emotions toward with emotional model. [7] achieved the highest classification rate using emotion self-assessment classification technique, meanwhile, [8] and [9] have recognized and classified human emotion based on brain hemisphere activity variance, they determined a new approach for

International Journal of Computer Science & Information Technology (IJCSIT) Vol 7, No 2, April 2015
160
emotion classification based on brain hemisphere activity. This use of interaction technology opens new promising trends in virtual world, entertainment and educational areas. In this regard, emotion classification based on EEG signals is also a new development in forms of human digital media interaction related to mental activity. The results were applied for synchronizing and interacting 3D virtual humans’ through emotion walking.
2. RELATED WORK
Human emotions are expressed by human behaviours that rapidly changes due to their circumstances, with regard to human behaviour, a certain emotional expression for a 3D virtual human has been created, e.g. happiness, anger, relaxation or sadness [10]. Previous works on emotional expressions involve numerous units of action without focusing on emotion level [11]. Many researchers implemented emotion within a specific part of 3D virtual humans e.g. face [12]. [8] and [9] have recognized and classified human emotion based on brain activity and hemisphere variance, they determined a new approach for emotion classification based on brain hemisphere activity. According to [1] [14] [15] and [16] each induced emotion is directly linked with both right and left hemispheres that result emotion, a negative evoked emotion comes when more active on right frontal lobe meanwhile a positive evoked emotion produces when more active left frontal lobe. And they recognized six basic emotion namely happy, sad, angry, disgust, fear and surprise. They computed the activity variance between both hemispheres in the context of emotion.
Meanwhile, the self-assessment evaluation process reveals additional details and avoids verbal emotions description. Representations of emotion space have been identified since long time [17], however regarding the simplicity purpose, most todays’ research is carried out based on categorical representations of human emotion [18]. [19] classified emotion based on self-assessment technique i.e. self-assessment manikins (SAM).
Furthermore, According to [20] emotional models have been suggested as a technique for emotion classification process. Emotional models are highly coupled with the emotional self-assessment and emotional brain activity since all the previous researches depends on the arousal valence dimensions, which is in turn the basis of dimensional model [20]. [5] [6] classified eight basic emotions along with emotional dimensional model such as happy, fear, sad, disgust, frustrated, angry, surprize and exited, they classified the emotions based on EEG signals. The emotional dimensional model used is based on Circumplex assumption [2].
According to [2] [21] [23], BCI can be very suitable interfacing tool for controlling 3D virtual humans’ animation in the virtual reality environment. Furthermore, the present research depends on the brain data signals to represent and implement a specific inner human emotion in VR, as an example of such implementation is 3D virtual human emotion walking style.
BCI research has recently gained an enormous popularity [21]. BCI has been adopted in a wide range of real-time applications such as virtual medical systems and video games [21]. This adaptation of BCI provides beneficial and new explorations of technology to transfer user feelings into the virtual environment. BCI has the advantage of having access to brain activities thus providing significant insights into the user's feeling status [21] to be studied, analysed and implemented as well. The brain-computer interface technology allows a direct connection between the users and VR without any muscular activities [24] [25].
This technology promises wide vision for disabled people. BCI applications have focused on the control of wheelchairs [26] as well as virtual game environments, and they have been successfully employed in the gaming industry [2] [27] [28]. BCI has numerous applications in medicine, e.g.

International Journal of Computer Science & Information Technology (IJCSIT) Vol 7, No 2, April 2015
161
prosthesis control or biofeedback therapy for the treatment of neurological disorders [29]. On the other hand, BCI is employed in virtual reality video games to control them using brain signals rather than traditional controllers (e.g., keyboard, mouse, and joystick) by both healthy and disabled people. Nowadays, full body interaction with 3D virtual game in the context of emotion is becoming the new trend [30].
3. METHODOLOGY
In order to interact with VR through users’ emotions, emotions should be classified. Then show the interaction feedback through 3D virtual human walking expression emotionally. Thus a hybrid emotion classification method is proposed in order to improve emotion classification. To achieve the main objective of this research, four phases are illustrated in the methodology that stated in this section, see figure 1. The main four phases are pre-processing, hybrid emotion classification, emotion mapping and 3D virtual human emotion walking.
Figure 1. Research Methodology.
Prepare the obtained emotional data by extract emotion features, and then classify the extracted emotions through implement the proposed method. Furthermore, map the classified emotion to be ready to synchronize with 3D virtual model. Eventually, load the game engine of 3D virtual humans’ walking model, and interact with a user by using mind controller. Thereafter, as a final step, the feedback that shows a 3D virtual human emotion walking expression will be generated with a full natural interaction.
Figure 2 illustrates the process of render the 3D virtual human model based on users’ emotion interaction. In emotion mapping and synchronizing, the system will map a certain emotion based on the proposed classification method.
Figure 2. Render 3D virtual human model.

International Journal of Computer Science & Information Technology (IJCSIT) Vol 7, No 2, April 2015
162
4. METHODS AND MATERIALS
4.1 Pre-processing
Higuchi Fractal Dimension-based: In the year of 1988 a Japanese scientist proposed an effective algorithm in order to measure the discrete time sequencing fractal dimension FD [31]. It analyses and computes a FD through different time fragment series. And since an EEG is based on time series and nonlinear, so we applied the Higuchi FD in order to analyse it. In [32] researchers Stated that the Higuchi fractal dimension has been used before in order to study brain signals which are known as EEG signals. We apply Higuchi FD in our experiment in order to analyse the EEG signals, and thus resulting distinguished emotions. As we mentioned Higuchi’s algorithm computes the FD directly from time series. As the reconstruction of the attractor phase space is not necessary.
Given a one dimensional time series
X = x[1], x[2], … , x[N]
the algorithm to compute the HFD can be described as follows [33]:
Phase 1: Select one value of k.
Phase 2: Create the sub-series mkx from the EEG series as following
Where k and m are integer numbers, k and m represent the initial time interval width and [ ] denotes the integer part. Supposing that the series has only N = 100 elements, the following are the only three subsets that can be obtained for k = 3,
Then, every length of each sub-series mkx is computed. Length Lm(k) of m
kx is equal to
Phase 3: Compute the average length L(k) of all Lm(k).Phase 4: Repeat step 1 to 3 for numerous values of k.Phase 5: Slope of the curve of ln(L(k)) versus ln(k) is approximated.
Feature Extraction The statistical feature Mode [Mo] to extract emotion features. This Mo value gives the value that occurs most frequently in data channel. The Mode [Mo] is the value
International Journal of Computer Science & Information Technology (IJCSIT) Vol 7, No 2, April 2015
163
that appears most often in a set of data of the channels. It is considered a way of expressing a single number that should exist in the arousal valence emotional space. That maps the real human emotion.
0. x = EEG Data from Channels T7 & T8.1. sort(x).2. y = sort(x)3. z = diff([y; realmax])4. w = find (z > 0)5. indices = w , this statement where repeated value change6. b = diff([0; indices])7. k = max (b)8. [modeL,i] = k , longest persistence length of repeated values9. mode = y(indices(i))
First the statistical feature Mode [Mo] algorithm sorts the EEG data that processed by Higuchi algorithm in an ascending order (step 2). Then, the sorted data is indexed (step 4), afterwards the positive sorted values that appears most often is assigned to “indices” variable (step 6). Then the discrete derivative of “indices” set is calculated (step 10), determining the location of maximum of derivative (step 8). And at the end, the sorted data at the position of the maximum occurs is assessed, which will be with the endmost element of the expanded frequent values (step 10). This implies to the most mental activity that expresses the emotion.
4.2 Brain Computer Interface
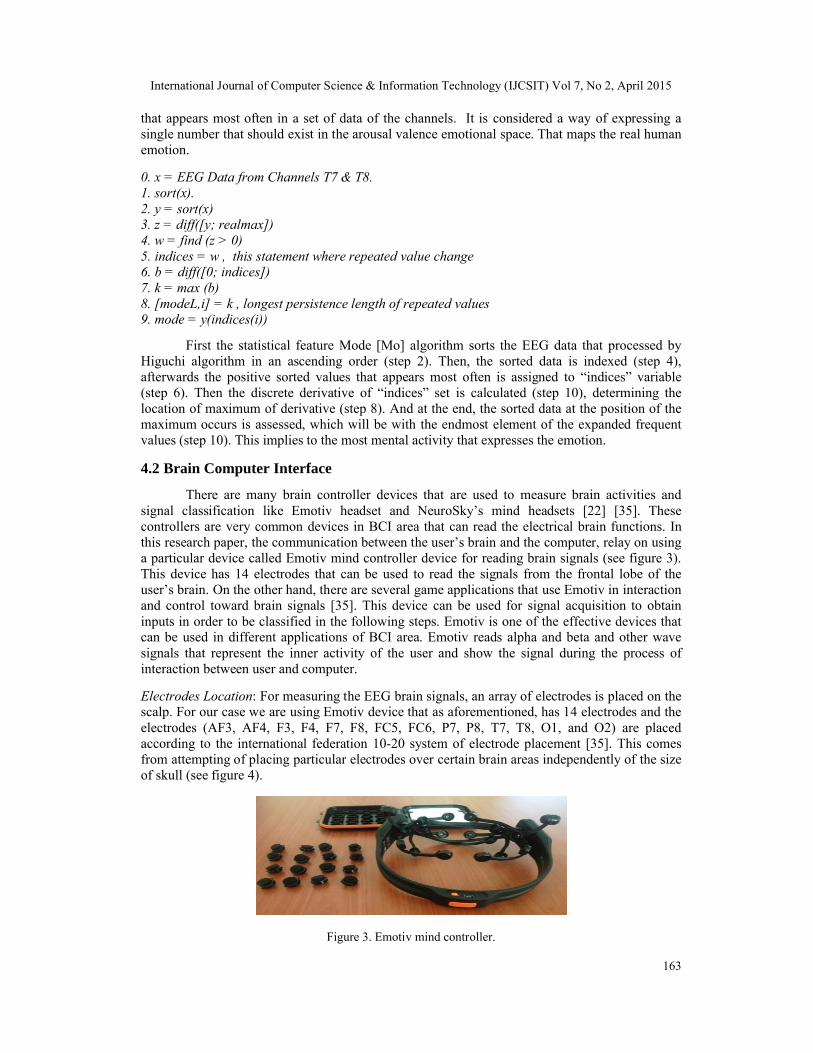
There are many brain controller devices that are used to measure brain activities and signal classification like Emotiv headset and NeuroSky’s mind headsets [22] [35]. These controllers are very common devices in BCI area that can read the electrical brain functions. In this research paper, the communication between the user’s brain and the computer, relay on using a particular device called Emotiv mind controller device for reading brain signals (see figure 3). This device has 14 electrodes that can be used to read the signals from the frontal lobe of the user’s brain. On the other hand, there are several game applications that use Emotiv in interaction and control toward brain signals [35]. This device can be used for signal acquisition to obtain inputs in order to be classified in the following steps. Emotiv is one of the effective devices that can be used in different applications of BCI area. Emotiv reads alpha and beta and other wave signals that represent the inner activity of the user and show the signal during the process of interaction between user and computer.
Electrodes Location: For measuring the EEG brain signals, an array of electrodes is placed on the scalp. For our case we are using Emotiv device that as aforementioned, has 14 electrodes and the electrodes (AF3, AF4, F3, F4, F7, F8, FC5, FC6, P7, P8, T7, T8, O1, and O2) are placed according to the international federation 10-20 system of electrode placement [35]. This comes from attempting of placing particular electrodes over certain brain areas independently of the size of skull (see figure 4).
Figure 3. Emotiv mind controller.

International Journal of Computer Science & Information Technology (IJCSIT) Vol 7, No 2, April 2015
164
Figure 4: The 10-20 system of electrode placement.
As illustrated in figure 4, letters and numbers are the basis of the naming system, while the letters express the lobe and the numbers express the location of hemisphere. The F letters illustrates the frontal lobe, Temporal lobe uses letter T, central lobe uses letter C, partial lobe uses letter P and occipital lobe uses letter O. As for the numbers, the odd numbers indicate the left hemisphere while right hemisphere is indicated by the even numbers. Z letter indicates the electrode located on the midline. The nearer position to the midline is indicated by the smaller numbers. Front polar is indicated by Fp. The point between the nose and forehead is Nasion. The bump placed at the back of the skull is Inion. While put the electrode on the scalp there will be space, this space should be filled by conductive gel, which is considered as medium to ensure the excellent conductivity and lowering the impedance of contact at the interface of the electrode-scalp.
4.3 Hybrid Emotion Classification Technique
Human emotions expressed by human behaviors that rapidly changes due to the user circumstances. Emotion is an intellectual and physiological situation that works together which shows the related behavior, sensitivity, and beliefs [36]. [37] used emotional dimensional model in order to recognize human emotion. They classified the emotion based on arousal/valence emotional model that is related to emotional dimensional model. They stated that based on [38] the arousal/valence levels are standard 2D emotion model that can be used to classify human emotions. [39] has proposed a self-assessment emotion classification technique, it is a non-verbal emotion assessment technique that measures human emotion directly that related to arousal and valence. Thus, it is directly mapped with arousal valence emotional model. The self-assessment emotion classification technique is easy to use and inexpensive regarding to assess and classify human emotion in many different scenarios.
According to [40] six basic emotions is recognized and classified using brain activity based on hemisphere activity indicator. These emotions namely fear, sad, happy, angry, disgust and surprized. An improvement on emotion classification with combination of three techniques has been proposed in this research, the proposed method is hybrid emotion classification method, a scheme of the method shown in figure 5.

International Journal of Computer Science & Information Technology (IJCSIT) Vol 7, No 2, April 2015
165
Figure 5. Hybrid emotion classification technique.
4.3.1 Emotion Dimension Model
[41] Proposed emotional dimensional model and used by most of researchers regarding emotion classification. He states that sad emotion has low Y value that expressed by arousal and high Negative (-X) value, see Figure 6.
Figure 6 Emotional Model (Circumplex model of affect-emotion)
According to Circumplex emotional model, emotion has certain characteristics that can be used as a comparative parameter during the classifying process. The potential characteristics of emotion illustrated in Table 1.
Table 1: Emotion Classifying Result based on Circumplex Emotional Model

International Journal of Computer Science & Information Technology (IJCSIT) Vol 7, No 2, April 2015
166
Human emotions are expressed through human behaviors that rapidly changing due to the surrounded circumstances. Emotion is a state of intellectual and physiological situation that work together through behavior, sensitivity and believes [36]. Many researchers classify emotion with sensitivity. They also adopt that emotion occur automatically, on the other hand sensitivity more performance as the independent involvement of emotion.
According to [42] emotional models have been suggested as a technique for emotion classification process. Emotional models are highly coupled with the emotional self-assessment and emotional brain activity since all the previous researches depends on the arousal valence dimensions, which is in turn the basis of dimensional model. One of the prominent emotional models is the dimensional view model.
Circumplex emotion model: A multi dimensions emotions model, each emotion distributed among the multidimensional scale. Emotional valence is the first dimension that consists of two opposite sides, the positive on one side meanwhile the negative on the opposite side. Meanwhile on the second dimension expresses the arousal, starting by calm ending with the excited (see Figure 6). According to [43], most of studies used this model as an emotion classifier due to its universality and simplicity.
[44] [42] [45] classified human emotion based on EEG signals along with emotional dimensional model. They classified eight emotions toward with emotional model. The classified emotions are happy, fear, sad, disgust, frustrated, angry, surprize and exited.
As mentioned and explained before, all stimuli are already ranked and rated based on arousal valence, so in this context the calculations are done based on these arousal valence rating. Here in this subsection the calculations done based on the collected data that is extremely correlated with the self-assessment.
A normalized arousal valence score is computed through taking the mean rating divided by the standard deviation,
(4)
Afterward, for every quadrant in the normalized arousal valence space, the audio video stimuli that stimulus the happy and sad emotion is clearly determined and it lies at close quarters to the extreme corner of the quadrant. Figure 7 illustrates each audio video rating score with the selected emotion that is highlighted in blue for happy and brown for sad. The stimuli whose rating was at close quarters to the extreme corner of each quadrant is explicitly mentioned.
Figure 7. Happy and Sad Emotion based on Arousal Valence Model.

International Journal of Computer Science & Information Technology (IJCSIT) Vol 7, No 2, April 2015
167
At the end the selected stimuli to induce the happy and sad emotions restricted within the four quadrants of the arousal valence space High Arousal High Valence, Low Arousal Low Valence, High Arousal Low Valence and Low Arousal High valence (HAHV, LALV, HALV, LAHV). Based on the result of dividing the arithmetic mean rating divided by the standard deviation, every emotion is deduced falls within one of the corners’ quadrant. With regards to the main emotion used in this research i.e. happy and sad and stimuli that used as well, the happy emotion falls within the High Arousal High Valence (happy HAHV) quarter meanwhile sad emotion falls in Low Arousal Low Valence (sad LALV) quarter of the quadrant (see figure 8).
Figure 8. Happy and Sad Emotions that fall the Quadrant of Emotional Model.
Wilcoxon signed-rank test showed that high arousal and low arousal stimuli induced deferent valence ratings (p < 0.0001 and p < 0.00001). Likewise high and low valence stimuli induced deferent arousal ratings (p < 0.0001 and p < 0.00001) [46]. This rating helps to define the emotion classification intervals.
4.3.2 Emotional Self-Assessment
A two basic discrete and labelled emotion categories is generated, e.g. Ekman’s representation happy and sad. This is a significant and expressive constraint that taking into consideration the continuous human emotion spectrum for both with respect to specificity and intensity. Furthermore, it has been proved that the labelling agreement of human emotion is relatively poor, mostly by reason of the fact that each person has different understanding human emotional descriptions.
Consequently the proposed hybrid method is basically consists of self-assessment technique which considered a basis of human emotion distinguish. It depends on multidimensional human emotion space approach that avoids the mentioned emotion understanding obstacles. In the context of human emotion representation, two predefined of human emotion dimensions is the basis of spanning human emotion i.e. arousal and valence. Evaluators, as a result, have to decide on the value for each emotion of these human emotion units.
The self-assessment evaluation process reveals additional details and avoids verbal emotions description. Representations of emotion space is identified since long time [47], however regarding the simplicity purpose, most todays’ research is carried out based on categorical representations of human emotion [48].
Thus, this research uses arousal valence axes of emotional dimensional model which proposed by [49]. Arousal specifies the level of excitation i.e. low versus high. Whilst, valence portrays the emotion strength in term of negative or positive. Transmutation process in order to separate classes of emotion is feasible by merely specifying subspaces of human emotion space.
International Journal of Computer Science & Information Technology (IJCSIT) Vol 7, No 2, April 2015
168
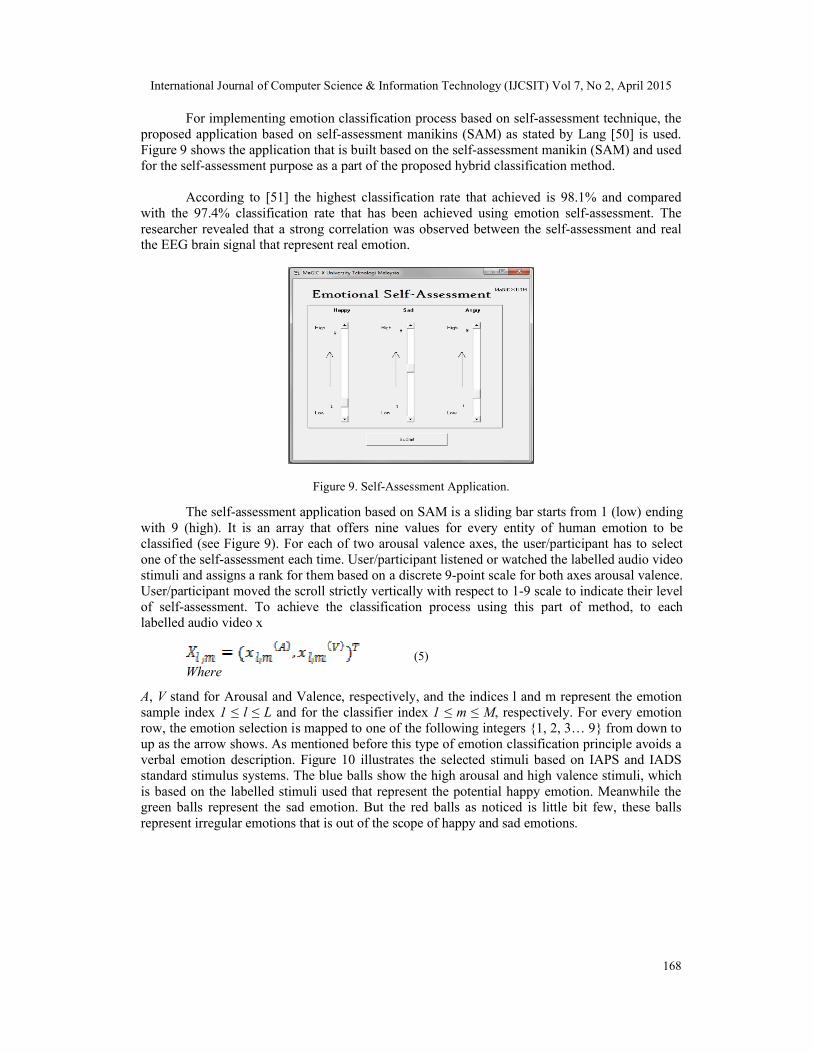
For implementing emotion classification process based on self-assessment technique, the proposed application based on self-assessment manikins (SAM) as stated by Lang [50] is used. Figure 9 shows the application that is built based on the self-assessment manikin (SAM) and used for the self-assessment purpose as a part of the proposed hybrid classification method.
According to [51] the highest classification rate that achieved is 98.1% and compared with the 97.4% classification rate that has been achieved using emotion self-assessment. The researcher revealed that a strong correlation was observed between the self-assessment and real the EEG brain signal that represent real emotion.
Figure 9. Self-Assessment Application.
The self-assessment application based on SAM is a sliding bar starts from 1 (low) ending with 9 (high). It is an array that offers nine values for every entity of human emotion to be classified (see Figure 9). For each of two arousal valence axes, the user/participant has to select one of the self-assessment each time. User/participant listened or watched the labelled audio video stimuli and assigns a rank for them based on a discrete 9-point scale for both axes arousal valence.User/participant moved the scroll strictly vertically with respect to 1-9 scale to indicate their level of self-assessment. To achieve the classification process using this part of method, to each labelled audio video x
(5)Where
A, V stand for Arousal and Valence, respectively, and the indices l and m represent the emotion sample index 1 ≤ l ≤ L and for the classifier index 1 ≤ m ≤ M, respectively. For every emotion row, the emotion selection is mapped to one of the following integers {1, 2, 3… 9} from down to up as the arrow shows. As mentioned before this type of emotion classification principle avoids a verbal emotion description. Figure 10 illustrates the selected stimuli based on IAPS and IADS standard stimulus systems. The blue balls show the high arousal and high valence stimuli, which is based on the labelled stimuli used that represent the potential happy emotion. Meanwhile the green balls represent the sad emotion. But the red balls as noticed is little bit few, these balls represent irregular emotions that is out of the scope of happy and sad emotions.

International Journal of Computer Science & Information Technology (IJCSIT) Vol 7, No 2, April 2015
169
Figure 10. Selected Stimuli.
Since the research focuses on happy and sad emotions, so implicitly it concerns on high arousal with positive valence, and low arousal with negative valence for elicited emotions, the statistical Mean is implemented based on the computed fractal value in order to compute the self-assessment value, and then compare it with computed value of the FD with the Mode of the EEG brain signals that represent the emotion. The level of arousal might be known through various electrode locations. Regarding recognition of the arousal level the T7 and T8 was chosen based on the computed values of the fractal dimension, which proofed better difference in the level arousal compared to rest of channels [52].
4.3.3 Variance of Brain Hemisphere Activity
The third technique of the hybrid classification method is analyzing the brain hemisphere activity. According to [53] [54], each brain hemisphere (right and left) specialized to different emotions classes i.e. happy and sad. In [55], the experiment of which was to stimulate two classes of emotion of happiness and sadness through the audio-visual stimuli, they stated that the brain activity of left hemisphere recorded a high increase markedly compared with negative emotions.[56] and [57] recognized and classified human emotion based on brain hemisphere activity variance, they determined a new approach for emotion classification based on brain hemisphere activity. Figure 11 illustrates the variance between left frontal lobe and right frontal lobe. The orange and yellow colors illustrate the activity region of the brain meanwhile the white blue color illustrates the Inactive region.
Figure 11 a. Active Left Hemisphere; b. Active Right Hemisphere.
According to [58] [59] [60] and [61] each induced emotion directly linked of both right and left hemispheres that result emotion. A negative evoked emotion comes when more active on right frontal lobe meanwhile a positive evoked emotion produces when more active left frontal

International Journal of Computer Science & Information Technology (IJCSIT) Vol 7, No 2, April 2015
170
lobe. And they recognized six basic emotion namely happy, sad, angry, disgust, fear and surprise. They computed the activity variance between both hemispheres in the context of emotion.
In order to compute the variance between the hemispheres left and right, the computation will be done on emotional valence that is focuses on the both brain hemispheres activity difference. In this research the main channels used to read human emotion is T7 and T8 (see figure 12). Figure 12 illustrates location of channels T7 and T8 using Emotiv device based on 10-20 electrode location system. However, to be able to classify the emotion through analyzing the brain hemisphere activity a normalized Mean is calculated for each T7 and T8 channel and then compute the Mean difference between the channels.
Figure 12 T7 and T8 Located in Both Hemispheres.
The Mean for each T7 & T8 channels will be as follows:
The recorded EEG signals designated X and Xn, where it represents the value of nth raw signal sample.
WhereN = 1024 (1024 samples corresponds to 5 sec of EEG recording).
(6)
For each channel of the T7 & T8 pair that represent the hemispheric brain activity in term of emotion a Mean value is separately computed. Then the computed value for each channel will compared in order to check which brain hemisphere is more active. Based on previous researches that have been done by [58] [59] [56] [57] and [60], the high computed Mean value positively correlated with the more active hemisphere. After computing the mean value for each T7 & T8 pair channel, the difference between each Mean is computed. The equation that represents the T7 & T8 pair channel Mean difference as follows:
(7)Where
MMC represents the maximum Mean of T7 & T8 channels, , is the computed Mean of each T7 & T8 channels. The computed maximum Mean channel value determines the potential part of hemisphere. That’s in turn determines which part is active and vice versa. As aforementioned, a negative evoked emotion generated when more active on right hemisphere T8, meanwhile a positive evoked emotion produced when more active left hemisphere T7. To achieve this goal, the actual data collected from the participant is tested for each T7 and T8, and then compute the max value for each participant in the context of the highlighted pair channels.

International Journal of Computer Science & Information Technology (IJCSIT) Vol 7, No 2, April 2015
171
4.3.4 Correlation of Self-Assessment, Emotional Model and Hemisphere Activity
For in-depth study and scrutiny of correlation between the computed fractal dimension values of the EEG signals, computed value of the hemisphere activity and self-assessment. In the context of the statistical correlation, the Pearson correlation coefficient (see equation 4.13) between the changes of power of brain activity and self-assessment is computed with related to arousal valence dimension. Pearson correlation is used to measure the strength of a linear association between hemisphere activity and self-assessment with related to arousal valence emotion dimension. The potential result lies in interval between 1 and -1, where the value r = 1 means a perfect positive correlation and the value r = -1 means a perfect negative correlation. Thus, this correlation computation has been used to find out whether a high activity of the left hemisphere and happy emotion are correlated. is computed from:
(8)
Where represent hemisphere activity and self-assessment respectively, meanwhile represents the computed Mean value for hemisphere activity and self-assessment. The
research follows a reference for the p-value map that considered as the informal p-value interpretation, which is based on about 10% level of significance, it as follows:
p 0.01 : very strong presumption against null hypothesis0.01 p 0.05 : strong presumption against null hypothesis0.05 p 0.1 : low presumption against null hypothesisp 0.1 : no presumption against the null hypothesis
Moreover, implementing the proposed hybrid emotion classification method accomplishes the main objective of this research.
4.4 Emotion Mapping
At the end and after classification process, a mapping mathematical formula has been created in order to map the classified emotion, then to synchronize the mapped emotions with the synthesised 3D model. The ideal reproduction of the computed and analyzed value based on the proposed methods of features extraction and classification respectively was supposed to yield the Mode whose value made possible mapping to a certain emotion. At the end, 3D virtual humans walking model is ready to interact with a user using BCI based on emotion mapping.
In emotion mapping, the system maps the emotion based on the computed value of Mode [Mo]. The mapping process is done with regards to emotion walking style. The result of the mapping process is implemented the 3D virtual human model. The flowchart in figure 13 shows the 3D virtual human emotional walking rendering method based on emotion mapping process. Based on the defined parameter the emotion is mapped, then rendered and placed on the 3D virtual human model. In order to visualize and simulate the recognized human emotions, parameters representing the emotional state were defined and employed. The 3D virtual humans’ emotion walking is generated and simulated based on these parameters.
Proposed Emotion Mapping AlgorithmStep 1. Es =ΣT7, T8 →T7, T8 : happy, sad emotional signalsStep 2. x = Hfd(ES)Step 3. Mo = Mode(x)Step 4. Ew = Mo,0〈Mo < 2Step 5. If 1.5 <= Ew <= 2 Er = HappyStep 6. If 0 <= Ew < 1.5 Er = Sad

International Journal of Computer Science & Information Technology (IJCSIT) Vol 7, No 2, April 2015
172
WhereEs : Emotional signal
: Happy & Sad emotion signalsHfd : Higuchi fractal dimensionx : Computed value of Higuchi fractal dimension
: Computed mode value of Higuchi FD valueEw : Emotional walkingEr : Emotion rendering
Equations in steps 1 to 4 assign a new parameter for the emotional state from computed Mode [Mo] of Higuchi FD value. And in steps 5 to 6 the If statement will check the emotion parameter Ew in which interval lies and then assign the decision value to emotion rendering Er. The determined the emotional type has to be performed by the 3D virtual humans’ emotion walking (see figure 14).
According to [48] and [37], they defined interval based on stimulus ranking that describes the happy and sad emotions (see table 2). Any input lies within the defined interval, is map and determine the emotions. The happy emotion is the high arousal with also high valence so it considered [1.5, 2] and the sad emotion is the low arousal with the low valence which lies between [0, 1.4] (table 2). Finally any number lies within the mentioned intervals will map the desired emotion (see Figure 15).
Table 2 Happy and Sad Emotion Intervals.
Table 2 shows the intervals that considered reference for determining the happy and sad emotions lies in. For instance, if the Er equals happy, the 3D virtual humans’ will simulate the happiness in the walking animation style. The computation of emotional parameters for 3D virtual humans’ emotion walking depends on emotional signals analysis. The EEG signals is analysed using Higuchi fractal dimension then the statistical feature Mode [Mo] is computed based on result of Higuchi fractal dimension. Finally, assign the Mode [Mo] value to the emotional walking parameter to render the 3D virtual humans’ emotion walking model. Figure 14 illustrates test of rendering the emotional walking the defined equation.

International Journal of Computer Science & Information Technology (IJCSIT) Vol 7, No 2, April 2015
173
Figure 13 Emotion Mapping and Rendering Flowchart.
Figure 14 “Sad” & “Happy” emotional walking rendering

International Journal of Computer Science & Information Technology (IJCSIT) Vol 7, No 2, April 2015
174
4.5 Experiment Design
Twenty five healthy students of University Technology Malaysia in computer graphics and multimedia department, ranging between 20 – 35 years old have participated in our experiments. In the beginning the participants read the experiment procedure and aim. The participants should have had a relaxed time before starting the experiment. Two major emotions needed to be recorded, happy and sad. Each participant is subjected to 4 sessions within 5 seconds for each trial and watched a number of videos as emotional stimuli. Afterward they watched the same videos in order to collect the real emotional dataset, each session takes 5 seconds (figure 15). Figure 15 illustrates the experiment design in order to collect emotional dataset. It consists of twoman phases, trial phase for training and the real phase of collecting the dataset. At the end of each main session the participant should do the emotional self-assessment.
Figure 15. Experiment design for emotion induction.
4.6 Experiment and Data Analysis
Figure 16 below illustrates the signal acquisition process, using IAPS and IADS audio video system [62] [63] stimuli to obtain happy and sad emotions for the 25 participant. Based on previous research it is crucial to select the best channel in order to obtain more accurate data [64]. [52] grouped the 14 Emotiv channel into 7 pairs based on their location. Brain activity signals are recognized and analysed in terms of emotional mood (figure 17). This experiment uses EEG signals that contain the human emotion, which divides to Alpha and Beta waves that demonstrate the emotional activity inside the brain (Figure 18). This device is able to synchronize the brain activity changing during the interaction between the user and the 3D virtual human.
Figure 16. Emotional Signal Acquisition.

International Journal of Computer Science & Information Technology (IJCSIT) Vol 7, No 2, April 2015
175
Figure 17 shows the signals of all 14th channels [65]. In order to be more accurate for selecting the channel location, each pair of channel by is measured by compute the Mean, which shows the activity of each pair of channel. Table 3 illustrates each pair of channel location with its Mean value. If the value of computed Mean is high (equation 9) it means that the signals is more active. As table 1 illustrates, the pair T7 & T8 resulting a higher Mean value comparing to other channel pairs, therefore both T7 & T8 is chosen in experiment.
Equation 9 is for compute the Mean for EEG raw signals. The recorded EEG signals designated X and Xn, where it represents the value of nth raw signal sample.
Where
N = 1024 (1024 samples corresponds to 5 sec of EEG recording).
(9)
Figure 17. All Emotiv 14th channels after preprocessing phase.
Table 3. Mean value for each pair of channel with its location.

International Journal of Computer Science & Information Technology (IJCSIT) Vol 7, No 2, April 2015
176
Figure 19. Chart of the 14th channels pair Mean value that representing the activity.
The experiment collected happy and sad emotions data, using emotive device [65]. The data that represent the arousal/valence excitement level was captured through Emotiv headset sensors. Through the Emotiv device it is possible to figure out that different brain areas have been actively involved in the process. The two hyperactive channels (T7 & T8) as illustrated in table 1 and figure 19 and based on [64] as well is chosen. As a pre-process phase a band-pass filter with 7 to 32 Hz was applied on the collected raw data with the specific two of EEG waves (alpha and beta) lying within (8 - 30) bands [66]. Afterward, the Higuchi algorithm based on fractal dimension described in section 2 is computed in order to obtain values for the filtered data.
Eventually the Mode [Mo] statistical feature is implemented on Higuchi fractal dimension value, which gives the value that occurs most frequently in data channel. The results represent the most repeated value which consecutively represents the desired emotions. A computed Mode [Mo] result is selected for the arousal/valence excitement level recognition, which represents more optimal arousal. Also it aimed at recognizing the level of arousal/valence for the selected ten experiments out of 25 (Table 4).
Furthermore, for emotion classification, the result of self-assessment is analysed with regards to arousal valence emotional model. And then, Pearson correlation coefficient between the changes of power of brain activity and self-assessment is computed with regards to arousal valence emotion dimension. Pearson correlation is used to measure the strength of a linear association between hemisphere activity and self-assessment with regards to arousal valence emotion dimension. The potential result lies in interval between 1 and -1, where the value r = 1 means a perfect positive correlation and the value r = -1 means a perfect negative correlation. Thus, this correlation computation is used to find out whether a high activity of the left hemisphere and happy emotion are correlated. The brain hemisphere activity is shown through calculating the mean value for both T7 & T8 pairs of channels and then compares which of them has max value. It is important to mention that arousal valence is equivalent to T7 & T8 channels [64]. The active channel of T7 & T8 pairs is an indicator of the emotion that the user feels.
Finally, based on [62] [63] [18] the emotional model distributed into two intervals [-2, +2], the high excitation level is a +2 from the determined interval and sleepy level is -2. Table 4 illustrates the computed value of Mode [Mo] that represents the higher values to reach to excited location of emotional model, It also represents the high peak of wave signal for the happy emotion state (figure 12). This result is compared with the result of each T7 & T8 pair of channels activity, and then mapped with emotional model.

International Journal of Computer Science & Information Technology (IJCSIT) Vol 7, No 2, April 2015
177
With regards to interval [-2, +2], when the computed value of Mode [Mo] approaches to +2 this means that high excitation level is involved that expresses the happy emotion mode, but when it approaches to -2 this means it signifies the sleepy level of the emotional model (see figure 7).
Table 4. Computed value of Mode [Mo] with regards to Arousal/Valence emotion model.
For instance, if we take a look on the computed Mode [Mo] for experiment 6 with the excitation level of 1.8973 (table 4) we will notice that it is closer to the excitation level that’s described by High Arousal High Valence (HAHV) and is located quite close to the happy point of the emotional model (figure 7), also if we take a look on experiment 5 we will notice that its located quite near to the sad point of the emotional model (figure 7) and described by Low Arousal Low Valence (LALV), and the same analysis result for the remaining computed values.
Figure 20. Defined emotion interval mapped to emotional model.
Table 4 illustrates the experiments results, the results labelled by High Arousal High Valence (HAHV) and Low Arousal Low Valence (LALV). These values mapped with regards to emotional model (see figure 15), after classified emotions. Then synchronize it with 3D virtual human model, which is built Magicx at Universiti Teknologi Malaysia. Figure 12 representing the high and low peak of wave signal for both happy and sad emotions.

International Journal of Computer Science & Information Technology (IJCSIT) Vol 7, No 2, April 2015
178
5. RENDER 3D VIRTUAL HUMAN EMOTIONAL WALKING
3D virtual human is implemented based on the obtained result. Figure 21 shows rendering 3D virtual human emotional walking expression framework. Based on the defined parameter emotion is recognized and assigned to the 3D virtual human model to be generated.
Moreover, the 3D virtual human model is developed in order to synchronize and control happy and sad emotions. A Unity 3D is used to build the model (see figure 22). If the game player feels happy, the model shows happy walking style and if he is sad the model shows sad walking style (see figure 12). The aim of this model is to make the HCI interaction look more realistic in the context of emotion that brings a new dimension in the HCI development area. In order to visualize and simulate the classified human emotions, the parameters that represent users’ emotion are implemented. The 3D virtual humans emotion walking is simulated and affected by these parameters.
Figure 21. Rendering 3D virtual humans’ emotional walking method.
Figure 22. Design 3D virtual humans using Unity 3D.
6. DISCUSSION
The successful deployment of emotion application depends on the availability of effective emotion classification method. Also to enhance the appropriate machine learning techniques in order to interpret the brain rhythms with regards to emotions, in addition to proper and effective

International Journal of Computer Science & Information Technology (IJCSIT) Vol 7, No 2, April 2015
179
technique for map and synchronize emotions. This research paper is about providing a new way to classify emotions in order to map and synchronize these emotions with VR.
Emotiv BCI device could be used as a new technology game controller instead of traditional ones like keyboard, mouse, joystick and others. Emotiv gives an accurate EEG signalsreading. A low price is considered an advantage for common use.
By compare the result of the provided hybrid method with regards to the labelled audio video stimulus, it is found that the wanted result is achieved. Moreover, an imitation of human emotion and implement it on 3D humanoid model in VR is accomplished to reach the feedback aim i.e. emotional walking expression and to create an interactive model based on brain signals interaction in term of emotion. The achieved result could be used as a new brain interactive product. Many daily life applications may utilize this product especially in gaming industry.
7. CONCLUSION
In this paper, a new hybrid emotion classification method is provided in order to enhance the quality. The brain interface utilization provides strong credibility and impression to the users in any fields. Then synchronizing and controlling 3D virtual humans emotional walking based on real human emotion from using BCI is managed. The hybrid method facilitates visualization and simulation of the human emotions to produce emotion expressions of 3D virtual humans behavioural to adapt with its environment in VR.
The present work can be used in many fields such as augmented reality, virtual reality, virtual environments and games. This technique renders users’ emotions to be more realistic in VR, considering the real emotion to be captured from the real life human using BCI.
With no doubt BCI could be smoothly integrated with other systems. It provides accurate, robust and reliable result. BCI could be sensitive and swift to be more effective for game adaptation and other systems. Our future work trend will be on emotional robot behaviour.
ACKNOWLEDGMENTS
This research was supported by Ministry of Science, Technology and Innovation eSciencefund 01-01-06-SF1188 at MaGIC-X (Media and Games Innovation Centre of Excellence), UTM-IRDA Digital Media Centre, Universiti Teknologi Malaysia.
REFERENCES
[1] Faller, Josef, Gernot Müller-Putz, Dieter Schmalstieg, and Gert Pfurtscheller. "An application framework for controlling an avatar in a desktop-based virtual environment via a software ssvep brain-computer interface." Presence: Teleoperators and Virtual Environments 19, no. 1 (2010): 25-34.
[2] Basori, Ahmad Hoirul. "Emotion walking for humanoid avatars using brain signals." Int J Adv Robotic Sy 10, no. 29 (2013).
[3] Abuhashish, Faris A., Mohd S. Sunar, Hoshang Kolivand, Farhan Mohamed, and Dzulkifli B. Mohamad. "Feature Extracted Classifiers Based on EEG Signals: A Survey." Life Science Journal 11, no. 4 (2014).
[4] Liu, Zhen, and Zhi Geng Pan. "An emotion model of 3d virtual characters in intelligent virtual environment." In Affective Computing and Intelligent Interaction, pp. 629-636. Springer Berlin Heidelberg, 2005.

International Journal of Computer Science & Information Technology (IJCSIT) Vol 7, No 2, April 2015
180
[5] Lichtenstein, Antje, Astrid Oehme, Stefan Kupschick, and Thomas Jürgensohn. "Comparing two emotion models for deriving affective states from physiological data." In Affect and Emotion in Human-Computer Interaction, pp. 35-50. Springer Berlin Heidelberg, 2008.
[6] Cabredo, Rafael, Roberto S. Legaspi, Paul Salvador Inventado, and Masayuki Numao. "An Emotion Model for Music Using Brain Waves." In ISMIR, pp. 265-270. 2012.
[7] Bos, Danny Oude. "EEG-based emotion recognition." The Influence of Visual and Auditory Stimuli (2006): 1-17.
[8] Schiffer, Fredric, Martin H. Teicher, Carl Anderson, Akemi Tomoda, Ann Polcari, Carryl P. Navalta, and Susan L. Andersen. "Determination of hemispheric emotional valence in individual subjects: A new approach with research and therapeutic implications." Behavioral and Brain Functions 3, no. 1 (2007): 13.
[9] Horlings, R., Datcu, D., & Rothkrantz, L. J. Emotion recognition using brain activity. In Proceedings of the 9th international conference on computer systems and technologies and workshop for PhD students in computing, 2008,(p. 6). ACM.
[10] Arya, Ali, Steve DiPaola, and Avi Parush. "Perceptually valid facial expressions for character-based applications." International Journal of Computer Games Technology 2009 (2009).
[11] Rathinavelu, A., and G. Yuvaraj. "Data Visualization Model for Speech Articulators." Proceedings of AICERA (2011): 155-159.
[12] Allison, Brendan Z., Clemens Brunner, Christof Altstätter, Isabella C. Wagner, Sebastian Grissmann, and Christa Neuper. "A hybrid ERD/SSVEP BCI for continuous simultaneous two dimensional cursor control." Journal of neuroscience methods 209, no. 2 (2012): 299-307.
[13] Kaffenberger, T., Brühl, A. B., Baumgartner, T., Jäncke, L., & Herwig, U. Negative bias of processing ambiguously cued emotional stimuli.Neuroreport, 2010, 21(9), 601-605.
[14] Baumgartner, Thomas, Matthias Willi, and Lutz Jäncke. "Modulation of corticospinal activity by strong emotions evoked by pictures and classical music: a transcranial magnetic stimulation study." Neuroreport 18, no. 3 (2007): 261-265.
[15] C. P. Niemic. Studies of emotion: A theoretical and empirical review of psychophysiological studies of emotion. Journal of Undergraduate Research, 2002.
[16] Davidson, R., Schwartz, G., Saron, C., Bennett, J., Goleman, D.: Frontal versus parietal eeg asymmetry during positive and negative effect. Psychophysiology, 1979.
[17] W. Wundt, Grundriss der Psychologie, W. Engelmann, Leipzig, 1896.[18] Koelstra, Sander, Christian Muhl, Mohammad Soleymani, Jong-Seok Lee, Ashkan Yazdani, Touradj
Ebrahimi, Thierry Pun, Anton Nijholt, and Ioannis Patras. "Deap: A database for emotion analysis; using physiological signals."Affective Computing, IEEE Transactions on 3, no. 1 (2012): 18-31.
[19] P.J. Lang, Behavioral treatment and bio-behavioral assessment, , Ablex Publishing, Norwood, NJ, in: J.B. Sidowski et al. (Ed.), Technology in mental health care delivery systems, 1980, pp. 119–137.
[20] Lichtenstein, Antje, Astrid Oehme, Stefan Kupschick, and Thomas Jürgensohn. "Comparing two emotion models for deriving affective states from physiological data." In Affect and Emotion in Human-Computer Interaction, pp. 35-50. Springer Berlin Heidelberg, 2008.
[21] Liu, Yisi, Olga Sourina, and Minh Khoa Nguyen. "Real-time EEG-based emotion recognition and its applications." In Transactions on computational science XII, pp. 256-277. Springer Berlin Heidelberg, 2011.
[22] Parthasarathy, V., G. Saravana Kumar S. Sivasaravana Babu, Grimm Christoph, Mrsp Muthukrishnammal, Dr S. Selvakumar Raja, Ilyass Mzili, Mohammed Essaid Riffi Et Al. "Brain Computer Interface Based Robot Design." Journal Of Theoretical And Applied Information Technology 72, No. 3 (2015).
[23] Abuhashish F, Basori H, Sunar M, Muhammad D. Review: Brain-Computer Interface and Virtual Reality Technology, In Proceedings of the 3rd ICIDM, 2012.
[24] Aloise F, Schettini F, Aricò P, Bianchi L, Riccio A, Mecella M, Cincotti F. Advanced brain computer interface for communication and control. In Proceedings of the International Conference on Advanced Visual Interfaces. 2010,pp. 399-400.
[25] Kolivand H, Noh Z, Sunar M. A quadratic spline approximation using detail multi-layer for soft shadow generation in augmented reality.Multimedia Tools and Applications, 2013,1-21.
[26] Velasco-Álvarez, Francisco, and Ricardo Ron-Angevin. "Asynchronous brain-computer interface to navigate in virtual environments using one motor imagery." In Bio-Inspired Systems: Computational and Ambient Intelligence, pp. 698-705. Springer Berlin Heidelberg, 2009.

International Journal of Computer Science & Information Technology (IJCSIT) Vol 7, No 2, April 2015
181
[27] Bee N, Falk B, André E. Simplified facial animation control utilizing novel input devices: A comparative study. In Proceedings of the 14th international conference on Intelligent user interfaces. 2009,pp. 197-206.
[28] Russell, James A. "A circumplex model of affect." Journal of personality and social psychology 39, no. 6 (1980): 1161.
[29] Nijholt A, Tan D. Playing with your brain: brain-computer interfaces and games. In Proceedings of the international conference on Advances in computer entertainment technology. 2007,pp. 305-306.
[30] Lotte F. Brain-computer interfaces for 3D games: hype or hope?. In Proceedings of the 6th International Conference on Foundations of Digital Games. 2011,pp. 325-327.
[31] Higuchi, Tomoyuki. "Approach to an irregular time series on the basis of the fractal theory." Physica D: Nonlinear Phenomena 31, no. 2 (1988): 277-283.
[32] Accardo A, Affinito M, Carrozzi M, Bouquet F. Use of fractal dimension for the analysis of electroencephalographic time series. Biol Cybern 1997,77:339-50.
[33] Accardo, Agostino, M. Affinito, M. Carrozzi, and F. Bouquet. "Use of the fractal dimension for the analysis of electroencephalographic time series." Biological cybernetics 77, no. 5 (1997): 339-350.
[34] Doyle, Tim LA, Eric L. Dugan, Brendan Humphries, and Robert U. Newton. "Discriminating between elderly and young using a fractal dimension analysis of centre of pressure." International journal of medical sciences 1, no. 1 (2004): 11.
[35] Ramirez-Cortes, Juan Manuel, Vicente Alarcon-Aquino, Gerardo Rosas-Cholula, Pilar Gomez-Gil, and Jorge Escamilla-Ambrosio. "ANFIS-based P300 rhythm detection using wavelet feature extraction on blind source separated EEG signals." In Intelligent Automation and Systems Engineering, pp. 353-365. Springer New York, 2011.
[36] Imbert, Ricardo, and Angélica De Antonio. "An emotional architecture for virtual characters." In Virtual Storytelling. Using Virtual Reality Technologies for Storytelling, pp. 63-72. Springer Berlin Heidelberg, 2005.
[37] Liu, Y., & Sourina, O. EEG Databases for Emotion Recognition. In Cyberworlds (CW), 2013 International Conference on IEEE, 2013, pp. 302-309.
[38] Russell, James A. "Core affect and the psychological construction of emotion."Psychological review 110, no. 1 (2003): 145.
[39] M.M. Bradley and P.J. Lang, Measuring Emotion:The Self-Assessment Manikin and the Semantic Differential, J. Behavior Therapy Experimental Psychiatry, vol. 25, no. 1, 1994, pp. 49-59.
[40] Horlings, R., Datcu, D., & Rothkrantz, L. J. Emotion recognition using brain activity. In Proceedings of the 9th international conference on computer systems and technologies and workshop for PhD students in computing, ACM. 2008, p. 6.
[41] Davis, Mark H. "Measuring individual differences in empathy: Evidence for a multidimensional approach." Journal of personality and social psychology 44, no. 1 (1983): 113.
[42] Lichtenstein, Antje, Astrid Oehme, Stefan Kupschick, and Thomas Jürgensohn. "Comparing two emotion models for deriving affective states from physiological data." In Affect and Emotion in Human-Computer Interaction, pp. 35-50. Springer Berlin Heidelberg, 2008.
[43] Scherer, Klaus R. "What are emotions? And how can they be measured?."Social science information 44, no. 4 (2005): 695-729.
[44] Liu, Zhen, and Zhi Geng Pan. "An emotion model of 3d virtual characters in intelligent virtual environment." In Affective Computing and Intelligent Interaction, pp. 629-636. Springer Berlin Heidelberg, 2005.
[45] Cabredo, Rafael, Roberto S. Legaspi, Paul Salvador Inventado, and Masayuki Numao. "An Emotion Model for Music Using Brain Waves." In ISMIR, pp. 265-270. 2012.
[46] Randles, R. H. Wilcoxon signed rank test. Encyclopedia of statistical sciences, 1988.[47] W. Wundt, Grundriss der Psychologie, W. Engelmann, Leipzig, 1896.[48] Muthukrishnammal, Mrsp, And Dr S. Selvakumar Raja. "Clustering And Neural Network Approaches
For Automated Segmentation And Classification Of Mri Brain Images." Journal Of Theoretical And Applied Information Technology 72, No. 3 (2015).
[49] R. Kehrein, “The prosody of authentic emotions,” in Proc. Speech Prosody Conf, Aix-en-Provence, France, 2002, pp. 423–426.
[50] P.J. Lang, Behavioral treatment and bio-behavioral assessment, Ablex Publishing, Norwood, NJ, in: J.B. Sidowski et al. (Ed.), Technology in mental health care delivery systems, 1980, pp. 119–137.
[51] Bos, Danny Oude. "EEG-based emotion recognition." The Influence of Visual and Auditory Stimuli (2006): 1-17.

International Journal of Computer Science & Information Technology (IJCSIT) Vol 7, No 2, April 2015
182
[52] Jatupaiboon, Noppadon, Setha Pan-ngum, and Pasin Israsena. "Real-time EEG-based happiness detection system." The Scientific World Journal 2013 (2013).
[53] Davidson, Richard J., Paul Ekman, Clifford D. Saron, Joseph A. Senulis, and Wallace V. Friesen. "Approach-withdrawal and cerebral asymmetry: Emotional expression and brain physiology: I." Journal of personality and social psychology 58, no. 2 (1990): 330.
[54] Davidson, Richard J. "Anterior cerebral asymmetry and the nature of emotion."Brain and cognition 20, no. 1 (1992): 125-151.
[55] Baumgartner, T., Esslen, M., & Jäncke, L. From emotion perception to emotion experience: emotions evoked by pictures and classical music.International Journal of Psychophysiology, 2006, 60(1), 34-43.
[56] Schiffer, Fredric, Martin H. Teicher, Carl Anderson, Akemi Tomoda, Ann Polcari, Carryl P. Navalta, and Susan L. Andersen. "Determination of hemispheric emotional valence in individual subjects: A new approach with research and therapeutic implications." Behavioral and Brain Functions 3, no. 1 (2007): 13.
[57] Horlings, R., Datcu, D., & Rothkrantz, L. J. Emotion recognition using brain activity. In Proceedings of the 9th international conference on computer systems and technologies and workshop for PhD students in computing, ACM, 2008, p. 6.
[58] Kaffenberger, T., Brühl, A. B., Baumgartner, T., Jäncke, L., & Herwig, U. Negative bias of processing ambiguously cued emotional stimuli.Neuroreport, 21(9), 2010, 601-605.
[59] Baumgartner, Thomas, Matthias Willi, and Lutz Jäncke. "Modulation of corticospinal activity by strong emotions evoked by pictures and classical music: a transcranial magnetic stimulation study." Neuroreport 18, no. 3 (2007): 261-265.
[60] C. P. Niemic. Studies of emotion: A theoretical and empirical review of psychophysiological studies of emotion. Journal of Undergraduate Research, 2002.
[61] Davidson, R., Schwartz, G., Saron, C., Bennett, J., Goleman, D.: Frontal versus parietal eeg asymmetry during positive and negative effect. Psychophysiology, 1979.
[62] M. Bradley and P. Lang, International Affective Digitized Sounds (IADS): Stimuli, Instruction Manual and Affective Ratings, Technical Report B-2, The Center for Research in Psychophysiology, Univ. of Florida, 1999.
[63] P. Lang, M. Bradley, and B. Cuthbert, International Affective Picture System (IAPS): Affective Ratings of Pictures and Instruction Manual, Technical Report A-8, Univ. of Florida, 2008.
[64] Mahajan, Rashima, Dipali Bansal, and Shweta Singh. "A real time set up for retrieval of emotional states from human neural responses." International Journal of Medical, Health, Pharmaceutical and Biomedical Engineering 8 (2014).
[65] Emotiv EEG Neuroheadset, http://emotiv.com/upload/manual/EEGSpecifications.pdf.[66] Sammler, Daniela, Maren Grigutsch, Thomas Fritz, and Stefan Koelsch. "Music and emotion:
electrophysiological correlates of the processing of pleasant and unpleasant music." Psychophysiology 44, no. 2 (2007): 293-304.