Embed Size (px)
Citation preview
RIT FSAE Vehicle Dynamics System P07221
Laurie J. Underhill
Group Leader/Analysis & Simulation Engineer Sean J. Carmody
Process Control Coordinator Anthony W. Capobianco
Test Engineer Nicholas A. Tryt
Test & Analysis Engineer Kyle J. Burmester
Analysis & Simulation Engineer Franklin J. DiBartolomeo
Design & Analysis Engineer Todd V. Mangiagli
Design Engineer
1
ABSTRACT The Vehicle Dynamics Platform Team has a strong desire to help keep RIT at the forefront of technology, specifically through the development of an analysis system for the Formula SAE Racing Team. This project will require the knowledge and skills of students from various academic backgrounds, predominantly in the field of engineering. The Vehicle Dynamics Senior Design Project stemmed from the desire of the RIT Formula SAE Racing Team to improve the design and performance of their open-wheel vehicle. The Vehicle Dynamics Platform Team has expanded upon the Data Acquisition Senior Design Project that was completed in 2005 by using the DAQ to acquire vehicle dynamics data and translate it into useful tuning and design information. This was achieved by creating a simulated model of an older car (F13) and correlating it to collected test data, as well as creating TrackMaster templates (software used to view DAQ data) for viewing the data in a logical manner. The simulation will allow the RIT Formula Racing Team to model tuning and vehicle design changes before manufacturing complex parts, which will expedite the design process. The TrackMaster views will provide feedback of vehicle performance and handling for specific events, such as skid-pad and acceleration. Additional features provided by this project include a more organized method of testing, a system of data analysis, a test stand for organization of test equipment, and a vehicle dynamics database to organize vehicle data and analysis tools. The final product will help the RIT Formula SAE Racing Team make any necessary alterations to the car so that it can achieve optimum performance and handling at competition. INTRODUCTION Having an in-depth understanding of vehicle dynamics is critical to designing, tuning, and testing the best Formula SAE race car for competition in Detroit each year. Unfortunately, time restraints and limited experience with the subject make this a daunting task for any college-level racing team. To solve this problem, the Vehicle Dynamics System was created to bridge the gap between theory and hands-on experience.
The key features of the system that achieve this goal are outlined below, and are highlighted in this paper:
a. Test Stand b. Data Acquisition System c. Analysis System d. Simulation System e. Test Plan f. Vehicle Dynamics Database The test stand was designed and built to be the physical hub of the vehicle dynamics system where all test tools and equipment are stored. Onboard the test stand are two laptop computers; one to collect and analyze real test data acquired from the DAQ, and another to hold the Vehicle Dynamics Database and all simulated vehicle models. The Vehicle Dynamics Database serves as the electronic focal point of the system, storing all files that are relevant to testing, tuning, and driver training. In the future, the Vehicle Dynamics Senior Design Team hopes that this project will promote more interest in the field of vehicle dynamics, and help the team understand what areas of their design need improvement. Specific possibilities for future expansion of the system include:
• Live Telemetry System (add on to current DAQ)
• Stand-alone DAQ (simplified and easy to transfer between vehicles)
• Motion Platform
• Driver Health and Fitness Project
• Expanded Vehicle Model for Simulation *These projects are outlined in Appendices A – E at the end of this paper VEHICLE DYNAMICS SYSTEM TEST STAND Conception of the test stand began with a need for a transportable storage and organizational tool for testing and tuning of the RIT Formula Team’s racecar. A compromise was made between storage space and indoor mobility. The final design was a tubular-framed and skinned cart with a flat wooden work surface and pneumatic casters. Design began after several brainstorming sessions with the members of the Senior Design Team. It was
2
determined that the cart should have the following dimensions and weight capacities: Overall dimensions: Length- 55.00 in (handles included) 49.00 in (work surface length) Width- 30.50 in Height- 41.75 in Weight capacities: Toolbox- 300 lbf Small rear cabinet- 100 lbf Large cabinet- 200 lbf Top work surface- 500 lbf The FEA below shows the final structural analysis before building began. This FEA assumes uniform loading of the top and four fixed points where the casters are attached.
Figure 1.
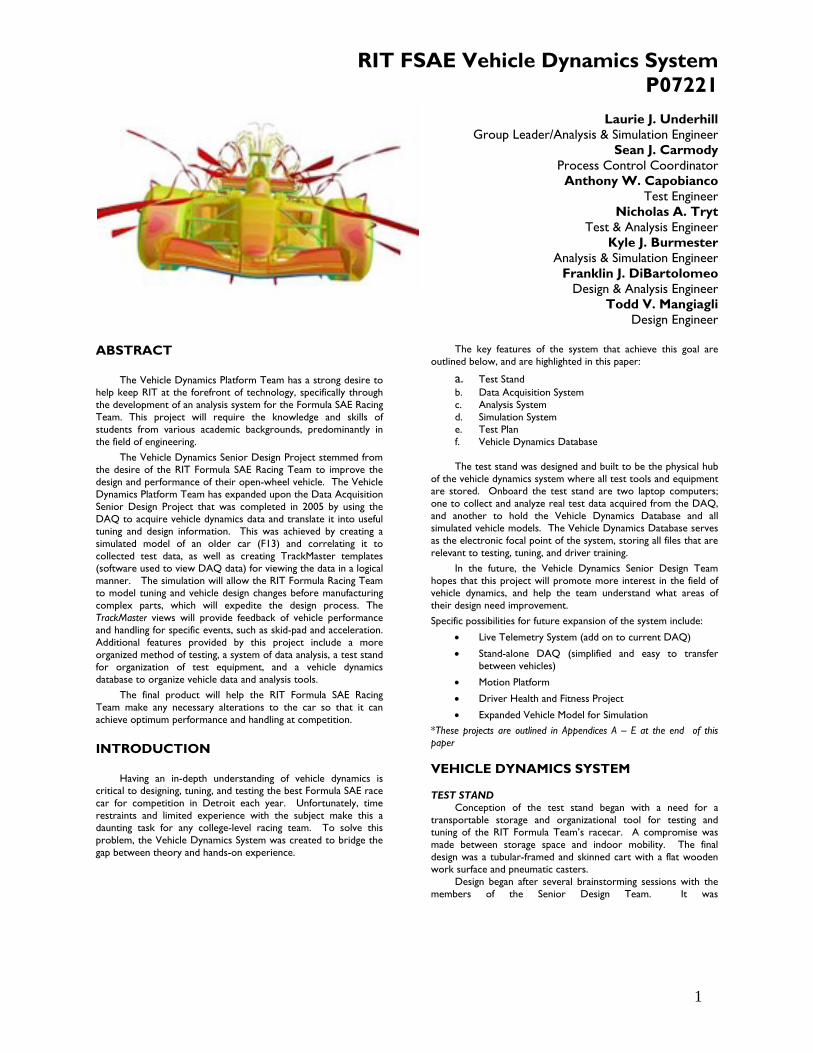
Ergonomics was kept at the forefront of design and manufacture to ensure a safe and comfortable working area for the end user. This was achieved through the study of appropriate work surface heights for the average male and female, and designing the cart within this envelope. Handle height was placed as high as possible to give the user a comfortable position for pushing the test stand. A long day of testing verified that the work surface and handle heights were ergonomically acceptable to all members on the team who used it. In addition to user comfort, ease of use was also an important aspect of the design. Overall dimensions of the cart provided ample storage for various testing supplies, yet allowed it to fit through a single standard doorway. Maneuverability of the test stand on castors also proved to be exceptional, as the cart can be moved around indoors even in tight spaces. The first step in the manufacturing process was to order all of the necessary components and raw materials, which would later be assembled into a rolling product. Construction began with the frame.
Figure 2.
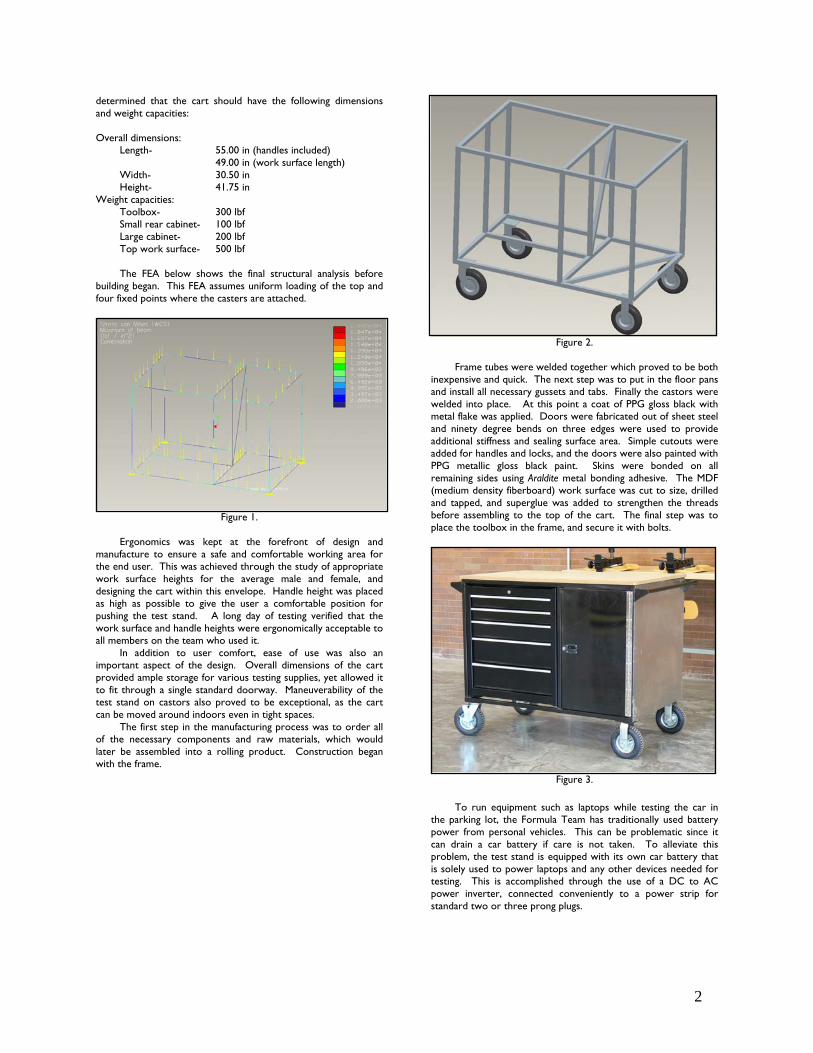
Frame tubes were welded together which proved to be both inexpensive and quick. The next step was to put in the floor pans and install all necessary gussets and tabs. Finally the castors were welded into place. At this point a coat of PPG gloss black with metal flake was applied. Doors were fabricated out of sheet steel and ninety degree bends on three edges were used to provide additional stiffness and sealing surface area. Simple cutouts were added for handles and locks, and the doors were also painted with PPG metallic gloss black paint. Skins were bonded on all remaining sides using Araldite metal bonding adhesive. The MDF (medium density fiberboard) work surface was cut to size, drilled and tapped, and superglue was added to strengthen the threads before assembling to the top of the cart. The final step was to place the toolbox in the frame, and secure it with bolts.
Figure 3.
To run equipment such as laptops while testing the car in
the parking lot, the Formula Team has traditionally used battery power from personal vehicles. This can be problematic since it can drain a car battery if care is not taken. To alleviate this problem, the test stand is equipped with its own car battery that is solely used to power laptops and any other devices needed for testing. This is accomplished through the use of a DC to AC power inverter, connected conveniently to a power strip for standard two or three prong plugs.
3
DATA ACQUISITION SYSTEM The Competition Data Systems Data Acquisition System (CDS DAQ) provided a good foundation for recording data required for model simulation. Upon a full examination of the DAQ and the completion of a needs assessment, the team established that improvements to the calibration methods and files were necessary. Also, the addition of strain gages at each suspension link (pullrod) was necessary for measuring vertical loads at the tire. DAQ Improvements To begin the improvement process, the calibration file for F13 was examined. The pressure transducers for the braking system and the gyroscope for measuring yaw rate come with CDS calibrations, where as all other sensors must be calibrated by the user. Improved methods were created to more accurately calibrate the sensors. For example, steering wheel angle was measured by mounting a digital protractor to the wheel and obtaining readouts. After all recalibrations were completed, tests were performed to verify that all outputs from the DAQ correlated with measuring instruments. Addition of Strain Gages
Being able to measure the vertical tire loads at each wheel dynamically is an excellent source of information when designing and tuning a suspension system. F13 is equipped with front and rear pullrods, which transmit the load at the wheels to the inboard mounted shocks. These links are always in tension in the dynamic range of suspension travel that the team is concerned with analyzing. The original DAQ senior design team did preliminary design work outlining possible strain gage circuits. After studying the circuit designs, the team decided to utilize a simpler quarter-bridge design. The team also concluded that the original strain gages used in the design were not reliable enough due to poor leadwire connections. Pre-wired strain gages were used to solve this problem. The next step was to amplify the signal from the strain gages. Unfortunately, the voltage output was only .000346 volts, which requires a large gain to effectively amplify the signal. The range of force in the pullrod was determined, allowing for the range of strain in that pullrod to be calculated. Various gain resistances were explored to find the acceptable voltage range for the DAQ. It was found that a gain resistance of 1000 ohms, which gives a gain of approximately 50:1, produces an acceptable voltage range for the DAQ system. Calibration of the Strain Gages Calibration of strain gages is dependant on suspension geometry. The gage is bonded to the pullrod to measure the normal load on the tire. There is a ratio of pullrod force to vertical wheel force, which changes with ride height. Due to different suspension geometries in the front and rear, separate equations are used to find tire loads (see Appendix F). This method of calibration works by establishing a voltage range to a tensile load range in the pullrod. The data stream from the pull-rod force is then entered into the equations mentioned above along with ride height change. This can be used as an indirect way to measure normal tire force. A more direct way to calibrate the strain gages that was used involved putting a scale under each wheel and slowly adding weight to the vehicle. Each strain gage was then calibrated by reading the value off of the scale. Sources of Error in the DAQ
Every data acquisition system has some form of inaccuracy. These sources of error can come from the sensors, the analog-to-digital converters, or electrical noise. These inaccuracies were
solved using filtering functions that are built into the CDS TrackMaster program. The gyroscope that measures the yaw rate of the vehicle is another source of error. Due to the vibrations in the chassis and the method of mounting the sensor (on rubber mounts), a high level of noise in the signal was experienced. Through the use of other sensors on the vehicle, yaw rate was calculated. This output was used to correlate to the virtual model with some success. Errors in the string potentiometer were experienced due to an excessive amount of play in the steering system on F13. The steering wheel would turn approximately 3 degrees in each direction before the front wheels started to turn. This was compensated for in correlation by subtracting 3 degrees from the TrackMaster output. Future Strain Gage Improvements Instead of using a quarter-bridge, a half-bridge can be used. This type of strain gage incorporates two strain gages on each pullrod, which serves to reduce the sensitivity to temperature change. Overall, this will improve the accuracy and reliability of the strain gage output. ANALYSIS SYSTEM
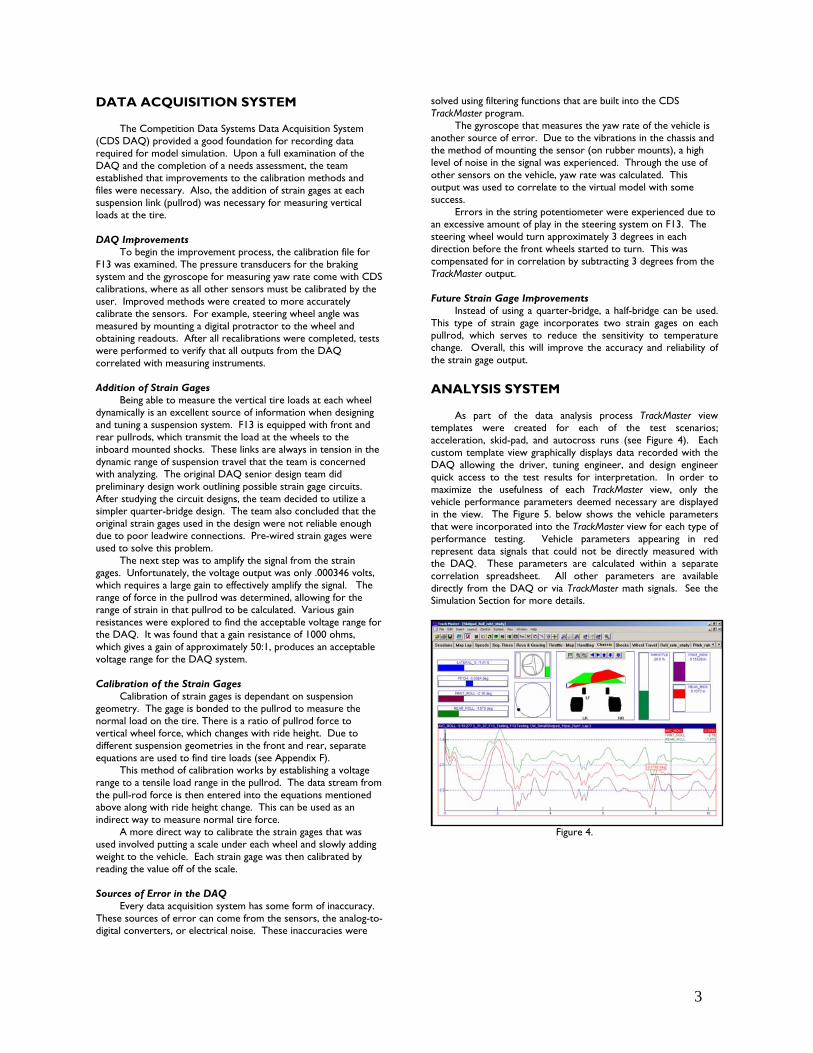
As part of the data analysis process TrackMaster view templates were created for each of the test scenarios; acceleration, skid-pad, and autocross runs (see Figure 4). Each custom template view graphically displays data recorded with the DAQ allowing the driver, tuning engineer, and design engineer quick access to the test results for interpretation. In order to maximize the usefulness of each TrackMaster view, only the vehicle performance parameters deemed necessary are displayed in the view. The Figure 5. below shows the vehicle parameters that were incorporated into the TrackMaster view for each type of performance testing. Vehicle parameters appearing in red represent data signals that could not be directly measured with the DAQ. These parameters are calculated within a separate correlation spreadsheet. All other parameters are available directly from the DAQ or via TrackMaster math signals. See the Simulation Section for more details.
Figure 4.
4
Vehicle Control Parameters Selection Criteria Acceleration Autocross Skidpad
Brake Pressure 1,2,3Engine RPM 1,2,3,4
Gear Selection 1,2,4Lap Time 1,2,4
Station (Track Position) 1,4Steering Wheel Angle 1,2,3
Throttle Position 1,2,3Vehicle Speed 1,2,3,4
Vehicle Output Parameters Selection Criteria Acceleration Autocross Skidpad
Corner Weights 1,2,3Damper Force 1,2,3Damper Travel 1,2,3
Damper Velocity 1,2,3Lateral G's 1,2,3
Lateral Tire Forces (Fy) 1,2,3Longitudinal G's 1,2,3
Longitudinal Tire Forces (Fx) 1,2,3Pitch Rate 1,2,3
Ride Height Change 1,2,3Roll Rate 1,2,3
Spring Force 1,2,3Spring Travel 1,2,3
Vertical G's 1,2,3Wheel Speeds 1,2
3 - Indicates parameters importance to the design engineer. 4 - Indicates parameters importance to the driver.
Indicates the parameter is necessary for model correlation of the test.
Performance Tests
1 - Indicates parameters importance to model correlation. 2 - Indicates parameters importance to the tuning engineer.
Figure 5.
The vehicle control and output parameters listed in Figure 5
were selected due to their importance to one of the following areas. 1.) The parameter was required to insure proper model correlation. 2.) The parameter provides information which the tuning engineer will use to diagnose vehicle handling. 3.) The vehicle parameter provides information that the design engineer will use to evaluate vehicle design characteristics. 4.) The vehicle parameter provides information the driver can use to gauge his or her driving performance.
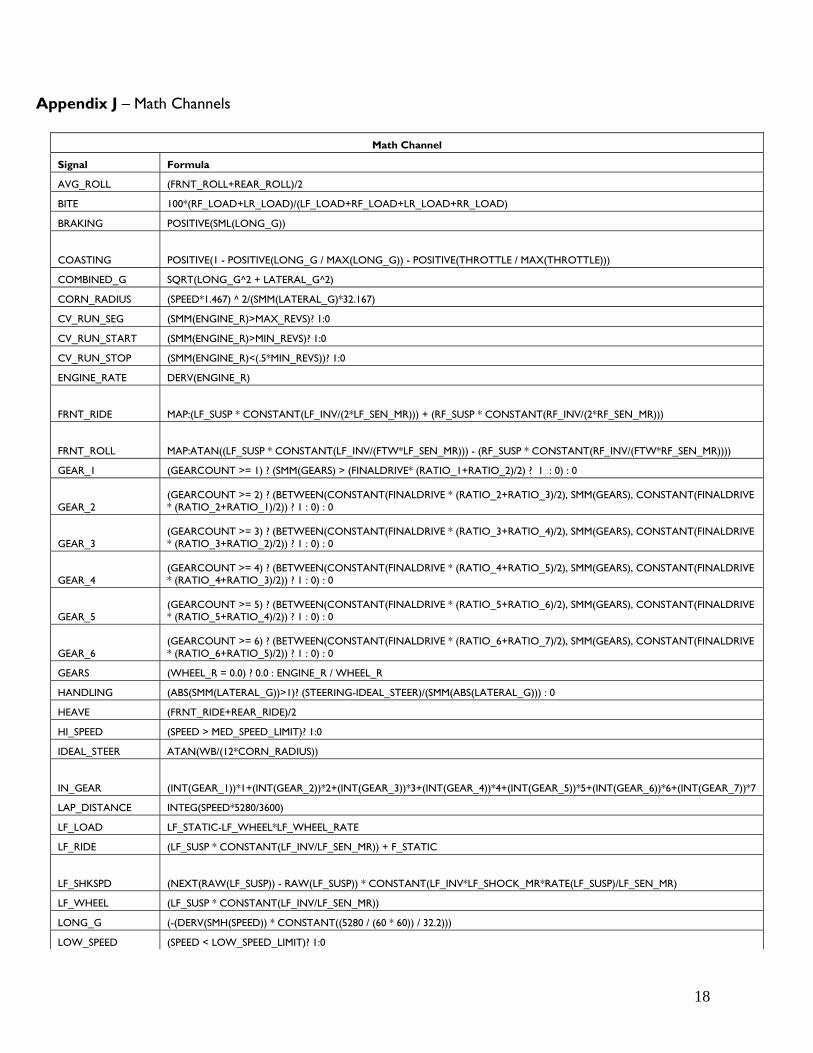
The details of the parameter equations used by TrackMaster math channels are outlined in Appendix J. SIMULATION SYSTEM
The team decided to use CarSim Simulation Software to create the F13 vehicle model. The reasons for the choice include its simplistic format, free license, and excellent support system for troubleshooting problems. In addition, the program is relatively easy to learn and use, which supports the overall team goal of making this system a product that will be used in the future. Modeling Process
The modeling process began during the fall quarter of the year, and involved extensive specification calculation and data collection.
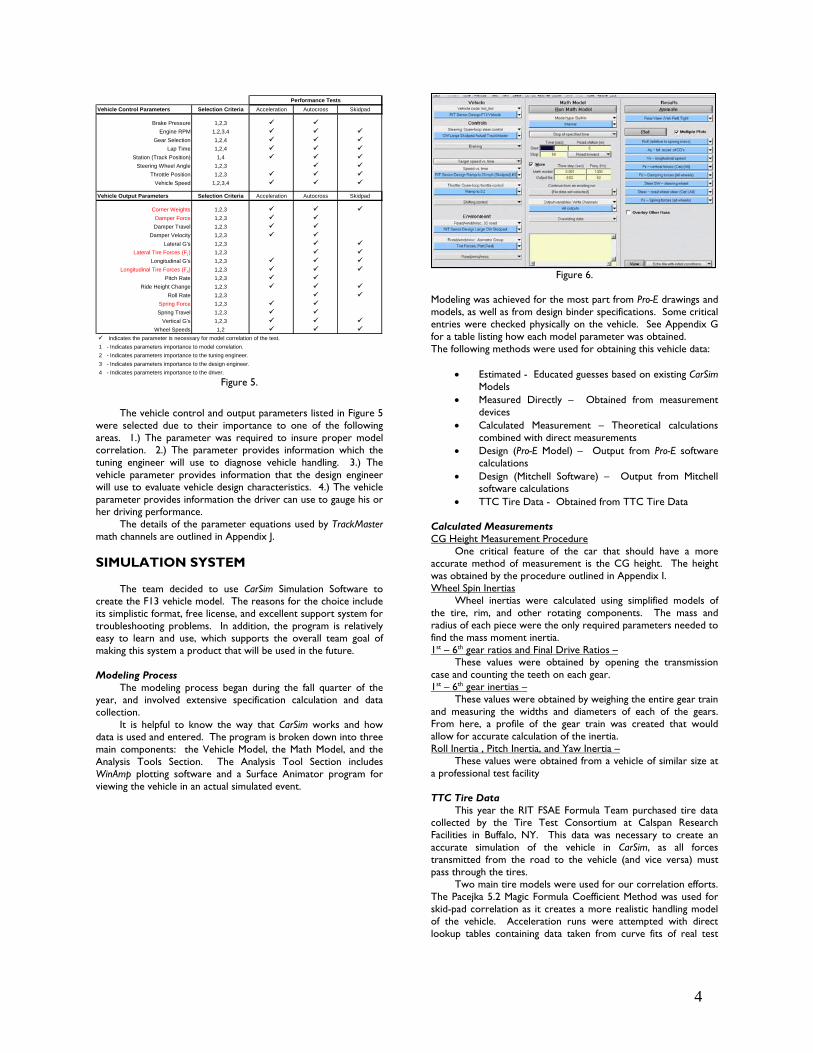
It is helpful to know the way that CarSim works and how data is used and entered. The program is broken down into three main components: the Vehicle Model, the Math Model, and the Analysis Tools Section. The Analysis Tool Section includes WinAmp plotting software and a Surface Animator program for viewing the vehicle in an actual simulated event.
Figure 6.
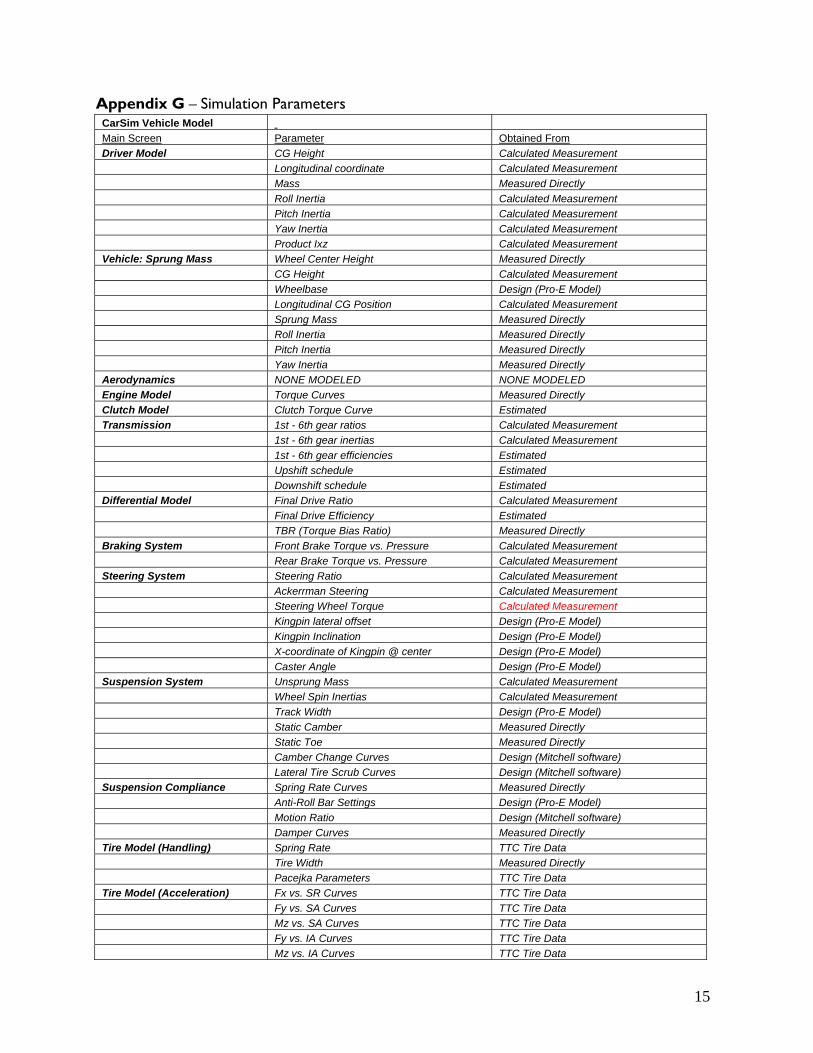
Modeling was achieved for the most part from Pro-E drawings and models, as well as from design binder specifications. Some critical entries were checked physically on the vehicle. See Appendix G for a table listing how each model parameter was obtained. The following methods were used for obtaining this vehicle data:
• Estimated - Educated guesses based on existing CarSim Models
• Measured Directly – Obtained from measurement devices
• Calculated Measurement – Theoretical calculations combined with direct measurements
• Design (Pro-E Model) – Output from Pro-E software calculations
• Design (Mitchell Software) – Output from Mitchell software calculations
• TTC Tire Data - Obtained from TTC Tire Data Calculated Measurements CG Height Measurement Procedure
One critical feature of the car that should have a more accurate method of measurement is the CG height. The height was obtained by the procedure outlined in Appendix I. Wheel Spin Inertias
Wheel inertias were calculated using simplified models of the tire, rim, and other rotating components. The mass and radius of each piece were the only required parameters needed to find the mass moment inertia. 1st – 6th gear ratios and Final Drive Ratios –
These values were obtained by opening the transmission case and counting the teeth on each gear. 1st – 6th gear inertias –
These values were obtained by weighing the entire gear train and measuring the widths and diameters of each of the gears. From here, a profile of the gear train was created that would allow for accurate calculation of the inertia. Roll Inertia , Pitch Inertia, and Yaw Inertia –
These values were obtained from a vehicle of similar size at a professional test facility TTC Tire Data This year the RIT FSAE Formula Team purchased tire data collected by the Tire Test Consortium at Calspan Research Facilities in Buffalo, NY. This data was necessary to create an accurate simulation of the vehicle in CarSim, as all forces transmitted from the road to the vehicle (and vice versa) must pass through the tires. Two main tire models were used for our correlation efforts. The Pacejka 5.2 Magic Formula Coefficient Method was used for skid-pad correlation as it creates a more realistic handling model of the vehicle. Acceleration runs were attempted with direct lookup tables containing data taken from curve fits of real test
5
data. The following tables were required to have a complete tire data set:
• Lateral Force vs. Slip Angle • Lateral Force vs. Camber Angle • Aligning Moment vs. Slip Angle • Aligning Moment vs. Camber Angle • Longitudinal Force vs. Slip Ratio
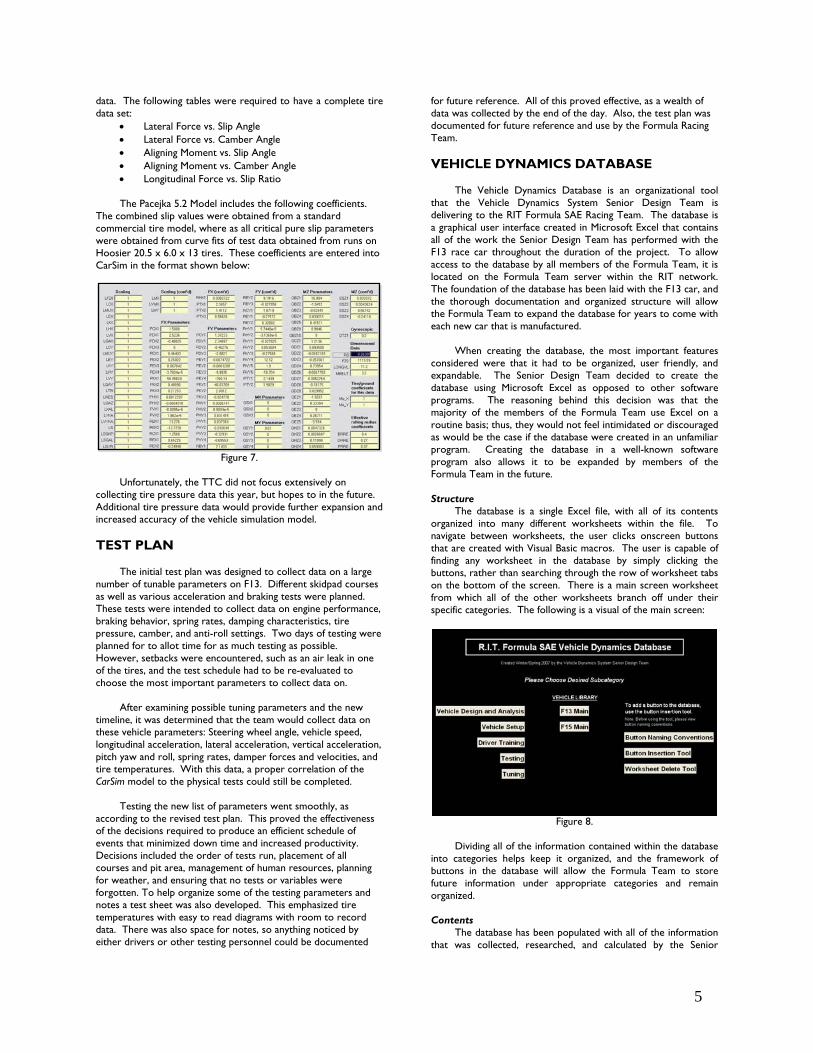
The Pacejka 5.2 Model includes the following coefficients.
The combined slip values were obtained from a standard commercial tire model, where as all critical pure slip parameters were obtained from curve fits of test data obtained from runs on Hoosier 20.5 x 6.0 x 13 tires. These coefficients are entered into CarSim in the format shown below:
Figure 7.
Unfortunately, the TTC did not focus extensively on
collecting tire pressure data this year, but hopes to in the future. Additional tire pressure data would provide further expansion and increased accuracy of the vehicle simulation model. TEST PLAN
The initial test plan was designed to collect data on a large number of tunable parameters on F13. Different skidpad courses as well as various acceleration and braking tests were planned. These tests were intended to collect data on engine performance, braking behavior, spring rates, damping characteristics, tire pressure, camber, and anti-roll settings. Two days of testing were planned for to allot time for as much testing as possible. However, setbacks were encountered, such as an air leak in one of the tires, and the test schedule had to be re-evaluated to choose the most important parameters to collect data on.
After examining possible tuning parameters and the new timeline, it was determined that the team would collect data on these vehicle parameters: Steering wheel angle, vehicle speed, longitudinal acceleration, lateral acceleration, vertical acceleration, pitch yaw and roll, spring rates, damper forces and velocities, and tire temperatures. With this data, a proper correlation of the CarSim model to the physical tests could still be completed.
Testing the new list of parameters went smoothly, as according to the revised test plan. This proved the effectiveness of the decisions required to produce an efficient schedule of events that minimized down time and increased productivity. Decisions included the order of tests run, placement of all courses and pit area, management of human resources, planning for weather, and ensuring that no tests or variables were forgotten. To help organize some of the testing parameters and notes a test sheet was also developed. This emphasized tire temperatures with easy to read diagrams with room to record data. There was also space for notes, so anything noticed by either drivers or other testing personnel could be documented
for future reference. All of this proved effective, as a wealth of data was collected by the end of the day. Also, the test plan was documented for future reference and use by the Formula Racing Team. VEHICLE DYNAMICS DATABASE
The Vehicle Dynamics Database is an organizational tool that the Vehicle Dynamics System Senior Design Team is delivering to the RIT Formula SAE Racing Team. The database is a graphical user interface created in Microsoft Excel that contains all of the work the Senior Design Team has performed with the F13 race car throughout the duration of the project. To allow access to the database by all members of the Formula Team, it is located on the Formula Team server within the RIT network. The foundation of the database has been laid with the F13 car, and the thorough documentation and organized structure will allow the Formula Team to expand the database for years to come with each new car that is manufactured.
When creating the database, the most important features considered were that it had to be organized, user friendly, and expandable. The Senior Design Team decided to create the database using Microsoft Excel as opposed to other software programs. The reasoning behind this decision was that the majority of the members of the Formula Team use Excel on a routine basis; thus, they would not feel intimidated or discouraged as would be the case if the database were created in an unfamiliar program. Creating the database in a well-known software program also allows it to be expanded by members of the Formula Team in the future. Structure
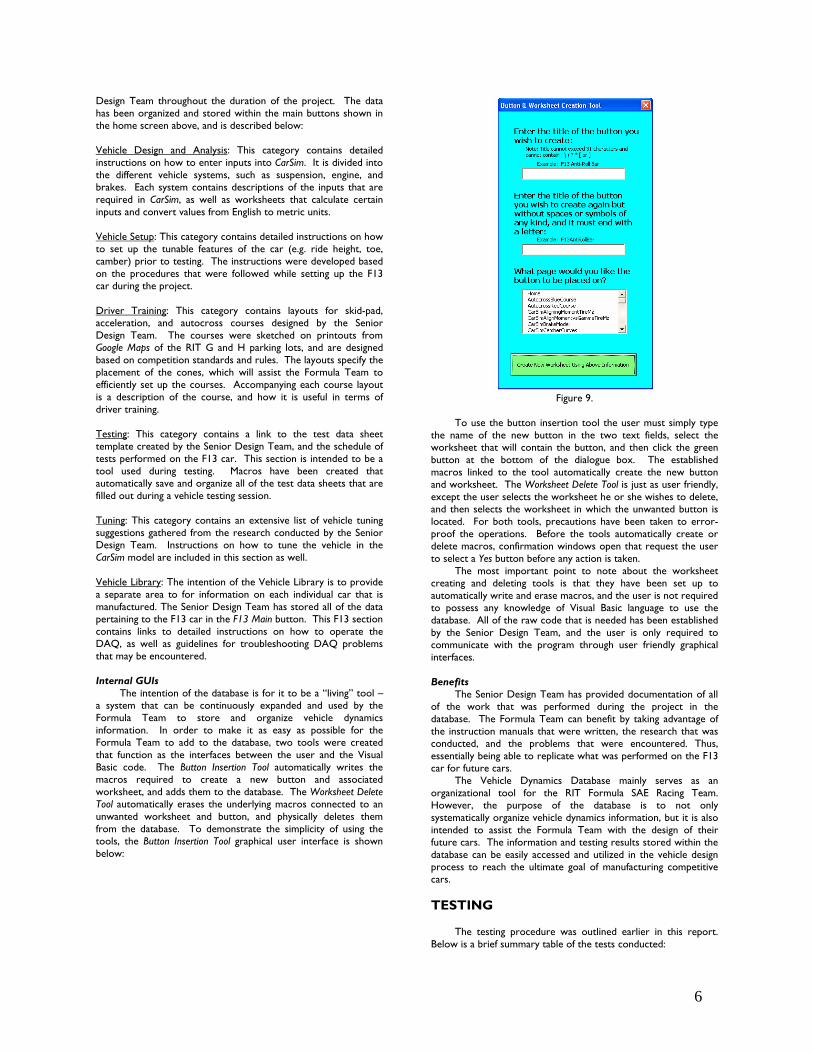
The database is a single Excel file, with all of its contents organized into many different worksheets within the file. To navigate between worksheets, the user clicks onscreen buttons that are created with Visual Basic macros. The user is capable of finding any worksheet in the database by simply clicking the buttons, rather than searching through the row of worksheet tabs on the bottom of the screen. There is a main screen worksheet from which all of the other worksheets branch off under their specific categories. The following is a visual of the main screen:
Figure 8.
Dividing all of the information contained within the database
into categories helps keep it organized, and the framework of buttons in the database will allow the Formula Team to store future information under appropriate categories and remain organized. Contents
The database has been populated with all of the information that was collected, researched, and calculated by the Senior
6
Design Team throughout the duration of the project. The data has been organized and stored within the main buttons shown in the home screen above, and is described below: Vehicle Design and Analysis: This category contains detailed instructions on how to enter inputs into CarSim. It is divided into the different vehicle systems, such as suspension, engine, and brakes. Each system contains descriptions of the inputs that are required in CarSim, as well as worksheets that calculate certain inputs and convert values from English to metric units. Vehicle Setup: This category contains detailed instructions on how to set up the tunable features of the car (e.g. ride height, toe, camber) prior to testing. The instructions were developed based on the procedures that were followed while setting up the F13 car during the project. Driver Training: This category contains layouts for skid-pad, acceleration, and autocross courses designed by the Senior Design Team. The courses were sketched on printouts from Google Maps of the RIT G and H parking lots, and are designed based on competition standards and rules. The layouts specify the placement of the cones, which will assist the Formula Team to efficiently set up the courses. Accompanying each course layout is a description of the course, and how it is useful in terms of driver training. Testing: This category contains a link to the test data sheet template created by the Senior Design Team, and the schedule of tests performed on the F13 car. This section is intended to be a tool used during testing. Macros have been created that automatically save and organize all of the test data sheets that are filled out during a vehicle testing session. Tuning: This category contains an extensive list of vehicle tuning suggestions gathered from the research conducted by the Senior Design Team. Instructions on how to tune the vehicle in the CarSim model are included in this section as well. Vehicle Library: The intention of the Vehicle Library is to provide a separate area to for information on each individual car that is manufactured. The Senior Design Team has stored all of the data pertaining to the F13 car in the F13 Main button. This F13 section contains links to detailed instructions on how to operate the DAQ, as well as guidelines for troubleshooting DAQ problems that may be encountered. Internal GUIs
The intention of the database is for it to be a “living” tool – a system that can be continuously expanded and used by the Formula Team to store and organize vehicle dynamics information. In order to make it as easy as possible for the Formula Team to add to the database, two tools were created that function as the interfaces between the user and the Visual Basic code. The Button Insertion Tool automatically writes the macros required to create a new button and associated worksheet, and adds them to the database. The Worksheet Delete Tool automatically erases the underlying macros connected to an unwanted worksheet and button, and physically deletes them from the database. To demonstrate the simplicity of using the tools, the Button Insertion Tool graphical user interface is shown below:
Figure 9.
To use the button insertion tool the user must simply type
the name of the new button in the two text fields, select the worksheet that will contain the button, and then click the green button at the bottom of the dialogue box. The established macros linked to the tool automatically create the new button and worksheet. The Worksheet Delete Tool is just as user friendly, except the user selects the worksheet he or she wishes to delete, and then selects the worksheet in which the unwanted button is located. For both tools, precautions have been taken to error-proof the operations. Before the tools automatically create or delete macros, confirmation windows open that request the user to select a Yes button before any action is taken.
The most important point to note about the worksheet creating and deleting tools is that they have been set up to automatically write and erase macros, and the user is not required to possess any knowledge of Visual Basic language to use the database. All of the raw code that is needed has been established by the Senior Design Team, and the user is only required to communicate with the program through user friendly graphical interfaces. Benefits
The Senior Design Team has provided documentation of all of the work that was performed during the project in the database. The Formula Team can benefit by taking advantage of the instruction manuals that were written, the research that was conducted, and the problems that were encountered. Thus, essentially being able to replicate what was performed on the F13 car for future cars.
The Vehicle Dynamics Database mainly serves as an organizational tool for the RIT Formula SAE Racing Team. However, the purpose of the database is to not only systematically organize vehicle dynamics information, but it is also intended to assist the Formula Team with the design of their future cars. The information and testing results stored within the database can be easily accessed and utilized in the vehicle design process to reach the ultimate goal of manufacturing competitive cars.
TESTING
The testing procedure was outlined earlier in this report. Below is a brief summary table of the tests conducted:
7
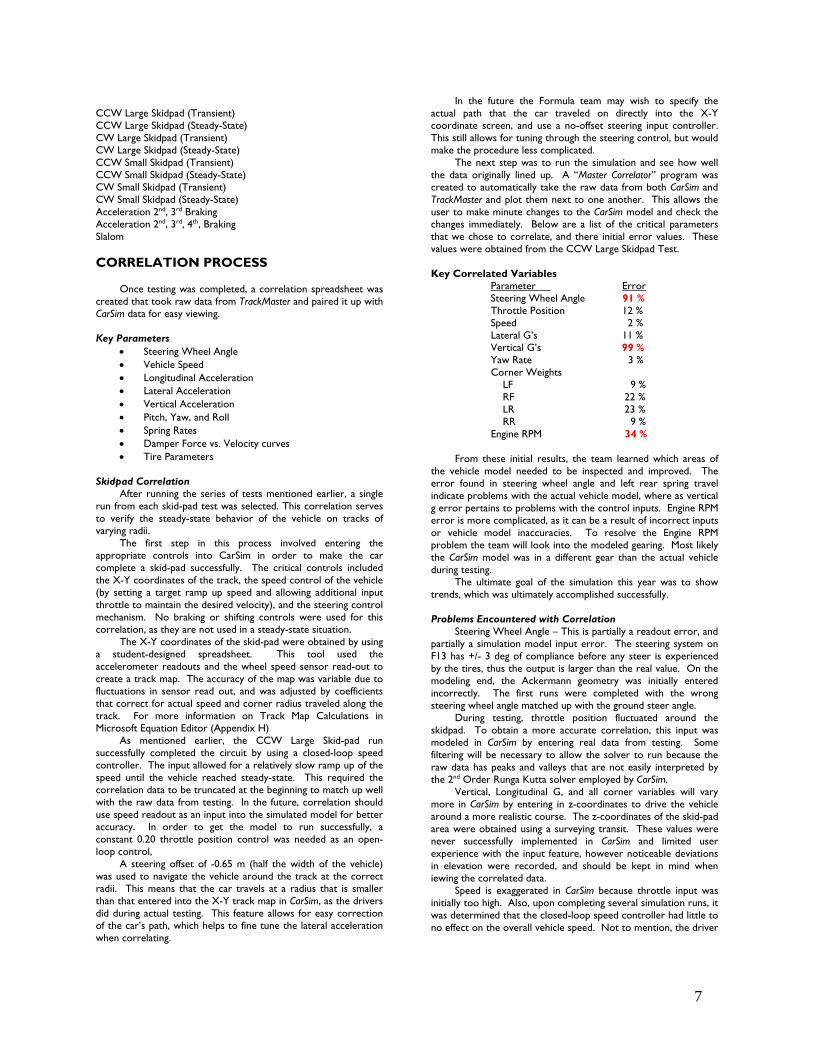
CCW Large Skidpad (Transient) CCW Large Skidpad (Steady-State) CW Large Skidpad (Transient) CW Large Skidpad (Steady-State) CCW Small Skidpad (Transient) CCW Small Skidpad (Steady-State) CW Small Skidpad (Transient) CW Small Skidpad (Steady-State) Acceleration 2nd, 3rd Braking Acceleration 2nd, 3rd, 4th, Braking Slalom CORRELATION PROCESS
Once testing was completed, a correlation spreadsheet was created that took raw data from TrackMaster and paired it up with CarSim data for easy viewing. Key Parameters
• Steering Wheel Angle • Vehicle Speed • Longitudinal Acceleration • Lateral Acceleration • Vertical Acceleration • Pitch, Yaw, and Roll • Spring Rates • Damper Force vs. Velocity curves • Tire Parameters
Skidpad Correlation After running the series of tests mentioned earlier, a single run from each skid-pad test was selected. This correlation serves to verify the steady-state behavior of the vehicle on tracks of varying radii. The first step in this process involved entering the appropriate controls into CarSim in order to make the car complete a skid-pad successfully. The critical controls included the X-Y coordinates of the track, the speed control of the vehicle (by setting a target ramp up speed and allowing additional input throttle to maintain the desired velocity), and the steering control mechanism. No braking or shifting controls were used for this correlation, as they are not used in a steady-state situation. The X-Y coordinates of the skid-pad were obtained by using a student-designed spreadsheet. This tool used the accelerometer readouts and the wheel speed sensor read-out to create a track map. The accuracy of the map was variable due to fluctuations in sensor read out, and was adjusted by coefficients that correct for actual speed and corner radius traveled along the track. For more information on Track Map Calculations in Microsoft Equation Editor (Appendix H) As mentioned earlier, the CCW Large Skid-pad run successfully completed the circuit by using a closed-loop speed controller. The input allowed for a relatively slow ramp up of the speed until the vehicle reached steady-state. This required the correlation data to be truncated at the beginning to match up well with the raw data from testing. In the future, correlation should use speed readout as an input into the simulated model for better accuracy. In order to get the model to run successfully, a constant 0.20 throttle position control was needed as an open-loop control,
A steering offset of -0.65 m (half the width of the vehicle) was used to navigate the vehicle around the track at the correct radii. This means that the car travels at a radius that is smaller than that entered into the X-Y track map in CarSim, as the drivers did during actual testing. This feature allows for easy correction of the car’s path, which helps to fine tune the lateral acceleration when correlating.
In the future the Formula team may wish to specify the actual path that the car traveled on directly into the X-Y coordinate screen, and use a no-offset steering input controller. This still allows for tuning through the steering control, but would make the procedure less complicated. The next step was to run the simulation and see how well the data originally lined up. A “Master Correlator” program was created to automatically take the raw data from both CarSim and TrackMaster and plot them next to one another. This allows the user to make minute changes to the CarSim model and check the changes immediately. Below are a list of the critical parameters that we chose to correlate, and there initial error values. These values were obtained from the CCW Large Skidpad Test. Key Correlated Variables
Parameter Error Steering Wheel Angle 91 % Throttle Position 12 % Speed 2 % Lateral G’s 11 % Vertical G’s 99 % Yaw Rate 3 % Corner Weights LF 9 % RF 22 % LR 23 % RR 9 % Engine RPM 34 %
From these initial results, the team learned which areas of
the vehicle model needed to be inspected and improved. The error found in steering wheel angle and left rear spring travel indicate problems with the actual vehicle model, where as vertical g error pertains to problems with the control inputs. Engine RPM error is more complicated, as it can be a result of incorrect inputs or vehicle model inaccuracies. To resolve the Engine RPM problem the team will look into the modeled gearing. Most likely the CarSim model was in a different gear than the actual vehicle during testing.
The ultimate goal of the simulation this year was to show trends, which was ultimately accomplished successfully. Problems Encountered with Correlation
Steering Wheel Angle – This is partially a readout error, and partially a simulation model input error. The steering system on F13 has +/- 3 deg of compliance before any steer is experienced by the tires, thus the output is larger than the real value. On the modeling end, the Ackermann geometry was initially entered incorrectly. The first runs were completed with the wrong steering wheel angle matched up with the ground steer angle.
During testing, throttle position fluctuated around the skidpad. To obtain a more accurate correlation, this input was modeled in CarSim by entering real data from testing. Some filtering will be necessary to allow the solver to run because the raw data has peaks and valleys that are not easily interpreted by the 2nd Order Runga Kutta solver employed by CarSim.
Vertical, Longitudinal G, and all corner variables will vary more in CarSim by entering in z-coordinates to drive the vehicle around a more realistic course. The z-coordinates of the skid-pad area were obtained using a surveying transit. These values were never successfully implemented in CarSim and limited user experience with the input feature, however noticeable deviations in elevation were recorded, and should be kept in mind when iewing the correlated data.
Speed is exaggerated in CarSim because throttle input was initially too high. Also, upon completing several simulation runs, it was determined that the closed-loop speed controller had little to no effect on the overall vehicle speed. Not to mention, the driver
8
may be trying to improve lap time, and this will be reflected in a non-steady speed. Speed sensor location needs to be corrected for because it is only on the RF wheel, while CarSim calculates the speed at the CG of the vehicle. All of these offsets have been accounted for in the updated correlation spreadsheet. Problem Resolution
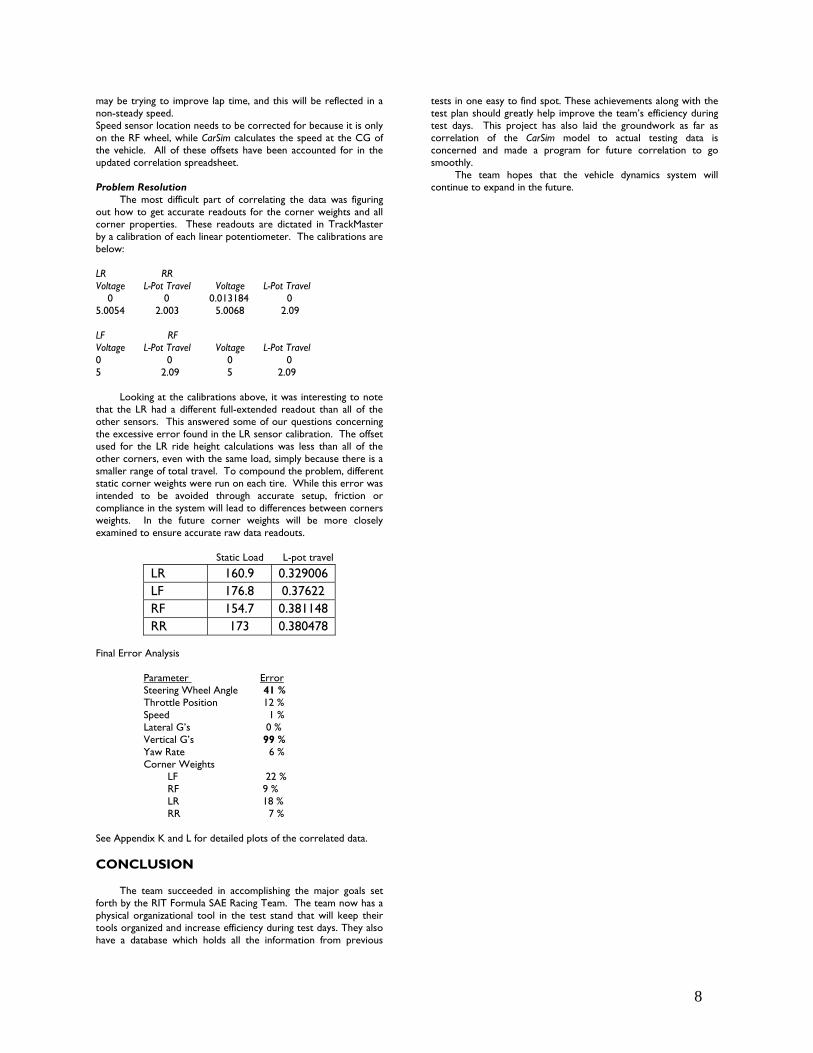
The most difficult part of correlating the data was figuring out how to get accurate readouts for the corner weights and all corner properties. These readouts are dictated in TrackMaster by a calibration of each linear potentiometer. The calibrations are below: LR RR Voltage L-Pot Travel Voltage L-Pot Travel 0 0 0.013184 0 5.0054 2.003 5.0068 2.09 LF RF Voltage L-Pot Travel Voltage L-Pot Travel 0 0 0 0 5 2.09 5 2.09
Looking at the calibrations above, it was interesting to note that the LR had a different full-extended readout than all of the other sensors. This answered some of our questions concerning the excessive error found in the LR sensor calibration. The offset used for the LR ride height calculations was less than all of the other corners, even with the same load, simply because there is a smaller range of total travel. To compound the problem, different static corner weights were run on each tire. While this error was intended to be avoided through accurate setup, friction or compliance in the system will lead to differences between corners weights. In the future corner weights will be more closely examined to ensure accurate raw data readouts.
Static Load L-pot travel
LR 160.9 0.329006 LF 176.8 0.37622 RF 154.7 0.381148 RR 173 0.380478
Final Error Analysis
Parameter Error Steering Wheel Angle 41 % Throttle Position 12 % Speed 1 % Lateral G’s 0 % Vertical G’s 99 % Yaw Rate 6 % Corner Weights LF 22 % RF 9 % LR 18 % RR 7 %
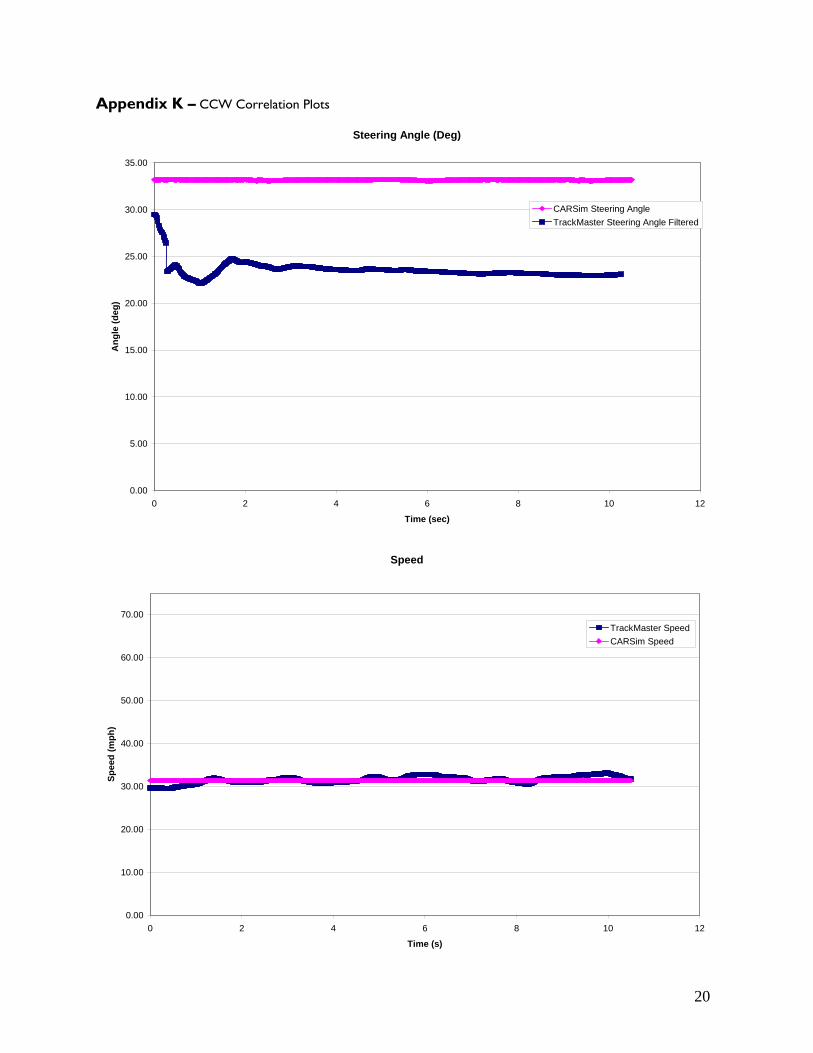
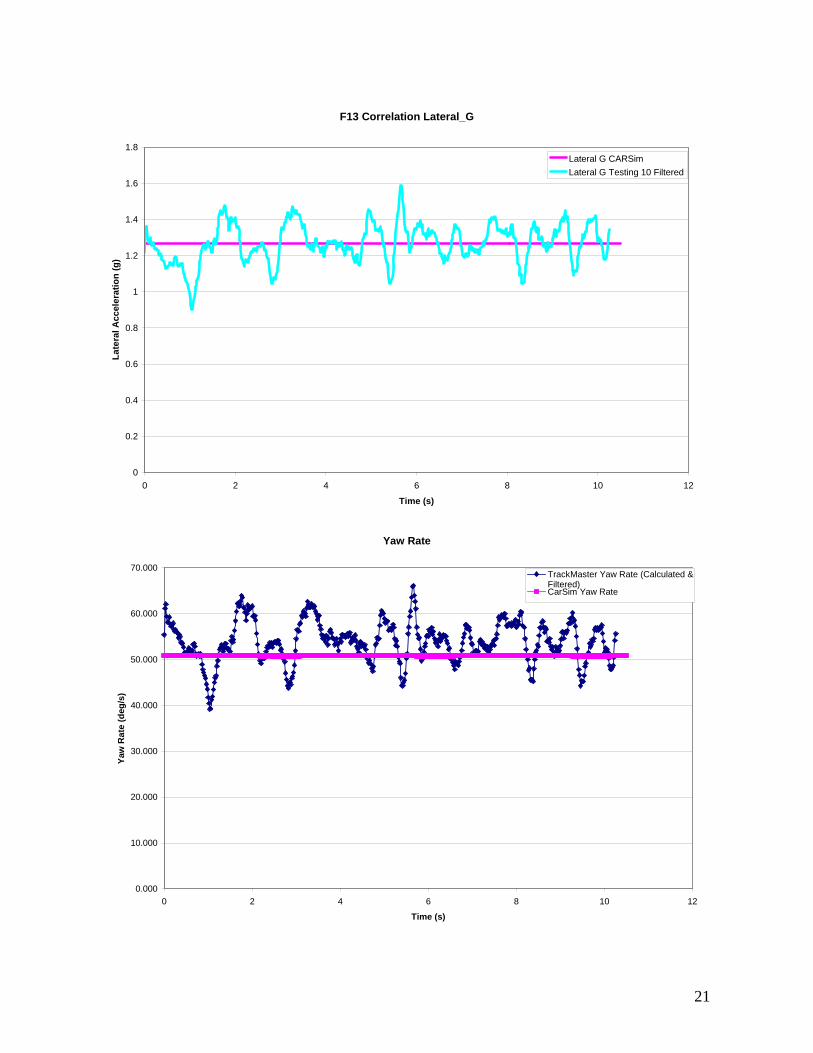
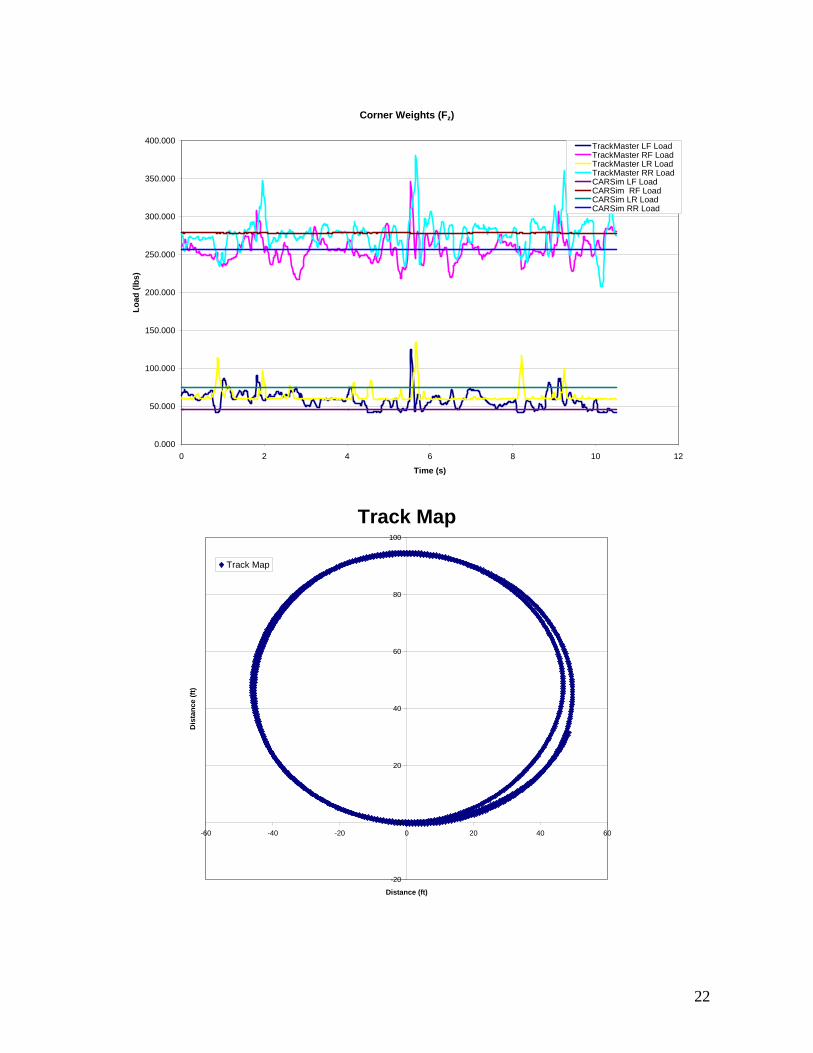
See Appendix K and L for detailed plots of the correlated data.
CONCLUSION
The team succeeded in accomplishing the major goals set forth by the RIT Formula SAE Racing Team. The team now has a physical organizational tool in the test stand that will keep their tools organized and increase efficiency during test days. They also have a database which holds all the information from previous
tests in one easy to find spot. These achievements along with the test plan should greatly help improve the team’s efficiency during test days. This project has also laid the groundwork as far as correlation of the CarSim model to actual testing data is concerned and made a program for future correlation to go smoothly.
The team hopes that the vehicle dynamics system will continue to expand in the future.
9
Appendix A – Live Telemetry System Customer Needs: A system to see data from the car as it is going around the track. A live telemetry system like this would make driver training and tuning a much more interactive session. Currently, the driver must stop and wait five or ten minutes for the data to be downloaded and analyzed before they can be told where they had a bad corner. This is not ideal because the driver forgets what he did and it is not easily corrected on their next run. Customer Deliverables: A live telemetry system for the current data acquisition system. Another deliverable is a database to hold all of the driver training files. This will decrease the amount of time spent during driver training and create overall better drivers for competition. This more efficient system must also be validated; therefore a couple of test days are another deliverable. Customer and Sponsor Involvement: The Formula SAE racing team will be the main customer for this project. A sponsor for this project could be CDS or another data acquisition company that could help the students with engineering and/or parts for the project. Regulatory requirements: FCC and R•I•T should be the only regulatory requirements involved with this project. Project Budget and Special Procurement Processes: The budget for this project will largely depend on how the team goes about creating the system. If they build it from the ground up, the budget should be in the $1,000 to $1,500 range. If the system is bought from a supplier, the price could be up to $4,000. All materials needed should be easily acquired. Intellectual Property considerations: Depending on how strong the signal is and what frequency it is on, there could be FCC implications. Also, if the system is built by the students themselves, there could be patents on some of the systems. Other: N/A
10
Appendix B – Stand Alone DAQ Customer Needs: A data acquisition system that is separate from the electrical system and can be easily removed from the vehicle. The only connection into the electrical system would be to the power source on the vehicle. All brackets that mount sensors must use existing fasteners and be able to attach to existing components. Customer Deliverables: The system would use a total of nine sensors and eleven data channels. From the data channels math channels can be formulated to calculate pitch and roll angle. This stand alone system must provide the core parameters that will allow the team to have suspension and driver diagnosis and development capabilities. If the Formula team requests a more in depth study of suspension systems the addition of strain gages would be necessary. Vehicle Parameters:
I. General DAQ
a. 20 minute logging card b. 4 MB card
II. Chassis/suspension parameters a. Lateral/Longitudinal/Vertical acceleration
i. 3-axis accelerometer b. Pitch Angle
i. Use CDS software to calculate c. Roll angle
i. Use CDS software to calculate d. Damper Travel (position)
i. Linear potentiometers for each shock, total of 4 sensors e. Front wheel speed
i. Hall effect sensor, used to calculate vehicle speed and create track map f. Steering Wheel Angle
i. String-potentiometer with pulley on steering shaft ii.
III. Engine Parameters a. Engine Speed
i. Hall effect sensor, already used by engine computer
b. Throttle position i. Throttle position sensor, already used by engine computer
Customer and Sponsor Involvement: The RIT Formula SAE Racing Team would be the main customer for the project and could supple the sensors, wiring, and DAQ unit
11
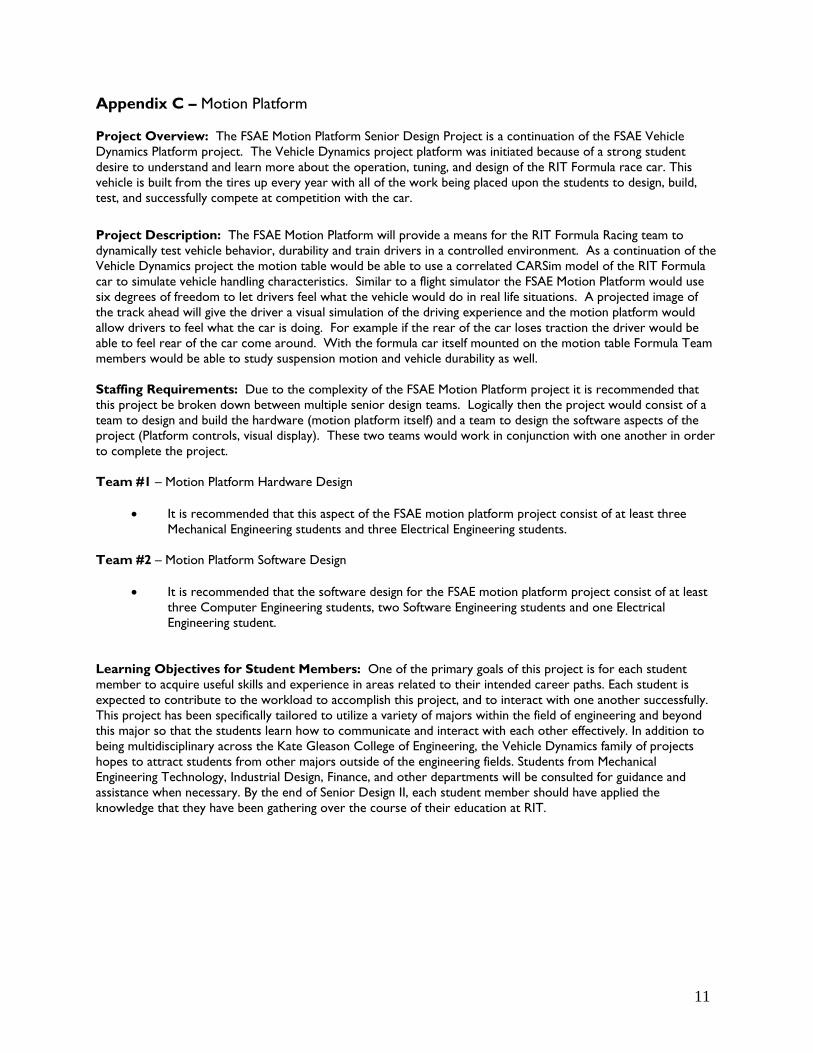
Appendix C – Motion Platform Project Overview: The FSAE Motion Platform Senior Design Project is a continuation of the FSAE Vehicle Dynamics Platform project. The Vehicle Dynamics project platform was initiated because of a strong student desire to understand and learn more about the operation, tuning, and design of the RIT Formula race car. This vehicle is built from the tires up every year with all of the work being placed upon the students to design, build, test, and successfully compete at competition with the car. Project Description: The FSAE Motion Platform will provide a means for the RIT Formula Racing team to dynamically test vehicle behavior, durability and train drivers in a controlled environment. As a continuation of the Vehicle Dynamics project the motion table would be able to use a correlated CARSim model of the RIT Formula car to simulate vehicle handling characteristics. Similar to a flight simulator the FSAE Motion Platform would use six degrees of freedom to let drivers feel what the vehicle would do in real life situations. A projected image of the track ahead will give the driver a visual simulation of the driving experience and the motion platform would allow drivers to feel what the car is doing. For example if the rear of the car loses traction the driver would be able to feel rear of the car come around. With the formula car itself mounted on the motion table Formula Team members would be able to study suspension motion and vehicle durability as well. Staffing Requirements: Due to the complexity of the FSAE Motion Platform project it is recommended that this project be broken down between multiple senior design teams. Logically then the project would consist of a team to design and build the hardware (motion platform itself) and a team to design the software aspects of the project (Platform controls, visual display). These two teams would work in conjunction with one another in order to complete the project. Team #1 – Motion Platform Hardware Design
• It is recommended that this aspect of the FSAE motion platform project consist of at least three Mechanical Engineering students and three Electrical Engineering students.
Team #2 – Motion Platform Software Design
• It is recommended that the software design for the FSAE motion platform project consist of at least three Computer Engineering students, two Software Engineering students and one Electrical Engineering student.
Learning Objectives for Student Members: One of the primary goals of this project is for each student member to acquire useful skills and experience in areas related to their intended career paths. Each student is expected to contribute to the workload to accomplish this project, and to interact with one another successfully. This project has been specifically tailored to utilize a variety of majors within the field of engineering and beyond this major so that the students learn how to communicate and interact with each other effectively. In addition to being multidisciplinary across the Kate Gleason College of Engineering, the Vehicle Dynamics family of projects hopes to attract students from other majors outside of the engineering fields. Students from Mechanical Engineering Technology, Industrial Design, Finance, and other departments will be consulted for guidance and assistance when necessary. By the end of Senior Design II, each student member should have applied the knowledge that they have been gathering over the course of their education at RIT.
12
Appendix D – Driver Health and Fitness Customer Needs: The RIT Formula Racing Team needs racecar drivers that are in good shape and good health for optimal performance of the vehicle during dynamic events at competition. Customer Deliverables: Proper nutrition guidelines geared towards drivers that are trying to have a minimal body weight, good overall strength for handling the racecar (arm strength for steering, and leg strength for braking for example), and good stamina for the endurance event. An exercise plan could be laid out to aid in all of those areas. Customer and Sponsor Involvement: The RIT Formula Racing Team as well as the respective departments from which any students studying nutrition and exercise are from could sponsor this project. Customer involvement could include select team members trying out the diet and exercise plans and provide feedback for fine tuning. Regulatory Requirements: FDA, FCC, SAE, RIT Project Budget and Special Procurement Processes: N/A Intellectual Property Considerations: N/A Other: N/A
13
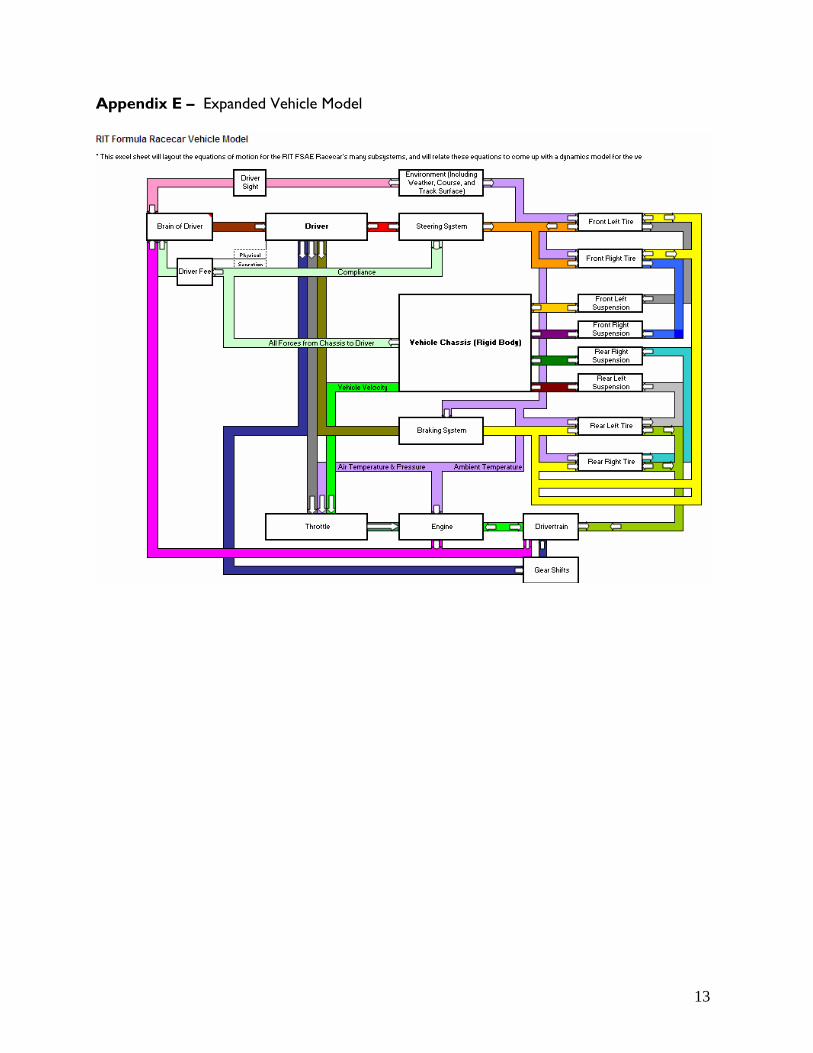
Appendix E – Expanded Vehicle Model
14
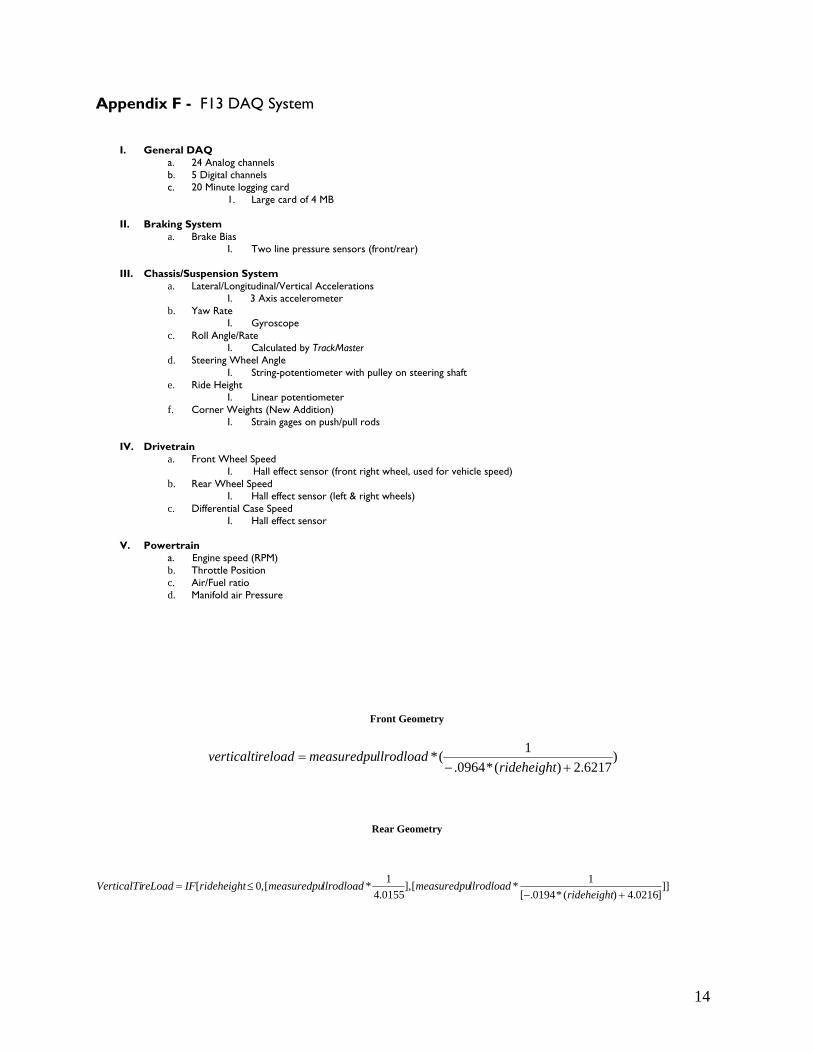
Appendix F - F13 DAQ System
I. General DAQ a. 24 Analog channels b. 5 Digital channels c. 20 Minute logging card
1. Large card of 4 MB
II. Braking System a. Brake Bias
I. Two line pressure sensors (front/rear)
III. Chassis/Suspension System a. Lateral/Longitudinal/Vertical Accelerations
I. 3 Axis accelerometer b. Yaw Rate
I. Gyroscope c. Roll Angle/Rate
I. Calculated by TrackMaster d. Steering Wheel Angle
I. String-potentiometer with pulley on steering shaft e. Ride Height
I. Linear potentiometer f. Corner Weights (New Addition)
I. Strain gages on push/pull rods
IV. Drivetrain a. Front Wheel Speed
I. Hall effect sensor (front right wheel, used for vehicle speed) b. Rear Wheel Speed
I. Hall effect sensor (left & right wheels) c. Differential Case Speed
I. Hall effect sensor
V. Powertrain a. Engine speed (RPM) b. Throttle Position c. Air/Fuel ratio d. Manifold air Pressure
Front Geometry
Rear Geometry
]]]0216.4)(*0194.[
1*[],0155.41*[,0[
+−≤=
rideheightllrodloadmeasuredpullrodloadmeasuredpurideheightIFreLoadVerticalTi
)6217.2)(*0964.
1(*+−
=rideheight
llrodloadmeasuredpureloadverticalti
15
Appendix G – Simulation Parameters CarSim Vehicle Model Main Screen Parameter Obtained From Driver Model CG Height Calculated Measurement Longitudinal coordinate Calculated Measurement Mass Measured Directly Roll Inertia Calculated Measurement Pitch Inertia Calculated Measurement Yaw Inertia Calculated Measurement Product Ixz Calculated Measurement Vehicle: Sprung Mass Wheel Center Height Measured Directly CG Height Calculated Measurement Wheelbase Design (Pro-E Model) Longitudinal CG Position Calculated Measurement Sprung Mass Measured Directly Roll Inertia Measured Directly Pitch Inertia Measured Directly Yaw Inertia Measured Directly Aerodynamics NONE MODELED NONE MODELED Engine Model Torque Curves Measured Directly Clutch Model Clutch Torque Curve Estimated Transmission 1st - 6th gear ratios Calculated Measurement 1st - 6th gear inertias Calculated Measurement 1st - 6th gear efficiencies Estimated Upshift schedule Estimated Downshift schedule Estimated Differential Model Final Drive Ratio Calculated Measurement Final Drive Efficiency Estimated TBR (Torque Bias Ratio) Measured Directly Braking System Front Brake Torque vs. Pressure Calculated Measurement Rear Brake Torque vs. Pressure Calculated Measurement Steering System Steering Ratio Calculated Measurement Ackerrman Steering Calculated Measurement Steering Wheel Torque Calculated Measurement Kingpin lateral offset Design (Pro-E Model) Kingpin Inclination Design (Pro-E Model) X-coordinate of Kingpin @ center Design (Pro-E Model) Caster Angle Design (Pro-E Model) Suspension System Unsprung Mass Calculated Measurement Wheel Spin Inertias Calculated Measurement Track Width Design (Pro-E Model) Static Camber Measured Directly Static Toe Measured Directly Camber Change Curves Design (Mitchell software) Lateral Tire Scrub Curves Design (Mitchell software) Suspension Compliance Spring Rate Curves Measured Directly Anti-Roll Bar Settings Design (Pro-E Model) Motion Ratio Design (Mitchell software) Damper Curves Measured Directly Tire Model (Handling) Spring Rate TTC Tire Data Tire Width Measured Directly Pacejka Parameters TTC Tire Data Tire Model (Acceleration) Fx vs. SR Curves TTC Tire Data Fy vs. SA Curves TTC Tire Data Mz vs. SA Curves TTC Tire Data Fy vs. IA Curves TTC Tire Data Mz vs. IA Curves TTC Tire Data
16
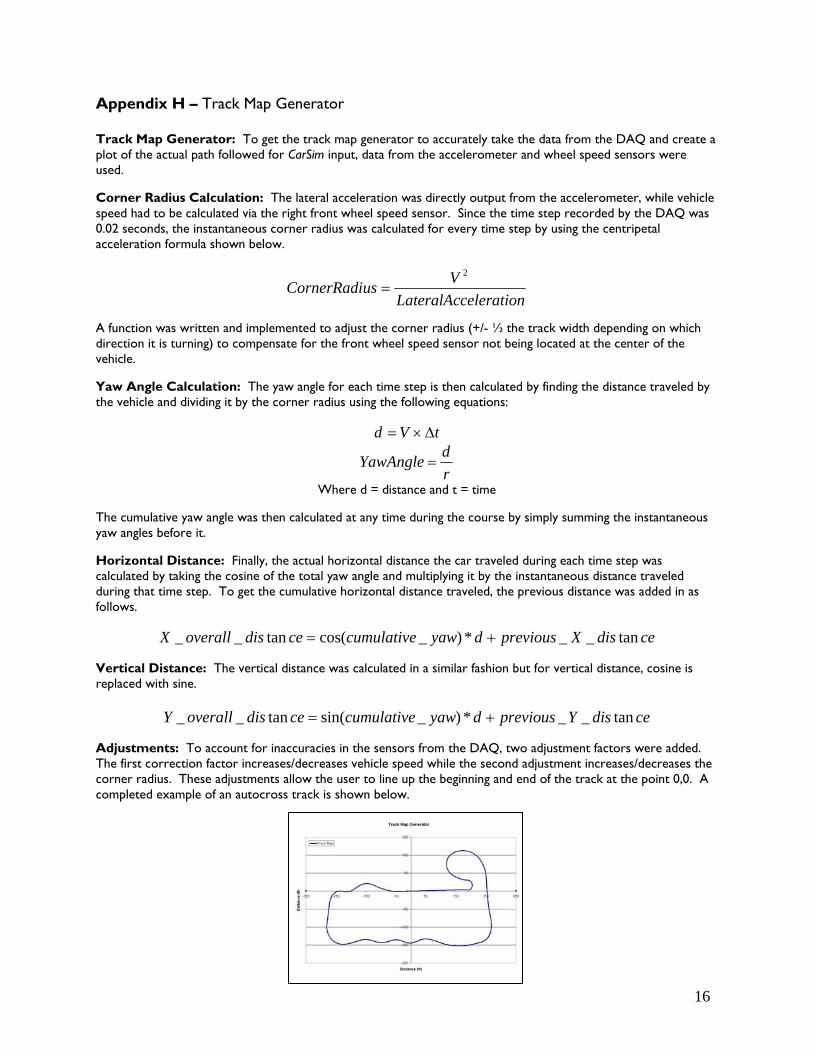
Appendix H – Track Map Generator Track Map Generator: To get the track map generator to accurately take the data from the DAQ and create a plot of the actual path followed for CarSim input, data from the accelerometer and wheel speed sensors were used. Corner Radius Calculation: The lateral acceleration was directly output from the accelerometer, while vehicle speed had to be calculated via the right front wheel speed sensor. Since the time step recorded by the DAQ was 0.02 seconds, the instantaneous corner radius was calculated for every time step by using the centripetal acceleration formula shown below.
elerationLateralAccVusCornerRadi
2
=
A function was written and implemented to adjust the corner radius (+/- ½ the track width depending on which direction it is turning) to compensate for the front wheel speed sensor not being located at the center of the vehicle. Yaw Angle Calculation: The yaw angle for each time step is then calculated by finding the distance traveled by the vehicle and dividing it by the corner radius using the following equations:
tVd Δ×=
rdYawAngle =
Where d = distance and t = time
The cumulative yaw angle was then calculated at any time during the course by simply summing the instantaneous yaw angles before it. Horizontal Distance: Finally, the actual horizontal distance the car traveled during each time step was calculated by taking the cosine of the total yaw angle and multiplying it by the instantaneous distance traveled during that time step. To get the cumulative horizontal distance traveled, the previous distance was added in as follows.
cedisXpreviousdyawcumulativecedisoverallX tan__*)_cos(tan__ += Vertical Distance: The vertical distance was calculated in a similar fashion but for vertical distance, cosine is replaced with sine.
cedisYpreviousdyawcumulativecedisoverallY tan__*)_sin(tan__ +=
Adjustments: To account for inaccuracies in the sensors from the DAQ, two adjustment factors were added. The first correction factor increases/decreases vehicle speed while the second adjustment increases/decreases the corner radius. These adjustments allow the user to line up the beginning and end of the track at the point 0,0. A completed example of an autocross track is shown below.
17
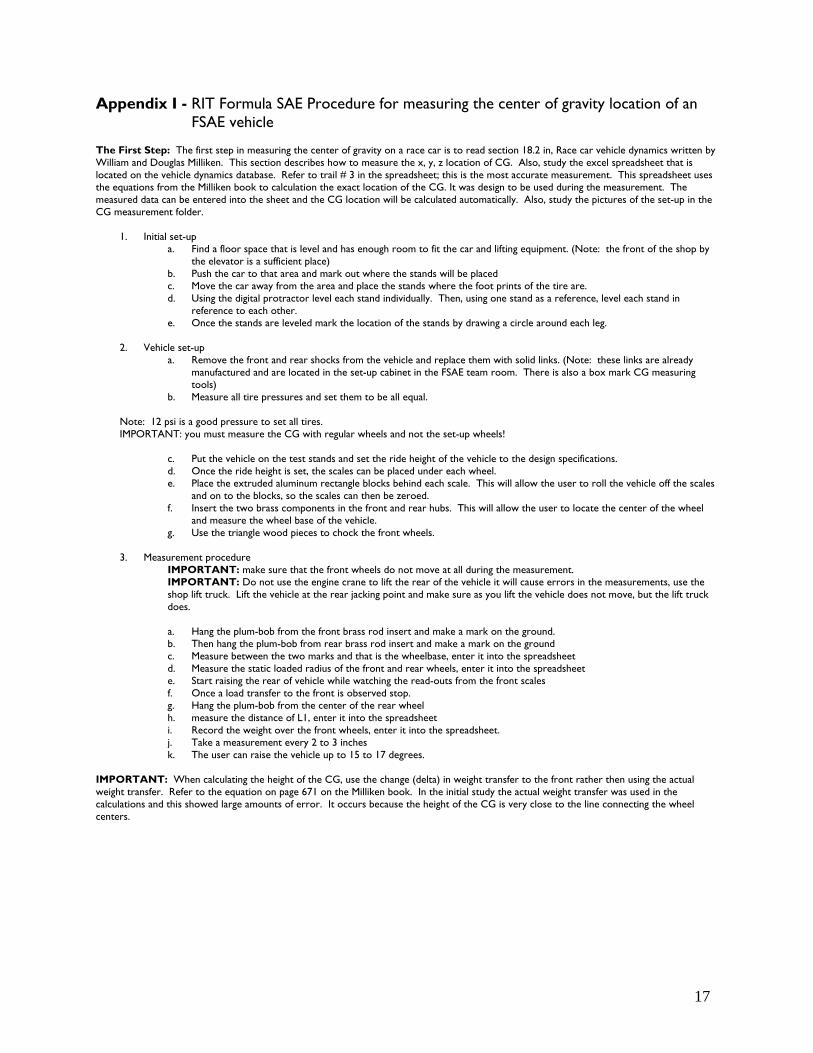
Appendix I - RIT Formula SAE Procedure for measuring the center of gravity location of an FSAE vehicle
The First Step: The first step in measuring the center of gravity on a race car is to read section 18.2 in, Race car vehicle dynamics written by William and Douglas Milliken. This section describes how to measure the x, y, z location of CG. Also, study the excel spreadsheet that is located on the vehicle dynamics database. Refer to trail # 3 in the spreadsheet; this is the most accurate measurement. This spreadsheet uses the equations from the Milliken book to calculation the exact location of the CG. It was design to be used during the measurement. The measured data can be entered into the sheet and the CG location will be calculated automatically. Also, study the pictures of the set-up in the CG measurement folder.
1. Initial set-up
a. Find a floor space that is level and has enough room to fit the car and lifting equipment. (Note: the front of the shop by the elevator is a sufficient place)
b. Push the car to that area and mark out where the stands will be placed c. Move the car away from the area and place the stands where the foot prints of the tire are. d. Using the digital protractor level each stand individually. Then, using one stand as a reference, level each stand in
reference to each other. e. Once the stands are leveled mark the location of the stands by drawing a circle around each leg.
2. Vehicle set-up
a. Remove the front and rear shocks from the vehicle and replace them with solid links. (Note: these links are already manufactured and are located in the set-up cabinet in the FSAE team room. There is also a box mark CG measuring tools)
b. Measure all tire pressures and set them to be all equal. Note: 12 psi is a good pressure to set all tires. IMPORTANT: you must measure the CG with regular wheels and not the set-up wheels!
c. Put the vehicle on the test stands and set the ride height of the vehicle to the design specifications. d. Once the ride height is set, the scales can be placed under each wheel. e. Place the extruded aluminum rectangle blocks behind each scale. This will allow the user to roll the vehicle off the scales
and on to the blocks, so the scales can then be zeroed. f. Insert the two brass components in the front and rear hubs. This will allow the user to locate the center of the wheel
and measure the wheel base of the vehicle. g. Use the triangle wood pieces to chock the front wheels.
3. Measurement procedure IMPORTANT: make sure that the front wheels do not move at all during the measurement. IMPORTANT: Do not use the engine crane to lift the rear of the vehicle it will cause errors in the measurements, use the shop lift truck. Lift the vehicle at the rear jacking point and make sure as you lift the vehicle does not move, but the lift truck does. a. Hang the plum-bob from the front brass rod insert and make a mark on the ground. b. Then hang the plum-bob from rear brass rod insert and make a mark on the ground c. Measure between the two marks and that is the wheelbase, enter it into the spreadsheet d. Measure the static loaded radius of the front and rear wheels, enter it into the spreadsheet e. Start raising the rear of vehicle while watching the read-outs from the front scales f. Once a load transfer to the front is observed stop. g. Hang the plum-bob from the center of the rear wheel h. measure the distance of L1, enter it into the spreadsheet i. Record the weight over the front wheels, enter it into the spreadsheet. j. Take a measurement every 2 to 3 inches k. The user can raise the vehicle up to 15 to 17 degrees.
IMPORTANT: When calculating the height of the CG, use the change (delta) in weight transfer to the front rather then using the actual weight transfer. Refer to the equation on page 671 on the Milliken book. In the initial study the actual weight transfer was used in the calculations and this showed large amounts of error. It occurs because the height of the CG is very close to the line connecting the wheel centers.
18
Appendix J – Math Channels
Math Channel
Signal Formula
AVG_ROLL (FRNT_ROLL+REAR_ROLL)/2
BITE 100*(RF_LOAD+LR_LOAD)/(LF_LOAD+RF_LOAD+LR_LOAD+RR_LOAD)
BRAKING POSITIVE(SML(LONG_G))
COASTING POSITIVE(1 - POSITIVE(LONG_G / MAX(LONG_G)) - POSITIVE(THROTTLE / MAX(THROTTLE)))
COMBINED_G SQRT(LONG_G^2 + LATERAL_G^2)
CORN_RADIUS (SPEED*1.467) ^ 2/(SMM(LATERAL_G)*32.167)
CV_RUN_SEG (SMM(ENGINE_R)>MAX_REVS)? 1:0
CV_RUN_START (SMM(ENGINE_R)>MIN_REVS)? 1:0
CV_RUN_STOP (SMM(ENGINE_R)<(.5*MIN_REVS))? 1:0
ENGINE_RATE DERV(ENGINE_R)
FRNT_RIDE MAP:(LF_SUSP * CONSTANT(LF_INV/(2*LF_SEN_MR))) + (RF_SUSP * CONSTANT(RF_INV/(2*RF_SEN_MR)))
FRNT_ROLL MAP:ATAN((LF_SUSP * CONSTANT(LF_INV/(FTW*LF_SEN_MR))) - (RF_SUSP * CONSTANT(RF_INV/(FTW*RF_SEN_MR))))
GEAR_1 (GEARCOUNT >= 1) ? (SMM(GEARS) > (FINALDRIVE* (RATIO_1+RATIO_2)/2) ? 1 : 0) : 0
GEAR_2 (GEARCOUNT >= 2) ? (BETWEEN(CONSTANT(FINALDRIVE * (RATIO_2+RATIO_3)/2), SMM(GEARS), CONSTANT(FINALDRIVE * (RATIO_2+RATIO_1)/2)) ? 1 : 0) : 0
GEAR_3 (GEARCOUNT >= 3) ? (BETWEEN(CONSTANT(FINALDRIVE * (RATIO_3+RATIO_4)/2), SMM(GEARS), CONSTANT(FINALDRIVE * (RATIO_3+RATIO_2)/2)) ? 1 : 0) : 0
GEAR_4 (GEARCOUNT >= 4) ? (BETWEEN(CONSTANT(FINALDRIVE * (RATIO_4+RATIO_5)/2), SMM(GEARS), CONSTANT(FINALDRIVE * (RATIO_4+RATIO_3)/2)) ? 1 : 0) : 0
GEAR_5 (GEARCOUNT >= 5) ? (BETWEEN(CONSTANT(FINALDRIVE * (RATIO_5+RATIO_6)/2), SMM(GEARS), CONSTANT(FINALDRIVE * (RATIO_5+RATIO_4)/2)) ? 1 : 0) : 0
GEAR_6 (GEARCOUNT >= 6) ? (BETWEEN(CONSTANT(FINALDRIVE * (RATIO_6+RATIO_7)/2), SMM(GEARS), CONSTANT(FINALDRIVE * (RATIO_6+RATIO_5)/2)) ? 1 : 0) : 0
GEARS (WHEEL_R = 0.0) ? 0.0 : ENGINE_R / WHEEL_R
HANDLING (ABS(SMM(LATERAL_G))>1)? (STEERING-IDEAL_STEER)/(SMM(ABS(LATERAL_G))) : 0
HEAVE (FRNT_RIDE+REAR_RIDE)/2
HI_SPEED (SPEED > MED_SPEED_LIMIT)? 1:0
IDEAL_STEER ATAN(WB/(12*CORN_RADIUS))
IN_GEAR (INT(GEAR_1))*1+(INT(GEAR_2))*2+(INT(GEAR_3))*3+(INT(GEAR_4))*4+(INT(GEAR_5))*5+(INT(GEAR_6))*6+(INT(GEAR_7))*7
LAP_DISTANCE INTEG(SPEED*5280/3600)
LF_LOAD LF_STATIC-LF_WHEEL*LF_WHEEL_RATE
LF_RIDE (LF_SUSP * CONSTANT(LF_INV/LF_SEN_MR)) + F_STATIC
LF_SHKSPD (NEXT(RAW(LF_SUSP)) - RAW(LF_SUSP)) * CONSTANT(LF_INV*LF_SHOCK_MR*RATE(LF_SUSP)/LF_SEN_MR)
LF_WHEEL (LF_SUSP * CONSTANT(LF_INV/LF_SEN_MR))
LONG_G (-(DERV(SMH(SPEED)) * CONSTANT((5280 / (60 * 60)) / 32.2)))
LOW_SPEED (SPEED < LOW_SPEED_LIMIT)? 1:0
19
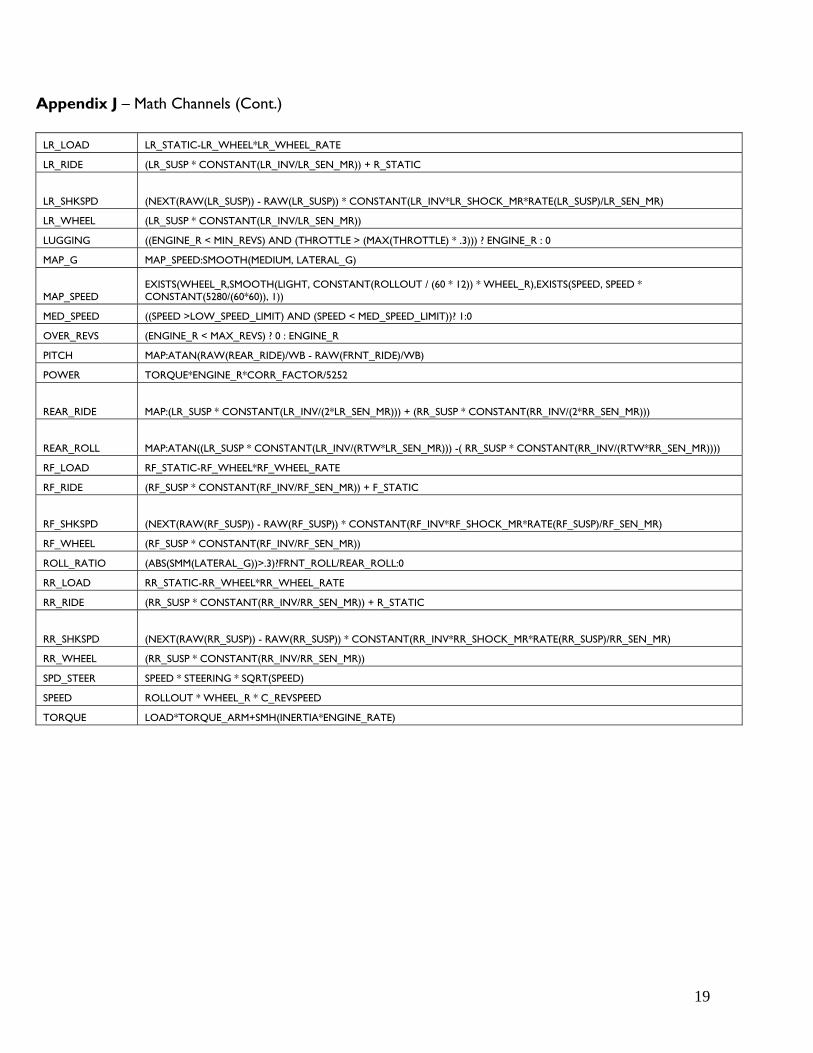
Appendix J – Math Channels (Cont.)
LR_LOAD LR_STATIC-LR_WHEEL*LR_WHEEL_RATE
LR_RIDE (LR_SUSP * CONSTANT(LR_INV/LR_SEN_MR)) + R_STATIC
LR_SHKSPD (NEXT(RAW(LR_SUSP)) - RAW(LR_SUSP)) * CONSTANT(LR_INV*LR_SHOCK_MR*RATE(LR_SUSP)/LR_SEN_MR)
LR_WHEEL (LR_SUSP * CONSTANT(LR_INV/LR_SEN_MR))
LUGGING ((ENGINE_R < MIN_REVS) AND (THROTTLE > (MAX(THROTTLE) * .3))) ? ENGINE_R : 0
MAP_G MAP_SPEED:SMOOTH(MEDIUM, LATERAL_G)
MAP_SPEED EXISTS(WHEEL_R,SMOOTH(LIGHT, CONSTANT(ROLLOUT / (60 * 12)) * WHEEL_R),EXISTS(SPEED, SPEED * CONSTANT(5280/(60*60)), 1))
MED_SPEED ((SPEED >LOW_SPEED_LIMIT) AND (SPEED < MED_SPEED_LIMIT))? 1:0
OVER_REVS (ENGINE_R < MAX_REVS) ? 0 : ENGINE_R
PITCH MAP:ATAN(RAW(REAR_RIDE)/WB - RAW(FRNT_RIDE)/WB)
POWER TORQUE*ENGINE_R*CORR_FACTOR/5252
REAR_RIDE MAP:(LR_SUSP * CONSTANT(LR_INV/(2*LR_SEN_MR))) + (RR_SUSP * CONSTANT(RR_INV/(2*RR_SEN_MR)))
REAR_ROLL MAP:ATAN((LR_SUSP * CONSTANT(LR_INV/(RTW*LR_SEN_MR))) -( RR_SUSP * CONSTANT(RR_INV/(RTW*RR_SEN_MR))))
RF_LOAD RF_STATIC-RF_WHEEL*RF_WHEEL_RATE
RF_RIDE (RF_SUSP * CONSTANT(RF_INV/RF_SEN_MR)) + F_STATIC
RF_SHKSPD (NEXT(RAW(RF_SUSP)) - RAW(RF_SUSP)) * CONSTANT(RF_INV*RF_SHOCK_MR*RATE(RF_SUSP)/RF_SEN_MR)
RF_WHEEL (RF_SUSP * CONSTANT(RF_INV/RF_SEN_MR))
ROLL_RATIO (ABS(SMM(LATERAL_G))>.3)?FRNT_ROLL/REAR_ROLL:0
RR_LOAD RR_STATIC-RR_WHEEL*RR_WHEEL_RATE
RR_RIDE (RR_SUSP * CONSTANT(RR_INV/RR_SEN_MR)) + R_STATIC
RR_SHKSPD (NEXT(RAW(RR_SUSP)) - RAW(RR_SUSP)) * CONSTANT(RR_INV*RR_SHOCK_MR*RATE(RR_SUSP)/RR_SEN_MR)
RR_WHEEL (RR_SUSP * CONSTANT(RR_INV/RR_SEN_MR))
SPD_STEER SPEED * STEERING * SQRT(SPEED)
SPEED ROLLOUT * WHEEL_R * C_REVSPEED
TORQUE LOAD*TORQUE_ARM+SMH(INERTIA*ENGINE_RATE)
20
Appendix K – CCW Correlation Plots
Steering Angle (Deg)
0.00
5.00
10.00
15.00
20.00
25.00
30.00
35.00
0 2 4 6 8 10 12
Time (sec)
Ang
le (d
eg)
CARSim Steering AngleTrackMaster Steering Angle Filtered
Speed
0.00
10.00
20.00
30.00
40.00
50.00
60.00
70.00
0 2 4 6 8 10 12
Time (s)
Spee
d (m
ph)
TrackMaster Speed CARSim Speed
21
F13 Correlation Lateral_G
0
0.2
0.4
0.6
0.8
1
1.2
1.4
1.6
1.8
0 2 4 6 8 10 12
Time (s)
Late
ral A
ccel
erat
ion
(g)
Lateral G CARSimLateral G Testing 10 Filtered
Yaw Rate
0.000
10.000
20.000
30.000
40.000
50.000
60.000
70.000
0 2 4 6 8 10 12
Time (s)
Yaw
Rat
e (d
eg/s
)
TrackMaster Yaw Rate (Calculated &Filtered)CarSim Yaw Rate
22
Corner Weights (Fz)
0.000
50.000
100.000
150.000
200.000
250.000
300.000
350.000
400.000
0 2 4 6 8 10 12
Time (s)
Load
(lbs
)TrackMaster LF LoadTrackMaster RF LoadTrackMaster LR LoadTrackMaster RR LoadCARSim LF LoadCARSim RF LoadCARSim LR LoadCARSim RR Load
Track Map
-20
0
20
40
60
80
100
-60 -40 -20 0 20 40 60
Distance (ft)
Dis
tanc
e (ft
)
Track Map

23
APPENDIX L – CW Skidpad Correlation
Steering Angle (Deg)
-50.00
-45.00
-40.00
-35.00
-30.00
-25.00
-20.00
-15.00
-10.00
-5.00
0.000 2 4 6 8 10 12
Time (sec)
Ang
le (d
eg)
CARSim Steering AngleTrackMaster Steering Angle Filtered
Speed
0.00
10.00
20.00
30.00
40.00
50.00
60.00
70.00
0 2 4 6 8 10 12
Time (s)
Spee
d (m
ph)
TrackMaster Speed CARSim Speed
24
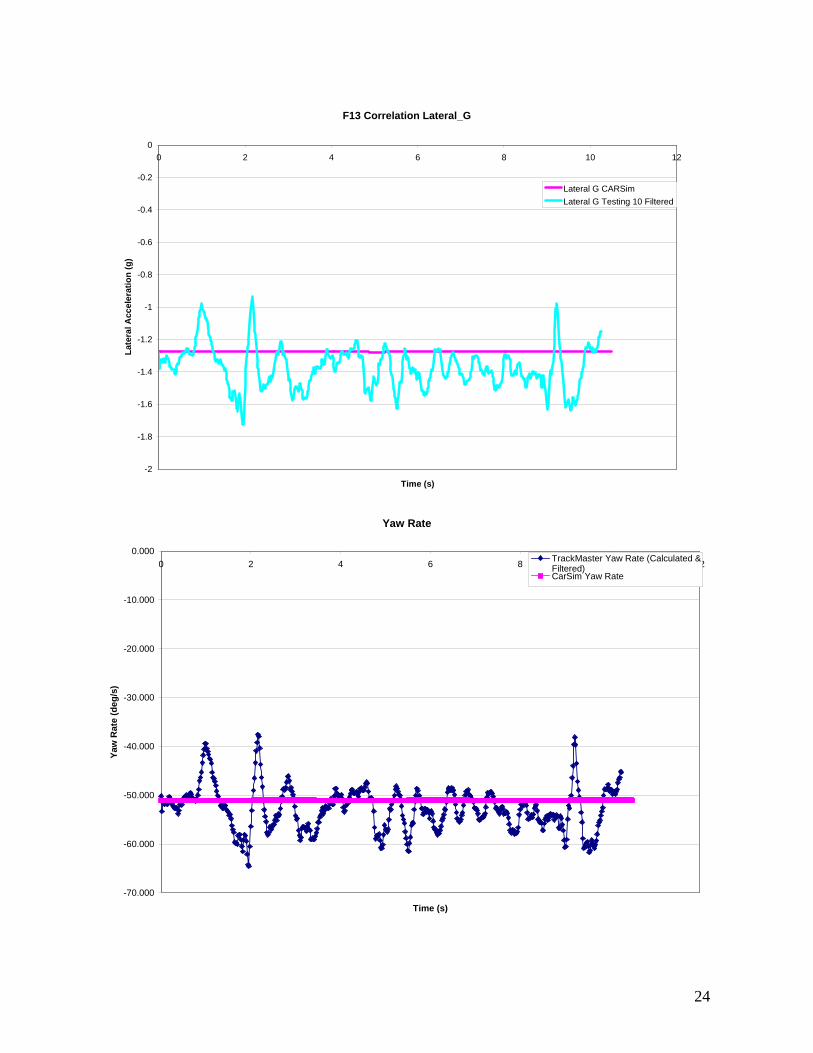
F13 Correlation Lateral_G
-2
-1.8
-1.6
-1.4
-1.2
-1
-0.8
-0.6
-0.4
-0.2
00 2 4 6 8 10 12
Time (s)
Late
ral A
ccel
erat
ion
(g)
Lateral G CARSimLateral G Testing 10 Filtered
Yaw Rate
-70.000
-60.000
-50.000
-40.000
-30.000
-20.000
-10.000
0.0000 2 4 6 8 10 12
Time (s)
Yaw
Rat
e (d
eg/s
)
TrackMaster Yaw Rate (Calculated &Filtered)CarSim Yaw Rate
25
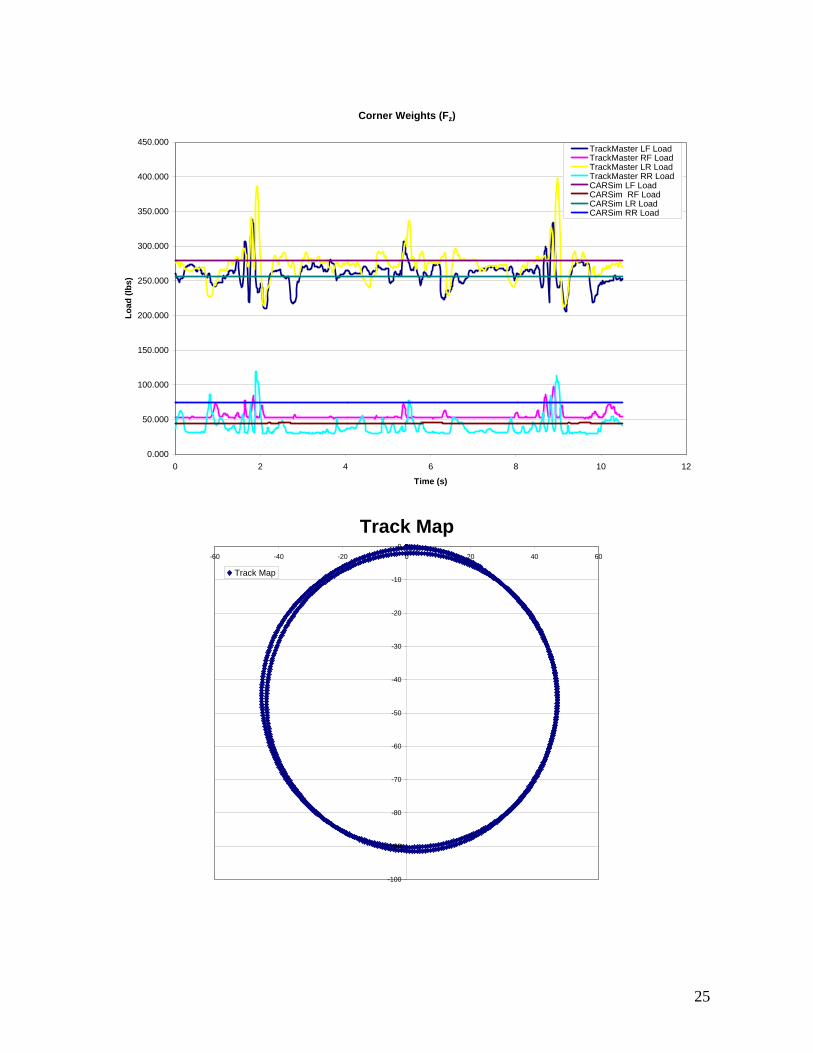
Corner Weights (Fz)
0.000
50.000
100.000
150.000
200.000
250.000
300.000
350.000
400.000
450.000
0 2 4 6 8 10 12
Time (s)
Load
(lbs
)
TrackMaster LF LoadTrackMaster RF LoadTrackMaster LR LoadTrackMaster RR LoadCARSim LF LoadCARSim RF LoadCARSim LR LoadCARSim RR Load
Track Map
-100
-90
-80
-70
-60
-50
-40
-30
-20
-10
0-60 -40 -20 0 20 40 60
Track Map