Embed Size (px)
Citation preview

P1.30 MESOSCALE ELEMENTS OF THE 14 DECEMBER 2006 WEST PALM BEACH FLASH FLOOD
Gordon Strassberg and Pablo Santos NOAA National Weather Service Office, Miami, Florida
ABSTRACT
Several substantial mesoscale features, combined with an uncharacteristically moist atmosphere for mid-December, resulted in a record 8.22" rain event in West Palm Beach, FL, on 14 December 2006. A mesolow and several mesoscale boundaries, combined with precipitable water values over two standard deviations above normal to produce widespread 4-6" of rain, with locally higher amounts, and flash flooding near the West Palm Beach International Airport. The mesoscale features initially appeared similar to the Maddox frontal-type flash flood model. However, with persistent convective development leading to the formation of a mesohigh, the system evolved to one more closely resembling Maddox's conceptual mesohigh model. In this paper we present an evaluation of the environmental data and numerical model guidance leading to this flash flood event. . 1. INTRODUCTION
An uncharacteristically moist atmosphere across south Florida on the morning of 14 December 2006 set the stage for heavy rainfall and flash flooding. Cold season heavy rain events across the Florida peninsula have been found to occur more frequently during ENSO-neutral or ENSO-warm years (Paxton et. al 2007). The high moisture content was enhanced by a well-defined mid-level moisture plume extending from the central Pacific to the Florida peninsula, with low level moisture pooling associated with a southeasterly low-level jet on the east side of an inverted trough. These elements, combined with several mesoscale convergence boundaries, a mesolow present that morning across the area, and interactions with a mesohigh, resulted in a record 8.22” rainfall event at West Palm Beach International Airport.
In this paper we examine the mesoscale environment and its impacts on the evolution of the heavy rainfall on that. The flooding was the result of a combination of Maddox’s frontal and mesohigh models (Maddox et al., 1979). Evaluation of forecast model guidance revealed that even finer resolution models had limited success in forecasting this event. 2. SYNOPTIC & MESOSCALE ENVIRONMENT
The main synoptic-scale features identifiable on 14 December 2006 were the underlying mid and upper level flow patterns which were a deep ridge centered over the northern Caribbean, with southwest flow in the mid levels and aloft extending from the eastern Pacific across the Florida peninsula into the western Atlantic (Fig. 1).
Paxton et. al (2007) and Crow (1995) found this general upper air pattern to be climatologically favorable for heavy rainfall across the central Florida peninsula.
Figure 1. Plot of 500 mb (orange) and 250 mb (blue)
winds for 1200 UTC on 14 December 2006. The 1200 UTC NAM 500mb analysis (contours) is also shown.
Together with a steady low-level southeasterly flow off the warm Gulf Stream waters, these features were important factors in the days’ weather because they allowed mid level moisture to extend from the central Pacific all the way across much of Florida (Fig. 2), resulting in precipitable water (PWAT) values being abnormally high across the region.
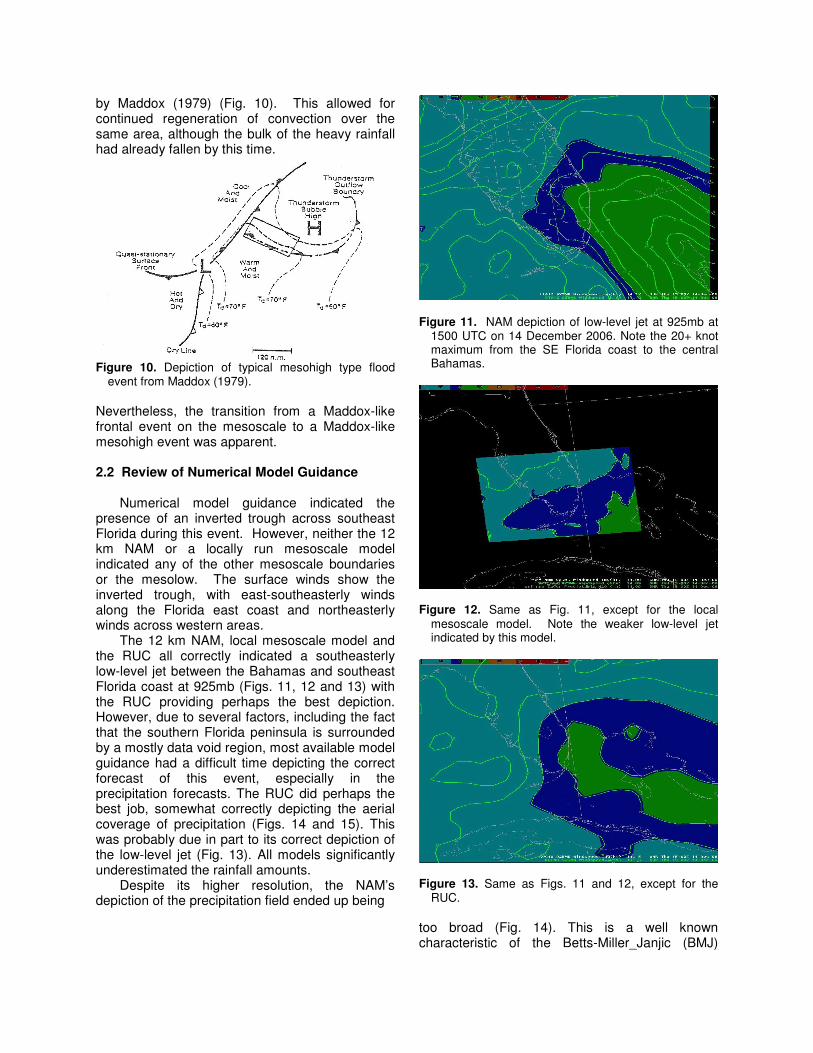
The 1200 UTC Miami RAOB (Fig. 3) indicated PWAT values of 1.72”, which is about two standard deviations above normal (Bunkers, 2006 ) (Fig. 4). This abnormally large value increased throughout the day, as Global Positioning System (GPS) PWAT observations for the Fort Lauderdale area shows values as high as 2.2” around 1500
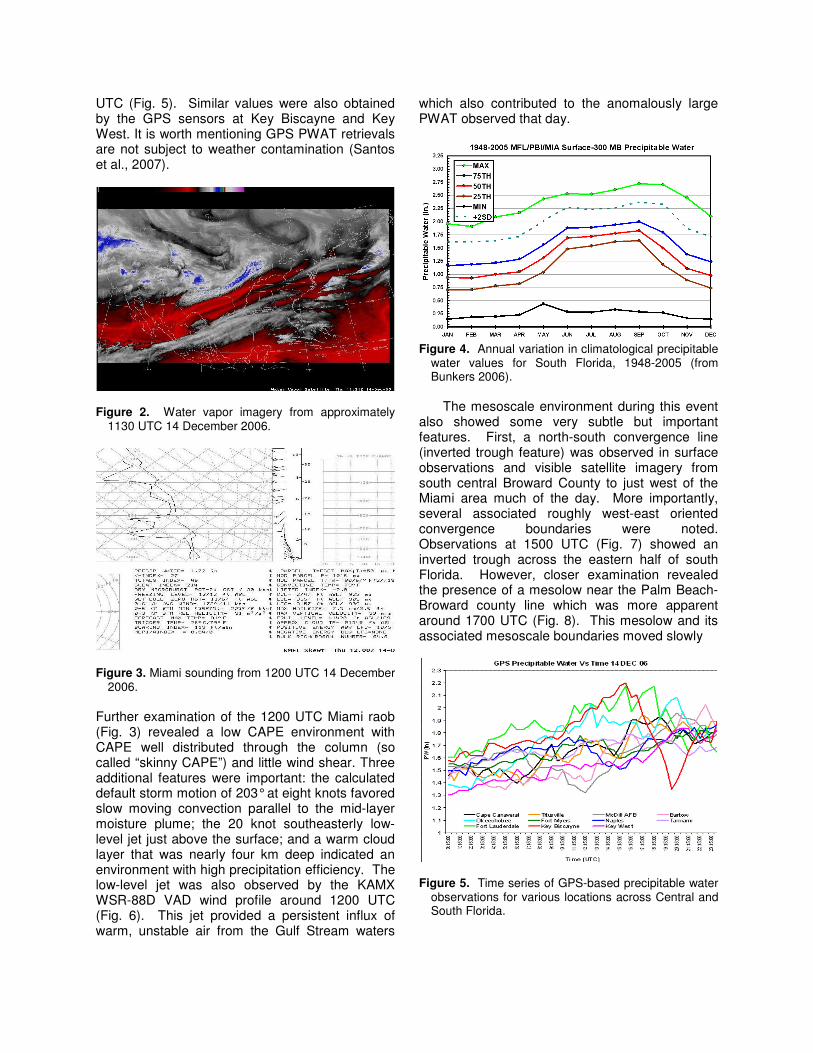
UTC (Fig. 5). Similar values were also obtained by the GPS sensors at Key Biscayne and Key West. It is worth mentioning GPS PWAT retrievals are not subject to weather contamination (Santos et al., 2007).
Figure 2. Water vapor imagery from approximately
1130 UTC 14 December 2006.
Figure 3. Miami sounding from 1200 UTC 14 December
2006. Further examination of the 1200 UTC Miami raob (Fig. 3) revealed a low CAPE environment with CAPE well distributed through the column (so called “skinny CAPE”) and little wind shear. Three additional features were important: the calculated default storm motion of 203° at eight knots favored slow moving convection parallel to the mid-layer moisture plume; the 20 knot southeasterly low-level jet just above the surface; and a warm cloud layer that was nearly four km deep indicated an environment with high precipitation efficiency. The low-level jet was also observed by the KAMX WSR-88D VAD wind profile around 1200 UTC (Fig. 6). This jet provided a persistent influx of warm, unstable air from the Gulf Stream waters
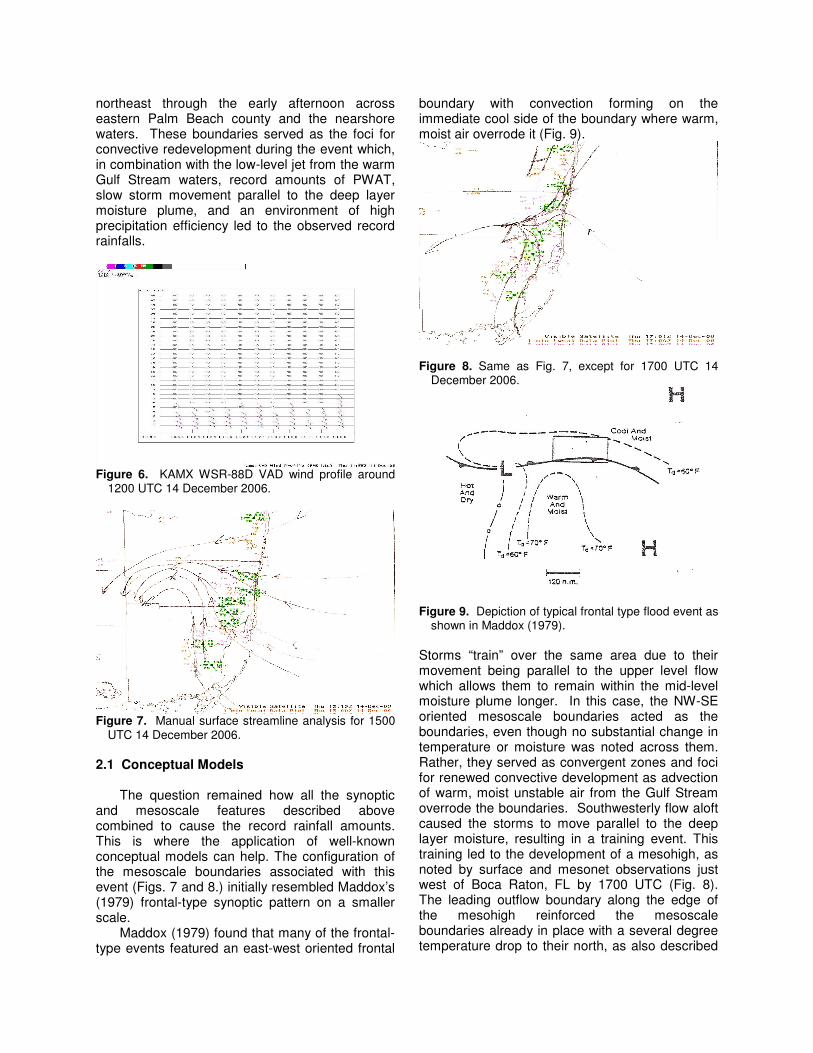
which also contributed to the anomalously large PWAT observed that day.
Figure 4. Annual variation in climatological precipitable
water values for South Florida, 1948-2005 (from Bunkers 2006).
The mesoscale environment during this event
also showed some very subtle but important features. First, a north-south convergence line (inverted trough feature) was observed in surface observations and visible satellite imagery from south central Broward County to just west of the Miami area much of the day. More importantly, several associated roughly west-east oriented convergence boundaries were noted. Observations at 1500 UTC (Fig. 7) showed an inverted trough across the eastern half of south Florida. However, closer examination revealed the presence of a mesolow near the Palm Beach-Broward county line which was more apparent around 1700 UTC (Fig. 8). This mesolow and its associated mesoscale boundaries moved slowly
Figure 5. Time series of GPS-based precipitable water
observations for various locations across Central and South Florida.
northeast through the early afternoon across eastern Palm Beach county and the nearshore waters. These boundaries served as the foci for convective redevelopment during the event which, in combination with the low-level jet from the warm Gulf Stream waters, record amounts of PWAT, slow storm movement parallel to the deep layer moisture plume, and an environment of high precipitation efficiency led to the observed record rainfalls.
Figure 6. KAMX WSR-88D VAD wind profile around
1200 UTC 14 December 2006.
Figure 7. Manual surface streamline analysis for 1500
UTC 14 December 2006. 2.1 Conceptual Models The question remained how all the synoptic and mesoscale features described above combined to cause the record rainfall amounts. This is where the application of well-known conceptual models can help. The configuration of the mesoscale boundaries associated with this event (Figs. 7 and 8.) initially resembled Maddox’s (1979) frontal-type synoptic pattern on a smaller scale.
Maddox (1979) found that many of the frontal-type events featured an east-west oriented frontal
boundary with convection forming on the immediate cool side of the boundary where warm, moist air overrode it (Fig. 9).
Figure 8. Same as Fig. 7, except for 1700 UTC 14
December 2006.
Figure 9. Depiction of typical frontal type flood event as
shown in Maddox (1979). Storms “train” over the same area due to their movement being parallel to the upper level flow which allows them to remain within the mid-level moisture plume longer. In this case, the NW-SE oriented mesoscale boundaries acted as the boundaries, even though no substantial change in temperature or moisture was noted across them. Rather, they served as convergent zones and foci for renewed convective development as advection of warm, moist unstable air from the Gulf Stream overrode the boundaries. Southwesterly flow aloft caused the storms to move parallel to the deep layer moisture, resulting in a training event. This training led to the development of a mesohigh, as noted by surface and mesonet observations just west of Boca Raton, FL by 1700 UTC (Fig. 8). The leading outflow boundary along the edge of the mesohigh reinforced the mesoscale boundaries already in place with a several degree temperature drop to their north, as also described
by Maddox (1979) (Fig. 10). This allowed for continued regeneration of convection over the same area, although the bulk of the heavy rainfall had already fallen by this time.
Figure 10. Depiction of typical mesohigh type flood
event from Maddox (1979). Nevertheless, the transition from a Maddox-like frontal event on the mesoscale to a Maddox-like mesohigh event was apparent. 2.2 Review of Numerical Model Guidance Numerical model guidance indicated the presence of an inverted trough across southeast Florida during this event. However, neither the 12 km NAM or a locally run mesoscale model indicated any of the other mesoscale boundaries or the mesolow. The surface winds show the inverted trough, with east-southeasterly winds along the Florida east coast and northeasterly winds across western areas. The 12 km NAM, local mesoscale model and the RUC all correctly indicated a southeasterly low-level jet between the Bahamas and southeast Florida coast at 925mb (Figs. 11, 12 and 13) with the RUC providing perhaps the best depiction. However, due to several factors, including the fact that the southern Florida peninsula is surrounded by a mostly data void region, most available model guidance had a difficult time depicting the correct forecast of this event, especially in the precipitation forecasts. The RUC did perhaps the best job, somewhat correctly depicting the aerial coverage of precipitation (Figs. 14 and 15). This was probably due in part to its correct depiction of the low-level jet (Fig. 13). All models significantly underestimated the rainfall amounts.
Despite its higher resolution, the NAM’s depiction of the precipitation field ended up being
Figure 11. NAM depiction of low-level jet at 925mb at
1500 UTC on 14 December 2006. Note the 20+ knot maximum from the SE Florida coast to the central Bahamas.
Figure 12. Same as Fig. 11, except for the local
mesoscale model. Note the weaker low-level jet indicated by this model.
Figure 13. Same as Figs. 11 and 12, except for the
RUC. too broad (Fig. 14). This is a well known characteristic of the Betts-Miller_Janjic (BMJ)

convective parameterization scheme used in the model as documented in previous studies (Etherton and Santos, 2006). The BMJ scheme commonly produces broad areas of light precipitation. Although not shown in Fig. 14, the local mesoscale model’s precipitation forecast was the poorest. The main part of the event happened in the six to nine hour forecast period of the run initialized at 0900 UTC that morning. As discussed in Etherton and Santos (2007), the local model’s initialization generally results in the best moisture initialization and rain forecasts in the very short term (generally less than six hours). However, due to balance constraints imposed in the initialization data (local analysis and prediction system or LAPS), the wind circulations are normally not supportive of the initialized moisture field. The result is convection weakens during the first few hours of integration until the model develops the mesoscale circulation on its own later in the integration. We believe this partly explains the poor performance during this event. 3. SUMMARY AND CONCLUSIONS The Storm Total Precipitation image from the Miami (KAMX) WSR-88D (Fig. 15) shows a rainfall maximum in the neighborhood of five to six inches in south-central Palm Beach County, with a secondary rainfall maximum offshore of Palm Beach County. It should be noted that, while the three model forecasts presented above did not accurately depict a land-based rainfall maximum, the NAM and RUC came closest to depicting the location of the rainfall maximum over water.
An analysis of that day’s rainfall was performed using Kriging within GIS software. Seventeen reports from airport ASOS observations, cooperative observers, and South Florida Water Management District (SFWMD) gages were used within Palm Beach and Broward counties (Fig. 16). The two highest reports have been labeled.
A comparison of the WSR-88D rainfall estimates and observations shows the radar was relatively accurate in its estimation of a widespread area of 4-6 in. amounts over south central Palm Beach County, although the maximum amount is underestimated by around two inches, with a reported maximum of 8.04 inches reported by an observer 13 miles west of Delray Beach. This was the second largest amount reported for this event. Notice, however, that the more northern rainfall maximum from West Palm Beach to points just south was slightly
more underestimated, with the radar estimating generally 2-4 in. over land in this area.
Figure 14. RUC (top) and NAM (bottom) three hourly
rainfall forecasts (images) valid 1500 UTC 14 December 2006 with surface (green barbs) and 925mb (orange barbs) wind forecasts. RUC precipitation amounts range from 0.1” across the area of maximum rainfall to up to 0.25” offshore in the green colors. The NAM rainfall amounts range from 0.35” across the area of maximum rainfall to 0.4” offshore.
Figure 15. Storm total precipitation ending 1700 UTC
14 December 2006 from KAMX WSR-88D. Main roads and highways are shown in blue, with cities in purple, for reference purposes.

Figure 16. Rainfall analysis from ASOS, COOP, and
SFWMD reports for 14 December 2006. Roadways are indicated by the thin maroon lines, with point locations denoting cities (see labels).
While the numerical models generally forecast
the larger-scale features such as the inverted trough and low-level jet, the mesoscale features which predominantly drove this event (mesolow, mesohigh, convergence boundaries) were too small for even the finer resolution models to resolve. Part of this problem across the south Florida peninsula is likely the result of data void regions around the landmass, as this precludes the collection of an appropriate number of surface and upper air observations from being used in the model initialization.
This event was atypical of heavy rainfall events across Central and South Florida, as a stationary synoptic-scale front and/or very strong low-level jet are usually the cause for extreme rainfalls (Crow, 1995). 4. REFERENCES Bunkers, M., 2006: Precipitable water plots: U.S.
radiosonde locations for PW climatology [Available online http://www.crh.noaa.gov/unr/?n=pw].
Crow, M. R., 1995: Climatology of Dry Season
Heavy Rainfall in Central Florida-November
through April. NOAA Technical Memorandum NWS SR-165.
Etherton, B. and P. Santos, 2006: The effect of local initialization on WsEta. Nat. Wea. Assoc. Digest., 30, 49-60.
Etherton, B. and P. Santos, 2007: A comparison of WRF forecasts made using different sources for initial and boundary conditions. Wea and Forecasting. Conditionally accepted.
Maddox, R. A., C. F. Chappell and L. R. Hoxit, 1979: Synoptic and meso-scale aspects of flash flood events. Bull. Amer. Meteor. Soc., 60, 115-123.
Paxton, C. H., A. Reynes and J. C. McMichael,
2006: Cool season heavy rainfall events over West Central Florida. Preprints, AMS Forum on Climate Aspects of Hydrometeorology, San Antonio, TX. Amer. Meteor. Soc. [available online http://ams.confex.com/ams/pdfpapers/118525.pdf].
Santos, P., K. Carey, W. M. MacKenzie, J. Zhang,
R. Ferraro, J. G. Yoe, 2007: Global positioning system (GPS) meteorology integrated precipitable water (IPW). Submitted to the Electronic Journal of the Nat. Wea. Assoc.
Santos, P., G. Rader, Z. Brown, and D. Brown, 2002: The October 3-4 2000 Heavy Precipitation/Flash Flood Event Across South Florida. 16th Conference on Hydrology, AMS Annual Meeting, Orlando, FL.