Embed Size (px)
Citation preview

PAANIBIJLIPARYAVARANSPML INFRA IS HELPING CREATE A NEW INDIA FROM THE GRASSROOTS UPWARD
SPML INFRA LIMITEDANNUAL REPORT
2017/18

Forward-looking statementsThis document contains statements about expected future events and financial and operating results of SPML Infra Limited, which are forward-looking. By their nature, forward-looking statements require the Company to make assumptions and are subject to inherent risks and uncertainties. There is significant risk that the assumptions, predictions and other forward-looking statements will not prove to be accurate. Readers are cautioned not to place undue reliance on forward-looking statements as a number of factors could cause assumptions, actual future results and events to differ materially from those expressed in the forward-looking statements. Accordingly, this document is subject to the disclaimer and qualified in its entirety by the assumptions, qualifications and risk factors referred to in the management’s discussion and analysis of the annual report.
Contents
Board of Directors .........................................01Corporate snapshot ......................................08Milestones ......................................................12Enhancing stakeholder value ......................13Making headlines ..........................................14Performance highlights ................................16Chairman’s overview ....................................18The distinctive SPML culture ......................26
SPML's business model ...............................28Business segment review ............................30Directors’ report .............................................42Management discussion and analysis .....71Report on corporate governance ...............81Standalone financial statements ...............95Consolidated financial statements ......... 168

Board of Directors
Subhash Chand SethiChairman
Chairman of SPML Infra, Mr. Sethi leads the Company with the same visionary approach and business acumen with which he led the Company to become a leading infrastructure development company with interests in water, power and sanitation.
Sushil Kumar SethiManaging Director
Responsible for growing the water and environment management verticals, he has enabled the Group to foray into several EPC, BOOT projects in the areas of water, wastewater and sewerage management.
Deepak SethiDirector
An MBA from Deakin University, Australia, he has been instrumental in the development and execution of several waste management projects, new ventures and startups.
P. S. RanaIndependent Director
A B.Tech in civil engineering from IIT, Delhi, and Ph.D. in transport engineering and management from University of Newcastle, United Kingdom, he has served as the chairman of the Housing and Urban Development Corporation, the Construction Industry Development Council and Patron Institute of Urban Transport along with being a member of the advisory council of IIT, Delhi.
Sushil Kumar RoongtaIndependent Director
A B.E. in electrical engineering from BITS Pilani, he has served as chairman of Steel Authority of India Limited and MD (Aluminum & Power Business) of Vedanta Limited, chairman of the Board of Governors at IIT, Bhubaneswar along with being a member of the Board at JKL University, Jaipur.
Sarthak BehuriaIndependent Director
A B.A. in economics from St. Stephen's College, Delhi, and an MBA from IIM, Ahmedabad he has served as the chairman of Indian Oil Corporation Limited and Bharat Petroleum Corporation Limited along with receiving the SCOPE Award for Excellence & Outstanding Contribution to Public Sector Management (2007-08).
Dinesh Kumar GoyalIndependent Director
An IAS passout of the 1981 batch belonging to the Rajasthan cadre, he completed his Ph.D. from the Birla Institute of Technology & Science, and his M.Sc. from the London School of Economics, United Kingdom. He has served as an Additional Chief Secretary for the Rajasthan Government.
Archana CapoorIndependent Director
An MBA in finance and market research from the University of Allahabad, she has served as a chairperson of the Tourism Finance Corporation of India, and a project advisor to the Indian Trust for Rural Heritage and Development.
Supriyo Kumar ChaudhuriNominee Director
An MBA from IIM, Calcutta and a CAIIB from the Indian Institute of Bankers, Mumbai, he has served a long stint as Chief General Manager of State Bank of India, handling corporate banking, network, credit and commercial operations.

How SPML is transforming lives
nal kaLakshmi used to
reach school late three days a week because she was required to
queue for water at the village well. She now turns the tap on for as much water she
needs.
600+numberInfrastructure projects executed by SPML
10,000kilometres Length of cross-country pipelines laid by SPML
5,000 million litres per dayCapacity of water pumping stations constructed by SPML
SPML Infra Limited Annual Report 2017-182

Just three words – nal ka paani (piped water availability) – have transformed the lives of millions of rural Indians.
Making it possible to replace hours of fetching water with a turn of the hand.
Making it possible to replace the daily squabbles over water with some peace.
Making it possible to achieve superior family hygiene and lower medical costs.
A new way of living facilitated by water infrastructure companies like SPML Infra. Touching the lives of 40 million Indians.
paani
1,000 million litres per dayCapacity of water treatment plants constructed by SPML
700 million litres per dayCapacity of wastewater treatment plants constructed by SPML
40 million Number of people provided with drinking water by SPML
50 statusAmong the world’s top 50 private water companies
3Statutoryreports
Corporate Overview
Financial statements
chaubees ghanta bijli
Rani would study by the light of the
adjoining road, making her vulnerable. Now
she studies under the electricity bulb in the
security of her home.
SPML Infra Limited Annual Report 2017-184

chaubees ghanta bijli
Making it possible to replace the haath-pankha with a fan in summer.
Making it possible for children to study in the light of a bulb instead of a candle.
Making it possible to switch on a TV and be connected to the world.
Just three words – chaubees ghanta bijli (24-hour electricity) have literally brought light into people’s lives.
How SPML is transforming lives
100+ numberPower projects executed by SPML
38+MW Capacity of power plants constructed by SPML
8,00,000+ numberPower connections provided by SPML
4,000+MVA Power sub-station capacity installed by SPML
20,000+numberVillages electrified
A new way of living facilitated by power infrastructure companies like SPML Infra.
5Statutoryreports
Corporate Overview
Financial statements

swachh sheher
Aruna no longer needs to
pass the city dump with a handkerchief
to her nose. The municipality's waste management efforts
have helped transform her commute into a
tolerable experience.
(Clean city)
SPML Infra Limited Annual Report 2017-186

swachh bharat
Few words have captured the imagination of Indians in recent years as much as ‘swachh’.
Making it possible to dream of an India where municipal waste is responsibly managed.
Making it possible to dream of Indian rivers free of pollution.
Making it possible to dream of an India where ‘clean’ is a given.
A new outlook on national hygiene empowered by solid waste management companies like SPML Infra.
How SPML is transforming lives
2,000 tonnes Amount of municipal solid waste collected per day by SPML
250+ kilometres Length of the sewerage management network set up by SPML
627 NumberCities tracked and monitored for effective solid waste management in urban local bodies
(Clean India)
7Statutoryreports
Corporate Overview
Financial statements

1 Rich
experience
2 Extensive
scale
5 Resolute
compliance
3 State-of-the-art technology
4 Prominent
clients
6 Ethical
pedigree
7 Management
expertise
8 Business verticals
9 Awards and accolades
9 things you need to know about SPML Infra Limited
SPML Infra Limited Annual Report 2017-188

1
4
2
RICH EXPERIENCE
PROMINENT CLIENTS
EXTENSIVE SCALE
• Having executed 600+ infrastructure projects in the power, water, irrigation and wastewater treatment segments over the past three decades, SPML Infra is attractively placed to bag large and complex projects across India.• The Company is counted among
leading water management companies in India and among the top 50 private water management companies in the world.• The Company is a leading player in the Indian water management sector with one of the largest market shares.
• The Company has served >100 governmental departments across the country.• The Company’s key clients in the water segment comprise Public Health Engineering Department, Rajasthan, Bangalore Water Supply & Sewerage Board, Chennai Metropolitan Water Supply & Sewerage Board, Delhi Jal Board, Karnataka Urban Water Supply & Drainage Board, Gujarat Water Infrastructure Limited, Karnataka Neeravari Nigam Limited, Karnataka Urban Infrastructure Development and Finance Corporation, among others.• The Company’s key clients in the power segment comprise West Bengal Power Development Corporation Limited, South Bihar Power Distribution Company Limited,
Haryana Vidyut Prasaran Nigam Limited, Gulbarga Electricity Supply Company Limited, Hubli Electricity Supply Company Limited, Jharkhand State Electricity Board, Odisha Power Transmission Corporation Limited, and Power Grid Corporation of India, among others.• The Company’s principal clients in the infrastructure and environment segment comprise National Thermal Power Corporation, Delhi Mumbai Industrial Corridor Development Corporation Limited, Delhi Metro Rail Corporation, Bengaluru Metro Rail Corporation, Delhi State Industrial and Infrastructure Development Corporation Limited, Delhi Development Authority, South Delhi Municipal Corporation and North Delhi Municipal Corporation, among others.
• SPML has provided drinking water to >40 million Indians through its various projects.• The Company has laid 10,000 kilometres of pipelines across India and enjoys the highest pre-
qualification credentials in the Indian water management sector.• The Company has addressed > 100 power substations and set up > 8,00,000 power connections in the past five years.
5 RESOLUTE COMPLIANCE
• The Company is ISO 9001-2015 certified and has created systems that provide safe drinking water to millions every day.
• The Company offers end-to-end waste management solutions in compliance with CPHEEO and MSW Rules, 2000.
3 STATE-OF-THE-ART TECHNOLOGY
• SPML has integrated competencies across depth engineering, process technology, project management and resource management to carve out a distinctive identity.• SPML has integrated its processes by installing SAP making it possible to become more transparent, reduce delays and hasten project execution.• SPML developed SPML Aqua, an
integrated management information system designed to address day-to-day water distribution issues across geographies.• SPML integrated the entire HR process with the implementation of ‘Success Factor’, its human capital management (HCM) solution, across the country.
9Statutoryreports
Corporate Overview
Financial statements

6 ETHICAL PEDIGREE
VisionCreating with passion and innovation, world class infrastructure to make human life comfortable
MissionProfitable growth through superior project management, innovation, quality and commitment
Values and philosophies• We value our customers and are driven towards meeting the commitments we make through better project delivery
• We value our people, their teamwork and internal systems and processes to perform ahead of others
• We offer to promote better living through innovation, which has been ingrained into our business model from the start
• We prioritise principles of adhering to high quality standards to make a
greater impact in the lives of people
• We pursue to grow as the most acceptable company providing turnkey solutions with added values that makes life comfortable
Aims• Make safe and affordable drinking water available to all
• Help municipalities manage water cycles and resource recovery
• Protect the environment
• Ensure customer satisfaction
• Develop skills of employees
• Share knowledge and expertise
7 MANAGEMENT EXPERTISE
P. C. Sethi founded SPML Infra Limited in 1981, capitalising on the growing need for adequate water infrastructure in the country.
Subhash Chand Sethi, Chairman, has graduated the Company into one of the most respected water and power infrastructure companies in India.
Sushil Kumar Sethi, Managing Director, focuses on acquisitions and business growth while leading the urban infrastructure and environment management verticals.
Deepak Sethi, Director, leverages his immense sectoral expertise to bolster SPML’s technological foundation.
Abhinandan Sethi represents the third generation of promoters and possesses the credentials to take the Company to the next level.
SPML Infra Limited Annual Report 2017-1810

9 AWARDS AND ACCOLADES
2017• CIA World Builders & Infra Awards 2017 for Best Water Management Company of the Year – EPIC Media Group
• Technology Champion – Smart City Award 2017 for IMIS – Cyber Media Group
• Data Centre Green DC Initiative Award 2017 – UBS Transformance
• India’s Most Ethical Companies Award 2017 –World CSR Congress
• Aqua Foundation Excellence Award 2017 to SPML Infra Chairman for his
Valuable Contribution in Infrastructure Development in India
• Construction Times Award 2017 for Best Executed Technology used for Water Management Project
2018• Water Leadership Awards 2018 for Excellence in Water & Wastewater Management – ET Now-World CSR Day
• 50 Most Impactful Leaders in Water & Water Management Awards 2018 to SPML Infra Chairman – World CSR Day
8 BUSINESS VERTICALS
EPCSPML Infra Limited has emerged as one of the leading names in the water and power infrastructure segments in
India by focusing on EPC projects and making its presence felt across the project lifecycle – from procurement to delivery.
Order book
Revenues
Share in 2017 (%)
Share in 2017 (%)
Share in 2018 (%)
Share in 2018 (%)
Water and environment Power Civil Infrastructure and others
55 60
5523
22
40
18
42
34
6
39
6
11Statutoryreports
Corporate Overview
Financial statements

1981 Company incorporation
1982 Ventured into water
management projects
1984 Went public
1995 Rights issue
1999 Completed 1st industrial
water supply project - Bakreswar Thermal Power station (H1,400 Mn)
2000 Completed an EPC project
in record time for the Saurashtra Water Pipeline Project
2003 Ventured into power
T & D projects; constructed and operated a sewage treatment plant for Delhi Jal Board (72 MLD)
2005 Ventured into municipal
solid waste management project in Delhi
2007 Received private equity
infusion from Citigroup
2008 Ventured into a road project
with Jaora Nayagaon Toll Road
2011 Received the KPMG
Infrastructure Award for being the Most Admired Infrastructure Company
2012 Commenced an urban
water supply project commences in Delhi
2013 Received four prestigious
Awards, Order Book Crossed 7,000 Crore
2014 Received order for urban
water supply for six cities in Karnataka
Received a commendation at the Global Water Awards 2014 for the Pokhran water supply project
2015 Began our first Smart City
development project in Ujjain, Madhya Pradesh
2017 Installed 220 kV GIS
substation in West Bengal and 500 MVA auto-transformer in Uttar Pradesh
2018 Installed 500 MVA auto-
transformer in Rajasthan
Received a H205 Crore international water project order from Ghana
Milestones
SPML Infra Limited Annual Report 2017-1812

Enhancing stakeholder value
Expertise The Company
possesses a proven expertise in municipal solid and liquid waste
treatment and management
Reach The Company is
among the world’s top 50 private water companies providing
drinking water facilities to over 40 million of
Indian population
Debt restructuring
The Company successfully implemented
the S4A scheme to restructure H546.92 Crore
debt for the repayment from the sixth year
Technology The Company
implemented SAP-based ‘Success Factor’
for superior people management
Focus The Company is focusing
on water and power projects from select
clients with clear funding mechanisms
Strategy The Company will
bid for fewer but larger projects, marked by lower costs and higher margins, widening its profitability;
it can now qualify for H1,200 Crore single
water projects
Visibility The Company will
bid for complete life-cycle engagements, where one-time EPC engagement
is coupled with maintenance contracts,
enhancing annuity revenues
Sustainability The Company will
work with government agencies to liquidate
receivables under arbitration, helping de-leverage and restoring the Balance Sheet to
better health and sustainability
Pre-qualification
Leverage increasing pre-qualification credentials to bid for projects that attract
nominal competition resulting in long-term
profitability
Opportunity The Company executed
400 kV – 500 MVA transformers and can go for 400 kV & 765 kV
substation projects
13Statutoryreports
Corporate Overview
Financial statements

SPML Infra. Making headlines
An article written on water management by Mr. Subhash Sethi, Chairman, SPML Infra Limited published in Everything About Water, June 2017
An interview of Mr. Subhash Sethi, Chairman, SPML Infra Limited, on the power sector in India published in Electrical Mirror, July 2017.
An article written by Mr. Subhash Sethi, Chairman, SPML Infra Limited, on water scarcity published in Express Water, December 2017.
Article on power transmission and distribution by Mr.
Subhash Sethi, Chairman, SPML Infra Limited published
T&D India, July 2017.
“Ambitious Targets: But some roadblocks remain to be addressed”, an article written by Mr. Subhash Sethi, Chairman, SPML Infra Limited, published in Indian Infrastructure, August 2017
SPML Infra Limited Annual Report 2017-1814

An article on EPC potential written by Mr. Subhash Sethi, Chairman, SPML
Infra Limited, published in Construction and Architecture, March-April, 2018
Chairman’s article on T&D growth phase published in T&D India, March 2018.
An article on wastewater management by Mr. Subhash Sethi, Chairman, SPML Infra Limited, published in Construction Times, February 2018
An article written by Mr. Subhash Sethi, Chairman, SPML Infra Limited, on water published in Everything About Water, January 2018
‘Financing Water Infrastructure’, an article written by Mr. Subhash Sethi, Chairman, SPML Infra Limited, published in Water Digest, March 2018.
15Statutoryreports
Corporate Overview
Financial statements

SPML’s performance over the years
DefinitionGrowth in sales net of taxes and excise duties
Why is this measured?It is an index that showcases the Company’s ability to optimise business operating costs despite inflationary pressures, which can be easily compared with the retrospective average and sectoral peers.
What does it mean?Aggregate sales decreased by 20.30% to reach H1,355.93 crore in FY2017-18 due to subdued market conditions.
Value impactThe Company made consistent effort to enhance market value.
DefinitionProfit earned during the year after deducting all expenses and provisions
Why is this measured?It highlights the strength in the business model in generating value for its shareholders.
What does it mean?Ensures that adequate cash is available for reinvestment and allows the Company’s growth engine to not run out of steam.
Value impactThe Company reported a 2,873% increase in its net profit in FY2017-18 – reflecting the robustness and resilience of the business model in growing shareholder value despite external vagaries.
DefinitionEarning before the deduction of fixed expenses (interest, depreciation, extraordinary items and tax)
Why is this measured?It is an index that showcases the Company’s ability to optimise business operating costs despite inflationary pressures and can be easily compared with retrospective averages of sectoral peers.
What does it mean?Helps create a robust growth engine and allows the Company to build profits in a sustainable manner.
Value impactThe Company reported a 20.47% increase in its EBIDTA in FY2017-2018 – an outcome of the painstaking efforts of its team in improving operational efficiency.
DefinitionEBITDA margin is a profitability ratio used to measure a company's pricing strategy and operating efficiency
Why is this measured?The EBIDTA margin gives an idea of how much a company earns (before accounting for interest and taxes) on each rupee of sales.
What does it mean?Demonstrates adequate buffer in the business, which, when multiplied by scale, enhances surpluses.
Value impactThe Company reported a 600 bps increase in EBIDTA margin during FY2017-18.
Revenues from operations (H in crore)
Net profit (H in crore)
EBITDA (H in crore)
EBIDTA margin (%)
FY2014-15 1,390.75
FY2014-15 13.78
FY2014-15 202.50
FY2014-15 14.01
FY2015-16 1,417.63
FY2015-16 13.06
FY2015-16 215.56
FY2015-16 14.77
FY2016-17 1,701.25
FY2016-17 1.45
FY2016-17 214.31
FY2016-17 12.29
FY2017-18 1,355.93
FY2017-18 43.12
FY2017-18 258.19
FY2017-18 18.29
* The Balance Sheet Figures for 15-16, 16-17,17-18 & for P/L 16-17 & 17-18 are as per Ind AS Financials. For rest of figures it is as per Ind GAAP financials.
SPML Infra Limited Annual Report 2017-1816

DefinitionIt is a financial ratio that measures a company's profitability and the efficiency with which its capital is employed in the business
Why is this measured?ROCE is a useful metric for comparing profitability across companies based on the amount of capital they use – especially in capital-intensive sectors.
What does it mean?Enhanced ROCE can potentially drive valuations and perception (on listing)
Value impactThe Company reported a 730 bps decrease in ROCE during FY2017-18.
DefinitionThis is derived through the calculation of the average cost of the consolidated debt on the Company’s books
Why is this measured?This indicates our ability in convincing bankers and other debt providers of the robustness of our business model, translating into a progressively lower debt cost (potentially leading to higher margins).
What does it mean?Enhanced cash flows; strengthened credit rating for successive declines in debt cost
Value impactThe Company’s debt cost progressively declined from a peak of 29.19% in FY2014-15 to 15.44% in FY2017-18. This ratio should ideally be read in conjunction with net debt/operating profit (an increase indicating higher liquidity).
DefinitionThis is derived through the ratio of debt to net worth (less revaluation reserves)
Why is this measured?This is one of the defining measures of a company’s financial health, indicating the ability of the company to remunerate shareholders over debt providers (the lower the gearing the better). In turn, it indicates the ability of the company to sustain growth in profits, margins and shareholder value.
What does it mean?Adds value in the hands of the shareholders by keeping the equity side constant and boosts flexibility by progressively moderating debt costs.
Value impactThe Company’s gearing stood at 2.91 in FY2017-18 compared to 2.35 in FY2016-17. This ratio should ideally be read in conjunction with net debt/operating profit (a reduction indicating greater ease in terms of servicing debt).
DefinitionThis is derived through the division of EBIDTA by interest outflow
Why is this measured?Interest cover indicates the Company’s comfort in servicing interest – the higher the better.
What does it mean?A company's ability to meet its interest obligations, an aspect of its solvency, is arguably one of the most important factors in guaranteeing sizeable returns to shareholders.
Value impactThe Company strengthened its interest cover from 1.04 in FY2016-17 to 1.32 in FY2017-18.
ROCE (%)
Debt cost (%)
Gearing (x)
Interest cover (x)
FY2014-15 30.07
FY2014-15 29.19
FY2014-15 1.27
FY2014-15 1.18
FY2015-16 27.39
FY2015-16 27.38
FY2015-16 1.43
FY2015-16 1.15
FY2016-17 27.37
FY2016-17 22.32
FY2016-17 2.35
FY2016-17 1.04
FY2017-18 19.77
FY2017-18 15.44
FY2017-18 2.91
FY2017-18 1.32
17Statutoryreports
Corporate Overview
Financial statements

An overview of our 2017-18 performance
BY MR. SUBHASH SETHI, CHAIRMAN
The big message coming out of our performance during the year under review was that in a world of diverse variables, SPML Infra was able to report results in line with the budgeted operational estimates. I believe that this was largely a manifestation of the various initiatives we took in the last few years to build a sustainable company.
CHAIRMAN’S OVERVIEW
I am pleased to report that the company reported anticipated revenues of H1400 crore coupled with an expected EBIDTA margin of 13-14%, which indicates that we managed the operational engine in line with our expectations. This operational consistency was reflected also in the number of projects we bagged during the course of the year, as well as the ticket size of each contract and the desired IRR that we expected to generate from each. In last year’s annual report we had indicated that the company was climbing into another orbit and I am pleased to state that if anyone goes through our fundamentals
for 2017-18, he or she would arrive at the same conclusion.
However, having said this, permit me to indicate that out performance could have been better but for one unforeseen development that transpired during the year under review. The one feature of the company’s performance not in line with expectations was the deferment in the resolution of outstandings from the arbitration awards from different government agencies which affected our cash flows during the course of the year. Had this inflow been received on schedule, we would have been able to moderate our interest outflow and report even better numbers. I
must assure shareholders that your management is engaged in addressing this matter and expects a favourable outcome.
Highlights of what we achieved, 2017-18There were a number of highlights of our performance during the year under review.
The principal highlight was that the company cleared the S4A appraisal of its various project outstandings. The result of this landmark decision, which validated the company’s financial hygiene, was that our H546.92 crore debt was restructured by banks for repayments from the sixth year onwards to the tenth year. We believe that the moratorium of the first five years will make it possible for the company to strengthen its working capital management; besides, the chargeable interest of 0.01 per cent upto the fifth year will strengthen our Balance Sheet starting a virtuous cycle: lower debt, lower cost of debt and larger cash flows that make it possible for us to negotiate better to complete projects within time and budgeted cost. The fact that our repayments will begin from 2023 and then be charged at 8 per cent will empower us to address the growing opportunities in the water and power sectors with comprehensiveness and sustainability.
By the close of the financial year under review, the company had H400 crore of arbitration awards already in hand, which are under adjudication. However, given the fact that a majority of the awards have been upheld by the courts of law provides us with the confidence that the awards should translate into cash flows across the foreseeable future.
During the course of the year under review, the company continued to emphasis timely project completion. The company completed a part of the prestigious SAUNI project, which was inaugurated by the Honourable Prime Minister of India Mr. Narendra Modi during the year under review. We also completed a Kanpur Sewerage Network with a 42 MLD sewage treatment plant, pumping stations and 130 km sewerage network, which is going to help the Clean Ganga Mission. We are pleased to report that our robust project delivery was rewarded by the award of
SPML Infra Limited Annual Report 2017-1818

19Statutoryreports
Corporate Overview
Financial statements

another H850 crore project during the course of the year.
The project completion that gave us deep satisfaction was the commissioning of the 400 kv - 500 MVA auto-transformer in Mainpuri, Uttar Pradesh and Sikar, Rajasthan. These projects were carried out for Power Grid Corporation and comprised the highest project denominations ever completed by the company. The implications of this successful project completion are positive: the successful completion of this project makes us eligible to bid for 765 kv projects. We believe that this extension will graduate us to the highest league of players within the power sub-station business. During the course of the year under review, we generated 23% of our revenues from this business segment compared with 18% in the previous year. Besides, the traction was visible in our order book: an increase from H5000 crore at the close of 2015-16 to H6935 crore at the close of 2017-18, providing us with an attractive 36-month revenue visibility. We believe that this business holds out rich potential a sectoral shakeout in the last few years has resulted in limited competition and improved realizations.
Strengthening our businessAt SPML Infra, we believe that in a business marked by a number of locations, materials, project complexities and people, the successful companies of the future would be those that make a superior use of information. We believe that superior information will lead to more effective controls on the one hand and informed decision-making on the other, completely transforming project management competencies.
One of our principal business-strengthening initiatives during the year under review comprised the commissioning of the human resource module of Success Factor. In a business that comprises about 1200 professionals addressing project realities, the challenge was always a superior management of our people; whatever improvements we made in this area would immediately translate into superior people deployment and delivery.
The principal contribution of Success Factor is that it helped digitalise all our human resource interventions. When implemented from 2018-19, the software technology will make it possible to strengthen our business across the following interventions: link all Key Result Areas and goal sheets; we intend to create our internal version of mobile-based social media platform; our projects may be in diverse locations but through this mobile-based application we will now be centralized; the system comprises transparent information that takes ambiguity out of decision-making, puts all employees on one page and represents the official information basis for all initiatives.
This Success Factor intervention has made another critical contribution to our business. At a time when we are managing more projects than ever (40 across over 100 locations as on 31 March 2018), we believe that this software will strengthen our supervisory control that will make it possible to correct project deviations with speed and sensitivity. In view of these evident advantages, we believe that our project efficiencies will start trending visibly upwards from the current year onwards, which is a timely
development considering that our order book is larger than ever. In view of this, the SAP investment is the right initiative at the right time, which could strengthen our competitive advantage.
During the year under review, we also bagged a H205 crore international project in Ghana after we have received a H115 crore order from Rwanda. In 2017-18, the company’s credit rating was maintained at BBB- by SMERA Ratings Limited, which we believe should improve following an improvement in the company’s performance and Balance Sheet.
Socially-driven business modelBangalore water loss project – water saving
The project initiated by the Bangalore Water Supply and Sewerage Board was JICA funded and was awarded to SPML Infra in consortium with Suez. By using innovative technology of helium leak detection to accurately identify and locate hidden leaks in large and small pipes, the NRW reduced significantly from 61 percent at the beginning of the project to 33 percent, thus saving 16.5 MLD of drinking water. The project has already covered major areas where 50-60 year old pipes are replaced with new pipes, leakage has been sealed and electronic district meters suitable for GSM/GPRS communication for measuring flow and pressure control installed. From the 16.5 million litres of water saved by this water loss management project, the Government of Karnataka has implemented a scheme to provide 10,000 litres free water each month to every household with regularized connection to the economically poor, SC and ST families.
At SPML Infra, we believe that in a business marked by a number of locations, materials, project complexities and people, the successful companies of the future would be those who make a superior use of information.
SPML Infra Limited Annual Report 2017-1820

Right country at the right timeThis is a time for optimism for some good reasons.
The Government is investing considerably larger amounts in irrigation and delivering water to the last mile. Some 285 new irrigation projects will be taken up by next year to provide irrigation for 1 crore 88 lakh hectares of land. Drip irrigation and irrigation through pipeline would be the priority areas for the Government as these could save large amounts of water and also cut down the cost involved in acquiring land. The Government is keen to provide safe drinking water to every household and irrigation water for every farm. In this connection, the recent inauguration of Sardar Sarovar Project by the Prime Minister will provide water to over 4 crore people and help irrigate over 8 lakh hectares of land.
The Government is seized of the priority to treat waste water, one of the landmark projects being the National Mission for Clean Ganga. Out of 191 projects, 97 are sanctioned. New sewage treatment plants with a capacity of 2,278.08 million litres per day (MLD) and repair of 574.8 MLD existing STPs are proposed. The laying / rehabilitation of 4,766.4 km sewer network for the abatement of pollution in Ganga and Yamuna are part of these sanctioned projects. Some 20 projects are already completed, which have created 262 MLD STP capacity, rehabilitated 92 MLD STP capacity and 1,706 km of sewer network laid. Some 45 sewage infrastructure projects are under execution. These projects have created 834 MLD sewage treatment capacities. Another 32 projects are under various stages of tendering. These projects envisage the creation of 1,758 MLD sewage treatment capacities, opening up wide business opportunities for the company.
Besides, the country’s infrastructure sector is moving towards a scenario when companies with a greater respect for governance will be rewarded faster.
For instance, companies with weak debt repayment or interest servicing records could be barred from applying for Government infrastructure contracts.
This could create a sectoral shakeout leading to a greater demand for services than the ability to supply.
This scenario could benefit compliant companies; these companies could bid for larger projects.
How SPML Infra intends to capitaliseAt SPML Infra, we are optimistic of our prospects for a number of reasons.
SPML is present in two of three sectors - water, power and sanitation - that we expect will be the biggest beneficiaries of the country’s infrastructure push.
The Company will bid for fewer but larger projects, marked by lower costs and higher margins.
The Company will select to work for projects that are accompanied by advances and periodic milestones, reducing the financial load.
The Company will focus on EPC power and water projects and not enter the BOT or BOOT segments, warranting large investments.
The Company will divest non-core assets.
The Company will increasingly bid for complete lifecycle engagements where one-time EPC engagement is coupled with ongoing maintenance contracts, enhancing the proportion of revenues from annuity revenues.
The Company will work closely with Government-appointed agencies to liquidate its longstanding receivables under arbitration.
The Company will pursue a progressive increase in ticket size per project, which has already trebled in the last few years, translating into enhanced economies.
The Company will leverage strengthening pre-qualification
eligibility to bid for larger and more complex projects in spaces where competition has declined. In the sub-station space, we intend to graduate to 765 kv projects, which would be value-added and attractively profitable. We also intend to grow our presence in water projects in the country larger than H500 crore where competition is relatively limited.
The Company will focus on timely projects completion and closure that could strengthen our cash flows.
OutlookWe are acknowledged as among the top 50 most specialised water infrastructure companies in the world by Global Water Intelligence, London, which is a showcase of our long-term sectoral commitment.
I am optimistic that the timely completion of order book will generate EPC revenues. Besides, our 27 operation & maintenance projects will generate attractive fee income from maintenance engagements which represent annuity revenues. We believe that the award of arbitrations in our favour could enhance cash flows in a sizable way, strengthening our Balance Sheet.
The Company’s order book of H6,935 crore as on 31 May 2018 should translate into about 15 per cent revenues growth and a higher percentage growth in bottomline across the foreseeable future. We believe that this could represent the start of a virtuous cycle of growth and value-creation.
Subhash Sethi Chairman
In the sub-station space, we intend to graduate to 765 kv projects, which would be value-added and attractively profitable. We also intend to grow our presence in water projects in the country larger than H500 crore.
21Statutoryreports
Corporate Overview
Financial statements

Existing pipe manufacturers in India did not possess the ability to manufacture 3,000-millimetre diameter three-layered polyethylene-coated pipes.SPML embarked on something interesting.We got a number of pipe manufacturing companies to upgrade their facilities and manufacture pipes around the necessary dimensions.The transportation of these large pipes (12 metre-long and weighing 15.6 metric tonnes) proved difficult.
Persistence paysSPML Infra Limited Annual Report 2017-1822

Persistence pays The challenging execution of the Saurashtra-Narmada Avataran Irrigation Yojana Project by SPML
SPML responded with a lateral solution: it developed a logistical setup using specially-made 18-wheel low-bed trailers for transporting these pipes across Saurashtra.After laying these pipes in diverse topographical and climatic conditions, the jointing, welding and coating these pipes with three-layer polyethylene was carried out by SPML’s well-trained team. No toxic gases were emitted.The result: After SPML had executed the first phase, it was provided fresh orders to execute the second phase comprising the laying of 36.60 kilometre-long 3000 millimetre diameter mild steel pipelines.
23Statutoryreports
Corporate Overview
Financial statements

In the right place at the right time
SPML Infra Limited.
This is how the impending sectoral transformation will catalyse SPML’s growth
INCREASING WATER DEMAND
PER ANNUM, EXPECTED RISE IN INDIA’S WATER DEMAND TILL 2025
EXPECTED GROWTH IN INDIA'S DOMESTIC WATER DEMAND TILL 2025
PROJECTED INCREASE IN INDIA'S INDUSTRIAL WATER DEMAND TILL 2025
EXPECTED GROWTH IN INDIA'S IRRIGATION WATER DEMAND TILL 2025
20%
40%
2X
14%
SPML Infra Limited Annual Report 2017-1824

POWER SECTOR SCENARIO
EXPECTED INCREASE (TERAWATT-HOURS) IN INDIA'S POWER CONSUMPTION BY 2022
INDIA’S RANK IN THE WORLD BANK'S LIST OF ELECTRICITY ACCESSIBILITY IN 2017 (UP 73 SPOTS FROM LAST YEAR)
NUMBER OF VILLAGES ELECTRIFIED IN INDIA BY APRIL 2018
GIGAWATTS EXPECTED COAL-BASED POWER GENERATION CAPACITY IN INDIA IN 2040 (CURRENTLY 192 GIGAWATTS)
1,894.7 597,464
INFRASTRUCTURE SECTOR SCENARIO
ALLOCATION TOWARDS THE INFRASTRUCTURE SECTOR (H, LAKH CRORE) IN UNION BUDGET 2018-19
HIGHWAY CONSTRUCTION SPEED (KILOMETRES PER DAY) IN INDIA DURING 2017-18
INVESTMENT (US$ TRILLION) REQUIRED IN THE INFRASTRUCTURE SECTOR OVER THE COMING DECADE
EXPECTED CAGR GROWTH (%) OF THE EPC MARKET IN INDIA BETWEEN 2014 AND 2019
5.97
21.46
1.5
20.26
REDUCING WATER AVAILABILITY
DECREASE IN INDIA'S PER CAPITA WATER AVAILABILITY IN 2025 COMPARED TO 2001
DECREASE IN INDIA'S WATER STORAGE LEVELS ACROSS 91 MAJOR WATER RESERVOIRS
DECREASE IN INDIA'S PER CAPITA WATER AVAILABILITY IN 2050 COMPARED TO 2001
36%
2%
60%
1,122USEABLE AMOUNT OF WATER (TRILLION LITRES) OUT OF 1,869 TRILLION LITRES OF RESERVES
26th 330-441
25Statutoryreports
Corporate Overview
Financial statements

Our distinctive SPML culture“SPML is about ‘learning opportunities’. It has helped me grow from Manager (Wind Power) in 1995 to Executive Vice President, managing power transmission & distribution, infrastructure development, legal matters and others. SPML is a platform for many engineers to acquire knowledge and grow in diversified fields."-Amitava Basu (Executive Vice President, Projects)
“SPML is about a ‘positive attitude’: faster decision-making, reduced bottlenecks and successful project completion. I started my journey in SPML 20 years ago in the designing department for water projects, progressed to power infrastructure and am now in the engineering and procurement department.” -Malay Kanti Chakraborti (Executive Vice President, Engineering & Procurement)
SPML Infra Limited Annual Report 2017-1826

“SPML is like my second family. The homely atmosphere, ethical work culture, appreciation for good work and access to senior management allows us to embrace challenging projects.”-D. P. Mukherjee (Vice President, Projects)
“SPML is a ‘value-based’ company with employee empowerment, action oriented approach and measurable achievements. In my 10-year tenure, SPML has provided the opportunity to work with the brightest minds in a friendly atmosphere.”-Tariq Siddiqui (General Manager, Corporate Communications)
“SPML stands for trust, a politics-free environment, learning opportunities, employee-friendly atmosphere, good reputation and the management’s trust in people. I had no exposure to project execution but can now execute critical projects.”-Prasenjit Nath (Deputy General Manager, Electrical)
27Statutoryreports
Corporate Overview
Financial statements

SPML’s business modelSPML strives towards achieving excellence across all operational areas by ensuring compliance with world-class standards and continuously strengthening its project execution and quality management.
SECTORAL CONTEXT
Governmental initiatives: The Indian government is spending unprecedented amounts in infrastructure growth. The Union Budget 2018-19 allocated H5.97 lakh crore towards the infrastructure sector compared to H4.94 lakh crore in the previous year.
Unavailability of potable water: Out of the 1,869 trillion litres of water reserves, only ~60% is useable due to geographical and transportational issues. Result: ~63 million people lack access to safe drinking water.
Growing urbanisation: The urban population in India has tripled from 11.4% of the total population in the beginning of 20th century to about 32%. By 2050, Indians in cities are expected to double.
Demand-supply mismatch: In cities with >1 million people, the official water supply (after accounting for average 35% loss in leakages) is ~125 litres per capita per day and considerably lower than the demand of 210 litres per capita per day.
Increasing transmission requirements: Although India witnessed a power-surplus scenario in 2017 after 13 consecutive deficit years, there are still ~1,370 villages yet be electrified.
Stiffening pre-qualification norms: The increasing governmental focus on the infrastructure sector has attracted the attention of private infrastructure companies, which has stiffened pre-qualification norms.
SPML Infra Limited Annual Report 2017-1828
INTANGIBLE IMPACT
STRENGTHS
TANGIBLE IMPACT
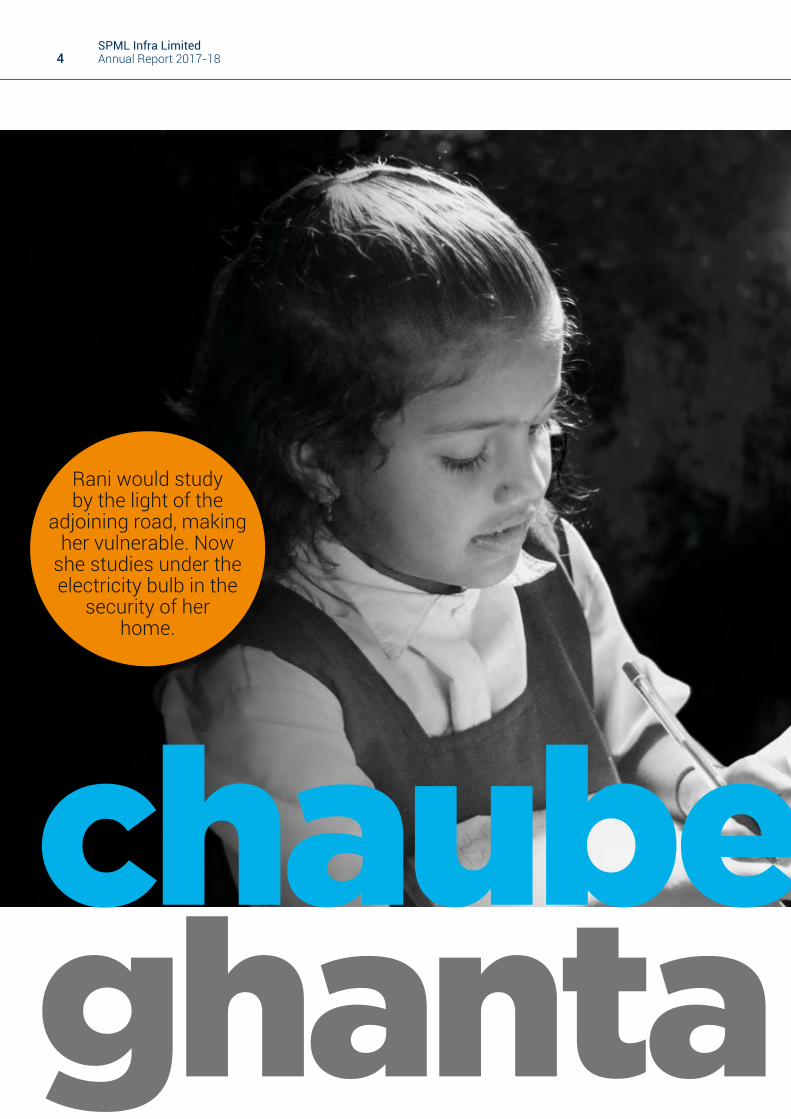
The Company has been one of the leading names in the water management sector for more than three decades.
ReputationThe Company’s credit rating was maintained at BBB- by SMERA Ratings Limited.
Credit ratingThe Company is rated among the top 50 private water management companies in the world.
RespectPeople retention in the Company stood at 83% in 2017-18 while retention in the senior management level was >90%.
HOW SPML IS ADDRESSING THE SECTORAL CONTEXT
SPML has largely selected to address water supply and power sub-station projects, both areas benefiting from enhanced governmental spendings.
Verticals addressedSPML strategically bids for government-backed or international agency-funded infrastructure projects, protecting its cash flows.
Selective biddingSPML works from Gujarat in the west to Tripura in the east, addressing a range of opportunities.
Expansive reachSPML’s lifecycle-long engagement – project design to delivery to maintenance – has strengthened its reputation as the first company for challenging projects.
One-stop
People retention
Capability: SPML strengthened its competitiveness through enhanced pre-qualification credentials.
Pipeline: SPML’s order book (~H6,935 crore) has translated into 36 months of revenue visibility.
Scale: SPML is one of the largest water management companies in India, making it possible to bid for water supply projects of >H1,200 crore. SPML’s expertise in laying
pipes >3,000 millimetres in diameter and >100 kilometres in length has enhanced its credibility. It has graduated to the 400 kv substation segment, strengthening respect.
Technology: SPML invested in cutting-edge technologies like ICT and IMIS for smart utility management.
Experience: The Company is managed by second-generation promoters, ~1,200 professionals (engineering,
technology and management) and ~80% of the SPML’s employees have been associated with the Company for more than five years.
Specialisation: The Company has executed >600 projects and is known for commissioning world-class water supply and recycling projects. Furthermore, SPML has executed 90% of all its projects within designated timelines.
• PAT for FY2017-18 increased by 2,873% y-o-y to H43.12 crore
• EBITDA margin improved by 600 bps in FY2017-18
• SPML won arbitrations worth H200 crore, strengthening cash flows
• SPML executed 10 projects during the year under review
• Market capitalisation stood at H564 crore as on 31 March 2018
29Statutoryreports
Corporate Overview
Financial statements

BUSINESS SEGMENT 1
Water managementIndia’s water demand has increased by ~3x during the past five decades on account of population growth, urbanisation and a host of economic, demographic, and industrial changes. Potable water usage has escalated while water availability has remained static. The result: The World Resources Institute ranked India 41st in terms of water stress among 181 countries.
SPML Infra Limited Annual Report 2017-1830

Contribution to total revenues
Revenues (H in crore)
2016-1740%
2016-17 2017-18
644.44
747.44
Water management
SPML’s extensive sectoral experience and proven ability to execute large-scale projects has allowed it to emerge as a port of first call for municipal corporations and urban local bodies. The result: SPML has emerged as a best-in-class player by making its presence felt across the breadth of the sectoral value chain.
32Ongoing projects
Services provided• Treatment, supply and distribution of drinking water• Wastewater treatment• Dam construction• Irrigation• 24x7 urban water supply
Operational highlights• Completed the Swarnim Gujarat Saurashtra–Kutch Water Grid Project by laying 75.90 kilometres of bulk water transmission lines in Dhanki, Navada and Dudhrej.
• Constructed two large pumping stations with 560 and 545 million litres per day capacities, respectively.
• Completed the Cauvery Water Supply Scheme for Bengaluru with a 500 million litres per day pumping station that helped provide drinking water to ~2 million residents.
• Completed the first phase of the Saurashtra Narmada Avataran Irrigation Yojana and received orders
for the second phase.
• Installed a 200-million litre per day water treatment plant in Surajpura, Rajasthan.
• Started constructing a 50-million litre per day water treatment plant with a reservoir and a transmission system in Dholera to provide potable water to the Dholera special investment region located along the Delhi-Mumbai Industrial Corridor.
• Began working on a lift irrigation pipeline project for the transmission of 50 cubic feet per second of water via an existing pipeline in Bhasariya, Gujarat.
• Continued executing urban water supply projects funded by the Asian Development Bank in six cities of Karnataka to provide ~1.3 million people with clean drinking water facilities.
• Continued executing urban water supply projects for improving water distribution networks in Mehrauli, Vasant Vihar and adjoining areas of Delhi (rehabilitation and development
4Completed
projects
55%2017-18
31Statutoryreports
Corporate Overview
Financial statements

of water distribution networks, construction of underground reservoirs to enhance the existing capacity from 4.3 million litres to 18.3 million litres, rehabilitation and replacement of 42,000 house service connections, installation of water meters, metering, billing including O&M, among others).
• Continued executing a water infrastructure development project in Rwanda.
• Continued executing the largest smart water meter project in Delhi with a mandate to install ~ 2 lakh water meters
Key projects, FY 2017-18• Saurashtra Narmada Avataran Irrigation Yojana: SPML contributed to the development of water management infrastructure in Gujarat. Having executed the first phase of the Saurashtra Narmada Avataran Irrigation Yojana, SPML received orders to execute the second phase of this
scheme entailing 36.6 kilometres of mild steel pipelines (3,000 millimetres in diameter and 17.5 millimetres in thickness with external 3LPE coating and internal food grade epoxy coating) along with setting up of pumping stations and allied works. Once completed, this project will provide 39 million people across 132 towns and 11,456 villages with potable water and help irrigate ~1.8 million hectares of land in Saurashtra, Kutch and North Gujarat regions, benefiting millions of farmers. The project envisages diverting 1 million acre feet of water from the Narmada Dam to 115 reservoirs via a 1,115- kilometre-long pipeline network.
• Smart City, Ujjain: SPML is executing a project in Ujjain to ensure round-the-clock water availability by setting up a water treatment plant, pumping station and a water supply network from the Shipra River to the site. SPML would also be responsible for operationalising
a complete sewerage network with sewage treatment and effluent treatment plants, storm water drainage system, solid waste management systems, internal and external roads spanning four to six lanes, power transmission and distribution systems, cooking gas distribution systems, street lighting, CCTV and SCADA systems, safety and security systems and an information and communication technology network with peripheral boundary walls. This will allow Vikram Udyogpuri to become a first-of-its-kind greenfield city fully-equipped with smart utilities.
• Ghana joint venture: SPML Infra Limited, with joint venture partner OM Metals Infraprojects, secured a H205-crore-order from the Ministry of Food and Agriculture, Republic of Ghana, for undertaking a project related to the rehabilitation and completion of the Kpong Left Bank Irrigation Project in Ghana.
Growth drivers• Increasing water demand due to population pressure and urban sprawl
• Need to standardise water quality for various applications
• Increasing irrigation and agricultural demand
• Over-exploitation of water resources
• Water cycle imbalance and stress
Strengths• Sophisticated: SPML developed an integrated management information system, a software solution to handle the metering, billing, network analysis, demand forecasting and management and O&M needs, among others, of the entire supply and distribution network. After implementing this system, water loss reduced, revenue generation increased and consumer service improved in Delhi and Karnataka.
• Experienced: Over 38 years, SPML has graduated to become India’s largest water infrastructure provider. An in-depth understanding of sectoral scenarios has enabled the Company to complete large infrastructural projects without engaging third-parties.
• Qualified: The Company possesses pre-qualification credentials for water projects valued >H500 crore. This allows SPML to bid for high-value government-backed projects and stay ahead of peers.
SPML Infra Limited Annual Report 2017-1832

Sectoral optimismThe water situation in India has progressively worsened due to factors ranging from increasing population, decreasing supply, increased industrialisation and water contamination, among others. Infrastructure development and regulations have not been able to keep pace with population growth and urbanization, as a result of which water management has become a challenge.
The Indian water sector is at a crossroads. In a developing country with huge requirements, there is a vast growth scope. The total Indian water market is estimated at about US$ 14 billion with a 18% annual growth rate. Water infrastructure, which has not grown even to the extent of 10% of its potential, indicates that this single vertical holds out decades of sustainable potential.
Facts and figures• The Asian Development Bank has forecast that by 2030, India could suffer a water deficit of 50%. For urban India, the situation is worse. In 2015, ~377 million Indians lived in urban areas and by 2030 this is expected to rise to 590 million. According to the National Sample Survey, only 47% of urban households have individual water connections and about 40% to 50% of water is reportedly lost in distribution systems due to various reasons.
• In cities with more than a million people, the official water supply after an average 35% loss in leakages is just ~125 litres per capita per day, considerably lower than the demand of 210 litres per capita per day.
• As per the 2011 census, only 32.7% of urban Indian households are connected to a piped sewerage system. According
to a World Bank report, at least 21 Indian cities are moving towards zero ground water level by 2020, which has already set the alarm bells ringing for policy makers and urban planners.
• According to a World Bank study, water scarcity can affect long-term economic prospects. Water scarcity could cost India 6% of GDP by 2050 if the country mismanages water resources. The UN ranked India 120th among 122 countries in terms of water quality with ~70% of the supply being contaminated.
Way forwardThe Company intends to increase the number of high-value water infrastructure projects in its portfolio and grow revenues.
33Statutoryreports
Corporate Overview
Financial statements

Power managementThe power sector in India has emerged as a focal area in the recent past with the Central Government emphasising 100% rural electrification. The country is moving towards a policy-based administration with an improved nationwide transmission and distribution platform.
BUSINESS SEGMENT 2
SPML Infra Limited Annual Report 2017-1834

SPML bids for projects with well-funded mechanisms and attractive margins. The Company’s portfolio includes the development and installation of numerous substations, as well as transmission and distribution lines including rural electrification projects across Andhra Pradesh, Karnataka, Rajasthan, Haryana, Bihar, Jharkhand, Uttar Pradesh, West Bengal, Odisha and Tripura. The next phase of SPML’s growth in the power management vertical is expected to be driven by sub-station, transmission and distribution projects.
4000+MVA
Installed power substation capacity
Services provided• Power plant construction• Sub-station, transmission and distribution• Rural electrification • Smart energy management
Operational highlights• Installed 220-kV GIS (gas-insulated substation) in Alipurduar, West Bengal.
• Installed 500 MVA auto-transformers in Mainpuri, Uttar Pradesh and Sikar, Rajasthan
• Completed a major part of the rural electrification and distribution projects in Patna and Gaya districts of Bihar.
• Started executing 16 numbers of 132/33kV sub-station projects in Tripura under the aegis of the North Eastern Region Power System Improvement Project funded by the World Bank.
• Started executing a number of power
infrastructure development projects including 220-kV GIS (gas-insulated substation) in Faridabad, Haryana.
• Extended a 400-kV sub-station with two 500 MVA autotransformers at Malda, West Bengal and six other locations as a part of the Eastern Region Strengthening Scheme and the Rural Electricity Infrastructure Development project in Murshidabad, West Bengal.
• Executing several substation projects including 220-kV GIS (gas-insulated substations) in New Town, West Bengal and 220-kV grid sub-station at Ratu, Jharkhand, along with 132-kV GIS (gas-insulated substation) at Burdwan, West Bengal.
• Executed 400 kV twin moose transmission line and erected 134 transmission towers of 45-70 metres height between Chittorgarh and Bhilwara, Rajasthan
12Ongoing projects
6Completed
projects
Contribution to total revenues
Revenue (H in crore)
2016-17
18%
2017-18
23%
2016-17 2017-18
289.99315.31
35Statutoryreports
Corporate Overview
Financial statements

Changing livesSPML is engaged in executing two important rural electrification projects in Patna and Gaya districts by installing eight 33/11 kV- power substations, erected more than 3.10 lakh electric poles covering an area of around 8,100 square kilometres with low-tension and high-tension transmission lines spanning >3,900 villages. More than 1.5 lakh families living below the poverty line were provided electricity connections under this scheme SPML’s efforts were appreciated by the State Government. More than 200 trained professionals are working to complete the project. The aim is now to connect the remaining 80,000 families and change their lives in the process.
Growth drivers• Growing population
• Industrial expansion
• Growing per capita incomes
• Increasing energy demand
• Governmental focus
• Nuclearisation and urbanisation
Strengths• Well-equipped: Being a leading player in the power transmission and distribution segment, SPML makes conscious efforts in using the latest and innovative technologies in the execution of large and sophisticated projects. Case in point: SPML installed SAS and SCADA systems in a 220-kV substation in Mirzapur, Uttar Pradesh, and Karnataka Power Transmission Corporation Limited projects. Additionally, all its projects, ongoing and completed, were equipped with state-of-the-art PLC systems.
• Skilled: With the advent of modern technology and digitisation of systems, technical and managerial competence is critical towards ensuring timely execution of power projects and subsequent performance upon commissioning. SPML provides training to ensure employees stay up-to-date, motivated and productive.
• Scalable: The order book of power projects is about H1500 crore from clients viz Power Grid Corporation for which SPML Infra is currently executing over H600 crore worth of transmission and distribution projects and H300 crore for West Bengal State Electricity Transmission Company Limited. The Company executed >100 power projects and provided >8,00,000 power connections.
Sectoral optimismThe increasing focus of the Central Government in providing electricity to the last-mile is evident through various schemes. Debt-ridden companies have been brought back on track. However, work needs to be done in supplying the power to consumers in an efficient manner.
Facts and figures• India is the third-largest producer and the fourth-largest consumer of electricity in the world with the fifth-largest capacity.
• Total installed capacity of power
stations in India stood at 334,146.91 megawatts as of February, 2018.
• India ranks third among 40 countries in EY’s Renewable Energy Country Attractiveness Index, on the back of a strong focus by the Central Government on promoting renewable energy and implementation of projects in a time-bound manner.
• India moved up 73 spots to rank 26th in the World Bank's list of electricity accessibility in 2017.
• In September 2017, the Government of India launched the Saubhagya Scheme to provide electricity
connections to >40 million families in rural and urban areas by December 2018 at a cost of US$ 2.5 billion.
• Between April 2000 and September 2017, the industry attracted US$ 12.3 billion in FDI, accounting for 3.44% of total FDI inflows into India.
Way aheadSPML will focus on engaging in government-backed projects in the transmission and distribution segment and play a crucial role in the development of power infrastructure across the nation.
SPML Infra Limited Annual Report 2017-1836

37Statutoryreports
Corporate Overview
Financial statements

Environment managementIn India, inefficient waste management has taken a toll on the country’s environment. According to the Housing and Urban Affairs Ministry, out of the ~1.43 lakh tonnes per day of solid waste generated across the country, only ~33,800 tonnes per day (or 23.7%) was adequately processed.
BUSINESS SEGMENT 3
SPML Infra Limited Annual Report 2017-1838

Revenues (H in crore)
2016-17 2017-18
59.58 26.21
Environment management
SPML collects, segregates, processes, recycles, transports and safely disposes waste material. Additionally, it offers end-to-end waste management solutions in compliance with the norms laid down under CPHEEO & MSW Rules, 2000.
4Ongoing projects
Services provided• Door-to-door waste collection, transportation to waste depots, secondary collection of waste from bins, segregation and transfer of waste for safe disposal at landfills
• Waste recycling, composting and conversion services to generate energy
• Development of scientific landfills for safe disposal
• Wastewater treatment and recycling for reuse
Operational highlights• Completed a 42 million litres per day
sewage treatment plant and sewerage network in Kanpur that will help in the Clean Ganga mission.
• Started working on a 12.5 million litre per day common effluent treatment plant in Bahadurgarh, Haryana, for the treatment and management of industrial effluents.
• Completed installation of eSBM, an ICT project under the Swacch Bharat Mission, to track and monitor waste transportation in 48 cities across Bihar, Jharkhand, Odisha and the Andaman and Nicobar Islands.
3Completed
projects
Cleaning upSPML is about to complete an underground sewerage network in Mira Road-Bhayandar, Maharashtra. The project involved designing a decentralised system spanning 10 different zones with separate sewage treatments and pumping stations for each of them. The creation of the new sewerage system implied the closure of existing septic tanks and drainage through stormwater drains, improving overall hygiene and living standards. The comprehensive underground sewerage facilities in the 24-square kilometre area entailed designing, supplying, laying, and commissioning 115 kilometres of pipelines, setting up 10 pumping stations and 10 sewerage treatment plants (7 to 17 million litres per day) equipped with the latest MBBR technology and a total capacity of 115 million litres per day.
39Statutoryreports
Corporate Overview
Financial statements
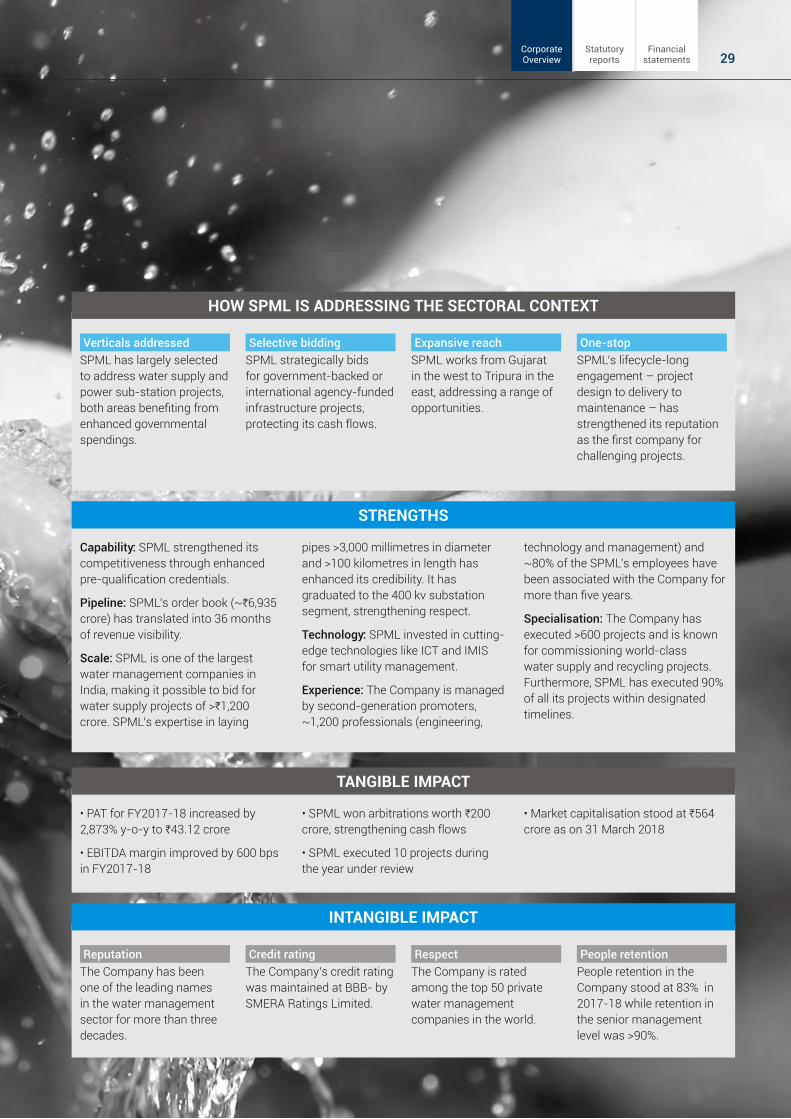
Growth drivers• Increasing population • Increasing
industrialisation• Increasing incidence of water-borne diseases
• Increasing government focus
Strengths• Experience: SPML has more than two decades of experience in the wastewater and solid waste management space and has executed eight solid waste management projects over the past decade.
• Reach: SPML has executed projects in eight different locations across the country.
• Sophistication: SPML uses ERP and GPS in its operations to improve systemic efficaciousness.
Sectoral optimismIn India, most cities are water-stressed and require immediate attention with regard to proper water and wastewater management. India faces a huge challenge in ensuring safe water supply. Rapid urbanisation has escalated the demand for potable water and better sanitation services. Most operational wastewater treatment plants are not working at desired levels of efficiency leaving a big gap between generation and treatment. Reuse of municipal and industrial wastewater and the recovery of potential pollutants used in industrial
processes are the needs of the hour. Advanced treatment technologies that can remove various potentially harmful compounds are slowly being embraced but a lot remains to be covered.
Facts and figures• The per capita urban waste generation in India is around 0.5-0.6 kilograms per day, which implies that the total municipal solid waste generated in urban India could be as much as 68.8 million tonnes every year.
• The Central Pollution Control Board has estimated that there are 269
sewage treatment plants in India, of which only 231 are functioning.
• ~80% of the wastewater generated in the country does not get treated before being released into water bodies, leading to large-scale contamination.
Way forwardIn view of the increasing need for wastewater and solid waste management services, SPML will continue using cutting-edge tools to create a healthier society.
SPML Infra Limited Annual Report 2017-1840

41Statutoryreports
Corporate Overview
Financial statements
statUtORYSECTION

SPML Infra Limited Annual Report 2017-1842
DIRECTORS’REPORTThe Board of Directors of your Company presents 37th Annual Report on the operations and performance of the Company along with the audited financial statements for the year ended 31st March 2018.Financial ResultsYour Company has for the first time adopted the Indian Accounting Standard ("Ind AS") for preparation of the Accounts for the Financial Year 2017-18 with a transition date of April 1, 2016 pursuant to Rule 4 (iii) of the Companies (Indian Accounting Standards) Rules, 2015 notified vide Notification No. G.S.R. 111(E) dated 16th February, 2015. Accordingly the figures of the previous years have been reinstated to align the same as per the requirement of Ind AS.
The brief summary of the financial performance of the Company for the year under review along with the comparative figures for the previous year is summarized herein below (C In Lakhs)
ParticularsStandalone Consolidated
2017-18 2016-17# 2017-18 2016-17#Revenue from Operations 1,35,592.55 1,70,125.47 2,04,947.99 2,27,581.41Other Income 5,578.56 4,232.96 6,070.74 9,761.17Total Income 1,41,171.11 1,74,358.43 2,11,018.73 2,37,342.58Total Expenses 1,15,351.72 1,52,926.58 1,83,379.11 2,10,420.44Earnings before Interest, depreciation, tax and amortization (EBIDTA) 25,819.39 21,431.85 27,639.62 26,922.14Less :- Finance Cost 19,557.12 20,546.93 21,357.13 26,035.51Less :- Depreciation 765.56 1,034.46 1,683.41 2,113.75Earning before share of profit/ (loss) of associate and joint venture, exceptional items & tax
5,496.71 (149.54) 4,599.08 (1,227.12)
Share of profit/(loss) of Associates & Joint Ventures – – 1,363.22 151.09Minorities share of profit/(loss) – – (213.11) 425.86Earning Before Tax (EBT) 5,496.71 (149.54) 6,175.41 (1,501.88)Tax ExpensesLess: - Current tax 993.19 389.53 1,262.37 592.91Less: - Deferred Tax 191.88 (683.67) (127.27) (1,240.83)Profit After Tax 4,311.63 144.59 5,040.31 (853.97)Other Comprehensive Income for the Year (Net of Taxes) 74.64 70.36 247.74 (04.57)Total Comprehensive Income for the year 4,386.27 214.95 5,288.05 (858.54)Earnings per share - Basic and Diluted (Nominal value `2 Per Share) 11.76 00.39 14.43 (02.34)
#The previous year figures have been reinstated to align the same in accordance with the applicable provisions of the Ind- AS that resulted in some changes in the figures as reflected in previous year’s Annual Report vis-a-vis Current year’s Annual Report.

43Statutoryreports
Corporate Overview
Financial statements
Financial PerformanceStandalone During the year under review, the Operating Revenue of your Company stood at `1,35,592 lakhs as against `1,70,125 lakhs in the previous year. The Net Profit for the year recorded a growth of 2882% at `4,311.64 lakhs as compared to `144.59 lakhs in the previous year, while the Earnings before interest, depreciation, tax & amortizations (EBIDTA) increased by 20.47% at ̀ 25,819 lakhs as compared to ̀ 21,432 lakhs earned in the previous year.
The major reason for difference in the figures of the Net Profit for the Financial Year 2016-17 as reflected in the Financial Statements of the Current Year’s vis a vis Previous Year’s is due to the various Ins-AS adjustments including creation of provision for Expected Credit Loss on Trade Receivables as one of the key constituent. The Earnings Per Share (Basic and Diluted) in the Current Financial Year 2017-18 before and after exceptional items stood at `11.76/-
Consolidated During the year under review, the Company recorded the Operating Revenue of `2,04,948 lakhs as compared to `2,27,581 lakhs in the previous year. The decrease in revenue were mainly due to the various factors including but not limited to finance cost, inadequate allocation of funds by clients, financial distress. The Consolidated Profit after Tax in Financial Year 2017-18 was at `5,040 lakhs compared to the Net Loss of `854 lakhs in the previous year.
The main reason for difference in the figures of the Net Profit for the Financial Year 2016-17 as reflected in the Financial Statements of the Current Year vis–a-vis Previous Year’s Financial Statements is also due to the various Ins-AS adjustments for the Company as well as for the Subsidiaries, Associates & Joint Venture, if any, including creation of provision for Expected Credit Loss on Trade Receivables as one of the key constituent.
The Consolidated Earnings before interest, depreciation, tax & amortizations (EBIDTA) increased by 02.67 % at ̀ 27,640 lakhs as compared to ̀ 26,922 lakhs earned in the previous year. The Earnings Per Share (Basic and Diluted) in the Current Financial Year 2017-18 before and after exceptional items stood at `14.43/-
State of Company’s AffairsSPML is a leading Publicly Listed Infrastructure Development Company with over 37 years of experience in the public as well as private sector, that has executed & managed more than 600 projects for Water Supply and Distribution Management, Wastewater Treatment and Reuse, Power
Generation, Transmission & Distribution, Municipal Solid Waste Management, Smart City Development, IT Solutions for Utilities and other Civil Infrastructure across India. Your Company provides drinking water facilities to more than 40 million Indian populations through various projects and the Company is among the World’s Top 50 Private Water Companies as per Global Water Intelligence, London. Your Company operates on engineering, procurement, construction (EPC) segment. As on date there is no change in the nature of business being undertaken by the Company.
The Financial Year 2017-18 was a turnaround year for the Company as the Company had faced many ups and down viz. liquidity issues, challenges in debt servicing due to inter alia slower than envisaged recovery in the economy and infrastructure sector, increased interest cost in the entire phase of the year.
To address the aforesaid grievances and the practical hurdle in the Business Operation, the Company in consultation with the Lender Banks had come up with implementation of the Scheme for Sustainable Structuring of Stressed Assets (“S4A Scheme”) as one of the considerable move to strengthened the financial stability & condition of the Company.
Despite suffering from various deadlocks the Company managed to retain its Market position in the Business. The brief highlights of the performance of the Company for the Financial Year 2017-18 are summarized herein below:
Completed the SAUNI (Saurashtra-Narmada Avataran Irrigation) Phase 1 Project in Gujarat - value INR 5,935.6 Million.
Completion & Commissioning of 400 kV Substation with installation of 500 MVA Autotransformers in Uttar Pradesh and Rajasthan - the highest capacity substation Project ever completed by the Company
Commissioning of 220 kV GIS (Gas Insulated Substation) in West Bengal.
Completed Kanpur Sewerage Network with 42 MLD sewage treatment plant, pumping stations which is going to help in the Clean Ganga Mission.
Started the Construction of 50 MLD Water Treatment Plant with Reservoir and Transmission System for Dholera Special Investment Region.
Reduction in the non-revenue water from 56% to 27% under UFW Project in Bengaluru by using Helium Leak Detection technology to accurately identify and locate hidden leaks in large and small pipes
Implemented Success Factor by SAP to digitalize all human resource interventions

SPML Infra Limited Annual Report 2017-1844
Received new project orders worth ̀ 850 crores during the course of the year including a `205 crores international project in Ghana
As a corporate commitment, SPML gives utmost importance to safety compliances in design, execution, installation & operations and closely monitors all activities adequately backed by appropriate Training and client understanding.
Implementation of SPML S4A SchemeYour Company had availed financial assistance from various banks/ financial institutions for meeting its working capital requirements. Over the last couple of years, your Company had faced financial distress and adversely impacted due to various unfavorable factors viz. delay in realization of debtors, delay & inadequate allocation of funds by clients, increased interest cost to the Company due to increase in the working capital requirement and also non-realization of claims/receivables in time resulting into cash flow mismatch. In order to overcome the aforesaid distress situation the Consortium of Lenders recommended the Scheme for Sustainable Structuring of Stressed Assets (“S4A Scheme”) as issued by the Reserve Bank of India (“RBI”) pursuant to its Circular bearing No. RBI/2015-16/422 DBR No. BP.BC 103/21.04.132/2015-16 dated 13th June, 2016 as amended from time to time.
Further, the Joint Lender’s Forum (JLF) has agreed & given positive mandate for invoking the “SPML S4A Scheme” with the Super Majority of the Lender Banks with Reference Date as 22nd March, 2017 which was further agreed and approved by the Overseeing Committee (constituted under the aegis of the RBI) on 6th October, 2017 and by the Shareholders of the Company at their Extraordinary General Meeting held on 20th November, 2017. In terms of the aforesaid Scheme the entire debt of the Company had been bifurcated into Part-A & Part-B Debt based on the sustainability test. Further the lenders agreed to convert the part of the existing debt, representing the Part B Debt into the Optionally Convertible Debentures (OCDs).
Accordingly, the Company had allotted 54,53,517 (Fifty Four Lakhs Fifty Three Thousand Five Hundred and Seventeen) unlisted, unrated, redeemable Optionally Convertible Debentures (OCDs) of `1,000/- each aggregating to `5,45,35,17,000/- (Five Hundred Forty Five Crores Thirty Five Lakhs Seventeen Thousand Only) on a private placement basis to the Lenders in two tranches i.e. on 30th November 2017 and 12th December 2017.
Further, in pursuance of one of the condition of the implementation of “SPML S4A Scheme”, the Promoters of the Company had diluted their shareholding in the Company at face value per share (i.e. `2/- per share) to the extent of
“Principle of Proportionate loss sharing by Lenders (S4A Lenders)” in favour of the Lender Banks to entitle them to hold 21.44% stake in the Company. The Market Value (as traded on NSE as on the closing day of 06.10.17) of the shares transferred by the Promoters to the Banks was about `132 crores on 6th October 2017 (i.e. date on which Overseeing Committee of RBI approved the Resolution Plan). The Promoters’ instant move toward successful completion of the SPML S4A Scheme is a remarkable contribution towards the Company. The Board appreciated and took note of the initiative taken by the Promoters in the best interest of the Company.
The Board of Directors of the Company would further like to express their sincere gratitude towards the active participation, significant support & co-operation as extended by lenders and Consortium Bankers viz. State Bank of India, Canara Bank, ICICI Bank Limited, Syndicate Bank, Punjab National Bank, Bank of Baroda, IFCI Limited, Oriental Bank of Commerce, Union Bank of India, Yes Bank Limited and Andhra Bank in the implementation of the “SPML S4A Scheme”. The instant timely help and support as extended to the Company in need was indeed a great relief to the Company and would enable the Company to discharge its Obligation, to serve its debtors, Clients as well as its business in a smooth way.
Your Directors believes that successful implementation of the SPML S4A Scheme will support Company’s working capital base resulting in strengthening the business of the Company followed by the profitable revenue growth.
Issue of Optionally Convertible Debentures (OCDs)As a consequence of invocation of “SPML S4A Scheme”, and in compliance with the provisions of Section 42, 62, 71 and 179(3)(c) and other applicable provision, if any, of the Companies Act, 2013, Guidelines issued by SEBI (SEBI ICDR Regulations, SEBI LODR Regulation), RBI, the Company had allotted 54,53,517 (Fifty Four Lakhs Fifty Three Thousand Five Hundred and Seventeen) unlisted, unrated, redeemable Optionally Convertible Debentures (OCDs) of `1,000/- each aggregating to `5,45,35,17,000/- (Five Hundred Forty Five Crores Thirty Five Lakhs Seventeen Thousand Only) on a private placement basis to the Lenders in two tranches on 30th November 2017 and 12th December 2017. The OCDs carry a coupon @ 0.01% p.a. payable quarterly and Yield to Maturity (YTM) @ 8.15% p.a. compounded quarterly (including Coupon) which shall be paid upon redemption or maturity along with the principal installment payments. The OCDs shall be repaid in 20 Quarterly installments starting from quarter ending December, 2022 and ending on the quarter ending September, 2027.

45Statutoryreports
Corporate Overview
Financial statements
The Company had appointed M/s. SBICAP Trustee Company Limited as the Debenture Trustee for securing the OCDs so issued and to the benefit of the Debenture Holders.
DividendDuring the year under review your Company has undergone for restructuring of its entire existing debts as availed from the various Banks/ Financial Institutions under the Scheme for Sustainable Structuring of Stressed Assets (i.e. “S4A Scheme”) and therefore, in order to support the Company financially and to improvise its financial credibility, it is necessary to conserve the resources for its optimal deployment. Hence, your Directors have not recommended any dividend for the financial year 2017-18.
Transfer to ReservesThe Board of Directors has decided to retain the entire amount of profits in the profit and loss account.
DepositsYour Company has not accepted any Deposit from the Public in terms of the provisions of Section 73 of the Companies Act, 2013 read along with the Companies (Acceptance of Deposits) Rules, 2014 including any amendment thereto and as such there is no amount of principal or interest was outstanding as on 31st March 2018.
Subsidiary Companies/ Joint Venture Companies / Associate CompaniesAs on 31st March 2018, the Company had Twenty Six (26) Subsidiaries (out of which 5 are wholly-owned Subsidiaries), Thirteen (13) Joint Ventures (JVs) and Ten (10) Associates. Of the erstwhile Subsidiaries, 1 Company has been reclassified as Associate and 2 Associates as Joint Ventures under the Indian Accounting Standards (Ind AS). There was no material change in the nature of the business carried on by the subsidiaries.
During the year under review, the following changes occurred in your Company’s Holding structure:
M/s. ADD Urban Enviro Limited and M/s. Jamshedpur Waste Processing Company Private Limited has been merged with M/s. SPML Infrastructure Limited vide Hon’ble NCLT Bangalore Bench’s Order dated 31st January 2018. Accordingly the above two Companies ceased to become the Subsidiaries of the Company.
M/s. SPML Infraprojects Limited has filed an application for Strike Off & the same is under Process of Striking Off, therefore it is no more a Subsidiary of the Company.
During the year under review, M/s. Synergy Promoters
Private Limited has ceased to be the Subsidiary of the Company.
Pursuant to the provisions of Section 129(3) of the Companies Act, 2013 read along with the Companies (Accounts) Rules, 2014, a separate statement containing the salient features of the performance and financial position of each of the Subsidiaries/ Associates/ Joint Ventures in the prescribed Form AOC-1 has been prepared and is forming the part of the Financial Statements of the Company.
In compliance with the provisions of Section 136 of the of the Companies Act 2013, a copy of the Financial Statement consisting of the Standalone as well as the Consolidated along with all relevant Annexures, Auditors Report, Directors Report are available on the website of the Company and will also be available for inspection at the registered office of the Company during working hours till the Annual General Meeting of the Company.
The Policy for determining the “Material Subsidiaries” in terms of applicable provisions of the SEBI (Listing Obligations and Disclosure Requirements) Regulations, 2015, may be accessed on the Company’s website at www.spml.co.in.
Directors and Key Managerial PersonnelPursuant to the provisions of Section 152 (6) of the Companies Act 2013 & the Rules framed thereunder and the applicable provisions of the Articles of Association of the Company Mr. Deepak Sethi (DIN No.: 00035756), Non-executive Director of the Company is liable to retire by rotation at the ensuing Annual General Meeting and being eligible has offered himself for reappointment. The brief details of Mr. Deepak Sethi, being the director retiring by rotation and seeking re-appointment at the ensuing Annual General Meeting is furnished in the explanatory statement to the notice calling the Annual General Meeting.
Mr. Sushil Kumar Sethi, Managing Director, Mr. Subhash Chand Sethi Whole-time Director, Mr. Sujit Jhunjhunwala, Chief Financial Officer (CFO), Mr. Abhay Raj Singh, Company Secretary are the Key Managerial Personnel (KMP) of the Company as on the Balance Sheet date in accordance with the provisions of Section(s) 2(51) and Section 203 of the Companies Act, 2013 read with the Companies (Appointment and Remuneration of Managerial Personnel) Rules, 2014.
During the year under review Mr. Sujit Jhunjhunwala was appointed as the Chief Financial Officer (CFO) of the Company w. e. f 19th May, 2017 pursuant to provision of Section 203 of the Companies Act, 2013 & the rules framed thereunder and the provisions of SEBI (Listing Obligations and Disclosure Requirements) Regulations, 2015.

SPML Infra Limited Annual Report 2017-1846
Policy on Director’s Appointment and RemunerationThe policy of the Company on Director’s Appointment and Remuneration including qualification, positive attributes and independence of a Directors, Key Managerial Personnel, Senior Management Personnel and their remuneration and other matters as required under Section 178(3) of the Companies Act, 2013 is available on our website at www.spml.co.in
We further affirm that the remuneration paid to the directors is as per the terms laid down in the Nomination and Remuneration Policy.
Board DiversityYour Company understands and believes that a well diverse Board enhances the quality of decisions by utilizing different skills, qualifications, professional experience, ethnicity and other distinguished quality of the individual Board members. Company believes that Board diversification is necessary for effective corporate governance, driving business results, sustainable and balanced development and to monitor the effectiveness of the Company’s practices. In order to achieve the aforesaid your Board has well experienced and expertise combination of industry knowledge which is in the best interest of the Company.
Pursuant to the Regulation 19(4) & 20(4) and Part D of Schedule II of SEBI (Listing Obligations and Disclosure Requirements) Regulations, 2015 the Board of the Company has adopted a Policy on diversity of Board of Directors. The said policy is available on the website of the Company at www.spml.co.in
Board EvaluationIn terms of the Regulation 19(4) & 20(4) and Part D of Schedule II of the SEBI (Listing Obligations and disclosure Requirements) Regulations, 2015 and as per Companies Act, 2013 the Board is required to evaluate its own performance along with the performance of the Committee and the individual director. The Board Evaluation Framework is conducted annually for all the Board Members on various factors viz Relationship with Stakeholders, Company’s performance, decision making, information flow etc. The Board evaluation is conducted through questionnaire having qualitative parameters and feedback based on rating.
Familiarization Program for Independent DirectorsIn Compliance with Regulation 25(7) of the SEBI (Listing Obligations and disclosure Requirements) Regulations, 2015, the Company has put in place the familiarization program for the Independent directors to familiarize them with their
roles, rights, responsibilities in the Company, nature of the industry in which the Company operates, business model of the Company, roles rights and their responsibilities and any other relevant matters if any through various programs. The Policy on Familiarization programs for independent directors adopted by the Board is also available on the Company’s website at www.spml.co.in
Meeting of the Board of Directors During the year under review, the Board met eight (8) times, the details of the Meetings of the Board held during the financial year 2017-18 are given under the section Corporate Governance Report which forms the part of this report. The Board further affirms that the time gap between any two consecutive Board Meetings did not exceed 120 days.
Meeting of Independent DirectorsPursuant to the requirements of Schedule IV of the Companies Act, 2013 and as in terms of Regulation 25 of the SEBI (Listing Obligations and Disclosure Requirements) Regulations, 2015, the separate meeting of the Independent Directors of the Company has been convened on 27th March, 2018 to review the matters as laid down in the aforesaid Schedule and Regulations.
Declaration by Independent DirectorIn terms of Section 149(7) of the Companies Act, 2013, your Company has received the requisite declaration from each of the Independent Director of the Company specifying that he/she meets the criteria as laid down in Section 149(6) of the Companies Act, 2013 and Regulation 25 of the SEBI (Listing of Obligations and Disclosure Requirements) Regulations, 2015.
Directors Responsibility StatementsIn terms of the provision of Section 134(5) of the Companies Act, 2013, your Directors hereby confirm:
a) that in the preparation of the annual accounts, the applicable accounting standards have been followed along with proper explanation relating to material departures, if any;
b) that we have selected such accounting policies and applied them consistently and made judgments and estimates that are reasonable and prudent so as to give a true and fair view of the state of affairs of the Company at the end of the financial year and of the profit and loss of the Company for that period;
c) that proper and sufficient care has been taken for the maintenance of adequate accounting records in accordance with the provisions of the Companies Act,

47Statutoryreports
Corporate Overview
Financial statements
2013 for safeguarding the assets of the Company and for preventing and detecting fraud and other irregularities;
d) that the annual accounts have been prepared on a going concern basis;
e) that proper systems to ensure compliance with the provisions of all applicable laws and that such systems were adequate and operating effectively; and
f) that proper internal financial controls were laid down and that such internal financial controls are adequate and were operating effectively.
Corporate Social ResponsibilityApart from achieving its business goals, your Company is committed towards Corporate Social Responsibility and sustainability initiatives and practices in the society in which it operates and achieves growth in a socially responsible way. The vision of your Company is to grow the business whilst reducing the environmental impact of our operations and increasing our positive social impact.
As part of its initiatives under “Corporate Social Responsibility” (CSR), the Company is promoting health care and education by making contributions to the registered trusts that are imparting education and improving health care to the society. The Report on CSR activities is annexed as Annexure – 1 to this report. The Policy as adopted by the Company for the Corporate Social Responsibility is available at the website of the Company at www.spml.co.in
Extract of the Annual ReturnPursuant to the provisions of Sec. 92 (3) & Sec.134(3)(a) of the Companies Act, 2013 read along with Rule 12 (1) of the Company (Management & Administration) Rules, 2014 including any amendment thereto, an extract of the Annual Return in the prescribed format i.e. Form MGT-9 for the Financial Year ended 31st March, 2018 is given in Annexure- 4 and forms part of the Directors’ Report.
Statutory Auditors and their ReportAt the Annual General Meeting held on 29th September, 2017, M/s Maheshwari & Associates, Chartered Accountants (FRN No. 311008E), Kolkata was appointed as Statutory Auditor of the Company for a term of five years to hold office from the conclusion of 36th Annual General Meeting till the conclusion of the 41st Annual General Meeting of the Company to be held in the Calendar Year 2022.
Companies Amendment Act, 2017 notified by the Ministry of Corporate Affairs dated 07th May, 2018 has dispensed off with the requirement of the ratification of the appointment
of Statutory Auditor at every Annual General Meeting. Hence, notice of Annual General Meeting does not carry any resolution pertaining to ratification of appointment of Statutory Auditor.
The Auditors’ Report(s) to the Members of the Company in respect of the Standalone Financial Statements and the Consolidated Financial Statements for the Financial Year ended March 31, 2018 are self-explanatory and the qualification or observations of the Auditors have been suitably addressed in Note No. 43 to 45 of the notes forming part of the standalone financials and Note No 46 to 50 of the notes forming part of the consolidated financials and therefore do not call for any further comments.
Secretarial AuditPursuant to the provisions of Section 204 of the Companies Act, 2013 read with Rule 9 of the Companies (Appointment and Remuneration of Managerial Personnel) Rules, 2014, the Board of your Company had appointed M/s PTM & Co., Company Secretaries as Secretarial Auditor to conduct the secretarial audit for the financial year ended on 31st March, 2018.
The Secretarial Audit Report for the Financial Year ended 31st March, 2018 in Form MR-3 is annexed to the Directors Report as Annexure - 2 and forms part of this Report. There are no qualifications, reservations or adverse remarks made by the Secretarial Auditor in his report.
Cost AuditorsIn terms of the provisions of Section 148 of the Companies Act, 2013 read with the Companies (Cost Records and Audit), Rules, 2014 the Company is required to get its cost record audited by a cost accountants in whole time practice. In this regard the Board of Directors, on the recommendation of the Audit Committee, has appointed Bikram Jain & Associates, Cost Accountants as the Cost Auditor of the Company for Financial Year 2018-19.
In terms of the provisions of Section 148(3) of the Companies Act, 2013 read with Rule 14(a)(ii) of the Companies (Audit and Auditors) Rules, 2014, the remuneration as recommended by the Board shall be ratified by the Members. Accordingly, requisite resolution seeking ratification of remuneration payable to the Cost Auditors for the Financial Year 2018-19 is forming part of the notice convening the ensuing AGM.
Committee of the BoardYour Company has the following Committees: Audit Committee, Nomination and Remuneration Committee, Stakeholder Relationship Committee, Finance Committee, CSR Committee and Committee of Directors. The details

SPML Infra Limited Annual Report 2017-1848
pertaining to such Committees are provided in the Corporate Governance Report, forming part of this report.
Internal Financial Control Systems and their AdequacyThe Board of your Company has laid down internal financial Controls to be followed by the Company and that such controls are adequate and operating effectively Systems are inherent in the Company and are working effectively and efficiently. Your Company has adopted a policies and procedures for ensuring the orderly and efficient conduct of its business including adherence to the Company’s policies, the safeguarding of its assets, the prevention and detection of frauds and errors, the accuracy and completeness of the accounting records and the timely preparation of reliable financial disclosure
Vigil MechanismIn line with the requirement under Section 177(9) & (10) of the Companies Act, 2013, read with the Companies (Meeting of the Board and its Powers) Rules 2014 and Regulation 22 of the SEBI (Listing Obligations and Disclosure Requirements) Regulations, 2015, your Company has adopted a Whistle Blower Policy establishing Vigil Mechanism, to provide a formal mechanism to the directors and employees to report any fraudulent financial or other information any unethical behavior, actual or suspected fraud or violation of the Company’s code of conduct or ethics policy. The Policy provides for adequate safeguards against victimization of employees who avail of the mechanism and also provide for direct access to the Chairman of the Audit Committee. The functioning of the vigil mechanism is reviewed by the Audit Committee. It is hereby affirmed that no personnel of the Company has been denied access to the Audit Committee. The Whistle Blower Policy is available at Company’s website at www.spml.co.in.
Risk ManagementThe Board of your Company has framed a policy on Risk Management which provides for identification, assessment and control of risks that in the opinion of the Board may threaten the existence of the Company. The Management review, monitors, identifies and controls risks through a properly defined framework in terms of the Risk Management Policy.
Particulars of Investments, Loans, Guarantees given or Securities ProvidedPursuant to Section 186 of the Companies Act, 2013 and Schedule V of the Securities and Exchange Board of India (Listing Obligations and disclosures Requirements)
Regulations, 2015, disclosure on particulars relating to Investments, Loans, Guarantees and Securities are forming part of the Annual Report.
Related Parties TransactionsAs a part of its philosophy of adhering to the highest ethical standards, transparency and accountability, your Company has historically adopted the practice of undertaking related party transaction in ordinary course of business and on arm’s length basis. In line with the Companies Act, 2013 and Listing Regulations, the Board has approved the policy on related party transaction and the same is placed on the website of the Company.
All the related party transactions are placed on quarterly basis before the Audit Committee and Board for their approval. Prior Omnibus approval also obtained from the Audit Committee and Board for the transactions which are repetitive in nature.
The particulars of all contracts or arrangements with related parties referred in Section 188(1) of the Companies Act, 2013 in Form AOC-2 is annexed as Annexure—3 to this report.
Material Changes and CommitmentsThere have been no material changes and commitments affecting the financial position of the Company which occurred between the end of the Financial Year of the Company as on 31st March 2018 and the date of this report.
Significant and Material Orders impacting Operations of Company in FutureThere are no significant or material orders that have been passed by any Regulators /Court or Tribunals impacting the going concern status and future operations of your Company.
Investor Education and Protection Fund (IEPF)Pursuant to Provisions of Section 124 of the Companies Act 2013 read with Rule 6 of the IEPF Authority (Accounting, Audit, Transfer and Refund) Rules, 2016, as amended from time to time, all unpaid or unclaimed dividends, which remains unpaid or unclaimed for a period of seven years are required to be transferred by the Company to the Investor Education and Protection Fund (“IEPF”), established by the Central Government.
Further, the Company is also required to transfer all the shares in respect of which dividend has not been paid or claimed for Seven (7) consecutive years or more to the Demat Account created by the IEPF Authority. However, in case if any dividend is paid or claimed for any year during the said period of Seven (7) consecutive years, the shares in respect of which dividend

49Statutoryreports
Corporate Overview
Financial statements
is paid so paid or claimed shall not be transferred to demat account of IEPF.
In compliance with the aforesaid provisions the Company has transferred the unclaimed and unpaid dividends and corresponding shares to IEPF. The details of the unclaimed / unpaid dividend during the last seven (7) years and also the details of the unclaimed shares transferred to IEPF are available on the website of the Company at www.spml.co.in
Reporting of FraudsThere have been no instances of fraud reported by the Statutory Auditors of the Company under Section 143(12) of the Companies Act, 2013 and the Rules framed thereunder either to the Company or to the Central Government.
Management Discussion and AnalysisIn terms of the Regulation 34(2)(e) of SEBI (Listing Obligation and Disclosure Requirements) Regulations, 2015 Report on Management discussion and Analysis forms part of the Annual Report.
Corporate Governance ReportPursuant to Listing Regulations and Schedule V of the SEBI (Listing Obligations and Disclosure Requirements) Regulations, 2015, a separate section titled ‘Corporate Governance’ has been incorporated in the Annual Report.
A certificate from the auditors of the Company regarding compliance with the conditions of Corporate Governance also forms part of the Annual Report.
Employees RelationsDuring the year under review the relations with the employees has been cordial. Your directors place on record their sincere appreciation for services rendered by the employees of the Company.
Protection of Women at WorkplaceSPML strives to provide a safe working environment to woman employees to avoid any gender discrimination. Therefore, the Company has formulated a Policy on Prevention of Sexual Harassment at work place in terms of the provisions of the Sexual Harassment of Women at Workplace (Prevention, Prohibition & Redressal) Act, 2013. The objective of the policy is to prohibit, prevent and address issues of sexual harassment at work place. Pursuant to the said act the Company has constituted the Internal Complaint Committee for Prevention of Sexual Harassment (ICC) of all women employees whether they are permanent, temporary or contractual. The said policy also covered the women service provider or women who visit any office premises of the Company. In order to raise
awareness among the employees the aforesaid policy has been widely circulated to all the employees of the Company.
During the year under review, no case of sexual harassment was reported.
Particulars of EmployeesDisclosures required pursuant to Section 197(12) of the Companies Act, 2013 read with Rule 5(1) of the Companies (Appointment and Remuneration of Managerial Personnel)Rules, 2014 are annexed as Annexure – 5A to this report.
Further, a Statement containing the name of top ten employee of the Company in terms of the receipt of the remuneration of `102 lakhs if employed throughout the year and receipt of `8.50 lakhs if employed for a part of the financial year in terms of Rule 5(2) of Companies (Appointment and Remuneration of Managerial Personnel) Rules, 2014 are annexed as Annexure- 5B to this report.
Conservation of Energy, Technology Absorption, Foreign Exchange Earnings and Outgo Conservation of EnergyThe Particulars as prescribed under Section 134(3)(m) of the Companies Act, 2013 read with Rule 8 of Companies (Accounts) Rule, 2014 pertaining to conservation of energy, technology absorption, foreign exchange earnings and outgo conservation of energy are attached as Annexure – 6 and form part of this report.
AcknowledgementYour Directors take this opportunity to thank and express their sincere appreciation for the valuable cooperation and support received from the Company’s Bankers, Financial Institutions, Central and State Government Authorities, Joint Venture Partners, Clients, Consultants, Suppliers, Shareholders, employees and other stakeholders of the Company.
Further, the Directors would also like to place their sincere gratitude towards the incredible support extended by the Banks / financial institution and Promoters of the Company to support and revive the Company from the Financial Distress through their remarkable contribution in implementation of the S4A Scheme.
On behalf of the Board
Place: Gurgaon Subhash Chand SethiDate: 30th May, 2018 Chairman

SPML Infra Limited Annual Report 2017-1850
ANNEXURE – 1Annual Report on Corporate Social Responsibility (CSR) activities
for the financial year 2017-18(Pursuant to Section 135 of the Companies Act, 2013)
Place: Gurgaon Sushil Kumar Sethi Sarthak Behuria
Date: 30th May, 2018 Managing Director Chairman - CSR Committee
(` in Lakhs)(1) (2) (3) (4) (5) (6) (7) (8)Sr. No.
CSR project or Activity identified
Sector in which the project is covered
Project or Programs (1) Local area or
other(2) Specify
the State and district where
project or programs was
undertaken
Amount Outlay
(budget) project or
program wise
Amount spent on the projects or programs Subhead: (1) Direct
expenditure on projects or programs. (2)
Overheads
Cumulative expenditure
upto the reporting
period
Amount Spent Direct or through
implementing agency
01. Contribution towards promotion of education and health care
Promoting health care under clause (i) of Schedule VII of the Companies Act, 2013 and Promoting education under clause (ii) of Schedule VII of the Companies Act, 2013
28.10 NIL NIL Indirect
*Out of total unspent amount of `77.66 lakhs as on 31.03.2018 `49.56 lakhs pertains to prior financial years, which were contributed by the Company by way of donation, however the same stand unspent as on 31.03.2018 as the donee trust could not presented the donation cheques.
1 A brief outline of the Company’s CSR Policy, including overview of projects or programs proposed to be undertaken and a reference to the web-link to the CSR policy and projects or programs and the Composition of the CSR Committee
Refer Corporate Social Responsibility section of the Directors Report.
2. Average net profit of the Company for last three financial year `1,404.76 lakhs3. Prescribed CSR Expenditure (2% of the amount as in item 2 above) `28.10 lakhs4. Detail of CSR spent during the financial year.
(a) Total amount to be spent for the financial year `28.10 lakhs(b) Amount unspent, if any *`77.66 lakhs(c) Manner in which the amount spent during the financial year 2017-18 Details given below

51Statutoryreports
Corporate Overview
Financial statements
ANNEXURE – 2Form No. MR-3
SECRETARIAL AUDIT REPORTFOR THE FINANCIAL YEAR ENDED 31ST MARCH 2018
[Pursuant to section 204(1) of the Companies Act, 2013 and rule No. 9 of theCompanies (Appointment and Remuneration Personnel) Rules, 2014]
To,The Members,SPML Infra Limited,F-27/2, Okhla Industrial Area Phase-II, New Delhi-110020
I have conducted the secretarial audit of the compliance of applicable statutory provisions and the adherence to good corporate practices by SPML Infra Limited, (CIN No. L40106DL1981PLC012228) (hereinafter called the Company). I have not done audit of financial statements of the Company. Secretarial Audit was conducted in a manner that provided me a reasonable basis for evaluating the corporate conducts/statutory compliances and expressing my opinion thereon.
Based on my verification of the Company’s books, papers, minute books, forms and returns filed and other records maintained by the Company and also the information provided by the Company, its officers, agents and authorized representatives during the conduct of secretarial audit, I hereby report that in my opinion, during the audit period covering the financial year ended on 31st March 2018, the Company has complied with the statutory provisions listed hereunder and also that the Company has proper Board-processes and compliance-mechanism in place to the extent, in the manner and subject to the reporting made hereinafter:
I have examined the books, papers, minute books, forms and returns filed and other records maintained by the Company for the financial year ended on 31st March 2018 according to the provisions of:
(i) The Companies Act, 2013 (the Act) and the rules made thereunder;
(ii) The Securities Contracts (Regulation) Act, 1956 (‘SCRA’) and the rules made thereunder;
(iii) The Depositories Act, 1996 and the Regulations and Bye-laws framed thereunder;
(iv) Foreign Exchange Management Act, 1999 and the rules and regulations made thereunder to the extent of Foreign Direct Investment, Overseas Direct Investment and External Commercial Borrowings;
(v) The following Regulations and Guidelines prescribed under the Securities and Exchange Board of India Act, 1992 (‘SEBI Act’):-
a. The Securities and Exchange Board of India (Substantial Acquisition of Shares and Takeovers) Regulations, 2011;
b. The Securities and Exchange Board of India (Prohibition of Insider Trading) Regulations, 2015;
c. The Securities and Exchange Board of India (Issue of Capital and Disclosure Requirements) Regulations, 2009;
d. The Securities and Exchange Board of India (Employee Stock Option Scheme and Employee Stock Purchase Scheme) Guidelines, 1999;
e. The Securities and Exchange Board of India (Issue and Listing of Debt Securities) Regulations, 2008;
f. The Securities and Exchange Board of India (Registrars to an Issue and Share Transfer Agents) Regulations, 1993 regarding the Companies Act and dealing with client;
g. The Securities and Exchange Board of India (Delisting of Equity Shares) Regulations, 2009; and
h. The Securities and Exchange Board of India (Buyback of Securities) Regulations, 1998;
I have also examined compliance with the applicable clauses of the following:
(i) Secretarial Standards issued by The Institute of Company Secretaries of India and notified by the Ministry of Corporate Affairs.
(ii) SEBI Listing Regulations (LODR), 2015.

SPML Infra Limited Annual Report 2017-1852
During the period under review the Company has complied with the provisions of the Act, Rules, Regulations, Guidelines, Standards, etc. mentioned above.
I further report that
The Board of Directors of the Company is constituted with proper balance of Executive Directors, Non-Executive Directors. The changes in the composition of the Board of Directors that took place during the period under review were carried out in compliance with the provisions of the Act as required under the Act.
Adequate notice is given to all directors to schedule the Board Meetings, agenda and detailed note on agenda were sent at least seven days in advance, and a system exists for seeking and obtaining further information and clarifications on the agenda items before the meeting and for meaningful participation at the meeting. Majority decision is carried through while the dissenting members’ views are captured and recorded as part of the minutes.
I further report that there are adequate systems and processes in the Company commensurate with the size and operations of the Company to monitor and ensure compliance with applicable laws, rules, regulations and guidelines.
I further report that during the year under report, the Company has not undertaken any corporate event/action having a major bearing on the Company’s affairs in pursuance of the above referred laws, rules, regulations, guidelines, standards, etc.
For PTM & Co.Company Secretaries
(Tumul Maheswari)Place: Delhi ACS/FCS No. 16464Date: 21.05.2018 CP No: 5554
*This report to be read with my letter of even date which is annexed as Annexure and forms an integral part of this report.
My report of even date is to be read along with this letter.
1. Maintenance of Secretarial record is the responsibility of the management of the Company. My responsibility is to express an opinion on these secretarial records based on my audit.
2. I have followed the audit practices and process as were appropriate to obtain reasonable assurance about the correctness of the contents of the Secretarial records. The verification was done on test basis to ensure that correct facts are reflected in secretarial records. I believe that the processes and practices I followed provide a reasonable basis for my opinion.
3. I have not verified the correctness and appropriateness of financial records and Books of Accounts of the Company.
4. Wherever required, I have obtained the Management representation about the compliance of laws, rules and regulations and happening of events etc.
5. The compliance of the provisions of Corporate and other applicable laws, Rules, Regulations, standards is the responsibility of management. My examination was limited to the verification of procedures on test basis.
6. The Secretarial Audit report is neither an assurance as to the future viability of the Company nor of the efficacy or effectiveness with which the management has conducted the affairs of the Company.
For PTM & Co.Company Secretaries
(Tumul Maheswari)Place: Delhi ACS/FCS No. 16464Date: 21.05.2018 CP No: 5554
ANNEXURE – A
To,The Members,SPML Infra Limited,F-27/2, Okhla Industrial Area Phase-II, New Delhi-110020

53Statutoryreports
Corporate Overview
Financial statements
ANNEXURE – 3Form No. AOC-2
Form for disclosure of particulars of contracts / arrangements entered into by the Company with related parties referred to in sub-section (1) of section 188 of the Companies Act, 2013 including certain arm’s length
transactions under third proviso thereto(Pursuant to clause (h) of sub-section (3) of section 134 of the Act and Rule 8(2) of the Companies (Accounts) Rules, 2014)
1. Details of contracts or arrangements or transactions not at arm’s length basis:
The Company has not entered into any contract or arrangement or transaction with its related parties which is not at arm’s length during financial year 2017-18.
2. Details of material contracts or arrangement or transactions at arm’s length basis:
a. Name(s) of the related party and nature of relationship: Mr Abhinandan Sethi, Chief Operating Officer of the Company (son of Mr Subhash Chand Sethi, Chairman & Wholetime Director of the Company).
b. Nature of contracts / arrangements / transactions: Revision in remuneration beyond the ceiling limit of monthly remuneration of `2.50 lakhs, as provided under Rule 15 of the Companies (Meeting of Board and its Power) Rules 2014, with authority to Board to further increase his remuneration w.e.f. 1st April 2018 and thereafter at the end of every 12 months by a maximum of 25% per annum of the remuneration payable for the financial year preceding to the financial year in respect of which such increment pertains.
c. Duration of the contracts / arrangements / transactions: The revision in remuneration was effective from 1st October 2017. The employment Contract with Mr. Abhinandan Sethi shall, unless
ceases to exist before, be valid till Mr. Abhinandan Sethi attains the age of superannuation under prevalent laws or as per policy of the Company.
d. Salient terms of the contracts or arrangements or transactions including the value, if any: As per the employment contract, as may be amended from time to time and agreed by Mr. Abhinandan Sethi to render his services to the Company. The revision in the remuneration was from `2,50,000/- to `6,00,000/- per month, with a provision to increase upto 25% every year along with other perquisites as per the Resolution passed by the shareholders in their 36th Annual General Meeting held on 29th September 2017.
e. Date(s) of approval by the Board, if any: The revision in remuneration of Mr. Abhinandan Sethi was approved by Board at its meeting held on 25th August 2017 and also by the shareholders in their 36th Annual General Meeting held on 29th September 2017.
f. Amount paid as advances, if any: Nil
On behalf of the Board
Place: Gurgaon Subhash Chand SethiDate: 30th May, 2018 Chairman

SPML Infra Limited Annual Report 2017-1854
ANNEXURE – 4Form No. MGT-9
EXTRACT OF ANNUAL RETURNAs on the financial year ended on 2017-18
[Pursuant to Section 92(3) of the Companies Act, 2013 and Rule 12(1) of the Companies (Management and Administration) Rules, 2014]
I REGISTRATION & OTHER DETAILSi) CIN L40106DL1981PLC012228ii) Registration Date 27.08.1981iii) Name of the Company SPML Infra Limitediv) Category/Sub-category of the Company Company limited by shares/Indian Non-Government Companyv) Address of the Registered office &
contact detailsF-27/2, Okhla Industrial Area Phase-II, New Delhi-110020Ph No: +91-11-26387091Email: [email protected]; Website: www.spml.co.in
vi) Whether listed Company (Yes/No) Yes (listed on BSE Limited and National Stock Exchange of India Limited)vii) Name, Address & contact details of the
Registrar & Transfer Agent, if any.Maheshwari Datamatics Private Limited,23, R N Mukherjee Road, 5th Floor, Kolkata- 700001Contact : +91-33-22482248/2243-5809; Fax: 033-22484787Email: [email protected], website: www.mdpl.in
II PRINCIPAL BUSINESS ACTIVITIES OF THE COMPANYAll the business activities contributing 10% or more of the total turnover of the Company shall be stated
SL. No.
Name & Description of main products/services NIC Code of the Product /service
% to total turnover of the Company
1 Construction & maintenance of water main & line connection, water reservoirs including irrigation system (canal) / Construction & repair of sewer systems including sewage disposal plants & pumping stations.
42204 / 42205 55.12%
2 Construction and maintenance of power plants / Construction/erection & maintenance of power, telecommunication & transmission lines
42201 / 42202 23.25%
3 Trading of Iron and Steel 47990 21.63%
SL. No.
Name & Address of the Company CIN/GLN Holding/ Subsidiary/ Associate
% of Shares Held
Applicable Section
1 ADD Energy Management Company Private LimitedThe ICON, No. 8, 5th Floor, 80Ft Main Road, Indiranagar, HAL 3rd Stage, Bangalore - 560 075
U74140KA2009PTC048963 Subsidiary 44.72 2(87)
2 Allahabad Waste Processing Company LimitedF-27/2, Okhla Industrial Area, Phase II, New Delhi - 110020
U90000DL2010PLC198272 Subsidiary 95.02 2(87)
3 Awa Power Company Private LimitedHouse No. 04, Ward No.01, Bandla Tea Estate, Near T-Bud Hotel, Palampur-176061, Himachal Pradesh
U45202HP2001PTC029000 Subsidiary 28.91 2(87)
III PARTICULARS OF HOLDING, SUBSIDIARY & ASSOCIATE COMPANIES

55Statutoryreports
Corporate Overview
Financial statements
SL. No.
Name & Address of the Company CIN/GLN Holding/ Subsidiary/ Associate
% of Shares Held
Applicable Section
4 Bhagalpur Electricity Distribution Company Private Limited22, Abanindra Nath Thakur Sarani, Block A, 3rd Floor, Kolkata – 700016
U40300WB2013PTC193917 Wholly Owned Subsidiary
99.99 2(87)
5 Binwa Power Company Private LimitedHouse No.04, Ward No. 01, Bandla Tea Estate, Near T-Bud Hotel, Palampur - 176061, Himachal Pradesh
U45202HP1990PTC029003 Subsidiary 50.79 2(87)
6 Delhi Waste Management LimitedF-27/2, Okhla Industrial Area, Phase II, New Delhi-110020
U74999DL2005PLC131954 Subsidiary 52.03 2(87)
7 Doon Valley Waste Management Private LimitedF-27/2, Okhla Industrial Area, Phase II, New Delhi - 110020
U90000DL2011PTC214130 Subsidiary 61.45 2(87)
8 IQU Power Company Private LimitedHouse No.04, Ward No. 01, Bandla Tea Estate, Near T-Bud Hotel, Palampur-176061, Himachal Pradesh
U45202HP2001PTC029002 Subsidiary 28.89 2(87)
9 Luni Power Company Private LimitedHouse No.04, Ward No.01, Bandla Tea Estate, Near T-Bud Hotel, Palampur - 176061, Himachal Pradesh
U40101HP2001PTC028999 Subsidiary 57.67 2(87)
10 Madurai Municipal Waste Processing Company Private LimitedSurvey No. 625, Vellaikkal Village, Perungudi Post, Madurai, Tamil Nadu-625022
U74999TN2008PTC066715 Subsidiary 92.33 2(87)
11 Mathura Nagar Waste Processing Company LimitedF-27/2, Okhla Industrial Area, Phase II, New Delhi - 110020
U90001DL2010PLC197893 Subsidiary 90.25 2(87)
12 Mizoram Infrastructure Development Company LimitedC/O Zoram Industrial Development Corporation Limited, New Secretariat Complex, Khatla, Aizawl - 796001, Mizoram
U45201MZ2014PLC008277 Subsidiary 68.99 2(87)
13 Neogal Power Company Private LimitedHouse No.04, Ward No.01, Bandla Tea Estate, Near T-Bud Hotel, Palampur -176061, Himachal Pradesh
U45202HP2001PTC029001 Subsidiary 26.34 2(87)
14 Rupin Tons Power Company Private Limited*F-27/2, Okhla Industrial Area, Phase II, New Delhi-110020
U31202DL1996PTC083370 Step Down Subsidiary
37.95 2(87)
15 SJA Developers Private LimitedF-27/2, Okhla Industrial Area, Phase II, New Delhi – 110020
U70109DL2006PTC150546 Subsidiary 43.46 2(87)
16 SPM Holdings Pte Limited101 Cecil Street, #24-10 Tong Eng Building Singapore 069 533
N.A Foreign Step Down Subsidiary
44.72 2(87)
17 SPML Energy Limited8/2, Ulsoor Road, Ulsoor, Bengaluru -560042
U40102KA2007PLC042238 Subsidiary 58.07 2(87)

SPML Infra Limited Annual Report 2017-1856
SL. No.
Name & Address of the Company CIN/GLN Holding/ Subsidiary/ Associate
% of Shares Held
Applicable Section
18 SPML Infra Developers LimitedF-27/2, Okhla Industrial Area, Phase II, New Delhi 110020
U45400DL2014PLC265280 Wholly owned Subsidiary
100 2(87)
19 SPML Infrastructure LimitedThe ICON, No. 8, 5th Floor, 80 Ft Main Road, Indiranagar, HAL 3rd Stage, Bangalore 560 075
U45201KA2007PLC043613 Wholly owned Subsidiary
99.99 2(87)
20 SPML Utilities LimitedMFAR Silverline Tech Park, IInd Floor, Plot No 180, EPIP, Phase II Whitefield, Bangalore - 560042
U90000KA2008PLC046115 Wholly owned Subsidiary
100.00 2(87)
21 Subhash Kabini Power Corporation LimitedB-Wing (South Portion), 5th Floor, Cristu Complex, No.41/7, Lavelle Road, Bengaluru – 560001
U85110KA1997PLC021764 Subsidiary 44.72 2(87)
22 Tons Valley Power Company Private Limited*F-27/2, Okhla Industrial Area, Phase II, New Delhi - 110020
U74999DL1996PTC083371 Step Down Subsidiary
45.82 2(87)
23 ADD Technologies (India) LimitedNo. 16 “Apple Villa” 3rd Floor, Left Wing Lalbagh Road, Bangalore - 560027
U31909KA1995PLC019162 Subsidiary 45.70 2(87)
24 PT Sanmati Natural Resources Menara Prima, 26th Floor, Unit A, Jl. Dr. Ide Anak Agung Gde Agung Blok 6.2, Kawasan Mega Kuningan, Jakarta Selatan 12950
N.A Foreign Subsidiary
44.27 2(87)
25 Uttarkashi Tons Hydro Power Private Limited*F-27/2, Okhla Industrial Area,Phase II, New Delhi-110020
U31200DL1996PTC083367 Step Down Subsidiary
39.78 2(87)
26 Aurangabad City Water Utility Company Limited206, Marthanda Building, Above Canara Bank, Dr Annie Besant Road, Worli Naka, Mumbai – 400018
U41000MH2011PLC219120 Joint Venture 40.01 2(6)
27 Aurangabad Jal Constructions Private LimitedEssel House, B-10, Lawrence Road, Delhi -110035
U41000DL2012PTC235295 Associate 26.00 2(6)
28 Aurangabad Jal Supply Solution Private Limited6TH Floor, Kohinoor City, Kirol Road, Kurla (West), Mumbai - 400070, Maharashtra
U45203MH2012PTC228008 Associate 26.00 2(6)
29 Bhilwara Jaipur Toll Road Private LimitedOm Tower, Church Road, MI Road, Jaipur 302001, Rajasthan
U45203RJ2010PTC031427 Subsidiary 51.00 2(87)
30 Subhash Urja Private Limited22, Abanindra NathThakur SaraniBlock –A, Kolkata-700016
U40300WB2015PTC206181 Wholly owned Subsidiary
100.00 2(87)
31 Hydro-Comp Enterprises (India) Limited8/2, Ulsoor Road, Bangalore, arnataka-560042
U74140KA2007PTC043739 Joint Venture 50.00 2(6)
32 PT Bina Insan Sukses MandiriMenara Prima, 26th Floor, Unit A, Jl. DR. Ide Anak Agung Gde Agung Blok 6.2, Kawasan Mega Kuningan, Jakarta Selatan 12950, Indonesia
N.A Associate 20.00 2(6)

57Statutoryreports
Corporate Overview
Financial statements
SL. No.
Name & Address of the Company CIN/GLN Holding/ Subsidiary/ Associate
% of Shares Held
Applicable Section
33 PT Vardhaman LogisticsMenara Prima, # 26th Floor, Unit A Jl. Lingkar Mega Kuningan Block 6.2, Jakarta - 12950, Indonesia
N.A Associate 12.09 2(6)
34 PT Vardhaman Mining ServicesMenara Prima, # 26th Floor, Unit AJl. Lingkar Mega Kuningan Block 6.2,Jakarta - 12950, Indonesia
N.A Associate 20.09 2(6)
35 Rabaan (S) Pte Limited101 Cecil Street, #24-10 Tong Eng Building Singapore - 069 533
N.A Associate 20.00 2(6)
36 Sanmati Infra Developers Private LimitedThe ICON, No. 8, 5th Floor, 80 Feet Main Road, Indiranagar, Hal III Stage, Bangalore - 560075, Karnataka
U55103KA2006PTC040751 Associate 25.00 2(6)
37 SPML Bhiwandi Water Supply Infra Limited206, Marthanda Building, Above Canara Bank, Dr. Annie Basant Road, Worli Naka, Mumbai - 400018
U41000MH2008PLC182757 Associate 44.94 2(6)
38 SPML Bhiwandi Water Supply Management Limited206, Marthanda Building, Above Canara Bank, Dr. Annie Basant Road, Worli Naka, Mumbai - 400018
U41000MH2008PLC182813 Associate 50.00 2(6)
39 Gurha Thermal Power Company Limited6th Floor, KJ City Tower, Ashok Marg, C-Scheme, Jaipur - 302001, Rajasthan
U40109RJ2009SGC028694 Joint Venture 50.00 2(6)
40 Malviya Nagar Water Services Private LimitedA-1/132 Lower Grd Floor, Safdarjung Enclave, New Delhi - 110029
U93000DL2012PTC273064 Joint Venture 26.00 2(6)
41 MVV Water Utility Private Limited F-27/2, Okhla Industrial Area, Phase II, New Delhi - 110020
U41000DL2012PTC241599 Joint Venture 47.99 2(6)
42 Siddartha - Mahavir SPMLNavi Peth, Jalgaon - 425 001
N.A Joint Venture 10.00 2(6)
43 SPML - CISC 22 Camac Street, Kolkata - 700016
N.A Joint Venture 50.00 2(6)
44 SPML - Simplex JV27 Shakespeare Sarani Kolkata -700017
N.A Joint Venture 50.00 2(6)
45 SPML - HCIL JV22 Camac street, Kolkata - 700 016
N.A Joint Venture 33.00 2(6)
46 SUEZ - SPML JVUnitech Business Park Tower A (Second Floor) South City-I - Gurgaon 122001
N.A Joint Venture 48.00 2(6)
47 M&P + Subhash JV N.A Joint Venture 40.00 2(6)48 SPML-OM Metal JV (Ujjain) N.A Joint Venture 50.00 2(6)49 OM Metal Consortium JV N.A Joint Venture 5.00 2(6)
*Companies filled the application for Striking off with the Registrar of Companies (ROC), Delhi
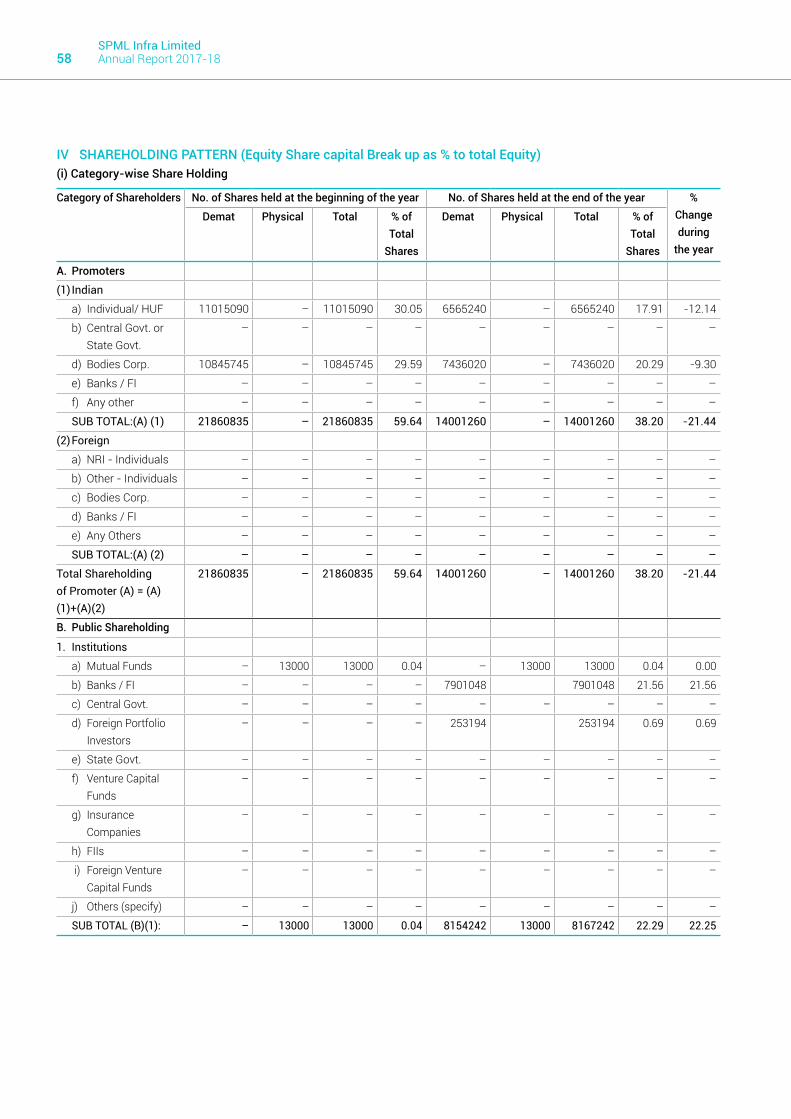
SPML Infra Limited Annual Report 2017-1858
IV SHAREHOLDING PATTERN (Equity Share capital Break up as % to total Equity)(i) Category-wise Share Holding
Category of Shareholders No. of Shares held at the beginning of the year No. of Shares held at the end of the year % Changeduring
the year
Demat Physical Total % of Total
Shares
Demat Physical Total % of Total
Shares
A. Promoters
(1) Indian
a) Individual/ HUF 11015090 – 11015090 30.05 6565240 – 6565240 17.91 -12.14
b) Central Govt. or State Govt.
– – – – – – – – –
d) Bodies Corp. 10845745 – 10845745 29.59 7436020 – 7436020 20.29 -9.30
e) Banks / FI – – – – – – – – –
f) Any other – – – – – – – – –
SUB TOTAL:(A) (1) 21860835 – 21860835 59.64 14001260 – 14001260 38.20 -21.44
(2) Foreign
a) NRI - Individuals – – – – – – – – –
b) Other - Individuals – – – – – – – – –
c) Bodies Corp. – – – – – – – – –
d) Banks / FI – – – – – – – – –
e) Any Others – – – – – – – – –
SUB TOTAL:(A) (2) – – – – – – – – –
Total Shareholding of Promoter (A) = (A)(1)+(A)(2)
21860835 – 21860835 59.64 14001260 – 14001260 38.20 -21.44
B. Public Shareholding
1. Institutions
a) Mutual Funds – 13000 13000 0.04 – 13000 13000 0.04 0.00
b) Banks / FI – – – – 7901048 7901048 21.56 21.56
c) Central Govt. – – – – – – – – –
d) Foreign Portfolio Investors
– – – – 253194 253194 0.69 0.69
e) State Govt. – – – – – – – – –
f) Venture Capital Funds
– – – – – – – – –
g) Insurance Companies
– – – – – – – – –
h) FIIs – – – – – – – – –
i) Foreign Venture Capital Funds
– – – – – – – – –
j) Others (specify) – – – – – – – – –
SUB TOTAL (B)(1): – 13000 13000 0.04 8154242 13000 8167242 22.29 22.25

59Statutoryreports
Corporate Overview
Financial statements
Category of Shareholders No. of Shares held at the beginning of the year No. of Shares held at the end of the year % Changeduring
the year
Demat Physical Total % of Total
Shares
Demat Physical Total % of Total
Shares
2. Non-Institutions
a) Bodies Corp.
i) Indian 5404996 14305 5419301 14.79 5788970 11505 5800475 15.83 1.04
ii) Overseas 5493876 – 5493876 14.99 5493876 – 5493876 14.99 –
b) Individuals
i) Individual shareholders holding nominal share capital upto `2 lakhs
3230838 315208 3546046 9.68 2217227 213326 2430553 6.63 3.05
ii) Individuals shareholders holding nominal share capital in excess of `2 lakhs
154000 – 154000 0.42 355540 – 355540 0.97 0.55
c) Others (specify)
i. Clearing Member
120640 – 120640 0.33 198410 – 198410 0.54 0.21
ii. Non-Resident Individual
41623 – 41623 0.11 50828 – 50828 0.14 -.03
iii) NBFC’s registered with RBI
955 – 955 – 1744 – 1744 0.00 0.00
iv) IEPF – – – – 100848 – 100848 0.28 -0.28
v. Trust – – – – 49500 – 49500 0.13 -0.13
Sub-total (B)(2):- 14446928 329513 14776441 40.32 14256943 224831 14481774 39.51 -0.81
Total Public Shareholding(B)= (B)(1)+(B)(2)
14446928 342513 14789441 40.36 22411185 237831 22649016 61.80 -20.44
C. Shares held by Custodian for GDRs & ADRs
– – – – – – – – –
Grand Total (A+B+C) 36307763 342513 36650276 100.00 36412445 237831 36650276 100.00 0.00

SPML Infra Limited Annual Report 2017-1860
(ii) Share Holding of Promoters
Sl No
Shareholders Name Shareholding at the beginning of the year
Shareholding at the end of the year
% change in share holding during
the year
No. of shares
% of total shares of the
Company
% of shares pledged/
encumbered to total shares
No. of shares
% of total shares of the
Company
% of shares pledged/
encumbered to total shares
1 Anil Kumar Sethi 1902835 5.19 – 1775780 4.85 100.00 -0.342 Subhash Chand Sethi 1697790 4.64 99.59 1523280 4.16 100.00 -0.483 Priti Devi Sethi 1447025 3.95 100.00 – – – -3.954 Sushil Kumar Sethi 1056985 2.88 100.00 1056985 2.88 100.00 0.005 Harshvardhan Sethi 613930 1.67 100.00 – – – -1.676 Deepak Sethi 582250 1.59 99.96 582250 1.59 100.00 0.007 Abhinandan Sethi 539735 1.47 100.00 – – – -1.478 Punam Chand Sethi 494625 1.35 – 494625 1.35 0.00 0.009 Subhash Chand Sethi (HUF) 450020 1.23 100.00 – – – -1.23
10 Sushil Kumar Sethi (HUF) 389870 1.06 100.00 – – – -1.0611 Punam Chand Sethi (HUF) 372735 1.02 – 372735 1.02 0.00 0.0012 Maina Devi Sethi 351485 0.96 – – – – -0.9613 Anil Kumar Sethi (HUF) 334735 0.91 – 334735 0.91 100.00 0.0014 Sandhya Rani Sethi 263220 0.72 – – – – -0.7215 Suman Sethi 183735 0.50 – 183735 0.50 100.00 0.0016 Shilpa Sethi 181515 0.50 – 181515 0.50 100.00 0.0017 Rishabh Sethi 93000 0.25 100.00 – – – -0.2518 Vineeta Sethi 59600 0.16 – 59600 0.16 100.00 0.0019 Zoom Industrial Services Limited 3073510 8.39 100.00 2500000 6.82 100.00 -1.5720 SPML India Limited 2335735 6.37 100.00 2119055 5.78 100.00 -0.5921 20th Century Engineering Limited 1437900 3.92 100.00 1000000 2.73 100.00 -1.1922 Bharat Hydro Power Corporation
Limited1391470 3.80 100.00 – – – -3.80
23 SPM Engineers Limited 1279665 3.49 60.93 500000 1.36 0.00 -2.1324 International Constructions
Limited880945 2.40 100.00 880945 2.40 100.00 0.00
25 Arihant Leasing And Holding Limited
436020 1.19 100.00 436020 1.19 100.00 0.00
26 Sonal Agencies Private Limited 6500 0.02 – – – – -0.0227 Rishab Commercials Private
Limited2000 0.01 – – – – -0.01
28 Abhinandan Enterprises Private Limited
2000 0.01 – – – – -0.01
Total 21860835 59.65 78.67 14001260 38.20 89.80 -21.44

61Statutoryreports
Corporate Overview
Financial statements
(iii) Change in Promoters' Shareholding (please Specify, if there is no change)
Sl No
Shareholders Name Shareholding at the beginning of the Year
Cumulative Shareholding during the year
No. of shares
% of total shares of the
Company
No. of shares
% of total shares of the
Company
1 Anil Kumar SethiAt the beginning of the year 1902835 5.19 – –Change During the year 127055 0.34 1775780 4.85Date 18.12.2017Reason Invocation pursuant to S4A SchemeAt the end of the year 1775780 4.85 17755780 4.85
2 Subhash Chand SethiAt the beginning of the year 1697790 4.64 – –Change During the year 174510 0.48 1523280 4.16Date 20.12.2017Reason Invocation pursuant to S4A SchemeAt the end of the year 1523280 4.16 1523280 4.16
3 Priti Devi SethiAt the beginning of the year 1447025 3.95 – –Change During the year 1447025 3.95 – –Date 22.11.2017 & 20.12.2017Reason Invocation pursuant to S4A SchemeAt the end of the year – – – –
4 Harshvardhan SethiAt the beginning of the year 613930 1.68 – –Change During the year 613930 1.68 – –Date 17.11.2017Reason Invocation pursuant to S4A SchemeAt the end of the year – – – –
5 Abhinandan SethiAt the beginning of the year 539735 1.47 – –Change During the year 539735 1.47 – –Date 17.11.2017Reason Invocation pursuant to S4A SchemeAt the end of the year – – – –
6 Subhash Chand Sethi (HUF)At the beginning of the year 450020 1.23 – –Change During the year 450020 1.23 – –Date 17.11.2017Reason Invocation pursuant to S4A SchemeAt the end of the year – – – –

SPML Infra Limited Annual Report 2017-1862
Sl No
Shareholders Name Shareholding at the beginning of the Year
Cumulative Shareholding during the year
No. of shares
% of total shares of the
Company
No. of shares
% of total shares of the
Company7 Sushil Kumar Sethi (HUF)
At the beginning of the year 389870 1.06 – –Change During the year 389870 1.06 – –Date 22.11.2017Reason Invocation pursuant to S4A SchemeAt the end of the year – – – –
8 Maina Devi SethiAt the beginning of the year 351485 0.96 – –Change During the year 351485 0.96 – –Date 29.12.2017Reason Sale pursuant to S4A SchemeAt the end of the year – – – –
9 Sandhya Rani SethiAt the beginning of the year 263220 0.72 – –Change During the year 263220 0.72 – –Date 18.12.2017Reason Invocation pursuant to S4A SchemeAt the end of the year – – – –
10 Rishabh SethiAt the beginning of the year 93000 0.25 – –Change During the year 93000 0.25 – –Date 22.11.2017Reason Invocation pursuant to S4A SchemeAt the end of the year – – – –
11 Zoom Industrial Services LimitedAt the beginning of the year 3073510 8.39 – –Change During the year 573510 1.57 2500000 6.82Date 22.11.2017, 14.12.2017 & 20.12.2017Reason Invocation pursuant to S4A SchemeAt the end of the year 2500000 6.82 2500000 6.82
12 20th Century Engineering LimitedAt the beginning of the year 1437900 3.92 – –Change During the year 437900 1.19 1000000 2.73Date 22.11.2017Reason Invocation pursuant to S4A SchemeAt the end of the year 1000000 2.73 1000000 2.73

63Statutoryreports
Corporate Overview
Financial statements
Sl No
Shareholders Name Shareholding at the beginning of the Year
Cumulative Shareholding during the year
No. of shares
% of total shares of the
Company
No. of shares
% of total shares of the
Company13 SPML India Limited
At the beginning of the year 2335735 6.37 – –Change During the year 216680 0.59 2119055 5.78Date 22.11.2017Reason Invocation pursuant to S4A SchemeAt the end of the year 2119055 5.78 2119055 5.78
14 SPM Engineers LimitedAt the beginning of the year 1279665 3.49 – –Change During the year 779665 2.13 500000 1.36Date 22.11.2017Reason Sale pursuant to S4A SchemeAt the end of the year 500000 1.36 500000 1.36
15 Sonal Agencies Private LimitedAt the beginning of the year 6500 0.02 – –Change During the year 6500 0.02 – –Date 05.12.2017Reason Sale pursuant to S4A SchemeAt the end of the year – – – –
16 Bharat Hydro Power Corporation LimitedAt the beginning of the year 1391470 3.80 – –Change During the year 1391470 3.80 – –Date 17.11.2017 & 20.12.2017Reason Invocation pursuant to S4A SchemeAt the end of the year – – – –
17 Rishabh Commercials Private LimitedAt the beginning of the year 2000 0.01 – –Change During the year 2000 0.01 – –Date 05.12.2017Reason Sale pursuant to S4A SchemeAt the end of the year – – – –
18 Abhinandan Enterprises Private LimitedAt the beginning of the year 2000 0.01 – –Change During the year 2000 0.01 – –Date 05.12.2017Reason Sale pursuant to S4A SchemeAt the end of the year – – – –

SPML Infra Limited Annual Report 2017-1864
(iv) Shareholding Pattern of top Ten Shareholders (other than Directors, Promoters & Holders of GDRs & ADRs)
Sl No
Shareholders Name Shareholding at the beginning of the Year
Shareholding at the end of the year
No. of shares
% of total shares of the
Company
No. of shares
% of total shares of the
Company1 Client Rosehill Limited 3521575 9.61 3521575 9.612 State Bank Of India – – 2849006 7.773 CVCIGP II Employee Rosehill Limited 1972301 5.38 1972301 5.384 Canara Bank – – 1751336 4.795 Udgam Commercial Limited 1889236 5.15 1706906 4.626 ICICI Bank Limited – – 1185639 3.247 Mayank Securities Private Limited 1081605 2.95 951490 2.608 Techno Mechanical Services Private Limited 728982 1.99 728982 1.999 Syndicate Bank – – 555797 1.52
10 Punjab National Bank – – 495854 1.35
(v) Shareholding of Directors & KMP
Sl No
For Each of the Directors & KMP Shareholding at the beginning of the Year
Cumulative Shareholding during the year
No. of shares
% of total shares of the
Company
No. of shares
% of total shares of the
Company1 Subhash Chand Sethi (Whole-time-Director)
At the beginning of the year 1697790 4.64 1697790 4.64Change During the year 174510Date 20.12.2017Reason Invocation pursuant to S4A SchemeAt the end of the year 1523280 4.12 1523280 4.12
2 Sushil Kumar Sethi (Managing Director)At the beginning of the year 1056985 2.88 – –Change During the year NILDate Not ApplicableReason Not ApplicableAt the end of the year 1056985 2.88 1056985 2.88
3 Deepak Sethi (Non-Executive Director) At the beginning of the year 582250 1.59 – –Change During the year NILDate Not ApplicableReason Not ApplicableAt the end of the year 582250 1.59 582250 1.59
4 Abhay Raj Singh (Company Secretary)
NONEAt the beginning of the yearChange During the yearDate
5 Sujit Kumar Jhunjhunwala (CFO)
NONEAt the beginning of the yearChange During the yearDate

65Statutoryreports
Corporate Overview
Financial statements
(` in lakhs)SL. No.
Secured Loans excluding deposits
Unsecured Loans
Deposits Total Indebtedness
1 Indebtedness at the beginning of the financial yeari) Principal Amount 74,702.16 17,336.35 – 92,038.51ii) Interest due but not paid 149.82 575.79 – 725.61iii) Interest accrued but not due 21.20 – – 21.20Total (i+ii+iii) 74,873.18 17,912.14 – 92,785.32
2 Change in Indebtedness during the financial yearAdditions 34,183.48 – – 34,183.48Reduction – 316.91 – 316.91
3 Net Change 34,183.48 316.91 – 33,866.574 Indebtedness at the end of the financial year
i) Principal Amount 1,09,036.18 17,595.23 – 1,26,631.41ii) Interest due but not paid – – – –iii) Interest accrued but not due 20.48 – – 20.48Total (i+ii+iii) 1,09,056.66 17,595.23 – 1,26,651.89
*Figures for March 31, 2017 have been regrouped to make comparable with current year figures.
SL. No.
Particulars of Remuneration Name of Whole Time Director
Name of Managing Director
Gross salary Subhash Chand Sethi (`)
Sushil Kumar Sethi (`)
Total
1 (a) Salary as per provisions contained in section 17(1) of the Income Tax. 1961.
72,00,000 72,00,000 14,400,000
2 (b) Value of perquisites u/s 17(2) of the Income tax Act, 1961
360,000 960,000 1,320,000
3 (c) Profits in lieu of salary under section 17(3) of the Income Tax Act, 1961
– –
4 Stock option – – –5 Sweat Equity – – –6 Commission as % of profit 3,753,790 3,753,790 75,07,5807 Others, please specify – –
Total (A) 11,313,790 11,913,790 23,227,580Ceiling as per the Act `475.57 lakhs (being 10% of the net profits of the Company
calculated as per Section 198 of the Companies Act, 2013)
V INDEBTEDNESSIndebtedness of the Company including interest outstanding/accrued but not due for payment
VI REMUNERATION OF DIRECTORS AND KEY MANAGERIAL PERSONNELA. Remuneration to Managing Director, Whole Time Director and/or Manager:

SPML Infra Limited Annual Report 2017-1866
SL. No.
Name Sitting Fees(`)
Commission(`)
Total Compensation(`)
I Non-Executive Directors1 Mr. Deepak Sethi – – –
Total (I) – – –II Independent Directors/ Nominee Directors1 Mr. Prem Singh Rana 330,000 – 330,0002 Mr. Sarthak Behuria 300,000 – 300,0003 Ms. Archana Capoor 360,000 – 360,0004 Dr. Dinesh Kumar Goyal 360,000 – 360,0005 Mr. Sushil Kumar Roongta 240,000 – 240,0006 Mr. Supriyo Kumar Chaudhuri 280,000 – 280,000
Total (II) 1,870,000 – 1,870,000Grand Total (I + II) 1,870,000 – 1,870,000Overall Ceiling as per the Companies Act, 2013 (excluding Sitting Fee)
`47.56 lakhs (being 10% of the net profits of the Company calculated as per Section 198 of the
Companies Act, 2013)
B. Remuneration to other directors:
SL. No.
Particulars of Remuneration Key Managerial PersonnelGross salary Abhay Raj Singh
Company Secretary(`)
Sujit Kumar Jhunjhunwala*
CFO(`)
Total Amount(`)
1 (a) Salary as per provisions contained in section 17(1) of the Income Tax. 1961
24,15,908 22,72,743 46,88,651
(b) Value of perquisites u/s 17(2) of the Income tax Act, 1961
– – –
(c) Profits in lieu of salary under section 17(3) of the Income Tax Act, 1961
– – –
2 Stock option – – –3 Sweat Equity – – –4 Commission – – –
as % of profit – – –Others, specify – – –
5 Others, please specify – – –Total 24,15,908 22,72,743 46,88,651
*for part of the year
C. Remuneration to Key Managerial Personnel Other than MD/Manager/WTD

67Statutoryreports
Corporate Overview
Financial statements
SL. No.
Type Section of the Companies
Act
Brief Description
Details of Penalty/
Punishment/Compounding fees imposed
Authority (RD/CLB/NCLT/
Court)
Appeal made if any (give
details)
A. COMPANY
N. APenaltyPunishmentCompounding
B. DIRECTORS
N. APenaltyPunishmentCompounding
C. OTHER OFFICERS IN DEFAULT
N. APenaltyPunishmentCompounding
VII PENALTIES/PUNISHMENT/COMPOUNDING OF OFFENCE:
Place: Gurgaon Sushil Kumar Sethi Abhay Raj Singh
Date: 30th May, 2018 Managing Director Company Secretary

SPML Infra Limited Annual Report 2017-1868
ANNEXURE – 5AInformation pursuant to Section 197(12) of the Companies Act, 2013 read with Rule 5(1) of the Companies (Appointment and Remuneration of Managerial Personnel) Rules, 2014
1. Ratio of the remuneration of each Director/KMP to the median remuneration of all the employees of the Company for the financial year:
Median remuneration of all employees of the Company for Financial Year 2017-18 310284The percentage increase in median remuneration of employees in the Financial Year 3.31%The number of permanent employees on the rolls of Company as on 31st March, 2018 740
(` in Lakhs)Name of Director Remuneration
for financial Year
2017-18
Remuneration for financial
Year2016-17
% increase in remuneration
in the Financial Year 2017-18
Ratio of Remuneration
to median remuneration of all
employeesIndependent DirectorsMr. Sarthak Behuria1 – – – –Mr. Prem Singh Rana1 – – – –Mrs. Archana Capoor1 – – – –Dr. Dinesh Kumar Goyal1 – – – –Mr. Sushil Kumar Roongta1 – – – –Nominee DirectorsMr. Supriyo Kumar Chaudhuri1 – – – –Non–Executive DirectorsMr. Deepak Sethi – – – –Executive Directors/KMPMr. Subhash Chand Sethi 113.14 75.60 49.66 –Mr. Sushil Kumar Sethi 119.14 76.80 55.13 –Mr. Rishabh Sethi2 – 17.18 – –Mr. Lalit Kumar Khetan2 – 25.34 – –Mr. Abhay Raj Singh 24.16 24.16 – –Mr. Sujit Jhunjhuwala3 22.72 – – –1 Except sitting fees there was no remuneration or commission was paid to Independent Directors and Nominee Director.2 Mr. Rishabh Sethi Executive Director and Mr. Lalit Kumar Khetan CFO has resigned during the FY2016-17.3 Mr. Sujit Jhunjhunwala was appointed on 19th May, 2017.
2. The percentage of increase in the remuneration of each Directors, Chief Financial Officer, Chief Executive Officer, Company Secretary or Manager if any in the Financial year:
3. During the financial year 2017-18 the median remuneration of all the employees was increase by 3.31%. The total remuneration of the KMPs for the financial year 2017-18 was `279.16 lakhs as against `219.08 lakhs in the previous year. The percentage of increase in the remuneration during the financial year 2017-18 to Mr. Subhash Chand Sethi, Chairman & Whole Time Director and Mr. Sushil Kumar Sethi, Managing Director was 49.66% and 55.13% respectively, whereas there is no change in the remuneration to other KMP during the financial year 2017-18.
4. Remuneration is as per the remuneration policy of the Company.

69Statutoryreports
Corporate Overview
Financial statements
ANNEXURE – 5BStatement of Disclosure pursuant to Section 197 of the Companies Act, 2013, read with Rule 5(2)
of the Companies (Appointment and Remuneration of Managerial Personnel) Rules, 2014
Notes:i. The nature of employment in all cases is contractualii. As on 31st March, 2018 none of the employee held any equity shares in the Company as cited in Clause (iii) of Rule 5(2)iii. Except Mr. Abhinandan Sethi, son of Mr. Subhash Chand Sethi, Wholetime Director of the Company none of the employees
mentioned above is a relative of any Director or manager of the Company
1. Names of top ten employees in terms of remuneration drawn during the Financial Year 2017-18Sl No
Name Designation Remuneration Qualification Experience Date of Commencement of Employment
Age Last Employment
1 Amitava Basu Executive Vice President- Projects
5,587,575 M Tech - Electrical
27.7 01.08.1995 53 Consolidated Energy Consultant Limited
2 Abhinandan Sethi Chief Operating Officer 4,940,000 BBA 6.3 01.12.2011 30 SPML Infra Limited
3 Ganpathi Hedge Vice President- Projects 4,651,560 Diploma in Business Administration
28 01.01.2017 52 Business india Group
4 Malay Kanti Chakraborti
Vice President 3,929,858 DCE 28.6 02.06.1998 49 Batliboi Limited
5 Gaddam Govardhan
Vice President- Corporate
3,113,890 MBA-MKTG/PGDMM
30.3 16.04.2014 55 Mac Donald Private Limited
6 D P Mukherjee Vice President- Projects 2,603,971 DCE 30.6 18.12.1991 55 Enertek Engineering
7 Visveshwaraiah O General Manager- Projects
2,507,120 ME- Structures 28 04.07.1994 50 Balaji construction
8 Manjunathan Swamy JR
General Manager- Projects
2,507,120 MBA Power Mgt/PGDPM
28 14.10.1998 50 Fooress Engg
9 Dinesh Kumar General Manager- Projects
2,435,108 DCE 24 21.01.2008 46 Larsen & Turbo
10 Sisir Kumar Saha Vice President- Projects 2,417,472 BE- Civil 37 07.12.2016 61 NPCC Limited
2. Name of the employees who are in receipt of aggregate remuneration not less than Rupees One Crore and Two Lakh during the financial Year 2017-18
3. Name of the employees who are in receipt of aggregate remuneration not less than Rupees Eight lakh and Fifty Thousand employed during the part of the financial Year 2017-18
Name Age(Years)
Designation/Nature of
Duties
Gross Remuneration
(`)
Qualifications Experience (Years)
Date of Commencement of Employment
Previous Employment/Position Held
(1) (2) (3) (4) (5) (6) (7) (8)
None
Name Age(Years)
Designation/Nature of
Duties
Gross Remuneration
(`)
Qualifications Experience (Years)
Date of Commencement of Employment
Previous Employment/Position Held
(1) (2) (3) (4) (5) (6) (7) (8)
None
On behalf of the Board
Place: Gurgaon Subhash Chand SethiDate: 30th May, 2018 Chairman

SPML Infra Limited Annual Report 2017-1870
On behalf of the Board
Place: Gurgaon Subhash Chand SethiDate: 30th May, 2018 Chairman
ANNEXURE – 6Additional information pursuant to Section 134(3)(m) of the Companies Act, 2013
read with Rule 8 of Companies (Accounts) Rule, 2014.
A. CONSERVATION OF ENERGYa) Steps taken or impact on conservation of energy In Infrastructure industry, most of the equipment are powered by either electrical motor or by fuel oil powered engines.
Since most of the work is carried out in remote locations and is subjected to harsh environmental conditions, the rate of depreciation and abnormal wear and tear is very high. The scope of energy efficiency in our industry will be energy conservation through well planned actions such as quality preventive maintenance, machinery up gradation, modernization and introduction of sophisticated control system.
The Company is using modern fuel efficient machinery, wherever possible, which consumes less time to do a work thereby reducing i) Electric energy & ii) Fuel Oil consumption. The Company has formalized strategies to reduce idle running of machinery, thereby reducing wastage of energy and Fuel Oil consumption.
The Company has been able to reduce electrical energy and fuel oil consumption. Though it is not possible to quantify the impact, the measures are expected to result in considerable savings.
b) Steps taken by the Company for utilizing alternate sources of energy The Company installed Solar Power Generation Plant on the roof of its Corporate Office at Gurgaon. The Plant is generating
21 KW of electricity for the internal use of the Company and helps to save more than 27,000 units of electricity per year.
c) Capital investment on energy conservation equipment The Management of the Company continuously upgrades and/or replaces old machinery with new fuel efficient machinery
as and when required.
B. Technology Absorptioni) The Company has adapted state of the art technology, available in the Industry of operation of the Company to derive cost
and efficiency benefits.
ii) Expenditure incurred on Research & Development (R & D)- NIL
C. Foreign Exchange Earnings and Outgo (` in Lakhs)Particulars 2017-18 2016-17Earnings in Foreign Exchange – 1,062.44Value of imports (CIF Value) – 1,618.81Expenditure in Foreign Exchange 8.67 21.31

71Statutoryreports
Corporate Overview
Financial statements
MANAGEMENT DISCUSSION AND ANALYSIS
SPML Infra LimitedSPML Infra Limited is engaged in the business of construction and maintenance of water connections (mains and lines), water reservoirs, including irrigation systems (dams and canals), construction and repair of sewer systems (treatment plants and pumping stations), construction and maintenance of power plants and construction, erection and maintenance of power distribution and transmission lines. The Company enjoys a palpable presence in lucrative segments such as construction (execution of turnkey projects), hydro power, waste management (collection, segregation and transportation to landfill sites) as well as smart city development and utility management.
Global economic overviewIn 2017, a decade after the global economy spiralled into a meltdown, a revival became visible. Every major economy expanded and a growth wave created jobs. This reality was marked by ongoing Euro-zone growth, modest growth in Japan, late revival in China and improving realities in Russia and Brazil leading to an estimated 3.7% global economic growth in 2017, some 60 bps higher than the previous year.
Crude oil prices increased in 2017, the prices at the beginning of the year bring $54.13 per barrel, declining to a low of $46.78 per barrel in June 2017 and closing the year at $61.02 per barrel, the highest since 2013.
Global economic growth for 6 years
Year 2014 2015 2016 2017 (e) 2018 (f) 2019 (f)Real GDP Growth (%) 3.5 3.2 3.1 3.7 3.9 3.0
[Source: World Economic Outlook, January 2018] e: estimated f: forecasted
A review of the various national economies is provided below:
The US: The world’s largest economy entered its ninth straight year of growth in 2017 (2.3% compared to 1.6% in 2016) catalysed by the spillover arising out of government spending by the previous administration coupled with US$1.5 trillion worth of tax cuts stimulating investments. Private consumption continued to grow at a robust pace from 1.5% in 2016 to 2.2% in 2017.

SPML Infra Limited Annual Report 2017-1872
Euro zone: This region experienced the upside arising out of cheap money provided by the central bank. In 2017, Euro zone is estimated to grow 2.4% compared with 1.8% in 2016, the broad-based growth visible in all Euro-zone economies and sectors.
China: The Chinese economy grew faster than expected in the fourth quarter (October to December) of 2017 at 6.8%, aided by a recovery in exports. This helped China celebrate its first annual growth in seven years. For the full year, China’s growth is estimated at 6.9%, its highest since 2010. Private firm investments grew at 6% in 2017 from 3.2% in 2016. Disposable income growth picked up to 7.3% in 2017 from 6.3% in 2016. Consumption should outpace investment and demand for services could remain strong (52% of economic output). China’s exports rose 6.9% from the previous year to $188.98 billion in October 2017.
Emerging Asia: Emerging Asia GDP is estimated at 6.5% in 2017. Cambodia, Laos and Myanmar are projected to grow the fastest in the ASEAN, while Philippines and Vietnam are expected to lead growth in ASEAN-5 (Indonesia, Malaysia, Philippines, Thailand and Vietnam). The region is being driven by infrastructure spending and stable economies.
GCC: GCC countries were affected by the oil price decline (~60% since 2013), resulting in macro-economic instability that affected job creation and growth. GDP growth remained subdued at 1.8% in 2017 despite efforts to boost the non-oil private sector economy. Regional growth is projected to increase steadily after 2017, to 3% in 2018 and 3.2% by 2020, following acceleration among oil exporters and importers, moderated geopolitical tension and rise in oil prices.
Russia: The economy appeared to have exited a two-year recession that, thanks to the authorities’ effective policy response and existence of robust buffers, proved shallower-than-past downturns. In 2017, Russia was estimated to grow 1.9% following negative growth of 0.6% in 2016 (WEO) and a projected GDP growth of 1.8% in 2018.
Brazil: In 2017, Brazil grew at 1.1% following a deceleration of 3.5% in 2016. The recovery in the GDP was boosted mainly by the agricultural sector which grew by 13%. According to the Brazilian Institute of Geography and Statistics (IBGE), a decline in inflation (inflation was 3.5% in 2017 as compared to 8.7% in 2016) also contributed to economic growth.
OutlookThe outlook for advanced economies improved, notably for the Euro area, but in many countries inflation remained weak, indicating that slack was yet to be eliminated, and prospects for growth in GDP per capita were held back by weak productivity growth and rising old-age dependency ratios. Global growth forecasts for 2018 and 2019 were revised upward by 20 bps to 3.9%, reflecting improved momentum and the impact of tax policy changes in the US.
Indian economic overviewAfter registering a GDP growth of over 7% for the third year in succession in 2016-17, the Indian economy headed for somewhat slower growth, estimated to be 6.7% in 2017-18 while world GDP growth was 3.8% during the year (WEO, April 2018). Even with this lower growth for 2017-18, GDP growth averaged 7.3% for the period from 2014-15 to 2017-18, the highest among the major economies. This was achieved on the back of lower inflation, an improved current account balance and a reduction in fiscal deficit-to-GDP ratio. The year under review was marked by various structural reforms being undertaken by the Central Government. In addition to GST introduction, the year witnessed significant steps towards resolution of problems associated with NPA levels, FDI liberalisation and bank recapitalisation. (Source: CSO, Economic Survey 2017-18).
FY 2017-18 versus FY 2016-17
2017-18* 2016-17
GDP growth 6.7% 7.1%
GVA growth 6.5% 7.1%
Farm growth 3.4% 6.3%
Manufacturing growth 5.7% 7.9%
Power and Gas growth 7.2% 9.2%
Mining growth 2.9% 13%
Construction growth 5.7% 1.3%
Trade, hotel, transport, telecom growth
8% 7.2%
Financials, realty growth 6.6% 6%
Public, admin, Defence growth 10.1% 10.7%
Per capita income growth 8.6% 9.7%
*Estimated(Source: Press Information Bureau)

73Statutoryreports
Corporate Overview
Financial statements
73
Key government initiativesWorld Economic Forum’s Global Competitiveness Report 2017 ranked India at an impressive 23 in the Global Competitiveness Index from 39 in 2016. Demonetisation dampened short-term growth, but could prove beneficial across the long-term.
Some government initiatives comprised:Bank recapitalisation scheme: The Central Government announced capital infusion of ̀ 2.1 lakh crores in public sector banks.
Expanding road network: The Government of India announced a `6.9 lakh crores investment to construct 83,677 kilometres of roads across five years.
Improving ecosystem: The country was ranked at the hundredth position, an improvement of 30 places in the World Bank’s Ease of Doing Business 2017 report, a result of the Central Government’s pro-reform agenda, comprising measures like the passing of Insolvency and Bankruptcy Code, simplifying tax computation and merging applications for PAN and TAN. In addition, Aadhaar-based identification approach could streamline the regulatory regime. Goods and Services Tax: The Government of India launched GST in July 2017, with the vision of creating a unified market. Under this regime, various goods and services would be taxed as per five slabs (28%, 18%, 12%, 5% and zero tax).
Foreign Direct Investment: Foreign direct investment
increased from approximately USD 24 billion in FY12 to
approximately USD 60 billion in FY17, an all-time high.
Coal mining opened for private sector: Ending state monopoly,
the government opened coal mining to private sector firms
for commercial use, the most ambitious sectoral reform
since nationalization in 1973. Coal accounts for around 70%
of the country’s power generation, and the move for energy
security through assured coal supply is expected to attract
major players, enhance sectoral efficiency, widen competition,
increase competitiveness and induct best technologies.
Doubling farm incomes: The government initiated a seven-
point action plan to double farm incomes by 2022.
Outlook
World Bank projected India’s economic growth to accelerate
to 7.3% in 2018-19 and 7.5% in 2019-20. Strong private
consumption and services are expected to continue to
support economic activity. Private investment is expected to
revive as soon as the corporate sector adjusts to the GST. The
recapitalisation package for public sector banks announced
by the Government of India is expected to resolve banking
sector Balance Sheets, enhance credit availability and spur
investment.
Trinity at work for EPC projectsPotential
triggerIncome
statementImpact of the
trigger
Increased order awards
Lowest interest rates
Low competition
Cumulative impact
Request topline growth
Lowest interest expense
Margin expansion
Margin expansion
Revenue
Interest expenses
EBITDA margins
Net profit
Operating Expenses EBIDTA
Tax
Depreciation
The rising demand of EPC projectsThe Indian EPC market is growing at a healthy rate after the slowdown during 2008-14 at 4.8% from the earlier rate of over 10% during 2005-07. Given the massive investment planned by the Central Government, it is forecasted that the EPC market in India will grow at a CAGR of 20.26% over the period of 2014-19.

SPML Infra Limited Annual Report 2017-1874
Infrastructure sector in IndiaInfrastructure is a key driver of the overall development of Indian economy. This sector focuses on major infrastructure sectors such as water, power, roads and bridges, dams and urban infrastructure. The dynamics of infrastructure development has evolved with time. As China built its economy on the back of robust infrastructural development, India is on its way to the same route. The development activities have gathered pace coupled with the thrust by government that can be seen through various initiatives like ‘Housing for All’, ‘Smart Cities’, AMRUT, increased budgetary spending, among others. The changing infrastructure landscape in India has generated significant interest from international investors. FDI received in Construction Development sector (townships, housing, built up infrastructure and construction development projects) from April 2000 to December 2017 stood at US$ 24.67 billion; and in construction (infrastructure) activities stood at US$ 12.36 billion.
OutlookSectors like power transmission, roads & highways and renewable energy will drive the investments in the coming years. New models of infrastructural development such as HAM will be beneficial by bringing together both private and public participants. India has a requirement of investment worth `50 trillion (US$ 777.73 billion) in infrastructure by 2022 to have sustainable development in the country. Thus, the speed of infrastructural development needs to be amped up for bridging the demand-supply gap.
Governmental initiativesPradhan Mantri Awas Yojana (PMAY): The government had set a target of constructing 50 million new housing units by 2022 through the PMAY, of which 30 million units are likely to be constructed in rural areas, and the rest in urban areas. As an immediate target, the PMAY-Gramin aims to cover 10 million new houses by FY19, of which five million was supposed to be completed by March 2018. The PMAY-Urban had set a target for completion of 1.2 million houses in FY2018-19. A significant increase in the planned spending under the PMAY, from `29,043 crores in FY18 to `64,500 crores in FY19, will result in pick-up in execution since funding availability was a constraint in the past.
Smart Cities Mission: Launched in 2015, it aims to create 100
smart cities, improve the quality of life for urban residents and
steer India’s rapid urbanisation. It proposes to do this by using
technology and data-driven solutions to promote investment
and growth in cities. With India’s urban population expected
to reach 600 million by 2031, an increase of nearly 40 per cent
from 2011, urban development is key to ensure a smooth
transition to a predominantly urban economy.
Atal Mission for Rejuvenation and Urban Transformation
(AMRUT): It is an urban transformation scheme with the
focus of the urban renewal projects to establish infrastructure
that could ensure adequate robust sewerage networks and
water supply.
Budgetary allocation: In the Union Budget 2018-19, the
Government of India has given a massive push to the
infrastructure sector by allocating `5.97 lakh crores (US$
92.22 billion) for the sector which is significantly up from
C4.94 lakh crores in 2017-18.
Bharatmala: ~60,000 kilometres is planned to be built under
Bharatmala. In Phase-I, 34,800 kilometres will be built at the
cost of `5.35 lakh crores. The remaining 25,200 kilometres
would be taken up in Phase-II. Phase-I will be completed by
2022 and the awarding of projects should be done before 2019.
“There has been an unprecedented three-fold hike in infrastructure lending since 2014. For the next financial year, the estimated budgetary and extra-budgetary expenditure on infrastructure has been increased to `5.97 lakh crores.”
– Nitin Gadkari, Minister of Road Transport and Highways

75Statutoryreports
Corporate Overview
Financial statements
Growth drivers Policy boost: The Central Government is making an attempt
to revive and give boost to PPPs to make India a global hub for electronics manufacturing. A provision of US$115.62 million in 2017-18 in incentive schemes like M-SIPS and EDF has been announced. Total allocation for infrastructure in the Union Budget 2018-19 stood at `5.97 lakh crores (US$ 92.22 billion). In November 2017, the logistics sector was brought under the ambit of infrastructure so as to boost investment inflow.
Growing urbanisation: India will need to construct 43,000 houses every day until 2022 to achieve the vision of Housing for All by 2022. Hundreds of new cities need to be developed over the next decade. This has the potential for catapulting India to third-largest construction market globally. The sector is expected to contribute 15% to the Indian economy by 2030. Recent policy reforms such as the RERA, GST and REITs are expected to strengthen the real estate and construction sectors.
Swachh Bharat Mission: Since 2014, a total of `33,700 crores has been allocated to Swachh Bharat Mission. Till date more than 3.45 lakh villages have become open defecation-free and the Central Government aims to construct 12 crores toilets by 2019 of which more than 6.7 crores toilets have already been built.
Roads and highways: The budgetary allocation for highway construction in 2018 budget amounted to `71,000 crores as compared to `61,000 crores in during FY2017-18. The Central Government expects a 10% jump in a single year to nearly 1 lakh kilometres of highways by end-2018.
FDI impetus: India needs $4.5 trillion by 2040 for developing its infrastructure. Given the fact that such a huge amount cannot be financed internally, the Government of India has allowed 100%-FDI through the automatic route in areas like urban transport, water supply and sewage treatment (subject to relevant rules and regulations).
Scheme for sustainable structuring of stressed assetsThe S4A Scheme aims at deep financial restructuring of highly debt laden projects by allowing lender (bank) to acquire equity of the stressed project. The scheme makes financial restructuring of large projects and at the same time
helping the lender’s ability to deal with such stressed assets. It is intended to restore the flow of credit to critical sectors including infrastructure. Following are the main features of the scheme:
For an account to be eligible for restructuring under the S4A Scheme, the total loans by all institutional lenders in the account should exceed `500 crores (including rupee loans, foreign currency loans/external commercial borrowings).
The lending bank should hire an independent agency to evaluate how much of the debt is ‘sustainable’ and the project should have started its commercial operations and there should be cash flows from the project.
The scheme allows banks to take equity participation in the stressed project. The major feature of the scheme is that it envisages determination of the sustainable debt level for a stressed borrower. Loans will be divided into sustainable and unsustainable components.
A Techno-economic viability (TEV) study by the empaneled TEV consultants of bank/ Joint Lenders Forum/consortium of lenders should assess the debt level as sustainable. A sustainable debt is the one where the principal value of all debts owed to institutional lenders can be repaid if the future cash flows (return from the project) remain at their current level. For the scheme to apply, sustainable debt should not be less than 50 percent of all debts.
The scheme allows banks to rework stressed loans under the oversight of an external agency. The undue part gets converted into long tenure instruments like debentures, preference shares, bonds etc.
In context of SPML InfraPursuant to the implementation of the said scheme, out of total debt of `1,117 crores, a sum of `545.35 crores has been converted into Optionally Convertible Debentures (OCDs) with a tenure of 10 years (2027) carrying a coupon @0.01% p.a. with yield to maturity (YTM) of 8.15% p.a. However, in the first 5 years only the said coupon of 0.01% p.a. will be paid and the payment of the effective YTM for the said 5 years will commence from the 6th year till 10th year. The payment of OCDs shall be in 20 quarterly installments starting from quarter ending December, 2022 and ending on the quarter ending September, 2027.
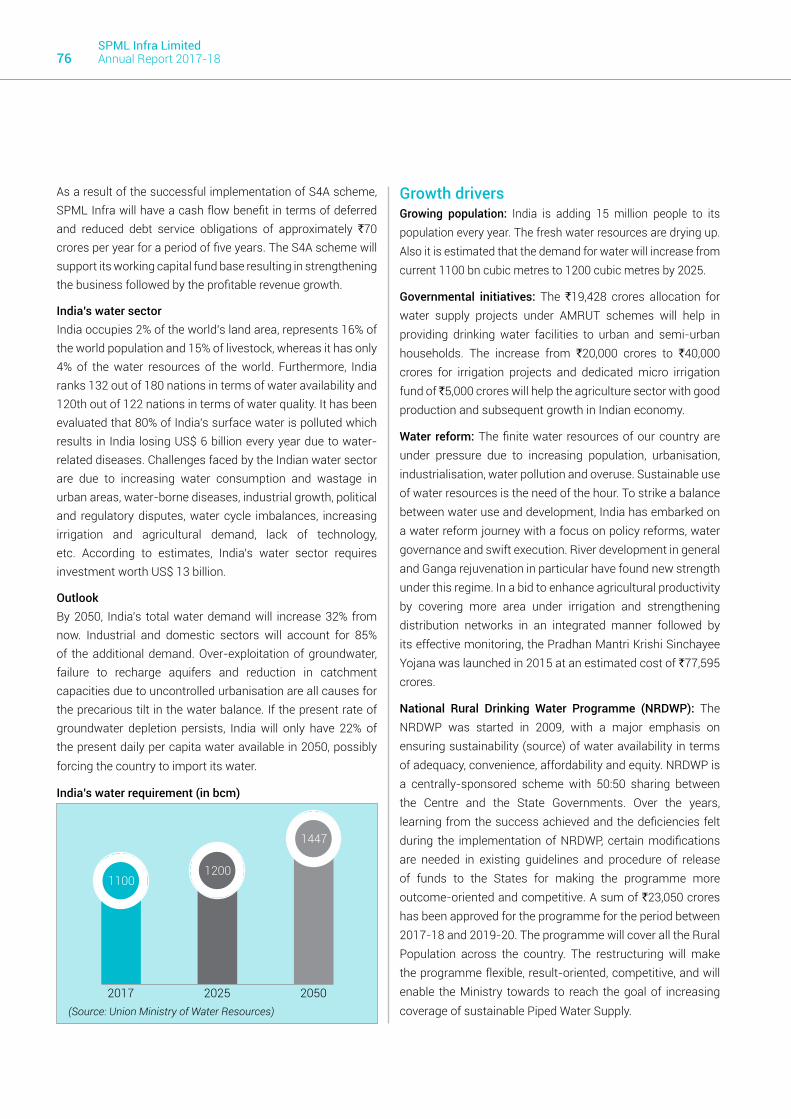
SPML Infra Limited Annual Report 2017-1876
As a result of the successful implementation of S4A scheme, SPML Infra will have a cash flow benefit in terms of deferred and reduced debt service obligations of approximately `70 crores per year for a period of five years. The S4A scheme will support its working capital fund base resulting in strengthening the business followed by the profitable revenue growth.
India’s water sectorIndia occupies 2% of the world’s land area, represents 16% of the world population and 15% of livestock, whereas it has only 4% of the water resources of the world. Furthermore, India ranks 132 out of 180 nations in terms of water availability and 120th out of 122 nations in terms of water quality. It has been evaluated that 80% of India’s surface water is polluted which results in India losing US$ 6 billion every year due to water-related diseases. Challenges faced by the Indian water sector are due to increasing water consumption and wastage in urban areas, water-borne diseases, industrial growth, political and regulatory disputes, water cycle imbalances, increasing irrigation and agricultural demand, lack of technology, etc. According to estimates, India’s water sector requires investment worth US$ 13 billion.
OutlookBy 2050, India’s total water demand will increase 32% from now. Industrial and domestic sectors will account for 85% of the additional demand. Over-exploitation of groundwater, failure to recharge aquifers and reduction in catchment capacities due to uncontrolled urbanisation are all causes for the precarious tilt in the water balance. If the present rate of groundwater depletion persists, India will only have 22% of the present daily per capita water available in 2050, possibly forcing the country to import its water.
India’s water requirement (in bcm)
Growth drivers Growing population: India is adding 15 million people to its population every year. The fresh water resources are drying up. Also it is estimated that the demand for water will increase from current 1100 bn cubic metres to 1200 cubic metres by 2025.
Governmental initiatives: The `19,428 crores allocation for water supply projects under AMRUT schemes will help in providing drinking water facilities to urban and semi-urban households. The increase from `20,000 crores to `40,000 crores for irrigation projects and dedicated micro irrigation fund of ̀ 5,000 crores will help the agriculture sector with good production and subsequent growth in Indian economy.
Water reform: The finite water resources of our country are under pressure due to increasing population, urbanisation, industrialisation, water pollution and overuse. Sustainable use of water resources is the need of the hour. To strike a balance between water use and development, India has embarked on a water reform journey with a focus on policy reforms, water governance and swift execution. River development in general and Ganga rejuvenation in particular have found new strength under this regime. In a bid to enhance agricultural productivity by covering more area under irrigation and strengthening distribution networks in an integrated manner followed by its effective monitoring, the Pradhan Mantri Krishi Sinchayee Yojana was launched in 2015 at an estimated cost of `77,595 crores.
National Rural Drinking Water Programme (NRDWP): The NRDWP was started in 2009, with a major emphasis on ensuring sustainability (source) of water availability in terms of adequacy, convenience, affordability and equity. NRDWP is a centrally-sponsored scheme with 50:50 sharing between the Centre and the State Governments. Over the years, learning from the success achieved and the deficiencies felt during the implementation of NRDWP, certain modifications are needed in existing guidelines and procedure of release of funds to the States for making the programme more outcome-oriented and competitive. A sum of `23,050 crores has been approved for the programme for the period between 2017-18 and 2019-20. The programme will cover all the Rural Population across the country. The restructuring will make the programme flexible, result-oriented, competitive, and will enable the Ministry towards to reach the goal of increasing coverage of sustainable Piped Water Supply.(Source: Union Ministry of Water Resources)
2017 2025 2050
2017
11001200
1447

77Statutoryreports
Corporate Overview
Financial statements
Challenges Regional disparities: The availability of water in India is
not equal in all regions and disparity is evident across the country due to uneven rainfall. Most part of the country including our large cities like Mumbai and Chennai depends on rainfall for their water supplies. The demand supply gap is evident in Chennai where the available water from water sources such as lakes and reservoirs are below 40% of the city’s daily requirements. India’s north-western region widely considered to be the country’s granary, with states such as Punjab and Haryana accounting for a large share of the country’s agricultural output. But farming in both these state is increasingly becoming unsustainable, owing to depleting groundwater levels and erratic rainfall conditions. The situation is equally precarious in the South Eastern parts of the country.
Inefficient usage: Agriculture sector which consumes a major part of available water has inefficient usage pattern. Irrigation efficiency in India stood at 36% in the 90s and projected to increase to ~60% by 2050 to strike a balance in terms of demand and supply. An International Water Management Institute report suggests that 50% increase in demand of water by 2025 can be met by increasing the effectiveness of irrigation only.
Unaccounted-for-water: Unaccounted-for-water or non-revenue water is quite high in Indian cities due to several reasons including old water infrastructure, poor maintenance, illegal connections, leakage, and lack of proper mapping of distribution system. In many cities, the unaccounted water is more than 60%. Even the pumping system is not efficient and loses good amount of water during pumping. If water utilities can improve the pumping efficiency by even 25%, it will help increasing water supply to more areas from within the available water.
Pollution and contamination: The Central Pollution Control Board has listed 18 major rivers in India as unfit for any domestic and industrial water usage. The water sources are mainly contaminated in and around of Indian cities, towns and other urban settlements. Heavy metals and geogenic contamination including salinity, iron, fluoride and arsenic have affected groundwater reserves in over 240 districts. Groundwater contamination with chemicals is another big health hazard.
Way forward Modify the National Water Policy to emphasise reuse of
treated wastewater and reduce groundwater usage. This is especially relevant for sectors like agriculture and industrial that together consume >90% of freshwater.
Expand funding for water source development, sewerage networks and sewage treatment plants under dedicated schemes and budgetary allocations.
Increase technical and financial assistance to water utilities and municipal corporations to award and manage PPPs for both water supply and wastewater treatment and reuse projects.
Increase support and technical assistance to water utilities and municipal corporations for taking up projects for loss reduction, improvement in non-revenue-water and groundwater recharge projects.
Create a national regulatory framework and institution to oversee the management of water resources, state and project disputes and pricing of water on a pan-India basis
Upgrade planning capacity in water utilities and municipalities by increasing or engaging town planners, sanitation experts and environmental engineers to develop plans for sustainable water supply management and expanding sewage collection and treatment networks
Raise awareness among farmers to adopt drip irrigation.
Improve water governance system based on participation of the public and the private sectors.
Undertake capacity-building programmes with an integrated approach for predictive and preventive maintenance of aquifers, underground resources and water infrastructures across the country.
India’s power sectorElectricity demand in the country has increased rapidly and is expected to rise further in the years to come. India ranks third among 40 countries in EY’s Renewable Energy Country Attractiveness Index, on back of strong focus by the Central Government on promoting renewable energy and implementation of projects in a time bound manner. India has moved up 73 spots to rank 26th in the World Bank’s list of

SPML Infra Limited Annual Report 2017-1878
electricity accessibility in 2017. Total installed capacity of power stations in India stood at 344,002.39 megawatts as on 31st March, 2018. The Ministry of Power has set a target of 1,229.4 billion units of electricity to be generated during FY2017-18, 50 billion units higher than the target for FY2016-17.
OutlookThe Government of India’s focus on attaining power for all has accelerated capacity addition in the country. The Government of India has released its roadmap to achieve a capacity of 175 gigawatts in renewable energy by 2022, which includes 100 gigawatts of solar power and 60 gigawatts of wind power. The Union Government of India is preparing a ‘rent-a-roof’ policy for supporting its target of generating 40 gigawatts of power through solar rooftop projects by 2022. Coal-based power generation capacity in India currently stands at 197 gigawatts and is expected to reach 330-441 gigawatts by 2040.
Governmental initiatives Budgetary support: Union Budget 2018-19 has allocated
`16,000 crores for the Sahaj Bijli Har Ghar Yojana for ensuring last-mile connectivity to rural households, `3,800 crores for Deendayal Upadhayaya Gram Jyoti Yojna, `4,900 crores for Integrated Power Development Scheme and `4,200 crores for capacity addition in wind power, solar power and green energy corridor project.
Power to the people: Implementation of a new scheme Ujwal Discom Assurance Yojana which would enable electrification for all villages by reducing losses through programmes that involve public participation. The Union Budget 2018-19 has allocated `3,800 crores towards the Deen Dayal Upadhyay Gram Jyoti Yojana and `4,900 crores (756.87 million) towards the Integrated Power Development Scheme.
Ujwal Discoms Assurance Yojana (UDAY): In 2017, India Ratings and Research (Ind-Ra) assigned UP Power Corporation’s proposed US$ 1.48 billion bond a provisional ‘IND AA(SO)’ rating. This makes it India’s first State Government revenue-supported-bond. The Government of India has signed four MoUs with the state of Nagaland and the union territories of Andaman & Nicobar Islands, Dadra & Nagar Haveli and Daman & Diu under UDAY to improve operational efficiency of electricity departments in these places.
Deendayal Upadhyaya Gram Jyoti Yojana (DDUGJY): Under this scheme, capital subsidy is being provided for feeder separation, electrification of un-electrified villages and households, metering and system strengthening and augmentation of distribution system in rural areas. The erstwhile Rajiv Gandhi Grameen Vidyutikaran Yojana was subsumed in this scheme along with funds worth `40,000 crores was carried forward to the new scheme. With a view to track the progress of this scheme and ensure transparency in the implementation of rural electrification, power ministry has launched an app, GARV-II to provide real-time data of all six lakh villages of the country.
Unnat Jyoti by Affordable Lighting for All (UJALA): The scheme was launched in January 2015 with a target of replacing 77 crores inefficient bulbs with energy-efficient LED bulbs. The main objective of the scheme is to promote efficient lighting, enhance awareness on using efficient equipment which reduce electricity bills and preserve environment. Its purpose is not only to help reduce electricity bills of consumers but also contribute to energy security of India. Currently, over 30 crores LED bulbs, 66 lakh LED tube lights and 19 lakh energy-efficient fans have already been distributed across 25 states and seven union territories.
Integrated Power Development Scheme (IPDS): The scheme was launched by the Central Government with an outlay of `44,011 crores. All discoms including private discoms and state power departments are eligible to get financial assistance under the scheme as per plan to strengthen their infrastructure works. The projects supported under this scheme need to be completed within 24 months. By September 2017, the Power Ministry has already sanctioned `26,731 crores under the scheme for system strengthening and IT enablement across 3,606 towns in 32 states and union territories.
Pradhan Mantri Sahaj Bijli Har Ghar Yojana: With an aim to provide electricity to all families with provision for free electricity connection to poor families, this scheme will cover 30 million households, 25 million in rural areas and 5 million in urban areas. There is no upfront allocation of funds under the scheme. The electrification works under the sanctioned projects shall be executed by respective distribution companies as per the laid down norms

79Statutoryreports
Corporate Overview
Financial statements
Green Energy Corridor Project: Under the Union Budget
2018-19, the Government of India has allocated `4,200
crores to the increase capacity of the Green Energy Corridor
Project along with other wind and solar power projects.
National Tariff Policy (2016): The National Tariff Policy
for Electricity was amended by the Union Government in
January, 2016, and aims to achieve the objectives of UDAY
scheme. In order to promote use of renewable energy, solar
renewable purchase obligations will be increased to 8% by
2022
Coal mining auction: The Cabinet Committee on Economic
Affairs has approved commercial coal mining for private
sector and the methodology of allocating coal mines via
auction and allotment, thereby prioritising transparency,
ease-of-doing-business and ensuring the use of natural
resources for national development
Rent-a-roof policy: The Union Government of India is
preparing a ‘rent-a-roof’ policy for supporting its target of
generating 40 gigawatts of power through solar rooftop
projects by 2022.
Growth drivers
Rising power demand: With increasing population, the
housing requirement is on rise as well and India’s power
demand is expected to rise up to 1,905 terawatt-hours by
FY22. (Source: IIFL)
Governmental emphasis: The Central Government has
undertaken several initiatives to bring electricity to all
homes in India and the Union Budget reiterated that 100%
electrification of villages will be completed by May 2018.
Favourable policy environment: 100%-FDI allowed under
the automatic route in the power segment and renewable
energy will enhance the investment in the Indian power
sector. (Source: IBEF)
Smart Cities: In 2016, the Indian Government announced
a list of 20 cities to be developed into Smart Cities. It has
already been mandated that 10% of the energy requirement
would come from solar energy and at least 80% of the
buildings will be energy-efficient and ‘green’. With a plan to
develop ~100 such cities in the works, the rate of renewable
energy usage is all set only increase.
Financial reviewSales and other incomeRevenue during the year stood at `1411.71 crores, decreased by 19.03% as compared to `1743.58 crores in FY2016-17.
Interest and finance costsNet interest and finance costs decreased by 4.82% during the year due to restructuring of debts under S & A Scheme.
Profit before taxThe Company registered a profit before tax of `54.96 crores compared to `(1.49) crores in the previous year.
Profit after taxThe Company registered a profit after tax of `43.12 crores compared to `1.45 crores in the previous year.
Key ratios
Particulars 2017-18 2016-17EBIDTA/Turnover 0.19 0.13EBIDTA/Net interest 1.32 1.04Debt-equity ratio 2.91 2.35Return on equity (%) 9.90 0.37Book value per share (C) 118.70 106.75Earnings per share (C) 11.76 0.39
Revised Debt Maturity Profile of the CompanyPursuant to the implementation of SPML S4A Scheme, the
revised Debt Maturity Profile of the Company stands as under:
` in croresFY Term
LoanCorporate
LoanOCDs * Total
2018-2019 4.46 11.51 – 15.972019-2020 4.69 11.51 – 16.202020-2021 4.38 12.60 – 16.982021-2022 – 10.72 – 10.722022-2023 – 3.25 32.75 36.002023-2024 – – 65.50 65.502024-2025 – – 65.50 65.502025-2026 – – 65.50 65.502026-2027 – – 65.50 65.502027-2028 – – 250.60 250.60Total 13.53 49.59 545.35 608.47
* OCD also carry Yield-to-Maturity (YTM) of 8.15% compounded quarterly which are repayable along with above principal redemption amount.

SPML Infra Limited Annual Report 2017-1880
Risk managementPre-bidding stage risk: Inability to qualify for projects can affect the business
Mitigation strategy: The Company’s rich experience of more than three decades enables it to proactively take decisions and its success in bidding and completing high value projects coupled with increasing net worth validates its pre-bidding qualification.
Project execution risk: Inability to complete the project within the established time frame
Mitigation strategy: The Company has successfully completed most of its projects in time on the back of rich technological and human resource. The projects are timely evaluated with the estimates and deviations if any are effectively dealt with.
Operational risk: People constraints may affect operational robustness.
Mitigation strategy: The Company’s work culture plays an important part in people retention. The retention rate stood at 83% in FY18. The Company also has implemented Success Factor that helps in keeping KRAs in place; it also rates the employees on the basis of information fed. This maintains transparency, promotes flat line of communication, reduces delays and helps in identifying the key people behind the success of projects and enhances employee motivation.
Leverage risk: Inability to manage working capital can affect the Company’s reputation.
Mitigation strategy: The Company’s strategy in bidding for Central and State government backed projects ensures that the flow of cash is sustained. The Company’s cash and bank balance for the year ended 31st March, 2018 was `1618.44 lakhs against `3067.52 lakhs in FY17.
Profitability risk: Prolonged realisation can affect the revenue generation of the Company
Mitigation strategy: The Company’s attractive bidding process hedges it towards the risk of compounding receivables and maintains the profitability and cash levels. Also the project mix of the Company helps it in balancing by offsetting the flow of cash.
Internal control systems and their adequacy The internal control and risk management system is structured and applied in accordance with the principles and criteria established in the corporate governance code of the organisation. It is an integral part of the general organisational structure of the Company and Group and involves a range of personnel who act in a coordinated manner while executing their respective responsibilities. The Board of Directors offers its guidance and strategic supervision to the Executive Directors and management, monitoring and support committees. The control and risk committee and the head of the audit department work under the supervision of the Board-appointed Statutory Auditors.
Human resourcesThe Company believes that its intrinsic strength lies in its
dedicated and motivated employees. As such, the Company
provides competitive compensations, an amiable work
environment and acknowledges employee performance
through a planned reward and recognition programme. The
Company aims to create a workplace where every person can
achieve his or her true potential. The Company encourages
individuals to go beyond the scope of their work, undertake
voluntary projects that enable them to learn and devise
innovative ideas.
Cautionary statementThis statement made in this section describes the Company’s
objectives, projections, expectation and estimations which
may be ‘forward looking statements’ within the meaning
of applicable securities laws and regulations. Forward–
looking statements are based on certain assumptions
and expectations of future events. The Company cannot
guarantee that these assumptions and expectations are
accurate or will be realised by the Company. Actual result
could differ materially from those expressed in the statement
or implied due to the influence of external factors which are
beyond the control of the Company. The Company assumes
no responsibility to publicly amend, modify or revise any
forward-looking statements on the basis of any subsequent
development, information or events.

81Statutoryreports
Corporate Overview
Financial statements
REPORT ON CORPORATE GOVERNANCEThe principle of Corporate Governance is based on the belief that effective Corporate Governance practices constitute a strong foundation on which successful commercial enterprises are build and continues to grow. Strong Corporate Governance is indispensable to resilient and vibrant capital market and is therefore, an important tool for investor protection.
Corporate Governance is essentially a system by which Companies are directed and controlled by the management in the best interest of its stakeholders. The management believes that the stakeholders are the true owners of the enterprise and it holds the status of trustees of the stakeholders. Therefore the Company always gives thrust to highest ethical standards in all its dealing in order not only to achieve the objects of the Company but also enhances stakeholder’s value as well as discharge of its social responsibility.a
The Company is committed to achieve good standards of Corporate Governance on a continuous basis to ensure accountability, fairness and transparency in managing the affairs of the Company.
The Board of SPML has defined a set of corporate governance best practices and guidelines to help fulfill our corporate responsibility towards our stakeholders. It further ensures the accountability, fairness and transparency in managing the affairs of the Company for maximizing long-term value of the Company. An internal governance structure with defined roles and responsibility has been placed by the Company.
1. Board of Directors The Board of Directors of the Company is the apex body,
constituted by the Shareholders of the Company to govern the Company in all respect. The Board of Directors of the Company review and monitor corporate strategy and
performances and in order to run the Company in efficient and smooth manner has constituted Seven Committees.
The Board while being accountable to the Company and its shareholders provides strategic guidance to the Company and ensure effective monitoring of the management. The primary role of the Board is that of trusteeship to protect and enhance stakeholder’s value through strategic supervision of the Company.
The Board has the ultimate responsibility of the management, direction and performance of the Company and plays an important role in overseeing how the management serves the objectives and interests of the stakeholders.
Composition SPML maintains an optimum combination of executive
and non-executive directors having depth knowledge of business. All the Directors of the Company play a crucial role in making Board’s decision process effectively.
In terms of Companies Act, 2013 and SEBI (Listing Obligations and Disclosure Requirements) Regulations, 2015 the Board of SPML is the combination of following category of directors:
Executive Directors Mr. Subhash Chand SethiMr. Sushil Kumar Sethi
Non-Executive Director Mr. Deepak SethiIndependent Director Mr. Sarthak Behuria
Mr. Sushil Kumar Roongta Mrs. Archana CapoorMr. Prem Singh Rana Mr. Dinesh Kumar Goyal
Nominee Director Mr. Supriyo Kumar Chaudhuri

SPML Infra Limited Annual Report 2017-1882
The composition of the Board and the membership on other Boards / Committees of Directors is given hereunder:
No. of Directorships and Committee Memberships / Chairmanship
Sl.
No.
Name of the Directors Category Other
Directorship1
Committee
Memberships2
Committee
Chairmanships
1 Mr. Subhash Chand
Sethi
Promoter & Executive Director -
Whole Time Director, Chairman
14 4 Nil
2 Mr. Sushil Kumar Sethi Promoter & Executive Director-
Managing Director
12 Nil Nil
3 Mr. Sarthak Behuria Non- Executive & Independent
Director
9 3 2
4 Mr. Sushil Kumar
Roongta
Non- Executive & Independent
Director
9 4 1
5 Mr. Prem Singh Rana Non- Executive & Independent
Director
7 2 Nil
6 Mrs. Archana Capoor Non- Executive & Independent
Director
13 3 1
7 Mr. Dinesh Kumar
Goyal
Non- Executive & Independent
Director
2 Nil Nil
8 Mr. Supriyo Kumar
Chaudhuri
Nominee Director 2 Nil Nil
9 Mr. Deepak Sethi Promoter & Non- Executive Director 16 3 1
1Excludes the directorships in foreign companies and membership of managing committees of chambers of commerce /
professional bodies.2In accordance with Regulation 26(1)(b) of the SEBI (Listing Obligations and Disclosure Requirements) Regulations, 2015,
Memberships/Chairmanships of only Audit Committees and Stakeholders Relationship Committees in all public limited
companies (including SPML Infra Limited) have been considered. Membership of Committees includes chairmanship, if any.
Notes:
1. None of the Directors except Mr. Subhash Chand Sethi, Mr. Sushil Kumar Sethi and Mr. Deepak Sethi is related to any
Director.
2. During the year, the Company did not have any material pecuniary relationship or transaction with any of the non-
executive director’s. However, Mr. Deepak Sethi being related to the Promoter Directors is interested to the extent of his
shareholding in the Company.
3. During the year, the Company did not have any material pecuniary relationship or transaction with the Independent
Directors other than the payment of fees for attending meetings of the Board and/or its Committee(s).
4. None of the non-executive director serves as independent director in more than seven listed companies and none of the
Executive or Whole-time Directors serve as independent director in not more than three listed companies.

83Statutoryreports
Corporate Overview
Financial statements
Attendance of Directors at Board Meetings and at the last Annual General Meeting:Sl. No.
Name of the Director No of board meetings held during the tenure
of director1
No. of Board Meetings attended
Whether attended the last AGM
1 Mr. Subhash Chand Sethi 8 6 No2 Mr. Sushil Kumar Sethi 8 6 Yes3 Mr. Deepak Sethi 8 1 No4 Mr. Prem Singh Rana 8 6 No5 Mr. Sarthak Behuria 8 5 Yes6 Mrs. Archana Capoor 8 7 No7 Mr. Sushil Kumar Roongta 8 5 No8 Mr. Dinesh Kumar Goyal 8 8 No9 Mr. Supriyo Kumar Chaudhuri 8 7 No
1Excudes the separate meeting of Independent Directors.
MEETING OF INDEPENDENT DIRECTOR In compliance with the provisions of Schedule IV of the Companies Act, 2013 and the rules framed thereunder and in line with
the Regulation 25(3) of the SEBI (Listing Obligations and Disclosure Requirements) Regulations, 2015, a separate meeting of the Independent Directors of the Company was held on 27th March, 2018 without the presence & participation of non-Independent Directors and Members of the Management. Further, the said meeting was attended by all the Independent Directors of the Company.
2. Committees of the Board As on 31st March, 2018, the Board has six Committees for uninterrupted operation of the Company. The committees
have been constituted to focus on the specific areas and make decisions with the delegated authorities. All the decisions and recommendation made by the various Committees are to be placed before the Board for their approval or record. The following Committees have been constituted by the Board: Audit Committee, Stakeholder Relationship Committee, Nomination and Remuneration Committee, Finance Committee, Corporate Social Responsibility Committee and Committee of Directors.
i) Audit Committee Audit Committee has been constituted in conformity with the provisions of Section 177 of the Companies Act, 2013 and
rules framed thereunder and in line with Regulation 18 of the SEBI (Listing Obligations and Disclosure Requirements) Regulations, 2015. The objective of the Committee is to overview the Company’s financial reporting processes, monitor and provide an effective supervision, to ensure accurate and timely disclosures, compliance with legal and statutory requirements, the adequacy of internal control systems, review of related party transaction, functioning of Whistle Blower Mechanism, adequacy of internal audit function etc. within the given time frame.
Composition and Attendance During the financial year 2017-18, there were no changes in the composition of the Audit Committee. The Company
Secretary of the Company acts as the Secretary to the Committee.
During the year under review five Meetings of the Audit Committee has been held on 19th May, 2017, 25th August, 2017, 12th September, 2017, 12th December, 2017 and 14th February, 2018.
Board Meetings & Attendance:During the year under review the Board of the Company met eight times on 19th May, 2017, 16th August, 2017, 25th August, 2017, 12th September, 2017, 26th September, 2017, 24th October, 2017, 12th December, 2017 and 14th February, 2018 respectively. The maximum time gap between any two consecutive meetings did not exceed more than 120 days in compliance with the provision of Companies Act, 2013 and listing regulations.

SPML Infra Limited Annual Report 2017-1884
The following is the Composition of the Audit Committee as on March 31, 2018 and details of attendance for the Meetings of the Audit Committee:
Sl. No.
Name of the Director Category No of Meetings held
No. of Meetings attended
1 Mr. Sarthak Behuria Chairman / Independent Director 5 32 Mr. Prem Singh Rana Member / Independent Director 5 33 Mrs. Archana Capoor Member/ Independent Director 5 44 Mr. Deepak Sethi Member / Non-Executive Director 5 1
ii) Stakeholder Relationship Committee Stakeholder Relationship Committee has the mandate to review and redress the grievances of shareholders in
compliance with the Section 178 of Companies Act, 2013 read with Regulation 20 of the SEBI (Listing Obligations and Disclosure Requirements) Regulations, 2015. The Committee is responsible for resolving shareholder’s complaint with regard to share transfers, dividend, non-receipt of Annual Report, Shares Transfer, Duplicate Share Certificates and other queries related to them. The Company Secretary of the Company acts as Secretary to the Committee.
During the year under review 4 Meetings of the Stakeholder Relationship Committee were held on 4th May 2017, 15 June 2017, 24th November 2017 and 22nd March 2018.
During the Financial 2017-18 there is no change in the composition of the Stakeholder Relationship Committee. The composition and the details of the attendance for the Meetings of the Stakeholder Relationship Committee are as under:
Sl. No.
Name of the Director Category No of Meetings held
No. of Meetings attended
1 Mr. Deepak Sethi Chairperson/Non-Executive Director 4 42 Mr. Subhash Chand Sethi Member/Executive Director 4 43 Mr. Sarthak Behuria Member/Independent Director 4 24 Mr. Prem Singh Rana Member/Independent Director 4 2
The Company attends to the investors’ grievances/correspondence expeditiously, except in the cases that are constrained by disputes or legal impediments.
(a) No. of Shareholders complaints received during the year 1(b) No. of complaints not resolved to the satisfaction of the Shareholders 1(c) No. of pending complaints as on 31.03.2018 0
iii) Nomination and Remuneration Committee The purpose of Nomination and Remuneration Committee is to review the performance of the individuals whether to
qualify to be an executive, non-executive and independent Director and to recommend to the Board for the approval of the same. The committee is also responsible to review the compensation programme for the individuals and other senior managerial personnel. In addition to above the committee makes recommendation to the Board the annual base salary, incentive, bonus employment agreement etc. of Executive Directors and other Senior Managerial Personnel.
The Company Secretary of the Company acts as a Secretary to the Committee.
Composition and Attendance During the Financial 2017-18 there is no change in the composition of the Nomination and Remuneration Committee.
During the year under review only two meetings of Nomination and Remuneration Committee were held on 19th May, 2017 and 25th August, 2017.

85Statutoryreports
Corporate Overview
Financial statements
The following is the Composition of the Committee & the details of the attendance for the Meetings of the Nomination and Remuneration Committee:
Sl. No.
Name of the Director Category No of Meetings held
No. of Meetings attended
1 Mr. Sarthak Behuria Chairperson /Independent Director 2 22 Mr. Prem Singh Rana Member/Independent Director 2 13 Mr. Deepak Sethi Member/Non-Executive Director 2 1
iv) CSR Committee As on 31st March, 2018 CSR Committees comprises of two independent directors and one non-executive director.
Mr. Sarthak Behuria is the Chairman of the Committee whereas Mr. Prem Singh Rana and Mr. Deepak Sethi are the members of the CSR Committee of the Board of Directors.
During the year there is no change in the composition of the committee.
The Board of Company not only aims to generate maximum profit to our Shareholders but at the same time give equal focus on social and environmental responsibilities. The role of the Committee is to formulate and monitor the CSR policy of the Company. The Committee also emphasizes on Company’s objective to improve the life of the society and create impact through its activities on the corporate, environment, communities and stakeholders. The Committee formulates and monitors the CSR Policy and recommends to the Board the annual CSR Plan of the Company pursuant to the provision of Companies Act, 2013.
v) Finance Committee The Board constituted the Finance Committee is to carry on the smooth Banking and other operational matters of
the Company. This Committee has also been delegated the authority by the Board to review and monitor the Banking decisions of the Company.
Composition and Meetings The Committee comprises of three Directors namely, Mr. Sushil Kumar Sethi, Mr. Subhash Chand Sethi and Mr. Deepak
Sethi. The Committee meets as and when it is required. The Company Secretary of the Company acted as the secretary to the Committee.
vi) Committee of Directors The Board of Directors of the Company has also constituted its sub-committee viz. “Committee of Directors” in order to
transact the business arising out of day to day business affairs of the Company and is also inter alia delegated with the power and authority to allot Equity Shares and other Securities of the Company to the Shareholder and persons other than the Shareholders of the Company, Appointment of various intermediaries relating to capital increase, fund raising, purchase and sell of equipment’s or any other assets on lease/rent or otherwise. Mr. Subhash Chand Sethi, Mr. Sushil Kumar Sethi, Mr. Deepak Sethi and Mr. Sarthak Behuria are the members of the Committee. Mr. Subhash Chand Sethi is the Chairman of the Committee.
During the year under review three Meetings of the Committee of Directors has been held on 28th November 2017, 30th November, 2017 and 12th December, 2017.
3. Remuneration of Directors Nomination, Remuneration and Performance Evaluation Policy: -SPML’s remuneration policy aims at attracting and retaining
high caliber talent. The remuneration policy, therefore, is market-led and takes into account the competitive circumstance of each business so as to attract and retain quality talent and leverage performance significantly. Whole time Director Remuneration payment is governed by their terms of appointment as recommended by the Nomination and Remuneration Committee and approved by the Board subject to the approval of Shareholders and the Central Government, if applicable. Independent Directors of the Company are paid sitting fees for attending the meetings of the Board/ Committees subject

SPML Infra Limited Annual Report 2017-1886
to ceiling/limits as provided under Companies Act, 2013 and rules made thereunder. The Nomination and Remuneration Committee recommends and approves the remuneration of Directors and Key Managerial Personnel, subject to approval of board or shareholders, wherever necessary. The Policy on Nomination, remuneration and performance evaluation of Directors, Key Managerial Personnel and other employees of the Company is provided in the website of the Company www.spml.co.in.
Details of remuneration paid to the Executive Directors of the Company for the financial year 2017-18 are as follows:
Name of Director Salary (`)
Commission(`)
Perquisites (`)
Contribution to Provident Fund (`)
Term
Mr. Subhash Chand Sethi 7,200,000 3,753,790 360,000 144,000 5 yrs w e f 01.01.2015Mr. Sushil Kumar Sethi 7,200,000 3,753,790 960,000 144,000 5 yrs w e f 01.01.2015
The above remuneration is excluding the liability towards payment of Personal Accident Insurance Premium and Gratuity.
Details of Sitting Fees / Professional Fees paid to the Non-Executive Directors for the financial year ended 2017-18 are as follows:Sl. No.
Name of the Directors Professional fees(`)
Board Meeting
(`)
Committee Meetings
(`)
Independent Director Meeting
(`)
Total(`)
1 Mr. Sarthak Behuria – 200,000 60,000 40,000 300,0002 Mr. P S Rana – 240,000 50,000 40,000 330,0003 Mrs. Archana Capoor – 280,000 40,000 40,000 360,0004 Mr. Dinesh Kumar Goyal – 320,000 – 40,000 360,0005 Mr. Sushil Kumar Roongta – 200,000 – 40,000 240,0006 Mr. Supriyo Kumar Chaudhuri – 280,000 – – 280,000
4. Disclosure I. Equity shares held by Non-Executive Directors Except Mr. Deepak Sethi, who holds 5,82,250 equity shares, no other Non-Executive Directors of the Company held any
equity shares of the Company during the year under review.
II. Related Party Transactions Pursuant to the provisions of Section 188 of the Companies Act, 2013, rules framed thereunder read with Regulation 23
and Schedule V of the SEBI (Listing Obligations and Disclosure Requirements) Regulations, 2015, all the related party transaction entered during the year under review were on an arm’s length basis and in the ordinary course of business. These have been approved by the Audit Committee as well as Board wherever required.
Further, for the transactions which are repetitive in nature, prior omnibus approval has also been obtained from the Audit Committee. All the Related Party Transactions are placed on quarterly basis before the Audit Committee and Board for their review. The Board has approved and adopted a policy on Related Party Transactions, which is available on the website of the Company at www.spml.co.in.
The significant accounting policies which are applied have been set out in the Notes to Financial Statements. There are no materially significant related party transactions which have potential conflict with the interest of the Company at large. The detail on related party transaction has been provided in the Directors Report.
III. Compliances by the Company There has been no instance of non-compliance by the Company with the requirements of the Stock Exchanges,
Securities and Exchange Board of India and other statutory authorities on matters related to Capital Markets during the last three years.
The Company has adopted and complied with all the mandatory requirements under SEBI Listing Regulations, 2015.
87Statutoryreports
Corporate Overview
Financial statements
IV. Compliance with regard to dealing with Unclaimed Shares pursuant to Section 124 and SEBI’s Listing Regulations - Uniform Procedure for Unclaimed Shares:
Pursuant to the General Circulars issued by the Ministry of Corporate Affairs with respect to Section 124 (6) of the Companies Act, 2013 read with Rules made thereunder in relation transfer of unclaimed shares to Investor Education and Protection Fund (IEPF), the Company has complied with all the required formalities by transferring the Unclaimed Shares in pursuance of the requirements of the aforesaid Rules.
V. Disclosure under Regulation 30 and 46 of SEBI Listing Regulations regarding certain agreements with the media companies:
Pursuant to the requirement of Regulation 30 of the SEBI Listing Regulations, the Company would like to inform that no agreement(s) have been entered with media companies and/or their associates which has resulted/ will result in any kind of shareholding in the Company and consequently any other related disclosures viz., details of nominee(s) of the media companies on the Board of the Company, any management control or potential conflict of interest arising out of such agreements, etc. are not applicable.
VI. Familiarisation Programme for Independent Directors The Company follows familiarization programme for the Independent Directors as per the requirement of Regulation
25(7) of the SEBI (Listing Obligations and disclosure Requirements) Regulations, 2015. The objective of this program is to provide insights into the Company and make them to understand the business so that they can contribute significantly to the Company. The detail of such familiarization programs framed by the board for its Independent directors can be accessed on the Company’s website at www.spml.co.in.
VII. Whistle Blower Policy: The Company has adopted a Vigil Mechanism/Whistle Blower Policy as defined under Regulation 22 of the SEBI (Listing
Obligations and Disclosure Requirements) Regulations, 2015 to provide a formal mechanism to the Directors and Employees under which they are free to report their genuine concerns about unethical behavior, actual or suspected fraud or violation of the Company’s Code of Conduct or Policy. The whistle blower policy is available at Company’s website at www.spml.co.in.
VIII. Code of Conduct for Prevention of Insider Trading, 2015 The Company has adopted Code for prevention of Insider Trading for its Directors and designated employees pursuant
to Regulation 8 (1) and 9 of SEBI (Prohibition of Insider Trading) Regulations, 2015. The objectives of these codes are to regulate, Monitor and report trading by Insiders and to report Fair Disclosure of Unpublished Price Sensitive Information. These Codes prohibits purchase/ sale of securities of the Company by Directors and designated employees while in possession of unpublished price sensitive information in relation to the Company. Further the Code specifies the procedures to be followed and disclosures to be made by Directors and the designated employees, while dealing with the shares of the Company. The Code of Conducts is available on the Company’s Website www.spml.co.in.
IX. Performance Evaluation: In Compliance with provisions of Section 134, 149 and Schedule IV of the Companies Act, 2013 read with Schedule
V and Part D of the Schedule II of the SEBI (Listing Obligations and Disclosure Requirements) Regulations, 2015, the Annual Performance Evaluation of Independent Directors was carried out by the entire Board and a Separate Meeting of Independent Directors was also held on 27th March, 2018 to assess the performance of the Non-Independent Director, the Board as a whole and also to review the performance of the Chairperson of the Company after considering the views of executive and non-executive directors.
Performance Evaluation is based on their contribution to Company’s objectives and plans, efficient discharge of their responsibilities, participation in Board/Committee meetings and other relevant parameters.
X. Risk Management The Company has in place well designed framework and procedures to inform Board members about the Risk
Assessment and minimization procedures. The Company is aware of the risks associated with the business. It regularly

SPML Infra Limited Annual Report 2017-1888
analysis the risks and takes corrective actions for managing/ mitigating the same. Board of Directors of the Company has approved and adopted “Risk Management Policy” pursuant to Regulation 21 of the SEBI (Listing Obligations and Disclosure Requirements) Regulations, 2015. The “Risk Management Policy” is available on the Company’s Website www.spml.co.in.
XI. Policy for Determining Material Subsidiaries In terms of Regulation 24 of the SEBI (Listing Obligations and Disclosure Requirements) Regulations, 2015 the Company
has formulated a Policy for Determining Material Subsidiaries and the same is available on the Company’s website at www.spml.co.in.
XII. Mandatory & Non-mandatory Clauses The Company has complied with all mandatory requirements laid down by Schedule V of the SEBI (Listing Obligations
and Disclosure Requirements) Regulations, 2015. The Non-mandatory requirements complied with has been disclosed at the relevant places.
5. Means of Communication (a) The quarterly results are published in English Newspaper (all Editions) as well as Hindi Daily Newspaper in Delhi. The
information on Quarterly Results is sent to the stock exchanges to enable them to post it on their respective websites.
(b) The financial results, annual report, notices to the shareholders meetings, results of postal ballots, results of e-voting, news releases, press releases, any presentations made to Institutional Investors or Analysts and other important announcements are sent to the stock exchanges and are also displayed on Company’s website at www.spml.co.in.
6. General Body Meetings a. Location and time of the last three Annual General Body Meetings held:
Year Venue Date Time Special Resolution passed2016-17* PHD Chamber of
Commerce, PHD House,4/2 Siri Institutional Area,August Kranti Marg,New Delhi–110016
29th September, 2017 3:30 PM 1. Special Resolution Under Section 14 of the Companies Act, 2013 for alteration of the Articles of Association of the Company
2015-16# -do- 30th September, 2016 11:30 AM 1. Special Resolution under Section 42, 62 of the Companies Act, 2013 for issuing securities of the Company to Promoters and Non-Promoters on Preferential Basis.
2. Special Resolution under Section 88 & 94 of the Companies Act, 2013 for authorization for keeping the Register of Members and other securities of the Company at Kolkata instead of Registered Office of the Company.
2014-15# -do- 28th September, 2015 3:30 PM None
* Mr. R. S Bhatia, Company Secretary in whole-time practice, New Delhi was appointed by the Board as the Scrutinizer for e-voting and conducting the ballot process at the AGM venue in a fair and transparent manner.
#Mr. Tumul Maheshwari of PTM & Co, Company Secretaries was appointed by the Board as the Scrutinizer for e-voting and conducting the ballot process at the AGM venue in a fair and transparent manner.

89Statutoryreports
Corporate Overview
Financial statements
b. Location and the time of Extraordinary General Body Meetings held:Year Venue Date Time Special Resolution passed
2017-18 PHD chamber of Commerce, PHD House,4/2 Siri Institutional Area,August Kranti Marg,New Delhi–110016
20th November, 2017 3:30 PM 1. Special Resolution for implementation of the “S4A Resolution Plan” of the Company.
2. Special Resolution under Section 42, 62 & 71 of the Companies Act, 2013 for conversion of part of outstanding loans of the lender into OCDs
3. Special Resolution under Section 42, 62 & 71 of the Companies Act, 2013 for issue of Optionally Convertible Debentures (OCDs)
c. Detail of Special Resolution passed during FY 2017-18 through Postal Ballot: During the financial year 2017-18, a Special Resolution was passed by the Shareholders through Postal Ballot with
regard to shifting of registered office from the state of Delhi to Kolkata in the state of West Bengal in terms of the provisions of Sections 12, Section 13 and other applicable provisions, if any, of the Companies Act 2013 read with Rule 30 of the Companies (Incorporation) Rules 2014, the brief summary and the Voting Pattern is given herein below:
Resolution Type Special ResolutionName of Resolution Shifting of the Registered Office of the Company from the “Union Territory
of Delhi” to the State of “West Bengal”Person who conducted the postal ballot exercise-Name of Scrutinizer
R. S Bhatia, Company Secretary in whole time practice was appointed as Scrutinizer for carrying out the postal ballot process in a fair and transparent manner.
Date of Postal Ballot Notice 19th May 2017Voting Period From 22 June 2017 to 21 July 2017Date of Approval of Resolution 21st July 2017Declaration of Result 24th July 2017Whether promoter/ promoter group are interested in the agenda / resolution?
NO
Voting Pattern:Promote/
PublicNo. of
Shares heldNo. of Votes
polled% of Votes Polled on
outstanding shares
No. of votes-in favour
No. of Votes-against
% of Votes in favour on votes polled
% of Votes against on
votes polled
Promoter & Promoter Group
2,18,60,835 1,93,73,765 88.6232 1,93,73,765 0 100.0000 0.0000
Public-Institutional holders
13,000 0 0.0000 0 0 0.0000 0.0000
Public Others 1,47,76,441 7,51,069 5.0829 7,49,802 1267 99.8313 0.1687Total 3,66,50,276 2,01,24,834 54.9105 2,01,23,567 1267 99.9937 0.0063
d. Whether any Special Resolution is proposed to be conducted through postal ballot: No Special Resolution requiring to be passed through special resolution is being proposed at ensuing Annual General
Meeting of the Company.

SPML Infra Limited Annual Report 2017-1890
e. Procedure for postal ballot: In compliance with provisions of Section 108 and 110 of the Companies Act, 2013 and other applicable provisions
of the Companies Act 2013 read with relevant rules framed there under and provisions of SEBI (Listing Obligation and Disclosure Requirement) Regulation, 2015 (including any statutory modification(s) or re-enactment thereof for the time being in force), the Company provides postal ballot to all its members. The Postal Ballot Notice containing the Resolution together with the explanatory statement annexed to the Notice is sent to all the Members/ Shareholders through electronic mode as well as through physical mode along with a pre-paid self-addressed. The Company also publishes a notice in newspapers intimating shareholders for the postal ballot and other details and mandated under the Companies Act and ruled made there under. The voting rights of the shareholders are decided on the basis of equity shares hold by them as on cutoff date.
The members who intend to vote on the agenda items mentioned in the postal ballot notice can vote either electronically or by submitting duly filled in postal ballot form to the Scrutinizer appointed by the Board for the purpose of conducting postal ballot process in a fair and transparent manner, on or before close of the voting period.
The scrutinizer, after carrying out the scrutiny, submits his report on the voting done through Postal Ballot forms as well as through e-voting by the Members to the Chairman or any person authorised by Chairman who declares the voting result. The results are communicated to the stock exchanges and also displayed on the website of the Company.
The resolution, if approved by requisite majority, is deemed to have been passed on the date as specified by the Company as the last date for receipt of duly completed Postal Ballot Forms or casting their votes through e-Voting.
7. Shareholder Informationi) 37th Annual General Meeting 29th September, 2018 at 03:30 PM
PHD Chamber of Commerce, PHD House,4/2, Sri Institutional Area, August KrantiMarg, New Delhi – 110 016
ii) Financial Calendar (tentative) Financial Year-1st Apr 2018 to 31st Mar 2019Adoption of Results for the Quarter ending:a) Jun 30, 2018 - 2nd week of Aug, 2018b) Sep 30, 2018 - 2nd week of Nov, 2018c) Dec 31,2018 - 2nd week of Feb,2019d) Mar 31,2019 - 4th week of May, 2019Annual General Meeting - Sep, 2019
iii) Book Closure Date 22nd Sep 2018 to 29th Sep 2018 (both days inclusive)iv) Dividend Payment Date Not Applicable.v) Listing on Stock Exchanges The BSE Limited (BSE)
(BSE), Phiroze Jeejeebhoy Towers, Dalal Street, Mumbai – 400 001
National Stock Exchange of India Limited (NSE),Exchange Plaza, Bandra Kurla Complex, Bandra (E), Mumbai – 400051
The annual listing fee for the year 2018-19 has been paid to the NSE & BSE.
The confirmation of delisting from Calcutta Stock Exchange is awaited.vi) Stock Code BSE - ‘500402’, NSE - ‘SPMLINFRA’vii) ISIN No INE937A01023viii) Registrar & Transfer Agents Maheshwari Datamatics Private Limited
23, R.N. Mukherjee RoadKolkata – 700 001Phone: +91-033-2248 2248

91Statutoryreports
Corporate Overview
Financial statements
ix) Stock Prices data and performance of Company’s share prices vis-à-vis Nifty & Sensex; a) Share Price Data at BSE and NSE (` Per share)
MonthNational Stock Exchange BSE Limited
High Low High LowApril, 2017 102.60 59.75 102.60 59.55May, 2017 126.80 95.00 127.40 96.00June, 2017 136.25 107.00 136.90 107.40July, 2017 188.00 135.10 186.00 135.80August, 2017 171.75 144.80 170.70 149.35September, 2017 170.00 132.25 170.00 133.00October, 2017 179.70 125.15 180.45 125.10November, 2017 187.95 132.70 187.95 132.80December, 2017 172.50 145.00 172.50 148.00January, 2018 159.55 127.95 162.00 127.50February, 2018 137.75 105.95 137.50 108.80March, 2018 113.70 75.40 112.00 76.00
b) Performance of Company’s share prices (monthly high) vis-vis NSE Nifty
Base 100 on April 1, 2017
SPML Share on BSE Vs Sensex200180160140120100
80604020
0
Apr-
17
May
-17
Jun-
17
Jul-1
7
Aug-
17
Sep-
17
Oct-
17
Nov
-17
Dec-
17
Jan-
18
Feb-
18
Mar
-18
Sensex SPML
Base 100 on April 1, 2017
SPML Share on NSE Vs CNX Nifty200180160140120100
80604020
0
Apr-
17
May
-17
Jun-
17
Jul-1
7
Aug-
17
Sep-
17
Oct-
17
Nov
-17
Dec-
17
Jan-
18
Feb-
18
Mar
-18
CNX Nifty SPML

SPML Infra Limited Annual Report 2017-1892
x) Share Transfer System The Board has constituted the Stakeholder Relationship Committee and delegated the power of transfer to the
Committee. The Committee holds its meeting as and when required, to consider all matters concerning transfer and transaction of shares. The Company’s shares are traded in compulsory Demat Mode. The shares received for transfer in physical mode by the Company are transferred expeditiously and the share certificates, duly transferred, are sent to the transferee(s).
The Company obtains from a Company Secretary in practice, half yearly certificate of compliance with the share transfer formalities as required under Regulation 40(9) of the SEBI (Listing Obligations and Disclosure Requirements) Regulations, 2015 and files a copy of the certificate with the Stock Exchanges.
xi) Dematerialization of Shares The Company’s shares are available for trading in the depository systems of both the National Securities Depository
Limited (NSDL) and the Central Depository Services (India) Limited (CDSL). As on 31st March, 2018 Equity Shares of the Company, forming 99.35% of total shareholding stand dematerialized. Company’s ISIN No. is ‘INE937A01023’.
xii) Liquidity of Shares The Equity Shares of the Company have been included in the Sensex and are traded in the T Group at the BSE Limited.
Its shares are also traded at the National Stock Exchange.
xiii) Share Ownership Pattern as on March 31, 2018.Category No. of Shares held % shareholdingPromoter and Promoter Group 14001260 38.20Mutual Funds/ UTI 13000 0.04Financial Institutions / Banks / Foreign Institutional Investors 7901048 21.56Corporate Bodies 5800475 15.83Public 2786093 7.60Non Resident Individual 50828 0.14Clearing Members 198410 0.54NBNFCs registered with RBI 1744 0.00Investor Education and Protection Fund Authority 100848 0.28Foreign Portfolio Investors 253194 0.69Foreign Company 5493876 14.99Trusts 49500 0.14
Total : 36650276 100.00
xiv) Distribution of Shareholding by size as on March 31, 2018Shares held Shareholders SharesFrom - To Number % of Total Shareholders Number % of Shares1- 500 5276 86.6908 679920 1.8534501-1000 387 6.3589 322477 0.87991001-2000 167 2.7440 254526 0.69452001-3000 67 1.1009 173750 0.47413001-4000 26 0.4272 94161 0.25694001-5000 24 0.3943 111548 0.30445001-10000 33 0.5422 242364 0.6613>10000 106 1.7417 34772160 94.8756Total 6086 100.00 36650276 100.00

93Statutoryreports
Corporate Overview
Financial statements
xv) Outstanding Warrant There was no outstanding warrant.
xvi) Address for Correspondence The Shareholders may address their communication / suggestion / grievances / other queries to:
The Company Secretary SPML Infra Limited SPML House, Plot No. 65, Sector-32, Institutional Area, Gurgaon-122 001 Phone : +91-124-2384141 E-mail : [email protected] Website: www.spml.co.in
8. CEO / CFO Certification The Managing Director (CEO) and CFO have certified to the Board in accordance with Regulation 17(8) of the SEBI (Listing
Obligations and Disclosure Requirements) Regulations, 2015 pertaining to CEO / CFO certification for the financial year ended 31st March, 2018.
9. Auditors’ Certificate on Corporate Governance As required by as per Part E of the Schedule V of the SEBI (Listing Obligations and Disclosure Requirements) Regulations,
2015, the auditors’ certificate is annexed to this report.
10. Code of Conduct The SPML Code of Business Conduct and Ethics, as adopted by the Board of Directors is a comprehensive Code applicable
to all Directors, Executive as well as Non-Executive as well as members of Senior Management. A copy of the Code has been put on the Company’s website www.spml.co.in.
The Code has been circulated to all members of the Board and Senior Management and the compliance of the same has been affirmed by them.
For SPML Infra Limited
Place: Gurgaon Subhash Chand SethiDate: 30th May, 2018 Chairman
DECLARATION BY THE MANAGING DIRECTOR ON COMPLIANCE WITH CODE OF CONDUCT
I hereby confirm that the Company has obtained from all the members of the Board and Management Personnel, affirmation that they have complied with the ‘Code of Conduct’ and ‘Our Code’ in respect of the financial year 2017-18.
Place: Gurgaon Sushil Kumar SethiDated: 30th May 2018 Managing Director

SPML Infra Limited Annual Report 2017-1894
To,The Members ofSPML Infra Limited
We have examined the compliance of conditions of corporate governance by SPML Infra Limited (“the Company”) for the year ended on March 31, 2018, as stipulated in Regulations 17 to 27, clauses (b) to (i) of Regulation 46(2) and Para C, D and E of Schedule V to the Securities and Exchange Board of India (Listing Obligations and Disclosure Requirements) Regulations, 2015 (‘Listing Regulations’).
The compliance of conditions of corporate governance is the responsibility of the management. Our examination was limited to the review of procedures and implementation thereof, as adopted by the Company for ensuring the compliance of the conditions of Corporate Governance. It is neither an audit nor an expression of an opinion on the financial statements of the Company.
In our opinion and to the best of our information and according to our examination of the relevant records and the
explanations given to us and the representation made by the directors and management, we certify that the Company has complied with the conditions of corporate governance as stipulated in the SEBI Listing Regulation for the year ended March 31, 2018.
We further state that such compliance is neither an assurance as to the future viability of the Company nor the efficiency or effectiveness with which the management has conducted the affairs of the Company.
For Maheshwari & AssociatesChartered Accountants
Firm Registration No 311008E
CA Bijay MurmuriaPlace: Gurgaon PartnerDate: 30th May, 2018 Membership No 055788
AUDITORS’ CERTIfICATE ONCORPORATE GOVERNANCE
To,The Board of DirectorsSPML Infra Limited
1. We have reviewed financial statements and the cash flow statement for the year ended 31st March, 2018 and to the best of our knowledge and belief:
i. these statements do not contain any materially untrue statement or omit any material fact or contain statements that might be misleading;
ii. these statements together present a true and fair view of the Company’s affairs and are in compliance with existing accounting standards, applicable laws and regulations.
2. There are, to the best of our knowledge and belief, no transactions entered into by the Company during the year which are fraudulent, illegal or violative of the Company’s Code of Conduct.
3. We accept responsibility for establishing and maintaining internal controls for financial reporting and we have evaluated the effectiveness of Company’s internal control
systems pertaining to financial reporting. We have not come across any reportable deficiencies in the design or operation of such internal controls.
4. We have indicated to the Auditors and the Audit Committee that:
i. there are no significant changes in internal control over financial reporting during the year;
ii. there are no significant changes in accounting policies during the year; and
iii. there are no instances of significant fraud of which we have become aware.
Sushil Kumar Sethi Sujit JhunjhunwalaManaging Director CFO
Place: GurgaonDated: 30th May 2018
CEO/CfO CERTIFICATION

95Statutoryreports
Corporate Overview
Financial statements
standalOneFINANCIAL STATEMENTS

SPML Infra Limited Annual Report 2017-1896
Report on the Standalone Ind AS Financial StatementsWe have audited the accompanying standalone Ind AS financial statements of SPML Infra Limited (“the Company”), which comprise the Balance Sheet as at 31st March, 2018, and the Statement of Profit and Loss (including Other Comprehensive Income), the Cash Flow Statement and the Statement of Changes in Equity for the year then ended, and a summary of the significant accounting policies and other explanatory information.
Management’s Responsibility for the Standalone Financial StatementsThe Company’s Board of Directors is responsible for the matters stated in Section 134(5) of the Companies Act, 2013 (“the Act”) with respect to the preparation of these standalone Ind AS financial statements that give a true and fair view of the state of affairs (financial position), profit or loss (financial performance including other comprehensive income), cash flows and changes in equity of the Company in accordance with the accounting principles generally accepted in India. Including the Indian Accounting Standards (Ind AS) prescribed under Section 133 of the Act, read with the Companies (Indian Accounting Standards) Rules, 2015, as amended.
This responsibility also includes maintenance of adequate accounting records in accordance with the provisions of the Act for safeguarding the assets of the Company and for preventing and detecting frauds and other irregularities; selection and application of appropriate accounting policies; making judgments and estimates that are reasonable and prudent; and design, implementation and maintenance of adequate internal financial controls, that were operating effectively for ensuring the accuracy and completeness of the accounting records, relevant to the preparation and presentation of the standalone Ind AS financial statements that give a true and fair view and are free from material misstatement, whether due to fraud or error.
Auditors’ ResponsibilityOur responsibility is to express an opinion on these standalone Ind AS financial statements based on our audit.
We have taken into account the provisions of the Act, the accounting and auditing standards and matters which are required to be included in the audit report under the provisions of the Act and the Rules made thereunder.
We conducted our audit of the standalone Ind AS financial statements in accordance with the Standards on Auditing specified under Section 143(10) of the Act. Those Standards require that we comply with ethical requirements and plan and perform the audit to obtain reasonable assurance about whether the standalone Ind AS financial statements are free from material misstatement.
An audit involves performing procedures to obtain audit evidence about the amounts and the disclosures in the standalone Ind AS financial statements. The procedures selected depend on the auditor’s judgment, including the assessment of the risks of material misstatement of the standalone Ind AS financial statements, whether due to fraud or error. In making those risk assessments, the auditor considers internal financial control relevant to the Company’s preparation of the standalone Ind AS financial statements that give a true and fair view in order to design audit procedures that are appropriate in the circumstances. An audit also includes evaluating the appropriateness of the accounting policies used and the reasonableness of the accounting estimates made by the Company’s Directors, as well as evaluating the overall presentation of the standalone Ind AS financial statements.
We believe that the audit evidence we have obtained is sufficient and appropriate to provide a basis for our qualified audit opinion on the standalone Ind AS financial statements.
Basis for Qualified OpinionAttention is invited to :(i) Note 43 to the standalone Ind AS financial statements
regarding non-provision of interest amounting to `1842.68 lakhs on Optionally Convertible Debentures (OCDs) issued to lenders under S4A scheme. Had such interest provision been made, the finance cost would have been increased by `1842.68 lakhs and profit as well as shareholders fund for the year ended 31st March, 2018 would have been reduced by `1842.68 lakhs.
(ii) Note 44 to the standalone Ind AS financial statements regarding the Company’s trade receivables, as at 31st March, 2018 of `3,402.74 lakhs (31st March, 2017 : `11,198.02 lakhs) relating to projects foreclosed by Clients in earlier years and where the claims are presently under arbitration/ litigation proceedings. Pending the
TO THE MEMBERS OF SPML INFRA LIMITED
Independent Auditor’s Report

97Statutoryreports
Corporate Overview
Financial statements
ultimate outcome of these matters, which is presently unascertainable, we are unable to comment on the recoverability of the aforesaid trade receivables. The Auditor’s Report for the year ended 31st March, 2017 was also qualified in respect of this matter.
Qualified OpinionIn our opinion and to the best of our information and according to the explanations given to us, except for the possible effects of the matters described in the Basis for Qualified Opinion paragraph, the aforesaid standalone Ind AS financial statements give the information required by the Act in the manner so required and give a true and fair view in conformity with the accounting principles generally accepted in India including the Ind AS specified under Section 133 of the Act, of the state of affairs (financial position) of the Company as at 31st March, 2018, and its total comprehensive income (comprising of profit and other comprehensive income), its cash flows and the changes in equity for the year ended on that date.
Emphasis of MattersWe draw attention to Note 45 to the Standalone Ind AS Financial Statements, regarding uncertainties relating to the recoverability of trade & other receivables of `25460.41 lakhs as at 31st March, 2018 (31st March, 2017 : `23,358.81 lakhs) and recognition of interest income of `1471.20 lakhs on arbitration awards during the year ended 31st March, 2018, (for the year ended 31st March, 2017 : `6,603.38 lakhs). All these amounts relate to the appeals filed by clients pending in various courts in relation to the arbitrations awards passed in favor of the Company and recognized in the current period and earlier years. Pending the ultimate outcome of these matters, which is presently unascertainable, no adjustments have been made in the accompanying standalone financial statements.
Our opinion is not modified in respect of this matter.
Other Matters The Company had prepared separate sets of standalone financial statements for the years ended 31st March, 2017 and 31st March, 2016 in accordance with Accounting Standards prescribed under section 133 of the Act read with Rule 7 of the Companies (Accounts) Rules, 2014 (as amended) which have been audited by the predecessor auditors, who had issued auditor’s reports dated 19th May, 2017 and 27th May, 2016 respectively, expressing modified opinion with emphasis of matters. These financial statements have been adjusted for
the differences in the accounting principles adopted by the Company on transition to Ind AS, which have been audited by us. Our opinion is not modified in respect of this matter.
Report on Other Legal and Regulatory Requirements1. As required by the Companies (Auditor’s Report) Order,
2016 [“the Order”], issued by the Central Government of India in terms of Section 143(11) of the Act, we give in “Annexure A” a statement on the matters specified in paragraphs 3 and 4 of the Order.
2. As required by Section 143(3) of the Act, we report that:
a. We have sought and except for the possible effects of the matters described in the Basis for Qualified Opinion paragraph, obtained all the information and explanations which to the best of our knowledge and belief were necessary for the purpose of our audit;
b. Except for the possible effects of the matters described in the Basis for Qualified Opinion paragraph, in our opinion, proper books of account as required by law have been kept by the Company so far as it appears from our examination of those books;
c. The standalone Ind AS financial statements dealt with by this Report are in agreement with the books of account;
d. Except for the possible effects of the matters described in the Basis for Qualified Opinion paragraph, in our opinion, the aforesaid standalone Ind AS financial statements comply with the Indian Accounting Standards specified under Section 133 of the Act;
e. The matters described in the Basis for Qualified Opinion and Emphasis of Matters paragraphs above, in our opinion, may have an adverse effect on the functioning of the Company;
f. On the basis of the written representations received from the directors as on 31st March, 2018 and taken on record by the Board of Directors, none of the directors is disqualified as on 31st March, 2018 from being appointed as a director in terms of Section 164(2) of the Act;
g. The qualification relating to the maintenance of accounts and other matters connected therewith are as stated in the Basis for Qualified Opinion paragraph;
SPML Infra Limited Annual Report 2017-1898
h. With respect to the adequacy of the internal financial controls over financial reporting of the Company and the operating effectiveness of such controls, refer to our separate Report in “Annexure B” which expressed an unqualified opinion; and
i. With respect to the other matters to be included in the Auditor’s Report in accordance with Rule 11 of the Companies (Audit and Auditors) Rules, 2014, in our opinion and to the best of our information and according to the explanations given to us.
i. The Company has disclosed the impact of pending litigations on its financial position in its standalone Ind AS financial statements as detailed in note 30(A);
ii. Except for the possible effect of the matters described in the Basis for Qualified Opinion
paragraph, the Company has made provision, as required under the applicable law or Ind AS, for material foreseeable losses, if any, on long-term contracts including derivative contracts; and.
iii. There has been no delay in transferring amounts, required to be transferred, to the Investor Education and Protection Fund by the Company.
For Maheshwari & Associates Chartered Accountants FRN: 311008E
CA. Bijay MurmuriaPlace: Kolkata Partner Date: 23rd May, 2018 Membership No. : 055788

99Statutoryreports
Corporate Overview
Financial statements
(i) (a) The Company has maintained proper records
showing full particulars, including quantitative
details and situation of fixed assets.
(b) According to the information and explanations given
to us, the Company has a regular program of physical
verification of its fixed assets under which the fixed
assets are verified in a phased manner over a period
of three years, which, in our opinion, is reasonable
having regard to the size of the Company and the
nature of its assets. In accordance with this program,
certain fixed assets were physically verified during
the year and no material discrepancies between the
book records and the physical inventory have been
noticed on such verification
(c) The title deeds of all the immovable properties
(which are included under the head ‘Property, Plant
and Equipment’) are held in the name of Company.
(ii) According to the information and explanations given to
us and in our opinion, the management has conducted
physical verification of inventory at reasonable intervals
during the year and no material discrepancies between
physical inventory and book records were noticed on
such physical verification.
(iii) According to the information and explanations given
to us, the Company has granted unsecured loans to
companies and other parties covered in the register
maintained under section 189 of the Act; and with
respect to the same:
(a) in our opinion and according to the information &
explanations given to us, the terms and conditions
of grant of such loans are not, prima facie, prejudicial
to the Company’s interest;
(b) the schedule of repayment of the principal and the
payment of the interest has not been stipulated and
hence we are unable to comment as to whether
repayments or receipts are regular;
(c) in the absence of stipulated schedule of repayment
of principal and payment of interest, we are unable to
comment as to whether there is any amount which
is overdue for more than ninety days and whether
reasonable steps have been taken by the Company
for recovery of principal and interest.
(iv) In our opinion, Company has complied with the
provisions of section 185 and 186 of the Act, to the
extent applicable, in respect of loans, investments,
guarantees, and security.
(v) In our opinion and according to the information &
explanations given to us, the Company has not accepted
any deposits within the meaning of sections 73 to 76 of
the Act. or any other relevant provisions of the Act. and
the rules framed thereunder. Accordingly, the provisions
of clause 3(v) of the Order are not applicable.
(vi) In our opinion and according to the information &
explanations given to us, the Company pursuant to
the Rules made by the Central Government for the
maintenance of cost records under sub-section (1)
of section 148 of the Act in respect of the Company’s
products and services and are being made and
maintained. However, we have not made a detailed
examination of the cost records with a view to determine
whether they are accurate or complete.
(vii) According to the books and records as produced
before and examined by us and the information and
explanations given to us :
(a) Undisputed statutory dues including provident fund,
employees’ state insurance, income-tax, sales-
tax,Goods and Services Tax, service tax, duty of
customs, duty of excise, value added tax, cess and
other material statutory dues, as applicable, have
not been regularly deposited with the appropriate
authorities and there have been significant delays
in a large number of cases. Undisputed amounts
[Referred to in paragraph 1 under ‘Report on Other Legal and Regulatory Requirements’ in the Independent Auditors’ Report of even date to the members of SPML Infra Limited on the standalone Ind AS financial statements for the year ended 31st March, 2018]
“Annexure A” to the Independent Auditors’ Report

SPML Infra Limited Annual Report 2017-18100
payable in respect thereof, which were outstanding at the year-end for a period of more than six months from the date
they become payable are as follows:(` in Lakhs)
Name of the statute Nature of the dues Amount Period to which the amount
relates
Due Date Date of payment
Professional Tax P Tax 1.15 June 2016 to August 2017
21st day of the subsequent month
Not yet paid
Employee State Insurance,1948
ESI 6.71 June 2016 to August 2017
15th day of the subsequent month
Not yet paid
Chattisgarh Value Added Tax Act, 2003
VAT 5.96 April 2017 to June 2017
15th day of the subsequent month
Not yet paid
Gujarat Value Added Tax Act, 2003
VAT 25.61 Apr 2017 to June 2017
15th day of the subsequent month
Not yet paid
Gujarat Value Added Tax Act, 2003
WCT 3.82 Apr 2017 to June 2017
15th day of the subsequent month
Not yet paid
Uttar Pradesh Value Added Tax Act, 2008
WCT 141.72 Mar 2016 to June 2017
15th day of the subsequent month
Not yet paid
Delhi Value Added Tax Act, 2005
WCT 11.94 Apr 2017 to June 2017
15th day of the subsequent month
Not yet paid
Jharkhand Value Added Tax Act, 2005
WCT 4.19 Apr 2017 to June 2017
15th day of the subsequent month
Not yet paid
Tripura Value Added Tax Act, 2005
WCT 1.22 Apr 2017 to June 2017
15th day of the subsequent month
Not yet paid
Bihar Value Added Tax Act, 2005
WCT 155.11 Apr 2015 to August 2016
15th day of the subsequent month
Not yet paid
Rajasthan Value Added Tax Act, 2003
WCT 2.09 Apr 2017 to June 2017
15th day of the subsequent month
Not yet paid
West Bengal Value Added Tax Act, 2003
WCT 44.01 Apr 2015 to June 2017
15th day of the subsequent month
Not yet paid
The Orissa Value Added Tax Act, 2004
WCT 1.76 Apr 2015 to June 2017
15th day of the subsequent month
Not yet paid
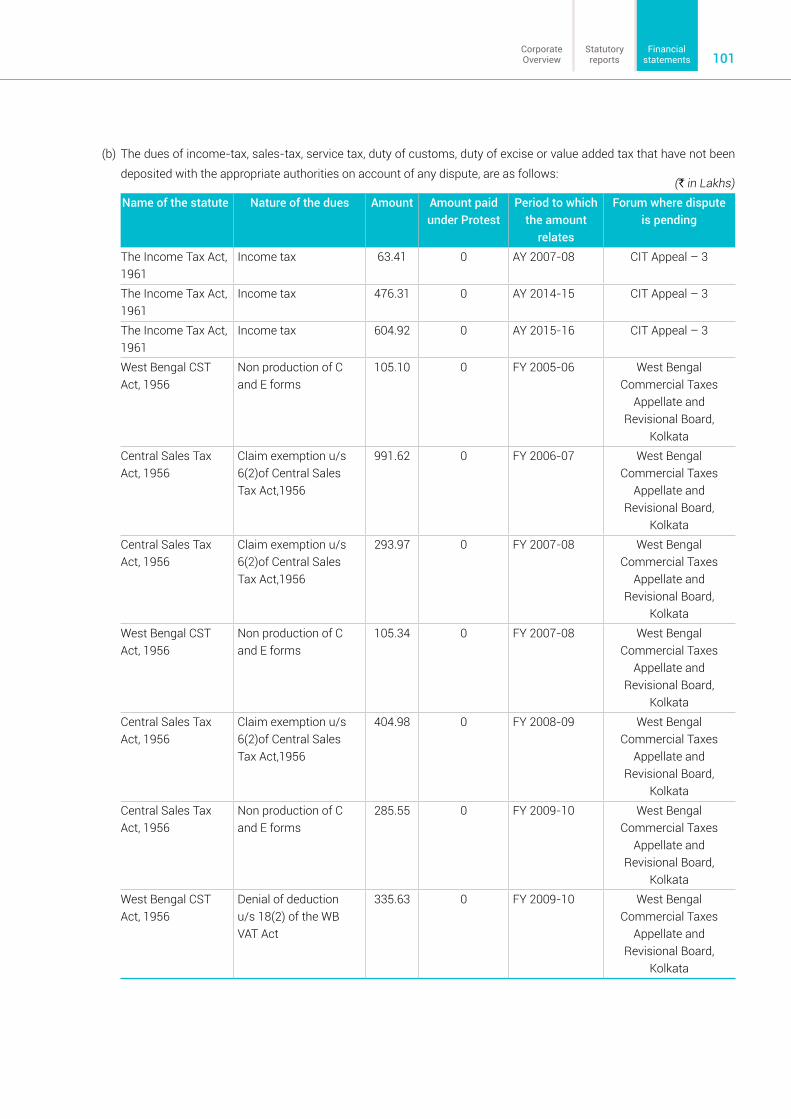
101Statutoryreports
Corporate Overview
Financial statements
(` in Lakhs)Name of the statute Nature of the dues Amount Amount paid
under ProtestPeriod to which
the amount relates
Forum where dispute is pending
The Income Tax Act, 1961
Income tax 63.41 0 AY 2007-08 CIT Appeal – 3
The Income Tax Act, 1961
Income tax 476.31 0 AY 2014-15 CIT Appeal – 3
The Income Tax Act, 1961
Income tax 604.92 0 AY 2015-16 CIT Appeal – 3
West Bengal CST Act, 1956
Non production of C and E forms
105.10 0 FY 2005-06 West Bengal Commercial Taxes
Appellate and Revisional Board,
KolkataCentral Sales Tax Act, 1956
Claim exemption u/s 6(2)of Central Sales Tax Act,1956
991.62 0 FY 2006-07 West Bengal Commercial Taxes
Appellate and Revisional Board,
KolkataCentral Sales Tax Act, 1956
Claim exemption u/s 6(2)of Central Sales Tax Act,1956
293.97 0 FY 2007-08 West Bengal Commercial Taxes
Appellate and Revisional Board,
KolkataWest Bengal CST Act, 1956
Non production of C and E forms
105.34 0 FY 2007-08 West Bengal Commercial Taxes
Appellate and Revisional Board,
KolkataCentral Sales Tax Act, 1956
Claim exemption u/s 6(2)of Central Sales Tax Act,1956
404.98 0 FY 2008-09 West Bengal Commercial Taxes
Appellate and Revisional Board,
KolkataCentral Sales Tax Act, 1956
Non production of C and E forms
285.55 0 FY 2009-10 West Bengal Commercial Taxes
Appellate and Revisional Board,
KolkataWest Bengal CST Act, 1956
Denial of deduction u/s 18(2) of the WB VAT Act
335.63 0 FY 2009-10 West Bengal Commercial Taxes
Appellate and Revisional Board,
Kolkata
(b) The dues of income-tax, sales-tax, service tax, duty of customs, duty of excise or value added tax that have not been
deposited with the appropriate authorities on account of any dispute, are as follows:

SPML Infra Limited Annual Report 2017-18102
(` in Lakhs)Name of the statute Nature of the dues Amount Amount paid
under ProtestPeriod to which
the amount relates
Forum where dispute is pending
West Bengal CST Act, 1956
Exemption under RGGVY scheme
137.72 0 FY 2006-07 West Bengal Commercial Taxes
Appellate and Revisional Board,
KolkataWest Bengal CST Act, 1956
Exemption under RGGVY scheme & Denial of deduction u/s 18(2) of the WB VAT Act
95.74 0 FY 2008-09 West Bengal Commercial Taxes
Appellate and Revisional Board,
KolkataWest Bengal CST Act, 1956
WCT sales taxed improperly, input credit not allowed and interest charged
20.04 0 FY 2010-11 West Bengal Commercial Taxes
Appellate and Revisional Board,
KolkataWest Bengal CST Act, 1956
Disallowance of input tax credit, interest charged and demand of purchase and output tax
75.27 0 FY 2012-13 Senior Joint Commissioner of Sales
Tax, Kolkata (South)Circle
West Bengal CST Act, 1956
Disallowance of input tax credit
40.88 0 FY 2013-14 Joint Commr, Comml Taxes, Central Audit
Unit, KolkataBihar Vat Act, 2005 Disallowance of labour
component43.13 0 FY 2007-08 JCCT Appeals, Patna
Bihar Vat Act, 2005 Denied the exemption u/s 6(2) of the CST Act, on the grounds of pre-determined sales and non-production of statutory forms
234.17 0 FY 2010-11 JCCT Appeals, Patna
Central Sales Tax Act, 1956
Our CST Sales u/s 6(2) IS ACCEPTED and taxed where Form C and E1 are due to be received and produced, interest added
82.12 0 FY 2011-12 JCCT Appeals, Patna
UP VAT Act, 2008 Tax Liability on Exempted project RGGVY sales
44.13 8.82 FY 2007-08 Additional Commissioner, Agra
Jharkhand VAT Act, 2005
Tax Demand on receipts and suppression of turnover
193.41 0 FY 2005-06 to 2010-11
JCCT (Appeals) Jamshedpur
Jharkhand VAT Act, 2005
Tax Demand on receipts and suppression of turnover
38.24 0 FY 2011-12 JCCT (Appeals) Jamshedpur

103Statutoryreports
Corporate Overview
Financial statements
(` in Lakhs)Name of the statute Nature of the dues Amount Amount paid
under ProtestPeriod to which
the amount relates
Forum where dispute is pending
Central Sales Tax Act, 1956
Tax Demand on receipts and suppression of turnover
61.53 0 FY 2011-12 JCCT (Appeals) Jamshedpur
Delhi VAT Act, 2004 Miscellaneous Demand 26.00 0 FY 2012-2013 Commissioner DVAT, Delhi
Rajasthan VAT Act, 2003
Tax liability on interstate Sales
9.37 0 FY 2009-10 Deputy Commissioner, Appeals-II Jaipur
Rajasthan VAT Act, 2003
Tax liability on interstate Sales
110.64 0 FY 2011-12 Deputy Commissioner, Appeals-II Jaipur
Finance Act, 1994 Service Tax 23.13 0 FY 2005-06 to 2006-07
Commissioner Service Tax, Kolkata
(` in Lakhs)
Name of LenderAmount
Upto 90 days More than 90 daysFinancial InstitutionsSREI – 6.14
(` in Lakhs)
Name of LenderAmount
Upto 90 days More than 90 daysBanksCanara Bank – 120SBH 43.7 –SBI 416 –OBC 11.2 –SBM 50 –Union Bank 6.10 –Financial InstitutionsIFCI 357.58 –
(viii) In our opinion and according to the information and explanations given to us, the Company has no loans or borrowings
payable to government.
The Company has defaulted in repayment of loans/ borrowings to the following banks and financial institutions:
The Company is enjoying working capital facility where interest overdrawn amounts to `527 lakhs. As on 31/03/2018.
The Company has not defaulted in repayment of dues to debentureholders.
Further, during the year, the Company delayed in repayment of dues to banks and financial institutions as detailed below:

SPML Infra Limited Annual Report 2017-18104
(ix) The Company did not raise any money by way of initial public offer or further public offer (including debt instruments) during the year. In our opinion, the term loans were applied for the purpose for which the loans were obtained.
(x) According to the information and explanations given to us, no material fraud by the Company or on the Company by its officers or employees has been noticed or reported during the period covered by our audit.
(xi) Managerial remuneration has been paid and provided by the Company in accordance with the requisite approvals mandated by the provisions of section 197 of the Act read with Schedule 5 to the Act.
(xii) In our opinion, the Company is not a Nidhi Company. Accordingly, provisions of clause 3(xii) of the Order are not applicable.
(xiii) In our opinion, all transaction with the related parties are in compliance with sections 177 and 188 of the Act, where applicable, and the requisite details have been disclosed in the standalone Ind AS financial statements as required by the applicable Ind AS.
(xiv) During the year, the Company has not made any
preferential allotment or private placement of shares or fully or partly convertible debentures except for allotment of optionally convertible debentures during the year to the lenders pursuant to the Scheme for Sustainable Structuring of Stressed Assets (S4A Scheme) adopted by the Joint Lender’s Forum as stated in note 13 and note 15 to the standalone financial statements.
(xv) In our opinion, the Company has not entered into any non-cash transactions with directors or persons connected with them covered under section 192 of the Act.
(xvi) In our opinion, the Company is not required to be registered under section 45-IA of the Reserve Bank of India Act 1934.
For Maheshwari & Associates Chartered Accountants FRN: 311008E
CA. Bijay MurmuriaPlace: Kolkata Partner Date: 23rd May, 2018 Membership No. : 055788

105Statutoryreports
Corporate Overview
Financial statements
We have audited the internal financial controls over financial reporting of SPML Infra Limited (“the Company”) as of March 31, 2018 in conjunction with our audit of the standalone Ind AS financial statements of the Company for the year ended on that date.
Management’s Responsibility for Internal Financial Controls The Board of Directors of the Company is responsible for establishing and maintaining internal financial controls based on the internal control over financial reporting criteria established by the Company considering the essential components of internal control stated in the Guidance Note on Audit of Internal Financial Controls Over Financial Reporting issued by the Institute of Chartered Accountants of India (ICAI). These responsibilities include the design, implementation and maintenance of adequate internal financial controls that were operating effectively for ensuring the orderly and efficient conduct of its business, the safeguarding of its assets, the prevention and detection of frauds and errors, the accuracy and completeness of the accounting records, and the timely preparation of reliable financial information, as required under the Companies Act, 2013.
Auditors’ ResponsibilityOur responsibility is to express an opinion on the Company’s internal financial controls over financial reporting based on our audit. We conducted our audit in accordance with the Guidance Note on Audit of Internal Financial Controls Over Financial Reporting (the “Guidance Note”) and the Standards on Auditing, issued by ICAI and deemed to be prescribed under section 143(10) of the Act, to the extent applicable to an audit of internal financial controls. Those Standards and the Guidance Note require that we comply with ethical requirements and plan and perform the audit to obtain reasonable assurance about whether adequate internal financial controls over financial reporting was established and maintained and if such controls operated effectively in all material respects. Our audit involves performing procedures to obtain audit evidence about the adequacy of the internal financial controls system over financial reporting and their operating effectiveness. Our audit of internal financial controls over financial reporting included obtaining an understanding of internal financial controls over financial reporting, assessing the risk that a material weakness exists, and testing and evaluating the design and operating effectiveness of internal control based on the assessed risk. The procedures selected depend on the auditor’s judgment, including the assessment of the risks of material misstatement of the financial statements, whether due to fraud or error. We believe that the audit evidence we have obtained, is sufficient and appropriate to provide a basis for our audit opinion on the Company’s internal financial controls system over financial reporting.
Meaning of Internal Financial Controls Over Financial Reporting A Company’s internal financial control over financial reporting is a process designed to provide reasonable assurance regarding the reliability of financial reporting and the preparation of financial statements for external purposes in accordance with generally accepted accounting principles. A Company’s internal financial control over financial reporting includes those policies and procedures that (1) pertain to the maintenance of records that, in reasonable detail, accurately and fairly reflect the transactions and dispositions of the assets of the Company; (2) provide reasonable assurance that transactions are recorded as necessary to permit preparation of financial statements in accordance with generally accepted accounting principles, and that receipts and expenditures of the Company are being made only in accordance with authorizations of management and directors of the Company; and (3) provide reasonable assurance regarding prevention or timely detection of unauthorized acquisition, use, or disposition of the Company’s assets that could have a material effect on the financial statements.
Inherent Limitations of Internal Financial Controls over Financial Reporting Because of the inherent limitations of internal financial controls over financial reporting, including the possibility of collusion or improper management override of controls, material misstatements due to error or fraud may occur and not be detected. Also, projections of any evaluation of the internal financial controls over financial reporting to future periods are subject to the risk that the internal financial control over financial reporting may become inadequate because of changes in conditions, or that the degree of compliance with the policies or procedures may deteriorate.
Opinion In our opinion, to the best of our information and according to the explanations given to us, the Company has, in all material respects, an adequate internal financial controls system over financial reporting and such internal financial controls over financial reporting were operating effectively as at March 31, 2018, based on the internal control over financial reporting criteria established by the Company considering the essential components of internal control stated in the Guidance Note on Audit of Internal Financial Controls Over Financial Reporting issued by the Institute of Chartered Accountants of India.
For Maheshwari & Associates Chartered Accountants FRN: 311008E
CA. Bijay MurmuriaPlace: Kolkata Partner Date: 23rd May, 2018 Membership No. : 055788
Report on the Internal Financial Controls under Clause (i) of Sub-section 3 of Section 143 of the Companies Act, 2013 (“the Act”)
“Annexure-B ”to the Independent Auditors’ Report of SPML Infra Limited
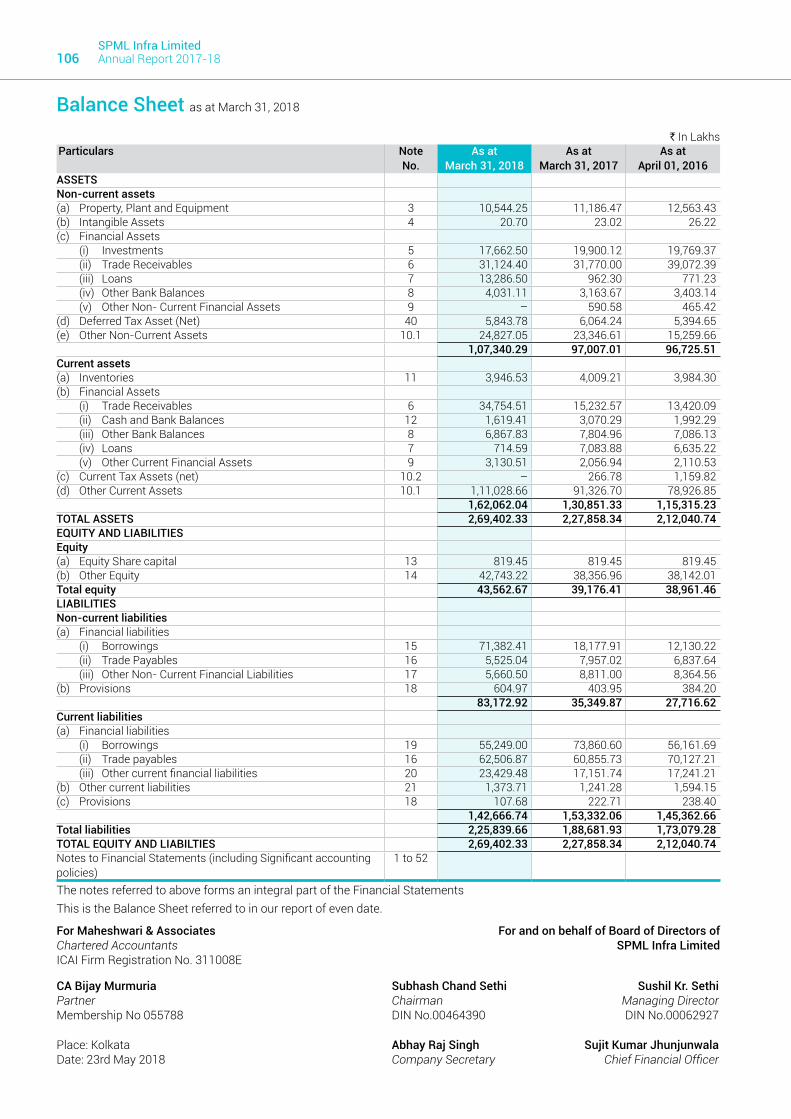
SPML Infra Limited Annual Report 2017-18106
` In Lakhs Particulars Note
No.As at
March 31, 2018As at
March 31, 2017As at
April 01, 2016ASSETSNon-current assets(a) Property, Plant and Equipment 3 10,544.25 11,186.47 12,563.43 (b) Intangible Assets 4 20.70 23.02 26.22 (c) Financial Assets
(i) Investments 5 17,662.50 19,900.12 19,769.37 (ii) Trade Receivables 6 31,124.40 31,770.00 39,072.39 (iii) Loans 7 13,286.50 962.30 771.23 (iv) Other Bank Balances 8 4,031.11 3,163.67 3,403.14 (v) Other Non- Current Financial Assets 9 – 590.58 465.42
(d) Deferred Tax Asset (Net) 40 5,843.78 6,064.24 5,394.65 (e) Other Non-Current Assets 10.1 24,827.05 23,346.61 15,259.66
1,07,340.29 97,007.01 96,725.51 Current assets(a) Inventories 11 3,946.53 4,009.21 3,984.30 (b) Financial Assets
(i) Trade Receivables 6 34,754.51 15,232.57 13,420.09 (ii) Cash and Bank Balances 12 1,619.41 3,070.29 1,992.29 (iii) Other Bank Balances 8 6,867.83 7,804.96 7,086.13 (iv) Loans 7 714.59 7,083.88 6,635.22 (v) Other Current Financial Assets 9 3,130.51 2,056.94 2,110.53
(c) Current Tax Assets (net) 10.2 – 266.78 1,159.82 (d) Other Current Assets 10.1 1,11,028.66 91,326.70 78,926.85
1,62,062.04 1,30,851.33 1,15,315.23 TOTAL ASSETS 2,69,402.33 2,27,858.34 2,12,040.74 EQUITY AND LIABILITIESEquity(a) Equity Share capital 13 819.45 819.45 819.45 (b) Other Equity 14 42,743.22 38,356.96 38,142.01 Total equity 43,562.67 39,176.41 38,961.46 LIABILITIESNon-current liabilities(a) Financial liabilities
(i) Borrowings 15 71,382.41 18,177.91 12,130.22 (ii) Trade Payables 16 5,525.04 7,957.02 6,837.64 (iii) Other Non- Current Financial Liabilities 17 5,660.50 8,811.00 8,364.56
(b) Provisions 18 604.97 403.95 384.20 83,172.92 35,349.87 27,716.62
Current liabilities(a) Financial liabilities
(i) Borrowings 19 55,249.00 73,860.60 56,161.69 (ii) Trade payables 16 62,506.87 60,855.73 70,127.21 (iii) Other current financial liabilities 20 23,429.48 17,151.74 17,241.21
(b) Other current liabilities 21 1,373.71 1,241.28 1,594.15 (c) Provisions 18 107.68 222.71 238.40
1,42,666.74 1,53,332.06 1,45,362.66 Total liabilities 2,25,839.66 1,88,681.93 1,73,079.28 TOTAL EQUITY AND LIABILTIES 2,69,402.33 2,27,858.34 2,12,040.74 Notes to Financial Statements (including Significant accounting policies)
1 to 52
The notes referred to above forms an integral part of the Financial StatementsThis is the Balance Sheet referred to in our report of even date.
For Maheshwari & Associates For and on behalf of Board of Directors ofChartered Accountants SPML Infra LimitedICAI Firm Registration No. 311008E
CA Bijay Murmuria Subhash Chand Sethi Sushil Kr. SethiPartner Chairman Managing DirectorMembership No 055788 DIN No.00464390 DIN No.00062927
Place: Kolkata Abhay Raj Singh Sujit Kumar JhunjunwalaDate: 23rd May 2018 Company Secretary Chief Financial Officer
Balance Sheet as at March 31, 2018
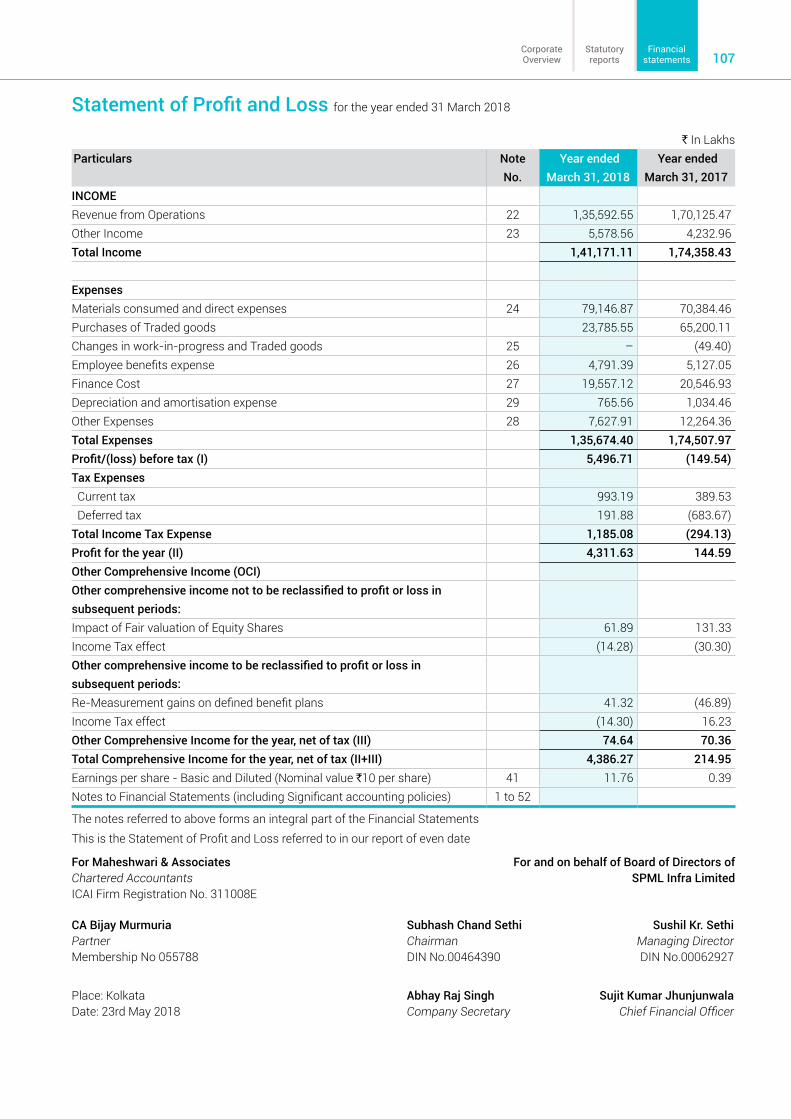
107Statutoryreports
Corporate Overview
Financial statements
` In Lakhs Particulars Note
No. Year ended
March 31, 2018 Year ended
March 31, 2017 INCOMERevenue from Operations 22 1,35,592.55 1,70,125.47 Other Income 23 5,578.56 4,232.96 Total Income 1,41,171.11 1,74,358.43
ExpensesMaterials consumed and direct expenses 24 79,146.87 70,384.46 Purchases of Traded goods 23,785.55 65,200.11 Changes in work-in-progress and Traded goods 25 – (49.40)Employee benefits expense 26 4,791.39 5,127.05 Finance Cost 27 19,557.12 20,546.93 Depreciation and amortisation expense 29 765.56 1,034.46 Other Expenses 28 7,627.91 12,264.36 Total Expenses 1,35,674.40 1,74,507.97 Profit/(loss) before tax (I) 5,496.71 (149.54)Tax Expenses Current tax 993.19 389.53 Deferred tax 191.88 (683.67)Total Income Tax Expense 1,185.08 (294.13)Profit for the year (II) 4,311.63 144.59 Other Comprehensive Income (OCI) Other comprehensive income not to be reclassified to profit or loss in subsequent periods:Impact of Fair valuation of Equity Shares 61.89 131.33 Income Tax effect (14.28) (30.30)Other comprehensive income to be reclassified to profit or loss in subsequent periods:Re-Measurement gains on defined benefit plans 41.32 (46.89)Income Tax effect (14.30) 16.23 Other Comprehensive Income for the year, net of tax (III) 74.64 70.36 Total Comprehensive Income for the year, net of tax (II+III) 4,386.27 214.95 Earnings per share - Basic and Diluted (Nominal value `10 per share) 41 11.76 0.39 Notes to Financial Statements (including Significant accounting policies) 1 to 52
The notes referred to above forms an integral part of the Financial StatementsThis is the Statement of Profit and Loss referred to in our report of even date
For Maheshwari & Associates For and on behalf of Board of Directors ofChartered Accountants SPML Infra LimitedICAI Firm Registration No. 311008E
CA Bijay Murmuria Subhash Chand Sethi Sushil Kr. SethiPartner Chairman Managing DirectorMembership No 055788 DIN No.00464390 DIN No.00062927
Place: Kolkata Abhay Raj Singh Sujit Kumar JhunjunwalaDate: 23rd May 2018 Company Secretary Chief Financial Officer
Statement of Profit and Loss for the year ended 31 March 2018

SPML Infra Limited Annual Report 2017-18108
Statement of Changes in Equity for the year ended 31 March 2018
A) Equity Share Capital (also refer note 13) ` In Lakhs Particulars Subscribed and
Fully Paid-up Total Equity share capital
No. of Shares Amount Amount As at April 1, 2016 3,66,50,276 819.45 819.45 As at March 31, 2017 3,66,50,276 819.45 819.45 As at March 31, 2018 3,66,50,276 819.45 819.45
B) Other Equity (also refer note 14) ` In Lakhs Particulars Reserves and Surplus Total
Capital Reserve
Securities Premium Account
General Reserve
Retained earnings
Balance as at April 1, 2016 885.73 15,263.80 5,929.05 16,063.43 38,142.01 Profit for the year – – – 144.59 144.59 Other comprehensive income for the year, net of tax – – – 70.36 70.36 Total comprehensive income – – – 214.95 214.95
Balance as at March 31, 2017 885.73 15,263.80 5,929.05 16,278.38 38,356.96 Profit for the year – – – 4,311.63 4,311.63 Other comprehensive income for the year, net of tax – – – 74.64 74.64 Total comprehensive income for the year – – – 4,386.27 4,386.27
Balance as at March 31, 2018 885.73 15,263.80 5,929.05 20,664.65 42,743.22 Notes to Financial Statements (including Significant Accounting Policies)
1 to 52
The notes referred to above forms an integral part of the Financial Statements
This is the Statement of Changes in Equity referred to in our report of even date
For Maheshwari & Associates For and on behalf of Board of Directors ofChartered Accountants SPML Infra LimitedICAI Firm Registration No. 311008E
CA Bijay Murmuria Subhash Chand Sethi Sushil Kr. SethiPartner Chairman Managing DirectorMembership No 055788 DIN No.00464390 DIN No.00062927
Place: Kolkata Abhay Raj Singh Sujit Kumar JhunjunwalaDate: 23rd May 2018 Company Secretary Chief Financial Officer

109Statutoryreports
Corporate Overview
Financial statements
Cash Flow Statement for the year ended 31 March 2018
` In Lakhs Particulars Year ended
March 31, 2018 Year ended
March 31, 2017 A. CASH FLOWS FROM OPERATING ACTIVITIES
Profit before tax 5,496.71 (149.54)Adjustments for:
Depreciation and Amortisation expenses 765.56 1,034.46 Interest Expenses 16,662.63 16,115.84 Company's share in (profit) /loss of Joint Ventures – – Bad debts written off 1,520.67 4,582.74 Provision for diminution in value of Investment 16.24 – Provision for Trade Receivable 1,023.18 2,857.40 Profit on sale of property plant and equipment – (734.54)profit on sale of Investment (973.30) – Provisions/unspent Liabilities no longer required written back (1,245.08) (144.91)Interest Income (3,202.46) (11,826.86)
Operating Profit before Working Capital changes 20,064.16 11,734.59 Adjustment for:
Increase in trade payables 33,851.25 (8,007.19)Increase/(decrease) in provisions 160.63 74.42 Increase in other current liabilities 5,730.26 (573.31)Increase in trade receivables (21,420.19) (1,950.24)Decrease/ (increase) in inventories 62.68 (24.91)Increase in loans and advances (3,297.56) 459.40 Increase in other current assets (23,618.86) (19,246.58)
Cash generated/(used) from operations 11,532.36 (17,533.82)Taxes Paid (net of refunds) 2,065.77 (722.64)Net Cash from Operating Activities 13,598.13 (18,256.46)
B. CASH FLOWS FROM INVESTING ACTIVITIESPurchase of PPE including capital work in progress and capital advances (122.02) – Proceeds from sale of PPE – 1,080.22 Advance given for purchase of shares – – Profit from Joint Venture – – Fixed Deposits encashed/matured 69.69 (479.37)Sale / (purchase) of non-current investments 3,194.67 (130.74)Loans refunded by other related party (727.74) (1,099.13)Interest received 2,393.32 11,755.29 Net Cash generated/(used) in Investing Activities 4,807.92 11,126.27
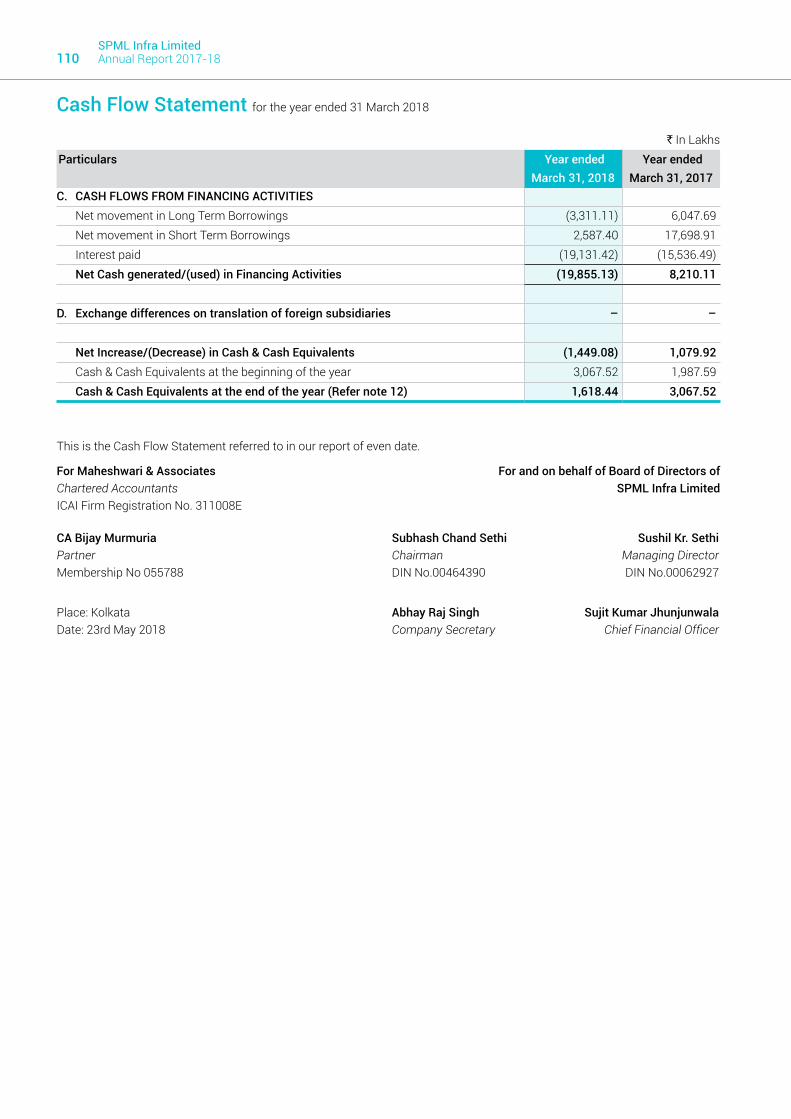
SPML Infra Limited Annual Report 2017-18110
` In Lakhs Particulars Year ended
March 31, 2018 Year ended
March 31, 2017 C. CASH FLOWS FROM FINANCING ACTIVITIES
Net movement in Long Term Borrowings (3,311.11) 6,047.69 Net movement in Short Term Borrowings 2,587.40 17,698.91 Interest paid (19,131.42) (15,536.49)Net Cash generated/(used) in Financing Activities (19,855.13) 8,210.11
D. Exchange differences on translation of foreign subsidiaries – –
Net Increase/(Decrease) in Cash & Cash Equivalents (1,449.08) 1,079.92 Cash & Cash Equivalents at the beginning of the year 3,067.52 1,987.59 Cash & Cash Equivalents at the end of the year (Refer note 12) 1,618.44 3,067.52
Cash Flow Statement for the year ended 31 March 2018
This is the Cash Flow Statement referred to in our report of even date.
For Maheshwari & Associates For and on behalf of Board of Directors ofChartered Accountants SPML Infra LimitedICAI Firm Registration No. 311008E
CA Bijay Murmuria Subhash Chand Sethi Sushil Kr. SethiPartner Chairman Managing DirectorMembership No 055788 DIN No.00464390 DIN No.00062927
Place: Kolkata Abhay Raj Singh Sujit Kumar JhunjunwalaDate: 23rd May 2018 Company Secretary Chief Financial Officer

111Statutoryreports
Corporate Overview
Financial statements
Standalone Financial Statement as at and for the year ended 31st March, 2018
Summary of significant accounting policies and other explanatory information to the standalone financial statements as at and for the year ended 31st March, 2018. (All amount in INR lakhs, unless otherwise stated)
CORPORATE INFORMATIONSPML Infra Limited (the Company) is a public limited company domiciled in India and incorporated under the provisions of the Companies Act, 1956. Its equity shares are listed on premier stock exchanges of India viz. BSE Limited and National Stock Exchange of India Limited. The Company is engaged in the business of infrastructure development which inter-alia includes water management, water infrastructure development, waste water treatment, power generation, transmission and distribution, solid waste management, and other civil infrastructures.
These standalone financial statements for the year ended 31st March, 2018 have been approved by the Board of Directors on 23rd May, 2018.
1. SIGNIFICANT ACCOUNTING POLICIES(i) Basis of Preparation and compliance with the Indian Accounting Standards (Ind AS)
a) For all periods up to and including the year ended 31st March 2017, the Company prepared its financial statements on going concern basis under the historical cost concept, in accordance with the generally accepted accounting principles in India and in compliance with the applicable accounting standards notified under the section 133 of the Companies Act 2013, read with Rules 7 of the Companies (Accounts) Rules, 2014 (as amended) (“Indian GAAP”).
These financial statements for the year ended 31st March 2018 have been prepared in accordance with Indian Accounting Standards (“Ind-AS”) consequent to the notification of The Companies (Indian Accounting Standards) Rules, 2015 (the Rules) issued by the MCA. These are the first Ind-AS financial statements of the Company, wherein the Company has restated its Balance Sheet as at 1st April 2016 (the date of transition) and financial statements for the year ended and as at 31st March 2017 also as per Ind-AS.
b) The estimates at 1st April 2016 and at 31st March 2017 are consistent with those made for the same dates in accordance with Indian GAAP (after adjustments to reflect any differences in accounting policies). The estimates used by the Company to present these amounts in accordance with Ind-AS reflect conditions at 1st April 2016 and as of 31st March 2017.
c) In accordance with Ind-AS 101, the Company has presented reconciliations of Shareholders’ equity under Previous GAAP and Ind AS as at 31st March 2017, and 1st April 2016 and of the Profit after Tax as per Previous GAAP and Total Comprehensive Income under Ind AS for the year ended 31st March 2017.
(ii) Accounting Estimates The preparation of the financial statements, in conformity with the recognition and measurement principles of Ind AS,
requires the management to make estimates and assumptions that affect the reported amounts of assets & liabilities and disclosure of contingent liabilities as at the date of financial statements and the results of operation during the reported period. Although these estimates are based upon management’s best knowledge of current events and actions, actual results could differ from these estimates which are recognized in the period in which they are determined.
(iii) Current and Non-current classifications The Company presents assets and liabilities in the balance sheet based on current/ non-current classification. An asset is
treated as current when it is:
- Expected to be realised or intended to be sold or consumed in normal operating cycle,
- Held primarily for the purpose of trading,
- Expected to be realised within twelve months after the reporting period, or
- Cash or cash equivalent treated as current unless restricted from being exchanged or used to settle a liability for at least twelve months after the reporting period.
All other assets are classified as non-current.
A liability is current when:
- It is expected to be settled in normal operating cycle,
- It is held primarily for the purpose of trading,
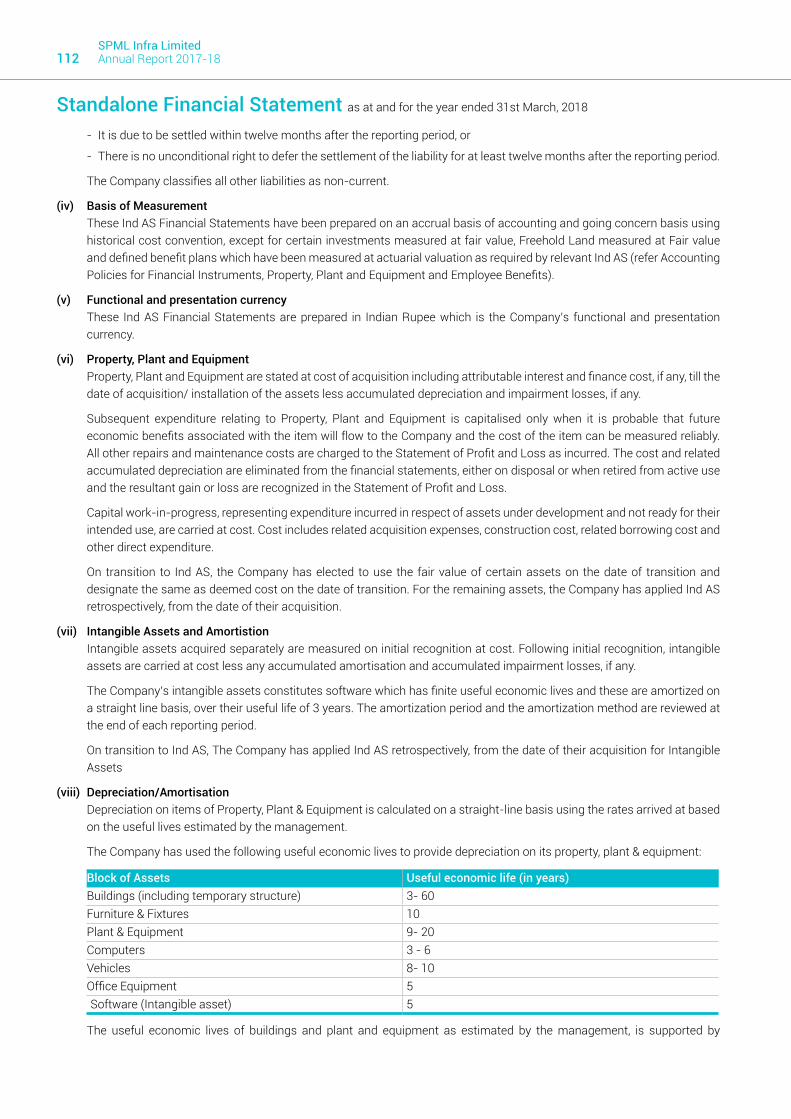
SPML Infra Limited Annual Report 2017-18112
- It is due to be settled within twelve months after the reporting period, or
- There is no unconditional right to defer the settlement of the liability for at least twelve months after the reporting period.
The Company classifies all other liabilities as non-current.
(iv) Basis of Measurement These Ind AS Financial Statements have been prepared on an accrual basis of accounting and going concern basis using
historical cost convention, except for certain investments measured at fair value, Freehold Land measured at Fair value and defined benefit plans which have been measured at actuarial valuation as required by relevant Ind AS (refer Accounting Policies for Financial Instruments, Property, Plant and Equipment and Employee Benefits).
(v) Functional and presentation currency These Ind AS Financial Statements are prepared in Indian Rupee which is the Company’s functional and presentation
currency.
(vi) Property, Plant and Equipment Property, Plant and Equipment are stated at cost of acquisition including attributable interest and finance cost, if any, till the
date of acquisition/ installation of the assets less accumulated depreciation and impairment losses, if any.
Subsequent expenditure relating to Property, Plant and Equipment is capitalised only when it is probable that future economic benefits associated with the item will flow to the Company and the cost of the item can be measured reliably. All other repairs and maintenance costs are charged to the Statement of Profit and Loss as incurred. The cost and related accumulated depreciation are eliminated from the financial statements, either on disposal or when retired from active use and the resultant gain or loss are recognized in the Statement of Profit and Loss.
Capital work-in-progress, representing expenditure incurred in respect of assets under development and not ready for their intended use, are carried at cost. Cost includes related acquisition expenses, construction cost, related borrowing cost and other direct expenditure.
On transition to Ind AS, the Company has elected to use the fair value of certain assets on the date of transition and designate the same as deemed cost on the date of transition. For the remaining assets, the Company has applied Ind AS retrospectively, from the date of their acquisition.
(vii) Intangible Assets and Amortistion Intangible assets acquired separately are measured on initial recognition at cost. Following initial recognition, intangible
assets are carried at cost less any accumulated amortisation and accumulated impairment losses, if any.
The Company’s intangible assets constitutes software which has finite useful economic lives and these are amortized on a straight line basis, over their useful life of 3 years. The amortization period and the amortization method are reviewed at the end of each reporting period.
On transition to Ind AS, The Company has applied Ind AS retrospectively, from the date of their acquisition for Intangible Assets
(viii) Depreciation/Amortisation Depreciation on items of Property, Plant & Equipment is calculated on a straight-line basis using the rates arrived at based
on the useful lives estimated by the management.
The Company has used the following useful economic lives to provide depreciation on its property, plant & equipment:
Block of Assets Useful economic life (in years)Buildings (including temporary structure) 3- 60Furniture & Fixtures 10Plant & Equipment 9- 20Computers 3 - 6 Vehicles 8- 10Office Equipment 5Software (Intangible asset) 5
The useful economic lives of buildings and plant and equipment as estimated by the management, is supported by
Standalone Financial Statement as at and for the year ended 31st March, 2018

113Statutoryreports
Corporate Overview
Financial statements
independent assessment by professionals, are lower than those indicated in Schedule II to the Companies Act, 2013. The residual values, useful lives and methods of depreciation of property, plant and equipment are reviewed and adjusted, if appropriate, at the end of each reporting period.
The Company’s intangible assets constitutes software which has finite useful economic lives and these are amortized on a straight line basis, over their useful life of 3 years. The amortization period and the amortization method are reviewed at the end of each reporting period.
(ix) Impairment of Property, Plant & Equipment and Intangible Assets The carrying amount of assets are reviewed at each balance sheet date to determine if there is any indication of impairment
based on external or internal factors. An impairment loss is recognized wherever the carrying amount of an asset exceeds its recoverable amount which represents the greater of the net selling price of assets and their ‘value in use’. The estimated future cash flows are discounted to their present value using pre-tax discount rates and risks specific to the asset.
(x) Borrowing Costs Borrowing cost includes interest, amortization of ancillary costs incurred in connection with the arrangement of borrowings
measured at Effective Interest rate (EIR).
Borrowing costs directly attributable to the acquisition, construction or production of an asset that necessarily takes a substantial period of time to get ready for its intended use or sale are capitalized as part of the cost of the respective asset.
All other borrowing costs are expensed in the period they are incurred.
(xi) Financial Instruments A financial instrument is any contract that gives rise to a financial asset of one entity and a financial liability or equity
instrument of another entity
Financial Assets: a) Classification The Company classifies its financial assets in the following measurement categories:
- those to be measured subsequently at fair value (either through other comprehensive income, or through profit or loss), and
- those measured at amortised cost.
The classification depends on the entity’s business model for managing the financial assets and the contractual terms of the cash flows.
b) Initial Recognition Financial assets are recognised initially at fair value considering the concept of materiality. Transaction costs that are
directly attributable to the acquisition of the financial asset (other than financial assets at fair value through profit or loss) are added to the fair value measured on initial recognition of financial assets.
c) Subsequent Measurement of Financial Assets Financial assets are subsequently measured at amortized cost if they are held within a business whose objective is to
hold these assets in order to collect contractual cash flows and the contractual terms of the financial asset give rise on specified dates to cash flows that are solely payments of principal and interest on the principal amount outstanding.
Financial assets at fair value through other comprehensive income (FVTOCI): Financial assets are subsequently measured at fair value through other comprehensive income (FVTOCI), if it is held within a business model whose objective is achieved by both from collection of contractual cash flows and selling the financial assets, where the assets’ cash flows represent solely payments of principal and interest. Further equity instruments where the Company has made an irrevocable election based on its business model, to classify as instruments measured at FVTOCI, are measured subsequently at fair value through other comprehensive income.
d) Impairment of Financial Assets ‘The Company assesses on a forward looking basis the expected credit losses associated with its assets carried at
amortised cost and FVTOCI debt instruments. The impairment methodology applied depends on whether there has been a significant increase in credit risk.
In accordance with Ind AS 109: Financial Instruments, the Company recognizes impairment loss allowance on trade
Standalone Financial Statement as at and for the year ended 31st March, 2018
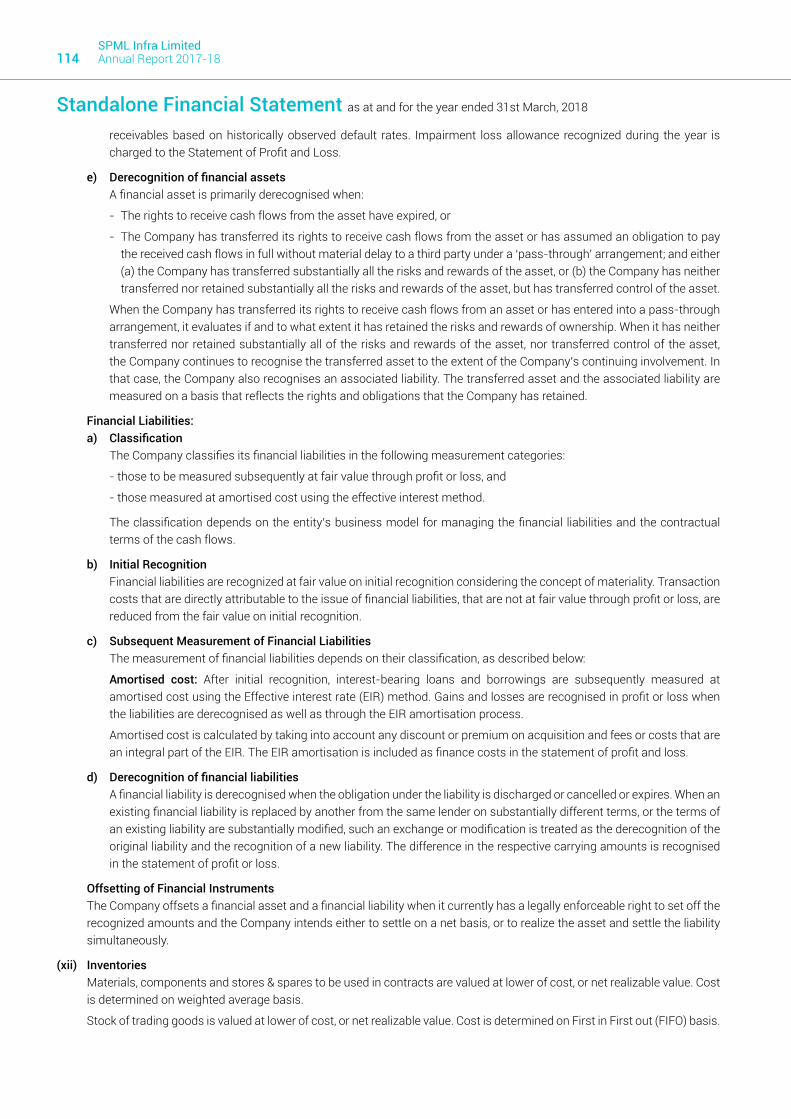
SPML Infra Limited Annual Report 2017-18114
receivables based on historically observed default rates. Impairment loss allowance recognized during the year is charged to the Statement of Profit and Loss.
e) Derecognition of financial assets A financial asset is primarily derecognised when:
- The rights to receive cash flows from the asset have expired, or
- The Company has transferred its rights to receive cash flows from the asset or has assumed an obligation to pay the received cash flows in full without material delay to a third party under a ‘pass-through’ arrangement; and either (a) the Company has transferred substantially all the risks and rewards of the asset, or (b) the Company has neither transferred nor retained substantially all the risks and rewards of the asset, but has transferred control of the asset.
When the Company has transferred its rights to receive cash flows from an asset or has entered into a pass-through arrangement, it evaluates if and to what extent it has retained the risks and rewards of ownership. When it has neither transferred nor retained substantially all of the risks and rewards of the asset, nor transferred control of the asset, the Company continues to recognise the transferred asset to the extent of the Company’s continuing involvement. In that case, the Company also recognises an associated liability. The transferred asset and the associated liability are measured on a basis that reflects the rights and obligations that the Company has retained.
Financial Liabilities: a) Classification The Company classifies its financial liabilities in the following measurement categories:
- those to be measured subsequently at fair value through profit or loss, and
- those measured at amortised cost using the effective interest method.
The classification depends on the entity’s business model for managing the financial liabilities and the contractual terms of the cash flows.
b) Initial Recognition Financial liabilities are recognized at fair value on initial recognition considering the concept of materiality. Transaction
costs that are directly attributable to the issue of financial liabilities, that are not at fair value through profit or loss, are reduced from the fair value on initial recognition.
c) Subsequent Measurement of Financial Liabilities The measurement of financial liabilities depends on their classification, as described below:
Amortised cost: After initial recognition, interest-bearing loans and borrowings are subsequently measured at amortised cost using the Effective interest rate (EIR) method. Gains and losses are recognised in profit or loss when the liabilities are derecognised as well as through the EIR amortisation process.
Amortised cost is calculated by taking into account any discount or premium on acquisition and fees or costs that are an integral part of the EIR. The EIR amortisation is included as finance costs in the statement of profit and loss.
d) Derecognition of financial liabilities A financial liability is derecognised when the obligation under the liability is discharged or cancelled or expires. When an
existing financial liability is replaced by another from the same lender on substantially different terms, or the terms of an existing liability are substantially modified, such an exchange or modification is treated as the derecognition of the original liability and the recognition of a new liability. The difference in the respective carrying amounts is recognised in the statement of profit or loss.
Offsetting of Financial Instruments The Company offsets a financial asset and a financial liability when it currently has a legally enforceable right to set off the
recognized amounts and the Company intends either to settle on a net basis, or to realize the asset and settle the liability simultaneously.
(xii) Inventories Materials, components and stores & spares to be used in contracts are valued at lower of cost, or net realizable value. Cost
is determined on weighted average basis.
Stock of trading goods is valued at lower of cost, or net realizable value. Cost is determined on First in First out (FIFO) basis.
Standalone Financial Statement as at and for the year ended 31st March, 2018

115Statutoryreports
Corporate Overview
Financial statements
Net Realizable Value is the estimated selling price in the ordinary course of business, less estimated costs of completion and estimated cost necessary to make the sale.
(xiii) Unbilled Revenue Unbilled Revenue (WIP) is valued at net realizable value. NRV is the estimated selling price in the ordinary course of
business, less estimated costs of completion and estimated costs necessary to make the sale.
(xiv) Cash & Cash Equivalents Cash and cash equivalents in the balance sheet comprise cash at banks and on hand and short-term deposits with an
original maturity of three months or less, which are subject to an insignificant risk of changes in value. For the purpose of the statement of cash flows, cash and cash equivalents consist of cash and short-term deposits, as defined above.
(xv) Revenue Recognition a) Construction Contracts: Revenue from contracts is recognized on “percentage completion method” based on the stage of completion of the
contract. The stage of completion is determined as a proportion that contract costs incurred for work performed upto the reporting date bear to the estimated total costs. When it is probable that the total contract cost will exceed the total contract revenue, the future loss is recognized immediately. The future loss is adjusted with unbilled revenue. For this purpose, total contract costs are ascertained on the basis of actual costs incurred and costs to be incurred for completion of contracts in progress, which is arrived at by the management based on current technical data, forecasts and estimate of expenditure to be incurred in future including contingencies. Revisions in projected profit or loss arising from change in the estimates are reflected in each accounting period.
Overhead expenses representing indirect costs that cannot be directly aligned with the jobs are allocated over the various contracts on a systematic basis. Disputed claims towards extra work, damages etc. are accounted for on settlement of the arbitration proceedings / legal cases.
The Company collects Value Added Tax (VAT), Sales tax, Service tax and Goods and Services tax on behalf of the government and therefore, these are not economic benefits flowing to the Company and have been excluded from revenue.
Arbitration awards which are granted in favor of the Company by independent arbitrators are accounted for when the management is reasonably certain of its ultimate recovery. The interest granted on such awards is recognized as per terms of the award.
b) Sale of Goods Revenue from sale of goods is recognized when all the significant risks and rewards of ownership of the goods have
passed to the buyer, which generally coincides with delivery to the customers. The Company collects Goods and Service tax (GST) on behalf of the Government and therefore, these are not economic benefits flowing to the Company and have been excluded from Revenue.
c) Income from Services Revenue from Operation and Maintenance contracts are recognized as per terms of the contract as and when services
are rendered.
d) Interest income Interest income is recognized on a time proportion basis taking into account the amount outstanding and the applicable
Effective Interest Rate (EIR). EIR is the rate that exactly discounts the estimated future cash payments or receipts over the expected life of a financial asset or a financial liability to their gross carrying amount.
Interest and Dividend income are included under the head “other income” in the Statement of Profit and Loss.
e) Dividends Revenue for dividend income is recognized when the right to receive payment is established by the reporting date.
(xvi) Liquidated Damages No provision is made for liquidated damages deducted by the customers, wherever these have been refuted by the
Company and it expects to settle them without any loss. Pending settlement of these claims, the relative trade receivables are shown in the accounts as fully recoverable and the corresponding amounts are reflected as contingent liability.
Standalone Financial Statement as at and for the year ended 31st March, 2018

SPML Infra Limited Annual Report 2017-18116
(xvii) Leases A lease is classified at the inception date as a finance lease or an operating lease. A lease that transfers substantially all the
risks and rewards incidental to ownership to the Company is classified as a finance lease. All other leases are operating lease.
The determination of whether an arrangement is (or contains) a lease is based on the substance of the arrangement at the inception of the lease. The arrangement is, or contains, a lease if fulfilment of the arrangement is dependent on the use of a specific asset or assets and the arrangement conveys a right to use the asset or assets, even if that right is not explicitly specified in an arrangement. For arrangements entered into prior to 1 April 2016, the Company has determined whether the arrangement contains lease on the basis of facts and circumstances existing on the date of transition.
Operating lease payments are recognized as an expense in the statement of profit and loss on a straight-line basis over the lease term, unless the payments are structured to increase in line with expected general inflation to compensate for the lessor’s expected inflationary cost increases.
(xviii) Foreign Currency Translations Initial Recognition In the financial statements of the Company, transactions in foreign currencies are translated into the functional currency
at the exchange rates ruling at the date of the transaction.
Conversion Foreign currency monetary items are reported using the closing rate. Non-monetary items which are carried in terms
of historical cost denominated in a foreign currency are reported using the exchange rate at the date of the transaction and non-monetary items which are carried at fair value or other similar valuation denominated in a foreign currency are reported using the exchange rates that existed when the values were determined.
Exchange Differences Exchange differences arising on the settlement or reporting of monetary items at rates different from those at which they
were initially recorded during the period or reported in previous financial statements and / or on conversion of monetary items, are recognized at income or expense in the year in which they arise.
Forward Exchange Contracts (not intended for trading or speculation purpose) The premium or discount arising at the inception of forward exchange contracts is amortized at expense or income over
the life of the respective contracts. Exchange differences on such contracts are recognized in the Statement of Profit and Loss in the period in which the exchange rates change. Any profit or loss arising on cancellation or renewal of forward exchange contract is recognized as income or expense for the year.
(xix) Retirement and Other Employee Benefits Employee benefits (A) Short‐term employee benefits Employee benefits payable wholly within twelve months of receiving employee services are classified as short‐term
employee benefits. These benefits include salaries and wages, bonus and ex‐gratia.
Accumulated leave, which is expected to be utilized within the next 12 months, is treated as short-term employee benefit. The Company measures expected cost of such absences as the additional amount that it expects to pay as a result of the unused entitlement that has accumulated at the reporting date. Such short-term compensated absences are provided for in the Statement of Profit and Loss based on estimates.
(B) Post‐employment benefits The Company operates the following post‐employment schemes:
(i) Employee benefits in the form of Provident Fund is made to a government administered fund and charged as an expense to the Statement of Profit and Loss, when an employee renders the related service. There are no obligations other than the contributions payable to the fund.
(ii) Gratuity is administered through an approved benefit fund. Gratuity liability is defined benefit obligation and is provided for on the basis of an actuarial valuation on projected unit credit method done at the end of each financial year.
(iii) Re-measurements, comprising of actuarial gains and losses excluding amounts included in net interest on the net defined benefit liability and the return on plan assets (excluding amounts included in net interest on the net defined benefit liability), are recognised immediately in the balance sheet with a corresponding debit or credit to
Standalone Financial Statement as at and for the year ended 31st March, 2018

117Statutoryreports
Corporate Overview
Financial statements
retained earnings through Other Comprehensive Income in the period in which they occur. Re-measurements are not reclassified to profit or loss in subsequent periods.
(xx) Income Taxes Tax expense comprises of current (net of Minimum Alternate Tax (MAT) credit entitlement) and deferred tax.
Current income tax Current income tax is measured at the amount expected to be paid to the tax authorities in accordance with Indian Income
Tax Act. Management periodically evaluates positions taken in the tax returns Vis a Vis position taken in books of account which are subject to interpretation and creates provisions where appropriate.
Deferred tax Deferred tax is recognized on temporary differences between the tax bases and accounting bases of assets and liabilities
at the tax rates and laws that have been enacted or substantively enacted at the Balance Sheet date.
Deferred tax assets are recognized to the extent that it is probable that taxable profit will be available against which the deductible temporary differences can be utilized. The carrying amount of deferred tax assets is reviewed at each Balance Sheet date and reduced to the extent that it is no longer probable that sufficient taxable profit will be available to allow all or part of the deferred tax asset to be utilized. Unrecognized deferred tax assets are re-assessed at each reporting date and are recognized to the extent that it has become probable that future taxable profits will allow the deferred tax asset to be recovered.
For items recognized in OCI or equity, deferred / current tax is also recognized in OCI or equity.
(xxi) Provisions A provision is recognized when an enterprise has a present obligation as a result of past event; it is probable that an outflow
of resources will be required to settle the obligation, in respect of which a reliable estimate can be made.
If the effect of time value of money is material, provisions are discounted using a current pre-tax rate that reflects, when appropriate, the risks specific to the liability. When discounting is used the increase in the provision due to the passage of time is recognized as a finance cost.
(xxii) Contingent liabilities A contingent liability is a possible obligation that arises from past events whose existence will be confirmed by the
occurrence or non-occurrence of one or more uncertain future events beyond the control of the Company or a present obligation that is not recognized because it is not probable that an outflow of resources will be required to settle the obligation. The Company does not recognize a contingent liability but discloses its existence in the financial statements.
(xxiii) Earnings Per Share Basic Earnings per share is calculated by dividing the net profit or loss before OCI for the year by the weighted average
number of equity shares outstanding during the year. Partly paid equity shares are treated as a fraction of an equity share to the extent that they are entitled to participate in dividends relative to a fully paid equity share during the reporting period.
For the purpose of calculating diluted earnings per share, the net profit or loss for the year attributable to equity shareholders and the weighted average number of shares outstanding during the year are adjusted for the effects of all dilutive potential equity shares.
(xxiv) Accounting for Interests in Joint Ventures As per Ind AS 111-Joint Arrangements, investment in Joint Arrangement is classified as either Joint Operation or Joint
Venture. The classification depends on the contractual rights and obligations of each investor rather than legal structure of the Joint Arrangement.The Company classifies its Joint Arrangements as Joint Operations.The Company recognises its direct right to assets, liabilities, revenue and expenses of Joint Operations and its share of any jointly held or incurred assets, liabilities, revenues and expenses. These have been incorporated in the financial statements under the appropriate headings.
(xxv) Cash Flow Statement Cash flows are reported using indirect method as set out in Ind AS -7 “Statement of Cash Flows”, whereby profit / (loss)
before tax is adjusted for the effects of transactions of non-cash nature and any deferrals or accruals of past or future cash receipts or payments. The cash flows from operating, investing and financing activities of the Company are segregated based on the available information.
Standalone Financial Statement as at and for the year ended 31st March, 2018

SPML Infra Limited Annual Report 2017-18118
NO
TE 3
: PRO
PERT
Y, P
LAN
T AN
D EQ
UIP
MEN
T `
In L
akhs
Part
icul
ars
Fre
ehol
d
land
B
uild
ings
T
empo
rary
si
te s
heds
and
sh
utte
ring
mat
eria
ls
Pla
nt a
nd
mac
hine
ry
Fur
nitu
re a
nd
fixtu
res
Veh
icle
s S
ite o
ffice
/ eq
uipm
ents
T
otal
As a
t Apr
il 1,
201
6 7
,435
.52
1,6
84.3
5 2
,342
.17
6,5
74.9
3 1
,797
.74
1,1
88.9
9 2
,312
.94
23,
336.
64
Addi
tions
–
–
–
164
.68
18.
10
1.3
0 5
7.79
2
41.8
7 D
educ
tions
–
(224
.03)
–
(129
.95)
(230
.36)
–
(3.2
2) (5
87.5
6)As
at M
arch
31,
201
7 7
,435
.52
1,4
60.3
2 2
,342
.17
6,6
09.6
6 1
,585
.48
1,1
90.2
9 2
,367
.51
22,
990.
95
Addi
tions
–
–
1
6.65
6
0.83
1
3.34
1
1.20
1
8.97
1
20.9
9 Ad
just
men
tsD
educ
tions
–
–
–
–
–
–
–
–
As a
t Mar
ch 3
1, 2
018
7,4
35.5
2 1
,460
.32
2,3
58.8
2 6
,670
.49
1,5
98.8
2 1
,201
.49
2,3
86.4
8 2
3,11
1.94
DEP
RECI
ATIO
N A
ND
IMPA
IRM
ENT
As a
t Apr
il 1,
201
6 –
2
36.8
6 2
,305
.12
4,1
96.5
0 1
,190
.56
848
.65
1,9
95.5
2 1
0,77
3.21
Ch
arge
for t
he y
ear
–
29.
76
19.
01
563
.81
213
.59
85.
69
119
.38
1,0
31.2
4 D
educ
tions
––
––
––
– –
As
at M
arch
31,
201
7 –
2
66.6
2 2
,324
.13
4,7
60.3
1 1
,404
.15
934
.34
2,1
14.9
0 1
1,80
4.45
Ch
arge
for t
he y
ear
–
25.
53
6.3
0 5
86.1
0 4
0.09
7
3.36
3
1.87
7
63.2
5 D
educ
tions
–
–
–
–
–
–
–
–
As a
t Mar
ch 3
1, 2
018
–
292
.15
2,3
30.4
3 5
,346
.41
1,4
44.2
4 1
,007
.70
2,1
46.7
7 1
2,56
7.70
NET
BLO
CKAs
at A
pril
1, 2
016
7,4
35.5
2 1
,447
.49
37.
05
2,3
78.4
3 6
07.1
8 3
40.3
4 3
17.4
2 1
2,56
3.43
As
at M
arch
31,
201
7 7
,435
.52
1,1
93.7
0 1
8.04
1
,849
.32
181
.33
255
.95
252
.61
11,
186.
47
As a
t Mar
ch 3
1, 2
018
7,4
35.5
2 1
,168
.17
28.
39
1,3
24.0
9 1
54.5
8 1
93.7
9 2
39.7
1 1
0,54
4.25
Not
e : I
nd A
S 10
1 pe
rmits
an
entit
y to
ele
ct to
mea
sure
an
item
of p
rope
rty,
plan
t and
equ
ipm
ent a
t the
dat
e of
tran
sitio
n to
Ind
AS a
t its
fair
valu
e an
d us
e th
at fa
ir va
lue
as it
s de
emed
cos
t at t
hat d
ate.
Acc
ordi
ngly
, the
Com
pany
has
ele
cted
to u
se th
e fa
ir va
lue
of c
erta
in a
sset
s on
the
date
of t
rans
ition
and
des
igna
te th
e sa
me
as d
eem
ed c
ost o
n th
e da
te o
f tra
nsiti
on. F
air v
alue
has
bee
n de
term
ined
, by
obta
inin
g an
ext
erna
l thi
rd p
arty
val
uatio
n, a
leve
l 3 v
alua
tion
tech
niqu
e. F
or th
e re
mai
ning
ass
ets,
the
Com
pany
has
app
lied
Ind
AS re
trosp
ectiv
ely,
from
the
date
of t
heir
acqu
isiti
on.
Stan
dalo
ne F
inan
cial
Sta
tem
ent a
s at
and
for t
he y
ear e
nded
31s
t Mar
ch, 2
018

119Statutoryreports
Corporate Overview
Financial statements
NOTE 4: INTANGIBLE ASSET ` In Lakhs Particulars Computer
Softwares As at April 1, 2016 409.47 Additions – Deductions – As at March 31, 2017 409.47 Additions – Deductions – As at March 31, 2018 409.47
DEPRECIATION AND IMPAIRMENTAs at April 1, 2016 383.25 Charge for the year 3.20 Deductions – As at March 31, 2017 386.45 Charge for the year 2.32 Deductions – As at March 31, 2018 388.77
NET BLOCKAs at April 1, 2016 26.22 As at March 31, 2017 23.02 As at March 31, 2018 20.70
The Company has applied Ind AS retrospectively, from the date of their acquisition for Intangible Assets
NOTE 5: NON- CURRENT INVESTMENTS ` In Lakhs Particulars As at
March 31, 2018As at
March 31, 2017As at
April 1, 2016(A) Investment
(a) In Quoted Equity Instruments at FVOCI Arihant Leasing & Holding Limited24,000 (Previous year 24,000) equity shares of `10 each
0.75 0.75 0.75
Indian Arcylics Limited 100 (Previous year 100) equity shares of `10 each
0.01 0.01 0.01
Petrochem Industries Limited 500 (Previous year 500) equity shares of `10 each
0.14 0.14 0.14
Best and Crompton Engineering Limited200 (Previous year 200) equity shares of `10 each
0.10 0.10 0.10
SPML India Limited10,000 (Previous year 10,000) equity shares of `10 each
1.50 1.50 1.50
Hindustan Engineering & Industries Limited (Bonus Shares)4 (Previous year 4) equity shares of `10 each
– – –
(b) In Quoted Debt Instruments at Amortised Cost (fully paid-up)Escorts Tractors Limited25(Previous year 25) Debentures of `1 each
0.01 0.01 0.01
Hindustan Engineering & Industries Limited 110 (Previous year 110) Debentures of `1 each
0.06 0.06 0.06
2.57 2.57 2.57 Less: Provision for diminution in value of investments 2.56 2.56 2.56 Net quoted Investments 0.01 0.01 0.01
Standalone Financial Statement as at and for the year ended 31st March, 2018

SPML Infra Limited Annual Report 2017-18120
NOTE 5: NON- CURRENT INVESTMENTS ` In Lakhs Particulars As at
March 31, 2018As at
March 31, 2017As at
April 1, 2016(c) In Unquoted Equity Shares in Subsidiaries (Fully paid up) at
CostSubhash Kabini Power Corporation Limited*13,172,000 (Previous year 18,586,300) equity shares of `10 each.Of the above, 13,122,000 (Previous year 13,122,000) equity shares are under first pari passu charge with State Bank of India against Loan.
2,063.16 2,878.81 2,878.81
SPM Holdings Pte Limited* 392.28 392.28 392.28 Madurai Municipal Waste Processing Company Private Limited*5,878,000 (Previous year 5,878,000) equity shares of `10 each
587.80 587.80 587.80
Bhagalpur Electricity Distribution Company Private Limited1
10,000 (Previous year 10,000) equity shares of `10 each 1,219.93 1,219.93 1,219.93
Mizoram Infrastructure Development Company Limited34,500 (Previous year 34,500) equity shares of `10 each
5.00 5.00 5.00
SPML Infraprojects Limited250,000 (Previous year 250,000) equity shares of `2 each
– 5.00 5.00
SPML Infra Developers Limited250,000 (Previous year 250,000) equity shares of `2 each
5.00 5.00 5.00
Delhi Waste Management Limited*1
292,500 (Previous year 292,500) equity shares of `10 each 838.27 838.27 838.27
Mizoram Power Development Corporation Limited 89,625 (Previous year 89,625) equity shares of `10 each
– – 8.91
Neogal Power Company Private Limited*1,136,774 (Previous year 8,736,774) equity shares of `1 each
66.61 512.86 512.86
Awa Power Company Private Limited*2,639,605 (Previous year 11,639,605) equity shares of `1 each
203.28 896.09 896.09
Luni Power Company Private Limited7,049,597 (Previous year 7,049,597) equity shares of `1 each
337.92 337.92 337.92
IQU Power Company Private Limited2,580,500 (Previous year 8,580,500) equity shares of `1 each. Of the above, 2,506,875 (Previous year 2,506,875) equity shares are pledged with Punjab National Bank against loans obtained by the said investee Company.
412.57 741.03 741.03
Binwa Power Company Private Limited1
2,948,340 (Previous year 2,948,340) equity shares of `1 each 436.09 436.09 436.09
SPML Energy Limited 99,550,000 (Previous year 99,550,000) equity shares of `1 each
466.94 466.94 466.94
SPML Infrastructure Limited1 2
7,432,000 (Previous year 4,964,500) equity shares of `1 each (Refer Note 2)
2,946.62 2,946.62 2,946.62
Subhas Urja Private Limited10,000 (Previous year 10,000) equity shares of `10 each
1.00 1.00 1.00
SPML Utilities Limited1
200,000,000 (Previous year 200,000,000) equity shares of `1 each 762.30 762.30 762.30
Doon Valley Waste Management Private Limited1
25,000 (Previous year 25,000) equity shares of `10 each 2.50 2.50 2.50
Mathura Nagar Waste Processing Company Limited*1
255,000 (Previous year 255,000) equity shares of `1 each 2.55 2.55 2.55
Standalone Financial Statement as at and for the year ended 31st March, 2018

121Statutoryreports
Corporate Overview
Financial statements
NOTE 5: NON- CURRENT INVESTMENTS ` In Lakhs Particulars As at
March 31, 2018As at
March 31, 2017As at
April 1, 2016Allahabad Waste Processing Company Limited*1
255,000 (Previous year 255,000) equity shares of `1 each 2.55 2.55 2.55
10,752.37 13,040.54 13,049.45 Less: Provision for diminution in value of investments 1,042.49 1,047.49 1,056.40
9,709.88 11,993.05 11,993.05 (d) In Unquoted Equity Shares in Associates (Fully paid up) at Cost
Bhilwara Jaipur Toll Road Private Limited*3,520,302 (Previous year 3,520,302) equity shares of `10 each.Of the above, 12,49,336 (Previous year 12,49,336) equity shares are pledged with ICICI Bank and Punjab National Bank against loans obtained by the said investee Company.
5,191.38 5,191.38 5,191.38
Mizoram Mineral Development Corporation Limited 73,500 (Previous year 73,500) equity shares of `10 each
– – 7.30
Aurangabad Jal Supply Solution Private Limited2,600 (Previous year 2,600) equity shares of `10 each
0.26 0.26 0.26
Aurangabad Jal Construction Private Limited (Formerly Essel Water Utility Company Private Limited)2,600 (Previous year 2,600) equity shares of `10 each
0.26 0.26 0.26
SPML Bhiwandi Water Supply Infra Limited1
224,700 (Previous year 224,700) equity shares of `1 each 2.25 2.25 2.25
SPML Bhiwandi Water Supply Management Limited1
250,000 (Previous year 250,000) equity shares of `1 each 2.50 2.50 2.50
5,196.65 5,196.65 5,203.95 Less: Provision for diminution in value of investments – – 7.30
5,196.65 5,196.65 5,196.65 (e) In Unquoted Equity Shares in Joint Operations (Fully paid up) at
CostOm Metal Consortium 718.46 718.46 719.58 Siddarth - Mahaveer - SPML JV 88.27 92.15 97.72 SPML - Simplex JV 31.34 28.61 25.39 SPML - CISC JV 3.37 20.06 18.90 M&P + Subhash JV 15.04 13.54 11.81
(f) In Unquoted Equity Shares in Joint Venture (Fully paid up) at CostMalviya Nagar Water Services Private Limited 2,205,000 (Previous year 2,205,000) equity shares of `10 each
220.50 220.50 220.50
Gurha Thermal Power Company Limited25,000 (Previous year 25,000) equity shares of `10 each
2.50 2.50 2.50
Aurangabad City Water Utility Limited 104.77 104.77 104.77 MVV Water Utility Private Limited TYPE A Shares10,000 (Previous year 10,000) equity shares of `10 each
1.00 1.00 1.00
MVV Water Utility Private Limited TYPE B Shares364,693 (Previous year 364,693) equity shares of `10 each
0.42 0.42 0.42
1,185.67 1,202.01 1,202.59 (g) In Unquoted Equity Instruments at FVOCI
Bharat Hydro Power Corporation Limited 3,294,150 (Previous year 3,294,150) equity shares of `10 each
1,114.22 1,052.33 921.00
Standalone Financial Statement as at and for the year ended 31st March, 2018

SPML Infra Limited Annual Report 2017-18122
NOTE 5: NON- CURRENT INVESTMENTS ` In Lakhs Particulars As at
March 31, 2018As at
March 31, 2017As at
April 1, 2016Om Metal - SPML Infraproject Private Limited 4,999 (Previous year 4,999) equity shares of `10 each
0.50 0.50 0.50
Pondicherry Port Limited (Other Investments)100 (Previous year 100) equity shares of `10 each
0.01 0.01 0.01
Jarora Nayagaon Toll Road Company Private Limited500 (Previous year 500) equity shares of `10 each. The equity shares are pledged with OBC Bank against loans obtained by the said investee Company.
0.05 0.05 0.05
1,114.78 1,052.89 921.56 (h) In Unquoted Debt Instruments at Amortised cost
Allahabad Waste Processing Company Private Limited5,000,000 (Previous year 5,000,000) Preference Shares of `1 each
450.00 450.00 450.00
450.00 450.00 450.00 (i) In Others at FVTPL
National Saving Certificate 0.52 0.52 0.52 Mutual funds50,000 units of `10 each
5.00 5.00 5.00
5.52 5.52 5.52 Total 17,662.50 19,900.12 19,769.37
Aggregate value of investmentsQuoted (net of provision in value of diminution) 0.01 0.01 0.01 Unquoted (net of provision in value of diminution) 17,662.49 19,900.11 19,769.36 Market value of quoted investment – – –
* The Investments in these companies include the impact of IND AS adjustments on account of fair valuation of Corporate Guarantees extended by the Company (SPML Infra Limited) against the financial assistence availed by them.
Notes:1. On Pledge of Investments as held by SPML Infra Limited in other Group Companies: Investments of SPML Infra Limited i.e. 19,99,99,700 Equity Shares in SPML Utilities Limited; 49,64,500 Equity Shares in
SPML Infrastructure Limited; 2,55,000 Equity Shares in Allahabad Waste Processing Company Limited; 9,999 Equity Shares in Bhagalpur Electricity Distribution Power Corporation Limited; 29,48,340 Equity Shares in Binwa Power Company Private Limited; 2,92,500 Equity Shares in Delhi Waste Management Limited; 25,000 Equity Shares in Doon Valley Waste Management Private Limited; 2,55,000 Equity Shares in Mathura Nagar Waste Processing Company Limited; 2,24,700 Equity Shares in SPML Bhiwandi Water Supply Infra Limited; 2,49,700 Equity Shares in SPML Bhiwandi Water Supply Management Limited has been pledged as on the Balance Sheet signing date in favour of the SBICAP Trustee/ S4A Lenders for securing the due repayment of the Debts as restructured under the “SPML S4A Scheme” as approved by the Overseeing Committee (governed under RBI) with the super majority of the Lenders Banks.
2. Change in number of shares held on account of merger of various investments held by SPML Infra Limited SPML Infra Limited has filed the merger petition with the National Company Law Tribunal (NCLT) with the proposal to merge
the ADD Urban Enviro Limited (“Transferor Company No 1”) and Jamshedpur Waste Processing Company Private Limited (“Transferor Company No 2”) with the Company. The scheme of amalgmation was approved by Hon,ble NCLT bench at Bangalore and accordingly the merger order was passed vide order dated 31st January 2018 giving the effective date of 1st April 2016. Accordingly SPML Infra Limited has adjusted the necessary investment entries in the books.
Standalone Financial Statement as at and for the year ended 31st March, 2018

123Statutoryreports
Corporate Overview
Financial statements
NOTE 6: TRADE RECEIVABLES (at amortised cost) ` In Lakhs
Particulars Non-current CurrentAs at
March 31, 2018
As at March 31,
2017
As atApril 1, 2016
As at March 31,
2018
As at March 31,
2017
As atApril 1, 2016
Trade Receivables - Others 31,124.40 31,770.00 39,072.39 29,668.88 10,218.73 8,819.66 Trade Receivables - Related Parties – – – 5,085.63 5,013.84 4,600.43 Total Trade Receivables 31,124.40 31,770.00 39,072.39 34,754.51 15,232.57 13,420.09
` In Lakhs Name Non-current Current
As at March 31,
2018
As at March 31,
2017
As atApril 1, 2016
As at March 31,
2018
As at March 31,
2017
As atApril 1, 2016
Luni Power Company Private Limited*** – – – – 59.51 59.51Neogal Power Company Private Limited***
– – – – 82.19 82.19
MVV Water Utility Private Limited – – – 310.22 370.41 336.67Total – – – 310.22 512.11 478.37
Break- up for Security details: ` In Lakhs Particulars Non-current Current
As at March 31,
2018
As at March 31,
2017
As atApril 1, 2016
As at March 31,
2018
As at March 31,
2017
As atApril 1, 2016
Trade ReceivablesSecured, considered good – – – – – – Unsecured, considered good 45,023.51 45,230.35 50,194.12 34,754.51 15,232.57 13,420.09 considered doubtful 5,557.93 4,973.52 4,454.73 – – – Sub-total 50,581.44 50,203.87 54,648.85 34,754.51 15,232.57 13,420.09
Impairment allowance (Allowance for bad and doubtful receivables)on unsecured, considered good (Expected Credit Loss)
(13,899.11) (13,460.35) (11,121.73) – – –
on considered doubtful (5,557.93) (4,973.52) (4,454.73) – – – Sub-total (19,457.04) (18,433.87) (15,576.46) – – – Total 31,124.40 31,770.00 39,072.39 34,754.51 15,232.57 13,420.09
Note 6.1: Trade Receivable from private limited companies in which Company ‘s director(s) is/ are director(s)/ member(s)
Note 6.2 : Trade receivables are non-interest bearing and the payment period generally varies from 30 days to 60 days.
Note 6.3 : For terms and conditions relating to Related Party receivables, refer Note 36
*** There is no common directorship with Luni Power Company Private Limited, Neogal Power Company Private Limited.
Standalone Financial Statement as at and for the year ended 31st March, 2018

SPML Infra Limited Annual Report 2017-18124
NOTE 7: LOANS (at amortised cost) ` In Lakhs
Particulars Non-current CurrentAs at
March 31, 2018
As at March 31,
2017
As atApril 1, 2016
As at March 31,
2018
As at March 31,
2017
As atApril 1, 2016
Earnest Money Deposits – – – 714.59 – – Security Deposits 3,419.95 – – – 836.98 1,296.38 Loans to related parties * (Refer Note 36) 9,866.55 962.30 771.23 – 6,246.90 5,338.84 Total Loans 13,286.50 962.30 771.23 714.59 7,083.88 6,635.22
* Loans due from private limited companies in which Company ‘s director(s) is/ are director(s)/ member(s)
NOTE 8: OTHER BANK BALANCES (at amortised cost) ` In Lakhs
Particulars Non-current CurrentAs at
March 31, 2018
As at March 31,
2017
As atApril 1, 2016
As at March 31,
2018
As at March 31,
2017
As atApril 1, 2016
Deposit with Maturity more than 12 months* 4,031.11 3,163.67 3,403.14 6,867.83 7,307.01 3,224.13 Deposits with Maturity more than 3 months but less than 12 months*
– – – – 497.95 3,862.00
Total 4,031.11 3,163.67 3,403.14 6,867.83 7,804.96 7,086.13
* lying with banks as security against letters of credits and Guarantees issued by them.
` In Lakhs Name Non-current Current
As at March 31,
2018
As at March 31,
2017
As atApril 1, 2016
As at March 31,
2018
As at March 31,
2017
As atApril 1, 2016
Binwa Power Company Private Limited** – – – – 62.11 62.11 Luni Power Company Private Limited** – – – – 321.51 256.58 Neogal Power Company Private Limited** – – – – 534.50 469.89 Doon Valley Waste Management Private Limited**
– – – – 23.82 21.06
SPML Bhiwandi Water Supply Infra Limited 876.75 – – – – –Spml Bhiwandi Water Supply Mgt Limited 38.44 – – – – –SPML Energy Limited 228.74 – – – – –Subhash Kabini Power Corporation Limited 811.59 – – – – –SPML Utilities Limited 552.62 – – – – –Gurha Thermal Power Co Limited 1,070.53 – – – – –MVV Water Utility Limited 62.38 – – – – –Total 3,641.05 – – – 941.94 809.64
Note 7.1. Loans and receivables are non- derivative financial assets which generate a fixed or variable interest income for the Company. The Carrying value may be affected by changes in the credit risk of the Counterparties.
** There is no common directorship with Binwa Power Company Private Limited, Luni Power Company Private Limited, Neogal Power Company Private Limited, Doon Valley Waste Managment Private Limited.
Standalone Financial Statement as at and for the year ended 31st March, 2018

125Statutoryreports
Corporate Overview
Financial statements
NOTE 9: OTHER FINANCIAL ASSETS (at Amortised Cost, unless otherwise stated) ` In Lakhs
Particulars Non-current CurrentAs at
March 31, 2018
As at March 31,
2017
As atApril 1, 2016
As at March 31,
2018
As at March 31,
2017
As atApril 1, 2016
Interest Accrued on Fixed deposit/ Loan – 590.58 465.42 2,684.59 1,284.88 1,338.47 Advance Against Sale of Investments – – – 200.00 772.06 772.06 Other Receivables – – – 245.92 – – Total – 590.58 465.42 3,130.51 2,056.94 2,110.53
NOTE 10.1: OTHER ASSETS (at Amortised Cost) ` In Lakhs
Particulars Non-current CurrentAs at
March 31, 2018
As at March 31,
2017
As atApril 1, 2016
As at March 31,
2018
As at March 31,
2017
As atApril 1, 2016
Unsecured, considered goodCapital advances 252.25 251.25 251.25 – – – Unbilled Revenue – – – 77,856.54 64,348.33 54,755.04 Advances recoverable in cash or kind – – – 7,153.25 1,809.85 3,501.80 Prepaid expenses – – – 1,080.62 1,281.16 1,270.35 Balance with Revenue Authorities – 566.56 870.51 4,005.67 2,378.11 1,846.90 Advance income-tax (net of provision for taxation)
6,115.57 8,879.17 7,638.95 – – –
Retention Money – – – 20,932.58 19,967.47 15,856.81 Interest accrued on arbitration awards (refer note 45)
18,459.23 13,649.63 6,498.95 – 1,541.78 1,695.95
Total 24,827.05 23,346.61 15,259.66 1,11,028.66 91,326.70 78,926.85
NOTE 10.2: CURRENT TAX ASSETS (net) ` In Lakhs
Particulars CurrentAs at
March 31, 2018As at
March 31, 2017As at
April 1, 2016Advance income-tax (net of provision for taxation) – 266.78 1,159.82 Total – 266.78 1,159.82
Standalone Financial Statement as at and for the year ended 31st March, 2018

SPML Infra Limited Annual Report 2017-18126
NOTE 11: INVENTORIES (Valued at lower of Cost and Net Realisable Value) ` In Lakhs
Particulars As at March 31, 2018
As at March 31, 2017
As at March 31, 2016
Project materials 3,758.68 3,876.74 3,900.64 Stores and spares 104.81 49.43 50.02 Work in progress 83.04 83.04 33.64 Total inventories at the lower of cost and Net realisable value 3,946.53 4,009.21 3,984.30
The major components of income tax expense for the years ended 31 March 2018 and 31 March 2017 are: Statement of profit and loss: ` In Lakhs Particulars Year ended
March 31, 2018Year ended
March 31, 2017Profit or loss sectionCurrent income tax:Current income tax charge 993.19 389.53 Deferred tax:Relating to origination and reversal of temporary differences 191.88 (683.67)Income tax expense reported in the statement of profit or loss 1,185.08 (294.13)
OCI sectionDeferred tax related to items recognised in OCI during the year:Unrealised (gain)/loss on FVTOCI equity securities 14.28 30.30 Net loss/(gain) on remeasurements of defined benefit plans 14.30 (16.23)Income tax charged to OCI 28.58 14.07
Reconciliation of tax expense and the accounting profit multiplied by India’s domestic tax rate for the year ended 31st March 2017 and 31st March 2018: ` In Lakhs Particulars Year ended
March 31, 2018Year ended
March 31, 2017Accounting profit before tax 5,496.71 (149.54)At India’s statutory income tax rate of 34.608% (31 March 2017: 34.608 %) 1,902.30 (51.75)Effect of Income being taxed at different rate (MAT Rate) (729.22) 19.84Adjustments in respect of items that are exempted from Income tax 179.89 421.44Income tax expense reported in the statement of profit and loss 993.19 389.53
Reconciliation of deferred tax Assets (net): ` In Lakhs Particulars As at
March 31, 2018As at
March 31, 2017Opening balance as of April 1 6,064.24 5,394.65 Tax income/(expense) during the period recognised in profit or loss (191.88) 683.67 Tax income/(expense) during the period recognised in OCI (28.58) (14.07)Closing balance as at March 31 5,843.78 6,064.24
Standalone Financial Statement as at and for the year ended 31st March, 2018

127Statutoryreports
Corporate Overview
Financial statements
NOTE 12: CASH AND BANK BALANCES (at Amortised Cost) ` In Lakhs
Particulars As at March 31, 2018
As at March 31, 2017
As atApril 1, 2016
Cash and cash equivalentsBalances with banks :On current accounts 1,603.82 3,046.01 1,914.02 Deposits with original maturity of less than three months* – – 27.24 Cash on hand 14.62 21.51 46.33
(A) 1,618.44 3,067.52 1,987.59 Other bank balancesBalances in unpaid dividend account 0.97 2.77 4.70
(B) 0.97 2.77 4.70 Total 1,619.41 3,070.29 1,992.29
* lying with banks as security against letters of credits and Guarantees issued by them.
NOTE 13: SHARE CAPITAL ` In Lakhs
Particulars As at March 31, 2018
As at March 31, 2017
As atApril 1, 2016
Authorized capital200,000,000 equity shares `2 par value per share 4,000.00 4,000.00 4,000.00
1,000,000 preference shares `100 par value per share 1,000.00 1,000.00 1,000.00 5,000.00 5,000.00 5,000.00
Issued, subscribed and paid-up capital36,650,276 equity shares `2 par value per share 733.01 733.01 733.01Add : Forfeited shares (amount originally paid up) 86.44 86.44 86.44
819.45 819.45 819.45
a. Reconciliation of the equity shares outstanding at the beginning and at the end of the yearEquity SharesParticulars As at March 31, 2018 As at March 31, 2017 As at April 1, 2016
No. of Shares
` In Lakhs
No. of Shares
` In Lakhs
No. of Shares
` In Lakhs
At the beginning of the year 3,66,50,276 733.01 3,66,50,276 733.01 3,66,50,276 733.01 Calls in arrears – – – – – –Outstanding at the end of the year 3,66,50,276 733.01 3,66,50,276 733.01 3,66,50,276 733.01
b. Terms/ rights attached to equity shares The Company has only one class of equity shares having par value of `2 per share. Each holder of equity shares is entitled one vote per share. The Company declares and pays dividends in Indian Rupees.
In the event of liquidation of the Company, the holders of the Equity shares will be entitled to receive remaining assets of the Company, after distribution of all preferential amounts. The distribution will be in proportion to the number of equity shares held by the shareholders.
Standalone Financial Statement as at and for the year ended 31st March, 2018

SPML Infra Limited Annual Report 2017-18128
c. Details of shareholders holding more than 5% equity shares of the CompanyName of Shareholders As at March 31, 2018* As at March 31, 2017 As at April 1, 2016
No. of Shares
% holding No. of Shares
% holding No. of Shares
% holding
Client Rosehill Limited 35,21,575 9.61 35,21,575 9.61 35,21,575 9.61State Bank of India 28,49,006 7.77 – – – –Zoom Industrial Services Limited 25,00,000 6.82 30,73,510 8.39 30,73,510 8.39SPML India Limited 21,19,055 5.78 23,35,735 6.37 23,35,735 6.37CVCIGP II Employee Rosehill Limited 19,72,301 5.38 19,72,301 5.38 19,72,301 5.38Anil Kumar Sethi 17,75,780 4.85 19,02,835 5.19 19,02,835 5.19Udgam Commercial Limited 17,06,906 4.66 19,92,531 5.44 19,92,531 5.44
d. * In pursuance of the implementation of “SPML S4A Scheme”,the Promoters of the Company had diluted their shareholding in the Company to the extent of “Principle of Proportionate loss sharing by Lenders (S4A Lenders)” in favour of the Lender Banks to entitle them to hold 21.44% stake in the Company.
e. In terms of the “SPML S4A Scheme” as approved by the Overseeing Committee (constituted under the aegis of Reserve Bank of India) the entire debt of the Company as bifurcated into Part A Debt and Part B Debt together with all interest thereon is also inter-alia secured by pledge of the Shares of the Company held by Promoters in favour of SBICAP Trustee Limited for the benefit of the Secured Parties. The Promoters & the Promoter Group of the Company as on the balance sheet dated 31.03.2018 had pledged 34.31% of the Shares as held by them in the Company in favour of the Security Trustee. Further, the promoters had pledged 01.52 % additional Shares as on the Balance Sheet signing date in terms of the “SPML S4A Scheme”.
f. No bonus shares or shares issued for consideration other than cash or shares bought back over the last five years immediately preceeding the reporting date.
NOTE 14: OTHER EQUITY ` In Lakhs
Particulars As at March 31, 2018
As at March 31, 2017
As atApril 1, 2016
A. Capital reserve 885.73 885.73 885.73 B. Securities premium account 15,263.80 15,263.80 15,263.80 C. General reserve 5,929.05 5,929.05 5,929.05 D. Retained Earnings (movements given below) 20,519.64 16,208.02 16,063.43 E. Other Comprehensive Income 145.00 70.36 –Total - Other equity 42,743.22 38,356.96 38,142.01
Movement in Retained Earnings ` In Lakhs Particulars As at
March 31, 2018As at
March 31, 2017As at
April 1, 2016Opening Balance 16,208.02 16,063.43 16,063.43 Add: Profit for the year 4,311.63 144.59 –Closing Balance 20,519.64 16,208.02 16,063.43
Standalone Financial Statement as at and for the year ended 31st March, 2018

129Statutoryreports
Corporate Overview
Financial statements
15.1 Security and repayment terms in respect of term loans from banks a. The entire Term Loan from ICICI Bank of `937.50 lakhs (`937.50 lakhs) has been converted during the year into OCD (Series
G) pursuant to “SPML S4A Scheme” and secured by the securities mentioned there against (Refer Point No.e of Note No. 15.3.3).
b. Term loan of `39.00 lakhs from Yes Bank carries (`507.80 lakhs) interest @ 11.75 % p.a. (YBL +1.50% p.a.) and is repayable in 5 quarterly instalments of `7.75 lakhs each along with interest thereon starting from February 2019 and ending by February 2020. The said loan is secured by way of Subservient charge on all movable fixed assets and current assets (both present and future) of the Company. Further, loan is backed by the personal guarantee of the Chairman of the Company and pledge of shares of the Company by the promoters/ associates.
c. Corporate Loan of `4,983.47 lakhs (P.Y. `5,800 lakhs) from Consortium Member-Banks carries interest ranging from @ 12.65% p.a. to 14.45% p.a. and are repayable in uneven quarterly instalments along with interest thereon by FY 2022-2023. The said loans are secured on pari-passu basis by (i) Extension on all the current and non-current assets of the Company (both present and future) (ii) Exclusive mortgage on two Immovable Properties situated at Sarita Vihar, New Delhi owned by relatives of the Promoters (iii) Negative lien on one property at New Delhi owned by one of the associates (iv) Pledged shares of the Company held by Promoters/Associates worth `5,000 lakhs. In addition, these loans are also secured by Personal Guarantee of two property owners to the extent of the value of the properties as well as Personal Guarantees of the Promoters of the Company.
d. As at the year ended March 31, 2018, the Company has defaulted in repayment of dues upto 90 days amounting to `527 lakhs and `357.58 lakhs, respectively; the default for more than 90 days amounted to `120.00 lakhs and ` NIL to banks and financial institutions. .
15.2 Security and repayment terms in respect of term loans from financial Institutions Term Loan of `1029.40 lakhs (`3306.06 lakhs) from a Financial Institution carries interest @ 13.00% p.a. (IBR +2.80% p.a.) and is repayable in twelve equated quarterly instalments by April 2021. The said loan is secured against an exclusive charge on (i) the Immovable Property situated at Faridabad owned by one of group entities (ii) Immovable Property of the Company situated at Sawai Madhopur in Rajasthan (iii) Pledge of shares of the Company held by Promoters/Group entities giving coverage of 1x of
NOTE 15: BORROWINGS (at Amortised Cost) ` In Lakhs
Particulars As at March 31, 2018
As at March 31, 2017
As atApril 1, 2016
SecuredTerm loans
from banks (refer note 15.1) 3,852.37 5,383.25 1,950.00 from financial institutions (refer note 15.2) 627.46 2,466.32 3,308.42
0.01% Optionally Convertible Debenturesfrom banks (refer note 15.3.3) 52,855.37 – –from financial institutions (refer note 15.3.3 (d)) 1,681.83 – –
Deferred payment credits (refer note 15.4)from banks – 6.94 17.44 from others – 26.83 34.77
UnsecuredTerm loans
from related parties (refer note 15.5 and 15.7) 11,665.38 9,594.57 6,819.59 from Body Corporate (refer note 15.6) 700.00 700.00 –
Current maturities of Long term Borrowings 1,646.31 2,730.81 2,372.74 Less: Amount clubbed under "Other Current Liabilities" (1,646.31) (2,730.81) (2,372.74)
Aggregate Borrowings 71,382.41 18,177.91 12,130.22
Standalone Financial Statement as at and for the year ended 31st March, 2018

SPML Infra Limited Annual Report 2017-18130
Loan amount. Further, the Loan is also backed by Personal Guarantee of Main Promoters, Corporate Guarantee & PDCs given by one of group entities.
15.3.1 Restructuring of entire Debts as availed from the Banks/Financial Institutions under Scheme for Sustainable Structuring of Stressed Assets (“SPML S4A Scheme”) In terms of the Scheme for Sustainable Structuring of Stressed Assets (“SPML S4A Scheme”) as approved by the Super Majority of the Lender Banks with Reference Date as 22nd March, 2017 which was further agreed and approved by the Overseeing Committee (constituted under the aegis of the RBI) on 6th October, 2017 and by the Shareholders of the Company at their meeting held on 20th November, 2017, the entire crystalized fund-based debts of the Company had been bifurcated into “Part A” i.e. sustainable part of debt to be serviced as per existing terms and conditions of those debts and “Part B” i.e. non-sustainable part of debt, which has been adjusted against by virtue of transfer of 78,59,575 Equity Shares as held by Promoters and Promoters group in the Company to the extent of the principal of Proportionate loss sharing by Lenders in favour of the lender banks to entitle them to hold 21.44% stake in the Company & balance of Part B debt converted into unlisted, unrated, reedemable 54,53,517 Optionally Convertible Debentures (OCDs) of `1000 each (carrying coupon rate @0.01 % p.a. with an YTM @8.15% p.a.) in favour of the lender Banks based on their subscription to the OCDs.
15.3.2 Note for Right of Re-compensation: In the instant arrangement, the Company acknowledges that the S4A Lenders reserves a right of recompense (“RoR”) for Concessional Interest Rates. The recompense payable by the Company after the final redemption date depends on various factors such as improved performance of the Company, Cash Inflow & other conditions. Further the quantum of the recompense amount would be ascertained/determined by the Steering Committee of Lenders within a period of one Month from the Final Redemption Date. However, the same is adjustable with the Upside Gain in the event the Member Banks decide to sell the shares transferred/sold by Promoters to Lenders pursuant to the SPML S4A Scheme at any time prior to the final settlement date.
15.3.3 Security and repayment terms in respect of Optionally Convertible Debentures (OCDs) The Company had allotted Unlisted, Unrated, Redeemable, Optionally Convertible Debentures (OCDs) of the `1000/- each under eight series to the Lender Banks in proportion to their participation in the S4A restructuring scheme against conversion of part of their dues. The said eight series of OCDs are secured by way of:
a. OCDs issued under Series A, B, C & H are secured by way of first ranking charge in favour of the Security Trustee (appointed for the benefit of the Secured Parties/debenture holders on pari-passu basis) on (i) Hypothecation of Stocks and Book Debts of the Company, both present and future and all other current assets and non-current receivable (ii) Hypothecation of Plant and Machinery, Furniture & Fixtures and office equipment (iii) Lien on Fixed Deposit having issue value of `38 lakhs in favour of Lead Bank. These loans are additionally secured by the Personal Guarantee of three Promoter Directors of the Company and Corporate Guarantee of one of the associates of the Company, except for OCDs issued to ICICI Bank under Series B & under Series C to Yes Bank which are also secured by extension of exclusive securities with them.
b. OCDs issued under Series D are secured by way of exclusive charge in favour of Yes Bank Limited on Pledge of shares of the Company held by Promoters/ Associates as well as subservient charge on moveable fixed assets and all current assets of the Company, both present and future. Further, these OCDs are also backed by Personal Guarantee of one Promoter of the Company
c. OCDs issued under Series E are secured by way of first ranking charge in favour of the Security Trustee (appointed for the benefit of the Secured Parties/debenture holders on pari-passu basis) (i) on all the current and non-current assets of the Company (both present and future)(ii) Exclusive charge on two Immovable Properties situated at Sarita Vihar, New Delhi, (iii) Pledge of Shares of the Company held by Promoters/Associates having market value of `50 crores (iv) Negative lien on one property at New Delhi owned by one of the Associates. In addition, these OCDs are also secured by Personal Guarantee of two property owners to the extent of the value of the properties as well as Personal Guarantee of Promoters.
d. OCDs issued under Series F are secured by way of exclusive charge in favour of IFCI Limited on (i) the Immovable Property owned by one of group entities situated in Faridabad (ii) Immovable Property owned by the Company situated in Sawai Madhopur, Rajasthan (iii) Pledge of shares of the Company held by Promoters/ Group entities giving coverage of 1x of Loan amount. Further, the Loan is also backed by Personal Guarantee of Main Promoters, Corporate Guarantee & PDCs given by one of Associates of the Company
e. OCDs issued under Series G are secured by way of exclusive charge in favour of ICICI Bank Limited on the Immovable Property of the Company situated in Gurugram.
f. OCDS carry Coupon Rate of 0.01% p.a. to be paid in the first instance from November 1, 2017 to March 31, 2018 and thereafter at the end of each financial quarter commencing from last coupon payment date and ending on the next coupon payment date. OCDs also carry Yield-to-Maturity (YTM) of 8.15% p.a. are redeemable after a moratorium period of five years from the
Standalone Financial Statement as at and for the year ended 31st March, 2018

131Statutoryreports
Corporate Overview
Financial statements
date of issue starting from quarter ending December, 2022 and ending on quarter ending September, 2027.
15.4. Deferred payment credits from banks and others are secured against hypothecation of vehicles/construction equipments purchased against such loans are repayable in equated monthly installments (ranging from 8 to12) carrying interest rates ranging from 9.60% to 11.46% p.a
15.5 Loans from related parties carry interest @12- 14.5% and are repayable within a maximum period of 10 years.
15.6 Loans from body corporates are repayable within a maximum period of 10 years.
15.7. Disclosure of outstanding loans and advances due from Related Parties to the Company together with maximum amount thereof pursuant to schedule V of Security and Exchange Board of India (Listing Obligations and Disclosures Requirements Regulations, 2015 are as below: ` In LakhsName As at March 31, 2018 As at March 31, 2017 As at April 1, 2016
Balance Outstanding
Maximum Amount
Outstanding during the
year
Balance Outstanding
Maximum Amount
Outstanding during the
year
Balance Outstanding
Maximum Amount
Outstanding during the
year Subhash Kabini Power Corporation Limited 811.59 867.13 807.17 807.17 743.33 770.51 SPML Energy Limited 228.74 228.74 205.61 205.61 184.83 184.83 SPML Infrastructure Limited 887.96 887.96 – – – –Awa Power Company Private Limited 987.11 987.11 722.96 722.96 512.37 565.03 IQU Power Company Private Limited 870.67 870.67 711.78 711.78 531.36 582.48 Neogal Power Company Private Limited 662.04 662.04 595.11 595.11 534.43 534.43 Luni Power Company Private Limited 394.80 394.80 354.86 354.86 291.82 291.82 Add Urban Enviro Limited 0.00 1,929.61 1,761.65 1,761.65 1,070.33 1,070.33 Subhash Urja Private Limited 0.01 0.01 – – – –SPML Utilities Limited 552.62 552.62 551.74 826.10 825.96 825.96 Mizoram Power Development Corporation Limited
– – – 2.84 2.70 2.70
Bhagalpur Electricity Distribution Company Private Limited
4,016.33 4,016.33 2,973.04 2,989.83 2,776.46 2,776.46
Allahabad Waste Processing Company Limited
25.20 25.20 25.20 25.20 25.20 25.20
Doon Valley Waste Management Private Limited
29.96 29.96 26.93 26.93 23.82 28.71
Mizoram Mineral Development Corporation Limited
– – – 2.85 2.85 2.85
Spml Bhiwandi Water Supply Infra Limited 876.75 876.75 788.10 788.10 707.75 707.75 Spml Bhiwandi Water Supply Management Limited
38.44 38.44 34.54 34.54 30.92 30.92
Gurha Thermal Power Co Limited 1,070.53 1,070.53 962.30 1,034.90 771.23 771.23 Aurangabad City Water Utility Company Limited
215.99 215.99 215.99 215.99 215.99 227.47
Hydro-comp Enterprises (India) Private Limited
0.32 0.32 0.01 0.01 0.01 0.01
Mizoram Infrastructure Development Company Limited
– 0.01 0.01 0.01 0.01 0.01
SPML Infraprojects Limited – 1.41 1.41 5.91 – –International Construction Limited 1,040.70 1,042.65 989.50 1,616.00 1,505.47 1,706.36 Peacock Pearl Business Solution Private Limited
0.13 0.13 0.11 0.11 0.08 0.08
SPM Engineers Limited – – – – – 758.94
Note: All balances in the above table are inclusive of interest.
Standalone Financial Statement as at and for the year ended 31st March, 2018

SPML Infra Limited Annual Report 2017-18132
NOTE 16: TRADE PAYABLES (at amortised cost) ` In Lakhs
Particulars Non-current CurrentAs at
March 31, 2018
As at March 31,
2017
As atApril 1, 2016
As at March 31,
2018
As at March 31,
2017
As atApril 1, 2016
Trade Payables :Trade Payables 5,525.04 7,957.02 6,837.64 62,506.87 60,855.73 70,127.21 Total Trade Payables 5,525.04 7,957.02 6,837.64 62,506.87 60,855.73 70,127.21
Note: Information in terms of section 22 of the Micro, Small and Medium Enterprises Development Act 2006: ` In Lakhs Particulars As at
March 31, 2018As at
March 31, 2017As at
April 1, 2016Details of dues to Micro and Small Enterprises as per MSMED Act, 2006The principal amount and the interest due thereon remaining unpaid to any supplier as at the end of each accounting year
Principal – – –Interest – – 52.56
The amount of interest paid by the buyer in terms of Section 16, of the Micro, Small and Medium Enterprises Development Act, 2006 along with the amounts of the payment made to the supplier beyond the appointed day during each accounting year.
Principal – – –Interest – – –
The amount of interest due and payable for the period of delay in making payment (which have been paid but beyond the appointed day during the year) but without adding the interest specified under Micro, Small and Medium Enterprises Development Act, 2006.
– – –
The amount of interest accrued for the year and remaining unpaid at the end of each accounting year;
– – –
The amount of further interest remaining due and payable even in the succeeding years, until such date when the interest dues as above are actually paid to the small enterprise for the purpose of disallowance as a deductible expenditure under section 23 of the Micro Small and Medium Enterprise Development Act, 2006.
– – –
Note 16.1. Trade payables are non-interest bearing and are normally settled on 60-days terms.
Note 16.2. For terms and conditions with Related Parties, refer to Note 36
NOTE 17: OTHER NON-CURRENT FINANCIAL LIABILITIES ` In Lakhs
Particulars As at March 31, 2018
As at March 31, 2017
As atApril 1, 2016
Advance from customers including interest 4,812.75 7,819.48 7,204.89 Financial Guarantee Obligation 847.75 991.52 1,159.67 Total 5,660.50 8,811.00 8,364.56
Standalone Financial Statement as at and for the year ended 31st March, 2018

133Statutoryreports
Corporate Overview
Financial statements
NOTE 18: PROVISION ` In Lakhs
Particulars Non-current CurrentAs at
March 31, 2018
As at March 31,
2017
As atApril 1, 2016
As at March 31,
2018
As at March 31,
2017
As atApril 1, 2016
Provision for employee benefitsGratuity (refer note 32) 604.97 403.95 384.20 – 106.44 112.00 Compensated absences – – – 107.68 116.27 126.40 Total 604.97 403.95 384.20 107.68 222.71 238.40
NOTE 19: BORROWINGS ` In Lakhs
Particulars As at March 31, 2018
As at March 31, 2017
As atApril 1, 2016
SecuredFrom banks
Cash Credit and demand loan facilities from bank (refer note 19.1) 50,019.15 66,818.82 46,550.16 Buyer's credit in foreign currency (refer note 19.2) – – –
Unsecuredfrom related parties (refer note 19.2) – 1,695.56 3,013.37 from bodies corporate (refer note 19.3) 5,229.85 5,346.22 6,598.16
Total 55,249.00 73,860.60 56,161.69
19.1 Demand loan and working capital facilities in Indian rupees are secured by hypothecation of stocks and book debts of the Company, both present and future, hypothecation of certain specific plant and machinery, furniture/fixtures and office equipments and also the lien on fixed deposit having value of `38 lakhs in favour of lead banker as a pari passu charge with other consortium banks. These loans are additionally secured by the guarantees of three promoter directors of the Company and corporate guarantee of SPM Engineers Limited (related party). The demand loans and cash credit and working capital facilities carry interest @ 11.60% to 15.75% p.a.
19.2 Loan from related parties is repayable on demand and carry interest @ Nil to 14.5%.
19.3 Loans from bodies corporate carry interest @ 12% p.a to 14.5% p.a.
NOTE 20: OTHER CURRENT FINANCIAL LIABILITIES ` In Lakhs
Particulars As at March 31, 2018
As at March 31, 2017
As atApril 1, 2016
Current maturities of long-term borrowings (refer note 15) 1,646.31 2,730.81 2,372.74 Interest accrued and due on borrowings – 725.61 423.84 Interest accrued and not due on borrowings 20.48 21.20 27.49 Unpaid dividend* 0.97 2.77 4.70 Salaries and other employee benefit payable 1,104.66 1,021.46 976.01 Advance from Customers 17,804.52 9,139.40 9,851.73 Interest accrued on Advances from Customers 2,852.54 3,510.49 3,584.70 Total 23,429.48 17,151.74 17,241.21
* there is no amount due and outstanding which is to be transferred to investor education & protection fund.
NOTE 21: OTHER CURRENT LIABILITIES ` In Lakhs
Particulars As at March 31, 2018
As at March 31, 2017
As atApril 1, 2016
Statutory Dues payable 1,373.71 1,241.28 1,594.15 Total 1,373.71 1,241.28 1,594.15
Standalone Financial Statement as at and for the year ended 31st March, 2018

SPML Infra Limited Annual Report 2017-18134
NOTE 22: REVENUE FROM OPERATIONS ` In Lakhs Particulars Year ended
March 31, 2018Year ended
March 31, 2017Operating RevenueContract revenue 1,08,290.47 94,320.86 Sale of traded goods 24,867.70 65,691.90 Other operating revenueOperation and maintenance 493.01 1,097.95 Interest Income as per arbitration awards (refer note 45) 1,941.37 9,014.76 Total 1,35,592.55 1,70,125.47
NOTE 25: CHANGES IN WORK-IN-PROGRESS ` In Lakhs Particulars Year ended
March 31, 2018Year ended
March 31, 2017Inventories at the end of the year: - Work in Progress 83.04 83.04 Inventories at the beginning of the year: - Work in Progress 83.04 33.64 Increase/ (Decrease) in Work in Progress – 49.40
NOTE 23: OTHER INCOME ` In Lakhs Particulars Year ended
March 31, 2018Year ended
March 31, 2017Interest income on Loans given to Related Parties 1,637.68 1,171.44 Bank deposits Other Income 836.59 779.98 Income tax refund 63.71 173.74 Others 664.47 686.94 Other Non- Operating Income Sundry balances / liabilities written back (refer note 42) 1,245.08 144.91 Profit on sale of investment (net) 973.30 – Profit on sale of fixed assets (net) – 734.54 Company's share in profit of Joint Ventures (net) – 86.14 Others 157.73 455.27 Total 5,578.56 4,232.96
NOTE 24: MATERIALS CONSUMED & DIRECT EXPENSES ` In Lakhs Particulars Year ended
March 31, 2018Year ended
March 31, 2017Construction materials and stores and spare consumedInventory at the beginning of the year 3,926.17 3,950.66 Add: Purchases 39,999.95 35,892.91
43,926.12 39,843.57 Less: Inventory at the end of the year 3,863.49 3,926.17
40,062.63 35,917.40 Direct Expenses Subcontractor charges 36,049.31 32,184.97 Drawing and designing charges 66.76 69.93 Equipment hire and running charges 375.94 528.11 Other direct expenses 2592.23 1,684.05
39,084.24 34,467.06 Total 79,146.87 70,384.46
Standalone Financial Statement as at and for the year ended 31st March, 2018

135Statutoryreports
Corporate Overview
Financial statements
NOTE 26: EMPLOYEE BENEFIT EXPENSES ` In Lakhs
Particulars Year ended March 31, 2018
Year ended March 31, 2017
Salaries, Wages and Bonus 4,296.89 4,643.57 Contribution to Provident and Others Funds 299.79 280.90 Gratuity expense (refer note no 32) 108.74 116.92 Staff Welfare Expenses 85.98 85.66 Total 4,791.39 5,127.05
NOTE 27: FINANCE COSTS ` In Lakhs
Particulars Year ended March 31, 2018
Year ended March 31, 2017
Interest (including interest on mobilisation advance amounting to `1437.50 lakhs (`1,271.32 lakhs))
16,662.63 16,115.84
Other borrowing costs 2,894.49 4,431.09 Total 19,557.12 20,546.93
NOTE 28: OTHER EXPENSES ` In Lakhs
Particulars Year ended March 31, 2018
Year ended March 31, 2017
Rent (refer note 33) 508.79 549.19 Rates and taxes 98.20 208.54 Repairs and maintenance: Building Repair & Maintenance 27.09 16.31 Plant and machinery Repair & Maintenance 81.85 76.26 Others Repair & Maintenance 26.86 27.29 Insurance 315.43 323.39 Professional charges and consultancy fees 1,912.99 1,269.11 Vehicle running charges 436.83 577.11 Travelling and conveyance 624.44 559.41 Security Charges 276.37 393.95 Communication expenses 66.24 84.06 Power and fuel 159.03 152.02 Printing & Stationery Expenses 45.75 43.96 Charity and donations 4.69 3.12 Auditor's remuneration (refer note 28.1) 44.76 42.51 Business promotion – 247.57 Provision for dimunition in value of investment 16.24 –Bad debts / sundry balances written off 1,520.67 4,582.74 Miscellaneous expenses 438.50 250.42 Provision on Trade Receivables 1,023.18 2,857.40 Total 7,627.91 12,264.36
Standalone Financial Statement as at and for the year ended 31st March, 2018

SPML Infra Limited Annual Report 2017-18136
NOTE 28.1: Payment to Auditors ` In Lakhs Particulars Year ended
March 31, 2018Year ended
March 31, 2017As Auditors - Audit fees 23.51 13.50 - Tax Audit fees 7.00 3.50 - Limited review 10.38 22.25 - Reimbursement of expenses 1.10 0.54 In other capacity: - Other services (certification fees) 2.77 2.72 Total 44.76 42.51
NOTE 29: DEPRECIATION ` In Lakhs
Particulars Year ended March 31, 2018
Year ended March 31, 2017
Depreciation on Tangible assets 763.24 1,031.26 Amortisation of Intangible Assets 2.32 3.20 Total 765.56 1,034.46
NOTE 30: CONTINGENT LIABILITIES AND COMMITMENTS ` In Lakhs
Particulars As at March 31, 2018
As at March 31, 2017
As atApril 1, 2016
A. Contingent Liabilitiesi Claims against Companies not acknowledged as debt 1,026.82 1,110.13 1,066.51 ii Claims towards liquidated damages not acknowledged as debts by
the Company 20,948.77 19,630.65 15,694.27
(Against the above, debts of the like amounts are withheld by the customers. However, the Company expects no material liability to accrue on account of these claims)
iii Disputed Demands(a) Income tax 1,144.63 5,304.18 1,527.73(b) Excise/ Service tax* 23.13 23.13 23.13 (c) Sales tax/ VAT* 3,734.58 4,209.04 3,596.42
iv Performance bank guarantees, given on behalf of subsidiaries and joint ventures
5,597.99 5,528.10 6,352.10
v Corporate Guarantees given to banks for financial assistance extended to subsidiaries and other body corporates
37,422.86 46,398.73 50,291.18
B. Commitmentsi Capital Commitments (Net of Advances) 48.65 48.65 48.65
*In respect of above cases, based on favourable decisions in similar cases/legal opinions taken by the Company /discussions with the solicitors etc., the management is of the opinion that it is possible, but not probable, that the action will succeed and accordingly no provision for liability has been made in the standalone financial statements.
Standalone Financial Statement as at and for the year ended 31st March, 2018

137Statutoryreports
Corporate Overview
Financial statements
During the year ended 31st March, 2018 ` In Lakhs Particulars Retained
Earnings Opening Balance 70.36 Fair valuation Gain on Investments at FVOCI 47.61 Re measurement gains/ (losses) on Defined Benefit Plan 27.02 Closing Balance 145.00
During the year ended 31st March, 2017 ` In Lakhs Particulars Retained
Earnings Opening Balance –Fair valuation Gain on Investments at FVOCI 101.03 Re measurement gains/ (losses) on Defined Benefit Plan (30.66)Closing Balance 70.36
` In Lakhs
Particulars Year ended March 31, 2018
Year ended March 31, 2017
Provident Fund 299.79 280.90
NOTE 31: The disaggregation of changes to OCI by each type of reserves in equity is shown below:
NOTE 32: EMPLOYEE BENEFITS(a) Contribution to defined Contribution Plans recognised as expense are as under
(b) Defined Benefit Plan Disclosure for Defined Benefit Plans based on actuarial report ` In Lakhs Particulars As at
March 31, 2018As at
March 31, 2017As at
April 1, 2016Changes in Defined Benefit Obligation: Present value of defined benefit obligation at the beginning of the year
510.39 496.20 496.20
Current Service Cost 69.73 77.22 –Interest Cost 39.01 39.70 –Re measurements (gains)/losses Actuarial (gains)/losses arising from changes in demographic assumptions
– – –
Actuarial (gains)/losses arising from changes in financial assumptions
(3.72) 20.42 –
Actuarial (gains)/losses arising from changes in experience adjustments
(37.60) (67.31) –
Benefits paid (14.16) (55.84) –Present value of defined benefit obligation at the end of the year 563.65 510.39 496.20
Standalone Financial Statement as at and for the year ended 31st March, 2018
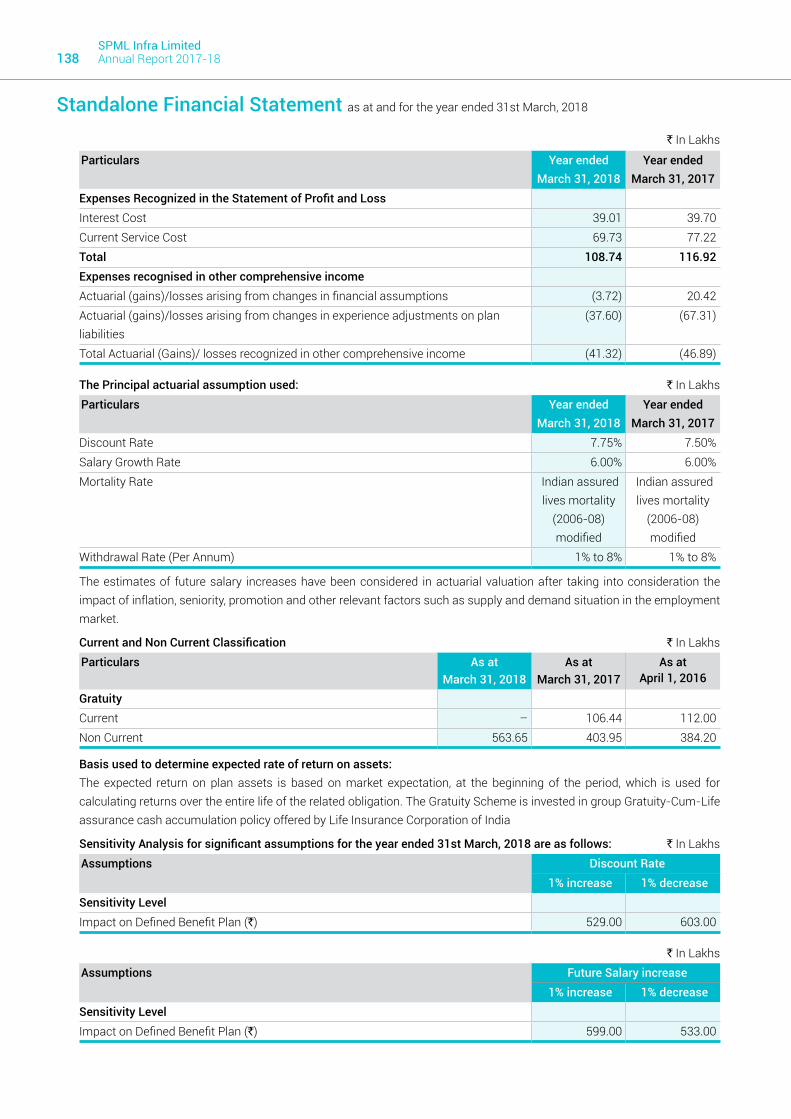
SPML Infra Limited Annual Report 2017-18138
` In Lakhs
Particulars Year ended March 31, 2018
Year ended March 31, 2017
Expenses Recognized in the Statement of Profit and Loss Interest Cost 39.01 39.70 Current Service Cost 69.73 77.22 Total 108.74 116.92 Expenses recognised in other comprehensive income Actuarial (gains)/losses arising from changes in financial assumptions (3.72) 20.42 Actuarial (gains)/losses arising from changes in experience adjustments on plan liabilities
(37.60) (67.31)
Total Actuarial (Gains)/ losses recognized in other comprehensive income (41.32) (46.89)
The Principal actuarial assumption used: ` In Lakhs Particulars Year ended
March 31, 2018Year ended
March 31, 2017Discount Rate 7.75% 7.50%Salary Growth Rate 6.00% 6.00%Mortality Rate Indian assured
lives mortality (2006-08) modified
Indian assured lives mortality
(2006-08) modified
Withdrawal Rate (Per Annum) 1% to 8% 1% to 8%
The estimates of future salary increases have been considered in actuarial valuation after taking into consideration the impact of inflation, seniority, promotion and other relevant factors such as supply and demand situation in the employment market.
Current and Non Current Classification ` In Lakhs Particulars As at
March 31, 2018As at
March 31, 2017As at
April 1, 2016
GratuityCurrent – 106.44 112.00Non Current 563.65 403.95 384.20
Basis used to determine expected rate of return on assets: The expected return on plan assets is based on market expectation, at the beginning of the period, which is used for
calculating returns over the entire life of the related obligation. The Gratuity Scheme is invested in group Gratuity-Cum-Life assurance cash accumulation policy offered by Life Insurance Corporation of India
Sensitivity Analysis for significant assumptions for the year ended 31st March, 2018 are as follows: ` In Lakhs Assumptions Discount Rate
1% increase 1% decrease Sensitivity LevelImpact on Defined Benefit Plan (`) 529.00 603.00
` In Lakhs Assumptions Future Salary increase
1% increase 1% decrease Sensitivity LevelImpact on Defined Benefit Plan (`) 599.00 533.00
Standalone Financial Statement as at and for the year ended 31st March, 2018

139Statutoryreports
Corporate Overview
Financial statements
The Weighted Average duration of the defined benefit obligation as at 31st March 2018 is 58 years
Valuations are performed on certain basic set of pre-determined assumptions and other regulatory frame work which may vary over time. Thus, the Company is exposed to various risks in providing the above gratuity benefit which are as follows:
Interest Rate risk: The plan exposes the Company to the risk off all in interest rates. A fall in interest rates will result in an increase in the ultimate cost of providing the above benefit and will thus result in an increase in the value of the liability (as shown in financial statements).
Liquidity Risk: This is the risk that the Company is not able to meet the short-term gratuity pay outs. This may arise due to non-availability of enough cash/cash equivalent to meet the liabilities or holding of illiquid assets not being sold in time.
Salary Escalation Risk: The present value of the defined benefit plan is calculated with the assumption of salary increase rate of plan participants in future. Deviation in the rate of increase of salary in future for plan participants from the rate of increase in salary used to determine the present value of obligation will have a bearing on the plan’s liability.
Regulatory Risk: Gratuity benefit is paid in accordance with the requirements of the Payment of Gratuity Act, 1972 (as amended from time to time). There is a risk of change in regulations requiring higher gratuity payouts.
Asset Liability Mismatching or Market Risk: The duration of the liability is longer compared to duration of assets, exposing the Company to market risk for volatilities/fall in interest rate.
Investment Risk: The probability or likelihood of occurrence of losses relative to the expected return on any particular investment.
Sensitivity Analysis for significant assumptions for the year ended 31st March, 2017 are as follows: ` In Lakhs Assumptions Discount Rate
1% increase 1% decrease Sensitivity LevelImpact on Defined Benefit Plan (`) 471.00 556.00
` In Lakhs Assumptions Future Salary increase
1% increase 1% decrease Sensitivity LevelImpact on Defined Benefit Plan (`) 550.00 474.00
` In Lakhs Assumptions Withdrawal Rate
1% increase 1% decrease Sensitivity LevelImpact on Defined Benefit Plan (`) 516.00 506.00
` In Lakhs Assumptions Withdrawal Rate
1% increase 1% decrease Sensitivity LevelImpact on Defined Benefit Plan (`) 568.00 559.00
Standalone Financial Statement as at and for the year ended 31st March, 2018

SPML Infra Limited Annual Report 2017-18140
NOTE 33: LEASESOperating lease — Company as lessee The Company’s leasing arrangement are in the nature of cancellable operating leases. The Company has taken various offices etc. on Operating Leases, which is renewable by mutual consent of concerned parties. No contingent rent is payable by the Company in respect of the above leases. There are no Price escalation clause in the Rent agreements. Related lease rentals have been disclosed under the head “Rent” in Note 28 of Statement of Profit and Loss. There are no restrictions placed upon the Company by such leases.
NOTE 34: CONSTRUCTION CONTRACTS DISCLOSUREInformation relating to Construction contracts as per Ind AS 11 “Construction Contracts”- Amount due from/ to Customers on Construction Contracts are given below: ` In Lakhs
Particulars As at March 31, 2018
As at March 31, 2017
Contract income recognized as revenue during the year 1,08,290.47 94,320.86 Aggregate amount of costs incurred 5,32,748.82 6,06,862.90 Recognized profits (less recognized losses) till date for contracts in progress 39,767.47 37,094.86 Advances received (unadjusted) for contracts in progress 22,617.27 16,958.88 Retention amount for contracts in progress 20,932.57 19,967.47 Gross amount due from customers for contract work for contracts in progress 65,878.91 47,002.57 Gross amount due to customers for contract work for contracts in progress – 352.00
NOTE 35: DISCLOSURE IN RESPECT OF RELATED PARTIES PURSUANT TO IND AS 24List of Related Parties I. Parent and Subsidiary Companies:
Name of related parties Nature of relationship % of HoldingSubhash Kabini Power Corporation Limited Subsidiary 44.72SPML Energy Limited Subsidiary 58.07SPML Infrastructure Limited* Subsidiary 99.99SPM Holding Pte. Limited Subsidiary 44.72Binwa Power Corporation Private Limited Subsidiary 50.79Awa Power Company Private Limited Subsidiary 28.91IQU Power Company Private Limited Subsidiary 28.89Neogal Power Company Private Limited Subsidiary 26.34Luni Power Company Private Limited Subsidiary 57.67Delhi Waste Management Limited Subsidiary 52.03Add Urban Enviro Limited* Subsidiary – Add Energy Management Company Private Limited Subsidiary 44.72Add Technologies (India) Limited Subsidiary 45.70Madurai Municipal Waste Processing Company Private Limited Subsidiary 92.33SPML Utilities Limited Subsidiary 100.00 Allahabad Waste Processing Company Limited Subsidiary 95.02Mathura Nagar Waste Processing Company Limited Subsidiary 90.25PT Sanmati Natural Resources Subsidiary 44.27Mizoram Infrastructure Development Company Limited Subsidiary 68.99SPML Infra Developers Limited Subsidiary 100.00 Bhagalpur Electricity Distribution Company Private Limited Subsidiary 99.99Doon Valley Waste Management Private Limited Subsidiary 61.45Jamshedpur Waste Processing Company Private Limited* Subsidiary – SJA Developers Private Limited Subsidiary 43.46Subhash Urja Private Limited Subsidiary 100.00 Synergy Promoters Private Limited # Subsidiary –
Standalone Financial Statement as at and for the year ended 31st March, 2018

141Statutoryreports
Corporate Overview
Financial statements
II. Other related parties with whom transactions have taken place during the year:
a) Joint Operations of the CompanyName of related parties Nature of relationship % of HoldingSPML-CISC JV Joint Operation 50.00 SPML - Simplex JV Joint Operation 50.00 SPML-HCIL JV Joint Operation 33.00 OM Metals Consortium JV Joint Operation 5.00 Siddharth- Mahaveer SPML –JV Joint Operation 10.00 KBL-SPML JV Joint Operation –SPML - OM Metals JV Joint Operation 50.00 M&P+Subhash JV Joint Operation 40.00 SPML-SEW-AMR Joint Venture Joint Operation –SMS-SPML JV Joint Operation –SUEZ -SPML JV Joint Operation 48.00 MEIL-SPML (JV) Joint Operation –
b) Joint Venture of the CompanyName of related parties Nature of relationship % of HoldingMalviya Nagar Water Services Private Limited Joint Venture 26.00 MVV Water Utility Private Limited Joint Venture 47.99Gurha Thermal Power Company Limited Joint Venture 50.00 Aurangabad City Water Utility Company Limited Joint Venture 40.01Hydro Comp Enterprises (India) Limited Joint Venture 50.00
c) Associates of the CompanyName of related parties Nature of relationship % of HoldingSPML Bhiwandi Water Supply Infra Limited Associates 44.94SPML Bhiwandi Water Supply Management Limited Associates 50.00 Bhilwara Jaipur Toll Road Private Limited Associates 51.00 Aurangabad Jal Supply Solution Private Limited Associates 26.00 Aurangabad Jal Construction Private Limited Associates 26.00 PT Bina Insan Sukses Mandiri Associates 20.00PT Vardhaman Mining Services Associates 20.09PT Vardhaman Logistics Associates 12.09Rabaan (S) Pte Limited Associates 20.00Sanmati Infra Developers Private Limited Associates 25.00
d) Key Management PersonnelName of related parties Nature of relationshipMr. Subhash Chand Sethi ChairmanMr. Sushil Kumar Sethi Managing DirectorMr. Sujit Kumar Jhunjhunwala Chief Financial OfficerMr. Abhay Raj Singh Company Secretary
Standalone Financial Statement as at and for the year ended 31st March, 2018

SPML Infra Limited Annual Report 2017-18142
f) Entities where Key Management Personnel & their relatives have significant influence with whom transactions have taken place during the year
Name of related parties Nature of relationshipArihant Leasing & Holding Company LimitedRishabh Homes Private Limited Subhash Systems Private LimitedInternational Construction LimitedSPM Engineers LimitedZoom Industrial Services LimitedMeena Homes Limited20Th Century Engineering LimitedSPML India LimitedADD Realty Limited Sanmati Power Company Private LimitedAdd Eco Enviro LimitedMeena Holdings LimitedSushil Kumar Sethi & Sons (HUF)Pondicherry Special Economic Zone Company LimitedBharat Hydro Power CorporationOm Metal-SPML Infra Project Private LimitedPeacock Pearl Business Solution Private LimitedSethi Infratech Private LimitedNiral Enterprises Private LimitedSPML Industries Limited
Notes:Related party relationships as mentioned in the above list are determined by the management based on nature of ‘control’ that the Company exercises over the other companies.*Two companies Add Urban Enviro Limited and Jamshedpur Waste Processing Company Private Limited merged with SPML Infrastructure Limited w.e.f 1st April, 2016 wide court order dated 31st Jan, 2018 # Ceased to be subsidiary w.e.f June 2017Four subsidiary companies namely Tons Valley Power Company Private Limited, Rupin Tons Power Company Private Limited, Uttarkashi Tons Hydro Power Private Limited and SPML Infraprojects Limited have applied for striking off their names from the Register of Companies under the Companies Act, 2013. Considering the concept of materiality and the aforsesaid development that arose subsequent to 31.03.2018, the figures of these subsidiary companies have not been considered for the purpose of Disclosure under Related Parties.
Standalone Financial Statement as at and for the year ended 31st March, 2018
e) Relatives of Key management PersonnelName of related parties Nature of relationshipMr. Anil Kumar Sethi Brother of Chaiman & Managing DirectorMr. Harshavardhan Sethi Son of ChairmanMrs. Maina Devi Sethi Mother of Chairman and Managing DirectorMrs. Noopur Jain Daughter of Managing DirectorMrs. Suman Sethi Wife of ChairmanMr. Abhinandan Sethi Son of ChairmanMrs. Sandhya Rani Sethi Wife of Managing DirectorMr. Rishabh Sethi Son of Managing DirectorMrs. Shilpa Sethi Daughter in law of ChairmanDr. Ankit Jain Son-in-law of Managing DirectorMrs. Priyanshi Sethi Daughter in law of ChairmanMrs. Aanchal Sethi Daughter in law of Managing Director

143Statutoryreports
Corporate Overview
Financial statements
NOTE 36: A. During the year the following transactions were carried out with the related parties in the ordinary course of business:
` In Lakhs Transaction Related Party Year ended
March 31, 2018Year ended
March 31, 2017Sale of Goods Joint Operations
KBL-SPML JV 83.65 85.07 MVV Water Utility Private Limited – 851.21 SUEZ -SPML JV 1,625.39 1,627.34 MEIL-SPML (JV) 8,250.04 9,365.15 Entities where significant influence is exercised by KMP and / or relativesMeena Holdings Limited 16.10 5.00
Interest Income Subsidiary companiesAwa Power Company Private Limited 99.06 70.11 IQU Power Company Private Limited 93.22 74.83 Luni Power Company Private Limited 44.35 37.06 Neogal Power Company Private Limited 74.37 67.35 SPML Energy Limited 25.69 23.10 SPML Infrastrucurte Limited 193.25 –Doon Valley Waste Management Private Limited 3.36 3.45 Add Urban Enviro Limited – 165.91 Bhagalpur Electricity Distribution Company Private Limited
441.14 328.82
Subhash Kabini Power Corporation Limited 102.14 89.80 Associate companiesSPML Bhiwandi Water Supply Management Limited 4.32 3.90 SPML Bhiwandi Water Supply Infra Limited 98.49 89.20 Joint venturesGurha Thermal Power Co Limited 120.26 98.39 MVV Water Utility Private Limited 2.57 2.57 Entities where significant influence is exercised by KMP and / or relativesMeena Holdings Limited – 0.05 International Construction Limited 45.17 154.55
Interest Expenses Subsidiary companiesSPML Infrastructure Limited 92.44 127.40 Mathura Nagar Waste Processing Company Private Limited
52.24 68.77
Delhi Waste Management Limited 337.07 446.22 Key managerial personnel (KMP)Mr. Sushil Kumar Sethi 12.50 15.31 Mr. Rishabh Sethi – 7.93 Entities where significant influence is exercised by KMP and / or relativesAdd Eco Enviro Limited 1.35 6.90 Pondicherry Special Economic Zone Company Limited
95.22 85.94
Meena Holdings Limited – 0.06
Standalone Financial Statement as at and for the year ended 31st March, 2018

SPML Infra Limited Annual Report 2017-18144
` In Lakhs Transaction Related Party Year ended
March 31, 2018Year ended
March 31, 2017Interest Expenses (contd...) 20Th Century Engineering Limited 0.00 0.01
SPML India Limited 93.08 61.66 Zoom Industrial Services Limited 172.11 163.91 Niral Enterprises Private Limited 136.63 103.63 Sethi Infratech Private Limted 0.01 0.01 SPML Industries Limited 141.13 90.00 SPM Engineers Limited 89.22 102.02 Bharat Hydro Power Corporation Limited 233.44 264.16
Purchase of Goods Subsidiary companiesAdd Energy Management Company Private Limited 5.90 –Add Technologies (India) Limited 52.17 95.13 Entities where significant influence is exercised by KMP and / or relativesInternational Construction Limited 14.75 –
Rent Expenses Relative of KMPMrs. Preeti Devi sethi 14.16 13.80 Entities where significant influence is exercised by KMP and / or relativesArihant Leasing & Holding Company Limited 6.00 6.00 Subhash Systems Private Limited 15.63 17.49 SPML Industries Limited – 34.97
Loan/Advance Given/Repaid Subsidiary companiesAwa Power Company Private Limited 175.00 147.48 IQU Power Company Private Limited 75.00 113.07 Luni Power Company Private Limited 0.02 29.69 SPML Infrastructure Limited 43.06 406.34 Add Urban Enviro Limited – 542.00 Neogal Power Company Private Limited – 0.07 Mizoram Power Development Corporation Limited – 0.14 SPML Infraprojects Limited – 5.91 Subhash Urja Private Limited 0.01 –SPML Utilities Limited 0.88 0.14 Mathura Nagar Waste Processing Company Private Limited
11.73 343.10
Delhi Waste Management Limited 73.51 1,382.12 Bhagalpur Electricity Distribution Company Private Limited
1,047.95 1,326.87
Subhash Kabini Power Corporation Limited 341.00 35.35 Associate companiesMizoram Mineral Development Corporation Limited – 0.01 SPML Bhiwandi Water Supply Management Limited 0.01 0.11 SPML Bhiwandi Water Supply Infra Limited 0.01 0.07 Joint venturesGurha Thermal Power Co Limited – 102.52 MVV Water Utility Private Limited 54.65 –Hydro-Comp Enterprises (India) Private Limited 0.31 –
Standalone Financial Statement as at and for the year ended 31st March, 2018

145Statutoryreports
Corporate Overview
Financial statements
` In Lakhs Transaction Related Party Year ended
March 31, 2018Year ended
March 31, 2017Loan/Advance Given/Repaid (contd...)
Joint OperationsSPML – Om Metal JV 88.96 6.52 Key managerial personnel (KMP)Mr. Sushil Kumar Sethi 0.40 94.85 Mr. Subhash Chand Sethi 19.50 137.30 Relative of KMPMr. Abhinandan Sethi 8.07 5.21 Entities where significant influence is exercised by KMP and / or relativesPondicherry Special Economic Zone Company Limited
36.50 42.75
Meena Holdings Limited – 59.79 Add Eco Enviro Limited – 1,008.51 Rishabh Homes Private Limited – 5.00 SPML India Limited 100.00 82.35 Subhash Systems Private Limited – 51.35 Zoom Industrial Services Limited 26.61 212.19 Niral Enterprises Private Limited 23.70 –Sethi Infratech Private Limted 0.04 10.08 Peacock Pearl Business Solution Private Limited 0.02 0.03 SPML Industries Limited 32.53 325.21 International Construction Limited 24.05 15.00 SPM Engineers Limited 12.00 308.85 Bharat Hydro Power Corporation Limited – 619.60
Loan/Advance Taken/Repaid Subsidiary companiesBinwa Power Corporation Private Limited 22.50 –SPML Infrastructure Limited 12.50 21.10 Add Urban Enviro Limited – –SPML Infraprojects Limited 1.41 –Mizoram Power Development Corporation Limited – 2.84 SPML Utilities Limited – 274.36 Delhi Waste Management Limited 49.06 200.00 Bhagalpur Electricity Distribution Company Private Limited
401.68 1,426.27
Subhash Kabini Power Corporation Limited 428.50 52.34 Mizoram Infrastructure Development Company Limited
0.01 –
Associate companiesMizoram Mineral Development Corporation Limited – 2.85 Joint venturesMVV Water Utility Private Limited 31.15 7.41 Joint OperationsSiddharth- Mahaveer SPML –JV – 10.00 SPML - SMC Infrastructure – 104.89 SPML – Om Metal JV 76.41 –
Standalone Financial Statement as at and for the year ended 31st March, 2018

SPML Infra Limited Annual Report 2017-18146
` In Lakhs Transaction Related Party Year ended
March 31, 2018Year ended
March 31, 2017Loan/Advance Taken/Repaid (contd...)
Key managerial personnel (KMP)Mr. Sushil Kumar Sethi – 58.00 Mr. Rishabh Sethi – 29.00 Mr. Subhash Chand Sethi 19.50 19.42 Relative of KMPMr. Abhinandan Sethi 8.07 5.21 Entities where significant influence is exercised by KMP and / or relativesOm Metal-Spml Infra Project Private Limited – 165.54 Meena Holdings Limited – 16.00 Add Eco Enviro Limited – 1,008.00 Rishabh Homes Private Limited – 5.00 20Th Century Engineering Limited – 0.16 Arihant Leasing & Holding Company Limited 32.25 –SPML India Limited 180.00 698.00 Subhash Systems Private Limited – 34.19 Niral Enterprises Private Limited – 999.97 Sethi Infratech Private Limted – 10.00 SPML Industries Limited 593.00 34.19 International Construction Limited – 670.07 SPM Engineers Limited – 1,160.00 Bharat Hydro Power Corporation Limited 8.50 1,625.00
Sale of Investment Siddharth- Mahaveer SPML –JV 3.88 –SPML-CISC JV 16.69 –SPML-HCIL JV 83.20 –SPM Engineers Limited* 996.80 –Bharat Hydro Power Corporation Limited* 2,259.67 –
Purchase of Investment SMS-SPML JV 1.83 0.32 SPML - Simplex JV 2.73 3.57 M&P+Subhash JV 1.51 1.52
Commission Received SPML-SEW-AMR Joint Venture 79.42 72.95 Managerial Remuneration Mr. Sushil Kumar Sethi 119.14 78.24
Mr. Subhash Chand Sethi 113.14 77.04 Mr. Rishabh Sethi – 17.90 Mr. Sujit Kumar Jhunjhunwala 22.73 –Mr. Lalit Kumar Khetan – 25.34 Mr. Abhay Raj Singh 24.15 24.15
Standalone Financial Statement as at and for the year ended 31st March, 2018

147Statutoryreports
Corporate Overview
Financial statements
B. Balances outstanding at the year end: ` In Lakhs Outstanding Related Party As at
March 31, 2018As at
March 31, 2017As at
April 1, 2016Payable Subsidiary companies
SPML Infrastructure Limited** – 994.98 1,265.55 Binwa Power Corporation Private Limited 463.08 440.58 440.58 Delhi Waste Management Limited 2,978.25 2,699.34 3,479.87 Mathura Nagar Waste Processing Company Limited
441.00 405.72 686.92
SPML Infraprojects Limited – – 4.50 SPML Infra Developers Limited 4.25 4.25 4.25 Add Technologies (India) Limited 20.79 31.66 41.85 Joint venturesMVV Water Utility Private Limited – – 488.20 Joint OperationsSPML-OM Metals JV 311.56 324.11 330.63 SMS-SPML JV 22.52 24.35 24.67 Key managerial personnel (KMP)Mr. Sushil Kumar Sethi 110.85 100.00 123.07 Mr. Subhash Chand Sethi – – 117.88 Mr. Rishabh Sethi – – 102.37 Relative of KMPMr. Abhinandan Sethi – – 5.17 Mrs. Preeti Devi sethi 20.63 12.40 –Entities where significant influence is exercised by KMP and / or relativesArihant Leasing & Holding Company Limited
84.17 46.52 43.82
Subhash Systems Private Limited 7.89 – 8.21 SPML Industries Limited 1,380.39 692.91 871.46 SPM Engineers Limited 32.77 961.28 18.31 Zoom Industrial Services Limited 1,506.28 1,378.00 1,442.67 20Th Century Engineering Limited 0.02 0.02 0.16 SPML India Limited 893.22 729.45 58.31 Meena Holdings Limited – – 43.74 Add Eco Enviro Limited 6.92 5.71 –Pondicherry Special Economic Zone Company Limited
772.77 723.57 688.97
Bharat Hydro Power Corporation Limited 408.17 2,449.91 1,206.76 Sethi Infratech Private Limted 0.06 0.09 0.08 Niral Enterprises Private Limited 1,192.50 1,093.23 –
Receivable Subsidiary companiesSubhash Kabini Power Corporation Limited 811.59 807.17 743.33 SPML Energy Limited 228.74 205.61 184.83 SPML Infrastructure Limited** 887.96 – –Awa Power Company Private Limited 1,166.57 902.42 691.83 IQU Power Company Private Limited 873.68 714.78 534.37 Neogal Power Company Private Limited 744.24 677.30 616.63 Luni Power Company Private Limited 454.31 414.37 351.34
Standalone Financial Statement as at and for the year ended 31st March, 2018

SPML Infra Limited Annual Report 2017-18148
` In Lakhs Outstanding Related Party As at
March 31, 2018As at
March 31, 2017As at
April 1, 2016Receivable (contd...) Add Urban Enviro Limited** 0.00 1,761.65 1,070.33
SPML Utilities Limited 552.62 551.74 825.96 Allahabad Waste Processing Company Limited
297.80 297.80 297.80
Mizoram Power Development Corporation Limited
– – 2.70
Mizoram Infrastructure Development Company Limited
– 0.01 0.01
SPML Infraprojects Limited – 1.41 –Bhagalpur Electricity Distribution Company Private Limited
4,140.77 3,097.48 3,114.39
Madurai Municipal Waste Processing Company Private Limited
118.51 118.51 118.51
Add Energy Management Company Private Limited
132.06 133.96 133.96
Doon Valley Waste Management Private Limited
29.96 26.93 23.82
Subhash Urja Private Limited 0.01 – –Joint OperationsSPML-CISC JV 3.37 20.06 20.06 SPML - Simplex JV 31.34 28.61 25.04 SPML-HCIL JV 40.60 269.46 307.14 M&P+Subhash JV 435.20 433.69 432.17 OM Metals Consortium JV 918.46 918.46 918.46 Siddharth- Mahaveer SPML –JV 88.27 92.15 102.15 KBL-SPML JV 828.71 819.40 785.49 SUEZ -SPML JV 805.67 896.32 499.53 SPML-SEW-AMR Joint Venture – – 17.64 SPML - SMC Infrastructure 60.00 60.00 182.22 MEIL-SPML (JV) 1,307.14 876.96 –Joint venturesMalviya Nagar Water Services Private Limited
450.16 450.16 547.35
MVV Water Utility Private Limited 372.60 370.42 –Gurha Thermal Power Co Limited 1,070.53 962.30 771.23 Aurangabad City Water Utility Company Limited
215.99 215.99 215.99
Hydro-Comp Enterprises (India) Private Limited
0.32 0.01 0.01
Associate companiesMizoram Mineral Development Corporation Limited
– – 2.85
SPML Bhiwandi Water Supply Infra Limited 876.75 788.10 707.74 SPML Bhiwandi Water Supply Management Limited
38.44 34.54 30.92
Standalone Financial Statement as at and for the year ended 31st March, 2018

149Statutoryreports
Corporate Overview
Financial statements
` In Lakhs Outstanding Related Party As at
March 31, 2018As at
March 31, 2017As at
April 1, 2016Receivable (contd...) Entities where significant influence is
exercised by KMP and / or relativesSubhash Systems Private Limited – 3.39 –International Construction Limited 1,040.70 989.50 1,505.47 Sanmati Power Company Private Limited 251.25 251.25 251.25 Meena Holdings Limited 8.75 5.00 –Om Metal-Spml Infra Project Private Limited
– – 165.54
Peacock Pearl Business Solution Private Limited
0.13 0.11 0.08
Corporate Guarantee outstanding (Also Refer Note 33 for details of security given)
Subsidiary companiesAwa Power Company Private Limited 541.45 873.28 939.92 Neogal Power Company Private Limited 650.00 840.18 867.87 Delhi Waste Management Limited – 322.65 572.65 Allahabad Waste Processing Company Limited
536.33 626.00 997.31
Mathura Nagar Waste Processing Company Private Limited
70.00 437.00 695.00
Madurai Municipal Waste Processing Company Private Limited
1,280.00 1,280.00 1,280.00
SPM Holding Pte. Limited 8,439.57 12,968.00 13,266.00 Subhash Kabini Power Corporation Limited 4,197.51 5,351.62 5,918.43 Associate CompaniesBhilwara Jaipur Toll Road Private Limited 21,708.00 23,700.00 25,754.00
C. Details of remuneration to Key Managerial Personnel is given below ` In Lakhs Particulars 2017-18 2016-17 - Short-term employee benefits 276.28 219.07 - Post employment benefits 2.88 3.60 Total 279.16 222.67
Notes: * Unsecured Loans taken from Bharat Hydro Power Company Limited and SPM Engineers Limited in earlier years have been settled during the year 2017-18 through sale of investments in equity shares held by the Company in group companies.
**Two companies, Add Urban Enviro Limited and Jamshedpur Waste Processing Company Private Limited merged with SPML Infra Limited w.e.f 1st April, 2016 wide court order dated 31st Jan, 2018. Hence the figures for the year 2017-18 are included in the figures disclosed against SPML Infra Limited in the above table.
Terms and conditions of transactions with related parties: The transactions with related parties are made on terms equivalent to those that prevail in arm’s length transactions. Outstanding balances at the year-end are unsecured and settlement occurs in cash except as otherwise mentioned.
Standalone Financial Statement as at and for the year ended 31st March, 2018

SPML Infra Limited Annual Report 2017-18150
NOTE 37.1: CATEGORIzATION OF FINANCIAL INSTRUMENTS ` In Lakhs
Carrying value/ Fair valueParticulars As at
March 31, 2018As at
March 31, 2017As at
April 1, 2016(i) Financial Assets a) Measured at FVTPL - Investments in Mutual Fund 5.00 5.00 5.00 b) Measured at FVOCI - Investments in Equity Instruments 1,114.78 1,052.89 921.56 c) Measured at Amortised Cost* - Loans 14,001.09 8,046.18 7,406.45 - Trade Receivables 65,878.91 47,002.57 52,492.48 - Other Financial Assets 32,191.59 35,528.67 33,900.32
(ii) Financial Liabilities a) Measured at FVTPL - Financial Guarantee Obligation 847.75 991.52 1,159.67 b) Measured at Amortised Cost* - Borrowings (Secured and Unsecured) 1,26,631.40 92,038.51 68,291.91 - Other Financial Liabilities 96,274.15 93,783.97 1,01,410.95
*Carrying Value of assets / liabilities carried at amortized cost are reasonable approximation of its fair values.
The Company has disclosed financial instruments such as cash and cash equivalents, other bank balances, trade receivables and trade payables at carrying value because their carrying amounts are a reasonable approximation of the fair values due to their short term nature.
NOTE 37.2: FAIR VALUE HIERARCHYThe table shown below analyses financial instruments carried at fair value. The different levels have been defined below:-
Level 1: Quoted Prices (unadjusted) in active markets for identical assets or liabilities
Level 2: Inputs other than quoted prices included within Level 1 that are observable for the asset or liability, either directly (i.e., as prices) or indirectly (i.e., derived from prices)
Level 3: Inputs for the asset or liability that are not based on observable market data (unobservable inputs)
a) Financial assets and liabilities measured at fair value at 31 March 2018 ` In Lakhs Particulars Level 1 Level 2 Level 3 Total Financial Assets Investment at OCI – – 1,114.78 1,114.78 Financial Liability Financial Guarantee obligation at FVTPL – – 847.75 847.75
Financial assets and liabilities measured at fair value at 31 March 2017 ` In Lakhs Particulars Level 1 Level 2 Level 3 Total Financial Assets Investment at OCI – – 1,052.89 1,052.89 Financial Liability Financial Guarantee obligation at FVTPL – – 991.52 991.52
Standalone Financial Statement as at and for the year ended 31st March, 2018

151Statutoryreports
Corporate Overview
Financial statements
NOTE 38: FINANCIAL RISK MANAGEMENT OBjECTIVES AND POLICIESThe Company’s principal financial liabilities, comprise of borrowings and trade payables. The main purpose of these financial liabilities is to finance the Company’s working capital requirements. The Company has various financial assets such as trade receivables, loans, investments,short-term deposits and cash & cash equivalents, which arise directly from its operations.
The Company is exposed to market risk, credit risk and liquidity risk. The Company’s Board of Directors oversees the management of these risks and advises on financial risks and the appropriate financial risk governance framework for the Company. The Company’s Board of Directors assures that the Company’s financial risk activities are governed by appropriate policies and procedures and that financial risks are identified, measured and managed in accordance with the Company’s policies and risk objectives.
The Board of Directors reviews and agrees policies for managing each of these risks, which are summarised below.
A. Credit Risk Credit risk is the risk that a counterparty fails to discharge its obligation to the Company.
The Company’s exposure to credit risk is influenced mainly by cash and cash equivalents, trade receivables and financial assets measured at amortised cost.
The Company continuously monitors defaults of customers and other counterparties and incorporates this information into its credit risk controls. Credit risk related to cash and cash equivalents and bank deposits is managed by only accepting highly rated banks and diversifying bank deposits. Other financial assets measured at amortized cost includes security deposits, Loans given and others. Credit risk related to these other financial assets is managed by monitoring the recoverability of such amounts continuously, while at the same time internal control system in place ensure the amounts are within defined limits.
(b) Financial instruments at amortised cost The carrying amount of financial assets and financial liabilities measured at amortised cost in the financial statements are
a reasonable approximation of their fair values since the Company does not anticipate that the carrying amounts would be significantly different from the values that would eventually be received or settled
(c) During the year there has been no transfer from one level to another.
Financial assets and liabilities measured at fair value at 1 April 2016 ` In Lakhs Particulars Level 1 Level 2 Level 3 Total Financial Assets Investment at OCI – – 921.56 921.56 Financial Liability Financial Guarantee obligation at FVTPL – – 1,159.67 1,159.67
(d) Description of Significant Unobservable inputs to Valuation:Particulars Valuation
technique Significant
unobservable inputs Sensitivity to the input of the fair value
Unquoted Equity Shares in Bharat Hydro Power Corporation Limited
Discounted Cash Flow approach
Discount rate 1% decrease in the discount rate will result in OCI gain of `51.74 lakhs and 1% increase will have an equal but opposite effect.
Financial Guarantee Obligation
Discounted Cash Flow approach
Discount rate 1% increase in the discount rate will result in loss of `71.77 lakhs in Profit and Loss and 1% increase will have an equal but opposite effect.
Standalone Financial Statement as at and for the year ended 31st March, 2018

SPML Infra Limited Annual Report 2017-18152
a) Credit Risk Management 1. Credit Risk Rating The Company assesses and manages credit risk of financial assets based on following categories arrived on the basis
of assumptions, inputs and factors specific to the class of financial assets.
A. Low Credit Risk
B. Moderate Credit risk
C. High credit risk
The Company provides for the Expected Credit Loss based on the following: Asset Group Description Provision for Expected Credit Loss*Low Credit Risk Cash and cash equivalents, other bank balances, investments,
loans, trade receivables and other financial assets12 month expected credit loss/life time expected credit loss
Moderate Credit Risk
Trade receivables, loans and other financial assets 12 month expected credit loss/life time expected credit loss
High Credit Risk Trade receivables, loans and other financial assets Life time expected credit loss
*Based on business environment in which the Company operates, a default on a financial asset is considered when the counterparty fails to make payments within the agreed time period as per contract. Loss rates reflecting defaults are based on actual credit loss experience and considering differences between current and historical economic conditions.
Assets are written off when there is no reasonable expectation of recovery, such as a debtor declaring bankruptcy or a litigation decided against the Company. The Company continues to engage with parties whose balances are written off and attempts to enforce repayment. Recoveries made are recognized in statement of profit and loss.
March 31, 2018 ` In LakhsParticulars Estimated Gross
Carrying amount at default
Expected Credit Loss
Carrying amount net of Impairment
ProvisionLoans 15,274.37 1,273.28 14,001.09 Trade Receivables 85,335.95 19,457.04 65,878.91
March 31, 2017 ` In LakhsParticulars Estimated Gross
Carrying amount at default
Expected Credit Loss
Carrying amount net of Impairment
ProvisionLoans 9,319.46 1,273.28 8,046.18 Trade Receivables 65,436.44 18,433.87 47,002.57
` In Lakhs Credit Rating Particulars March 31, 2018 March 31, 2017 April 1, 2016Low Credit Risk Cash and cash equivalents, other bank
balances, investments, loans and other financial assets
12,581.04 16,879.41 17,977.14
High Credit Risk Trade Receivables, Loans 1,00,610.32 74,755.90 76,748.67
b) Credit Risk Exposure Provision for Expected Credit Loss The Company provides for expected credit loss based on 12 month and lifetime expected credit loss basis for following
financial assets:
Standalone Financial Statement as at and for the year ended 31st March, 2018

153Statutoryreports
Corporate Overview
Financial statements
B. Liquidity Risk Liquidity risk is the risk that the Company will encounter difficulty in meeting the obligations associated with its financial
liabilities that are settled by delivering cash or another financial asset. The Company’s approach to managing liquidity is to ensure as far as possible, that it will have sufficient liquidity to meet its liabilities when they are due.
Management monitors rolling forecasts of the Company’s liquidity position and cash and cash equivalents on the basis of expected cash flows. The Company takes into account the liquidity of the market in which the entity operates.
Maturities of Financial Liabilities The table below analyse the Company’s Financial Liabilities into relevant maturity groupings based on their contractual
maturities
April 1, 2016 ` In LakhsParticulars Estimated Gross
Carrying amount at default
Expected Credit Loss
Carrying amount net of Impairment
ProvisionLoans 8,679.73 1,273.28 7,406.45 Trade Receivables 68,068.94 15,576.46 52,492.48
The Company’s allowance for Expected Credit Loss on Trade Receivables is created using Provision Matrix Approach.
` In LakhsReconciliation of Loss Allowance Trade Receivables LoansAs on April 1, 2016 15,576.46 1,273.28 Allowance for Expected Credit Loss 2,857.41 –As on March 31, 2017 18,433.87 1,273.28 Allowance for Expected Credit Loss 1,023.17 –As on March 31, 2018 19,457.04 1,273.28
March 31, 2018 ` In Lakhs Particulars Less than 1
year1-5 years More than
5 yearsTotal
Borrowings 55,249.00 4,479.83 66,902.58 1,26,631.40 Trade Payable 62,506.87 4,420.03 1,105.01 68,031.92 Other Financial Liabilities 23,429.48 4,528.40 1,132.10 29,089.98
March 31, 2017 ` In Lakhs Particulars Less than 1
year1-5 years More than
5 yearsTotal
Borrowings 73,860.60 7,883.34 10,294.57 92,038.51 Trade Payable 60,855.73 6,365.61 1,591.40 68,812.75 Other Financial Liabilities 17,151.74 7,048.80 1,762.20 25,962.74
April 1, 2016 ` In Lakhs Particulars Less than 1
year1-5 years More than
5 yearsTotal
Borrowings 56,161.69 5,310.63 6,819.59 68,291.91 Trade Payable 70,127.21 5,470.11 1,367.53 76,964.85 Other Financial Liabilities 17,241.21 6,691.65 1,672.91 25,605.77
Standalone Financial Statement as at and for the year ended 31st March, 2018

SPML Infra Limited Annual Report 2017-18154
C. Market Risk a. Interest Rate Risk The Company has taken debt to finance its working capital, which exposes it to interest rate risk. Borrowings issued at
variable rates expose the Company to interest rate risk.
Interest rate sensitivity Profit or loss and equity is sensitive to higher/lower interest expense from borrowings as a result of changes in interest
rates.
b. Price Risk The Company’s exposure to price risk arises from investments held and classified as FVTPL or FVOCI. To manage the
price risk arising from investments, the Company diversifies its portfolio of assets.
Interest Rate Risk Exposure ` In Lakhs Particulars March 31, 2018 March 31, 2017 April 1, 2016Variable Rate Borrowing 1,09,036.18 74,702.16 51,860.79 Fixed Rate Borrowing 15,077.62 17,336.35 16,431.12
` In Lakhs Particulars March 31, 2018 March 31, 2017Interest Sensitivity*Interest Rates increase by 100 basis points 1,044.21 1,006.43 Interest Rates decrease by 100 basis points 1,044.21 1,006.43
*Holding all other variables constant
Sensitivity Analysis ` In Lakhs Particulars March 31, 2018 March 31, 2017Price Sensitivity*Price increase/ decrease by 5%- FVOCI 22.56 15.75
*Holding all other variables constant
NOTE 39: CAPITAL MANAGEMENTFor the purpose of the Company’s capital management, capital includes issued equity capital, share premium and all other equity reserves attributable to the equity holders of the parent. The primary objective of the Company’s capital management is to maximise the shareholder value.
The Company’s objectives when managing capital is to safeguard continuity, maintain a strong credit rating and healthy capital ratios in order to support its business and provide adequate return to shareholders through continuing growth and maximise the shareholders value. The Company’s overall strategy remains unchanged from previous year. The Company sets the amount of capital required on the basis of annual business and long-term operating plans which include capital and other strategic investments. The funding requirements are met through a mixture of equity, internal fund generation and borrowed funds.. The Company’s policy is to use short term and long term borrowings to meet anticipated funding requirements. The Company monitors capital on the basis of the net debt to equity ratio. The Company is not subject to any externally imposed capital requirements. Net debt are long term and short term debts as reduced by cash and cash equivalents (including restricted cash and cash equivalents). Equity comprises share capital and free reserves (total reserves excluding OCI). The following table summarizes the capital of the Company:
` In Lakhs Particulars As on
March 31, 2018As on
March 31, 2017As on
April 1, 2016Borrowings 1,28,277.71 94,769.32 70,664.65 Trade payables 68,031.92 68,812.75 76,964.85 Less: cash and cash equivalents (1,619.41) (3,070.29) (1,992.29)Net debt 1,94,690.21 1,60,511.78 1,45,637.21 Total capital 43,562.67 39,176.41 38,961.46 Capital and net debt 2,38,252.88 1,99,688.19 1,84,598.67 Gearing ratio 82% 80% 79%
Standalone Financial Statement as at and for the year ended 31st March, 2018

155Statutoryreports
Corporate Overview
Financial statements
NOTE 42. Sundry balances/liabilities written back aggregating `1,245.08 lakhs (`144.91 lakhs) consisting of numerous balances being unclaimed / unmoved since long (mostly more than three years) have been written back during the year as the management believes that these amounts are no longer payable.
Note 43. No provision for interest on account of YTM amounting to `1842.68 lakhs has been made on Optionally Convertible Debentures (OCDs) issued to lenders under SPML S4A Scheme, as the management believes that the same is not payable until maturity of such OCD.
Note 44. Clients of the Company have foreclosed the certain contracts which are under arbitration / litigation proceedings. The management, based on the fact of the case is confident to recover the trade receivables of `3,402.74 lakhs as on 31st march 2018 (`11,198.02 lakhs as on 31st March 2017 and `4,829.10 lakhs as on 1st April 2016). Pursuant to adoption of IND AS following the expected credit loss model, `7,795.28 lakhs have been provided out of the gross debtors of `11,198.02 lakhs which are under arbitration/dispute and were a subject matter of the auditors’ qualification as at March 31, 2017.
Note 45. The Company has Trade and Other Receivables amounting `25,460.41 lakhs as on March 31, 2018 (`23,358.81 lakhs as on March 31, 2017, `15,997.75 lakhs as on April 1, 2016) and has recognized interest of `1,471.20 lakhs (`6,603.68 lakhs as on March 31, 2017; `796.68 lakhs as on April 1, 2016) during the year arising out of arbitration awards pronounced in favour of the Company. Against these awards, the customers have preferred appeals in the jurisdictional courts and the legal proceedings are going on. Pending the outcome of the said legal proceedings, the above amounts are being carried forward as receivable as the management believes that the final outcome of the appeals would be in favor of the Company based on the facts of the respective cases and is confident to recover the aforesaid claims in full.
NOTE 40: DEFERRED TAX ASSET ` In Lakhs
Particulars As on March 31, 2018
As on March 31, 2017
As on April 1, 2016
Deferred Tax Assets arising out of:Provision as per Expected Credit Loss Model 5,870.30 5,516.19 4,527.30 Impact of Fair valuation of Loans 700.55 700.55 700.55 Fair valuation of Investments 1,609.69 1,623.97 1,654.27 Impairment of Property, Plant and Equipment 193.19 193.19 193.19 Gross Deferred Tax Assets 8,373.73 8,033.91 7,075.32
Deferred Tax Liabilities arising out of:Fair valuation of Land 1,680.67 1,680.67 1,680.67 Profit on Sale of Investments 230.69 – –Interest Income 618.59 289.00 –Gross Deferred Tax Liabilities 2,529.95 1,969.66 1,680.67 Net Deferred Tax Assets 5,843.78 6,064.24 5,394.65
NOTE 41: EARNING PER SHARE ` In Lakhs
Particulars Year ended March 31, 2018
Year ended March 31, 2017
Net profit available for Equity Shareholders 4,311.63 144.59 Weighted Average number of Equity shares 366.50 366.50 Basic and Diluted Earnings Per Share 11.76 0.39
Standalone Financial Statement as at and for the year ended 31st March, 2018

SPML Infra Limited Annual Report 2017-18156
Note 46. Trade receivables aggregating `8,216.06 lakhs (31st March, 2017 `9,842.77 lakhs; 1st April, 2016: `2,135.12 lakhs) are under arbitration proceedings. The management is confident that based on the facts of the respective cases; there is no uncertainty as regards their realization.
Note 47. In accordance with the provisions of Section 135 of the Companies Act 2013, the Company was to spend a sum of `28.10 lakhs towards the CSR activities during the year ended March 31, 2018. During the year, the Company has spent Nil for the aforesaid activities.
Note 48. Previous periods’s figures have been regrouped/rearranged wherever considered necessary to confirm to the figures presented in the current year. Certain balances of Trade Receivables, Loans, Unsecured Borrowings and Trade Payables are subject to confirmations and subequent reconciliations.
Note 49: FIRST TIME ADOPTION OF IND ASThese financial statements for the year ended 31 March 2018, are the first financial statements of the Company prepared in accordance with Ind AS.
Exemptions Applied:Ind AS 101 allows certain exemptions from the retrospective application of certain requirements under Ind AS.
a. Estimates The preparation of the Company’s financial statements requires management to make judgements, estimates and
assumptions as described below that affect the reported amounts and the accompanying disclosures. The Company based its assumptions and estimates on parameters available when the financial statements were prepared.Uncertainty about these assumptions and estimates could result in outcomes that require a material adjustment to the carrying amount of assets or liabilities affected in future periods.
- Cost of Defined Benefit Plan and the Present Value of the defined benefit obligation are determined using actuarial valuations. An actuarial valuation involves making various assumptions that may differ from actual developments in the future.
- Impairment of financial assets based on Expected Credit Model
The estimates used by the Company to present these amounts in accordance with Ind AS reflect conditions at 1 April, 2016, the date of transition to Ind AS and as of 31 March 2017
b. Classification and measurement of Financial Assets The Company has assessed the classification and measurement of financial assets on the basis of the facts and
circumstances that exist at the date of transition to Ind AS in accordance with Ind AS 101.
Standalone Financial Statement as at and for the year ended 31st March, 2018

157Statutoryreports
Corporate Overview
Financial statements
Effect of IND AS adoption on the Balance Sheet as on March 31, 2017 and April 1, 2016 ` In Lakhs
ParticularsFoot note
As at March 31, 2017(End of Last Period presented under
previous GAAP)
As at April 1,2016(Date of Transition)
As perPrevious
GAAP
Effect of Transition to IND AS
As perInd-AS
As perPrevious
GAAP
Effect of Transition to IND AS
As perInd-AS
ASSETSNon-current assets(a) Property, plant and equipment c 4,460.25 6,726.22 11,186.47 5,837.21 6,726.22 12,563.43 (b) Intangible assets 23.02 – 23.02 26.22 – 26.22 (c) Financial assets
- Investments b 25,142.13 (5,242.01) 19,900.12 25,142.70 (5,373.33) 19,769.37 - Trade receivables a 45,230.35 (13,460.35) 31,770.00 50,194.12 (11,121.73) 39,072.39 - Loans 962.30 – 962.30 771.23 – 771.23 - Other Bank Balances 3,163.67 – 3,163.67 3,403.14 – 3,403.14 - Other Non- Current Financial Assets 590.58 – 590.58 465.42 – 465.42
(d) Other non-current assets 23,346.61 – 23,346.61 15,259.66 15,259.66 (e) Deferred Tax Asset f – 6,064.24 6,064.24 – 5,394.65 5,394.65
1,02,918.90 (5,911.89) 97,007.01 1,01,099.70 (4,374.19) 96,725.51 Current assets(a) Inventories 4,009.21 – 4,009.21 3,984.30 – 3,984.30 (b) Financial assets
(i) Trade receivables 15,232.57 – 15,232.57 13,420.09 – 13,420.09 (ii) Cash and Cash Equivalents 3,070.29 – 3,070.29 1,992.29 – 1,992.29 (iii) Bank Balances other than mentioned in (ii)
above 7,804.96 – 7,804.96 7,086.13 – 7,086.13
(v) Loans a 10,233.29 (3,149.41) 7,083.88 9,932.75 (3,297.53) 6,635.22 (vi) Other current financial assets 2,056.94 – 2,056.94 2,110.53 – 2,110.53
(d) Current Tax Assets 266.78 – 266.78 1,159.82 – 1,159.82 (e) Other current assets 91,326.70 – 91,326.70 78,926.85 – 78,926.85
1,34,000.74 (3,149.41) 1,30,851.33 1,18,612.76 (3,297.53) 1,15,315.23 Total assets 2,36,919.65 (9,061.30) 2,27,858.34 2,19,712.46 (7,671.73) 2,12,040.74
EQUITY AND LIABILITIESEquity(a) Equity Share capital 819.45 – 819.45 819.45 – 819.45 (b) Other Equity a-g 48,409.78 (10,052.82) 38,356.96 46,973.41 (8,831.40) 38,142.01 Total equity 49,229.23 (10,052.82) 39,176.41 47,792.86 (8,831.40) 38,961.46 LIABILITIESNon-current liabilities(a) Financial liabilities
(i) Borrowings 18,177.91 – 18,177.91 12,130.22 – 12,130.22 (ii) Trade Payables 7,957.02 – 7,957.02 6,837.64 – 6,837.64 (ii) Other Non- Current Financial Liabilities e 7,819.48 991.52 8,811.00 7,204.89 1,159.67 8,364.56
(b) Long term provisions 403.95 – 403.95 384.20 – 384.20 34,358.36 991.52 35,349.87 26,556.95 1,159.67 27,716.62
Current liabilities(a) Financial liabilities
(i) Borrowings 73,860.60 – 73,860.60 56,161.69 – 56,161.69 (ii) Trade payables 60,855.73 – 60,855.73 70,127.21 – 70,127.21 (ii) Other current financial liabilities 17,151.74 – 17,151.74 17,241.21 – 17,241.21
(b) Other current liabilities 1,241.28 – 1,241.28 1,594.15 – 1,594.15 (d) Short-term provisions 222.71 – 222.71 238.40 – 238.40
1,53,332.06 – 1,53,332.06 1,45,362.66 – 1,45,362.66 Total liabilities 1,87,690.42 991.52 1,88,681.93 1,71,919.61 1,159.67 1,73,079.28 Total equity and liabilties 2,36,919.64 (9,061.30) 2,27,858.34 2,19,712.47 (7,671.73) 2,12,040.74
Standalone Financial Statement as at and for the year ended 31st March, 2018

SPML Infra Limited Annual Report 2017-18158
Effect of IND AS adoption on the Statement of Profit and Loss for the year ended March 31, 2017 ` In Lakhs Particulars Footnote
ReferencePrevious
GAAPEffect of
Transition to IND AS
As per Ind AS
IncomeRevenue from Operations 1,70,125.47 – 1,70,125.47 Other Income a,d,e 3,397.90 835.06 4,232.96
1,73,523.37 835.06 1,74,358.43
ExpensesMaterials consumed and direct expenses 70,384.46 – 70,384.46 Cost of traded goods 65,200.11 – 65,200.11 Decrease in work-in-progress (49.40) – (49.40)Employee benefits expense g 5,173.94 (46.89) 5,127.05 Depreciation and amortisation expense 1,034.46 – 1,034.46 Finance Cost 20,546.93 – 20,546.93 Other Expenses a 9,406.96 2,857.40 12,264.36
1,71,697.46 2,810.52 1,74,507.97
Profit/(loss) before tax from continuing operations 1,825.91 (1,975.45) (149.54)
Exceptional Items – – –Profit/(loss) before tax from continuing operations (I) 1,825.91 (1,975.45) (149.54)
Tax Expense Current tax 389.53 – 389.53 Tax for earlier years – – – Deferred tax f – (683.67) (683.67)Income Tax Expense 389.53 (683.67) (294.13)Profit for the year from Continuing Operations (II) 1,436.38 (1,291.79) 144.59
Other Comprehensive Income (OCI)Other comprehensive income not to be reclassified to profit or loss in subsequent periods:Fair valuation of Investments b – 131.33 131.33 Income Tax effect f – (30.30) (30.30)Other comprehensive income to be reclassified to profit or loss in subsequent periods:Re-Measurement gains on defined benefit plans g – (46.89) (46.89)Income Tax effect f – 16.23 16.23 Other Comprehensive Income for the year (III) – 70.36 70.36 Total Comprehensive Income for the year (II+III) 1,436.38 (1,221.42) 214.95
Standalone Financial Statement as at and for the year ended 31st March, 2018

159Statutoryreports
Corporate Overview
Financial statements
Reconciliation of Total Equity as on March 31, 2017 and April 1, 2016 ` In Lakhs Particulars Footnote
ReferenceAs at March 31, 2017
(End of Last Period presented under previous GAAP)
As at April 1, 2016(Date of Transition)
Total Equity (Shareholders' funds) under previous GAAP 49,229.23 47,792.85
Provision on Trade Receivables as per ECL a (13,460.35) (11,121.73)Impact due to Fair Valuation of Investments b (7,725.38) (7,856.70)Fair Valuation impact on PPE c 6,726.22 6,726.22 Provision on Loans as per ECL a (1,273.28) (1,273.28)Interest Income on Loans d 148.12 –Interest Income on Guarantee e 168.15 –Deferred Tax impact f 5,363.69 4,694.10 Total Adjustment to Equity (10,052.82) (8,831.40)Total Equity under IND AS 39,176.40 38,961.45 Balance as per Face of Balance Sheet 39,176.41 38,961.46
Footnotes to Reconciliationa Impairment Loss as per Expected Credit loss The Company has recognised impairment loss as per Expected Credit Loss on Trade Receivables and Loans as per Ind
AS 109. As a result, the loss allowance on Trade Receivables as at March 31, 2017 increased by `13,979.14 lakhs (April 1, 2016:`11,121.73 lakhs) and Loans by `1,273.28 lakhs (April1, 2016: `1,273.28 lakhs). Consequently, the total Equity as at March 31, 2017 decreased by `15,252.42 lakhs (April 1, 2016: `12,395.01 lakhs) and profit for the year ended March 31, 2017 reduced by `2,338.62 lakhs (net of Interest unwinding)
b. Fair valuation of Investments In the financial statements under the previous GAAP, investments of the Company were classified as long-term investments
or current investments based on the intended holding period and realisability. Long-term investments were carried at cost less provision for other than temporary diminution in carrying amount of such investments. Current investments were carried at lower of cost and fair value. Under Ind AS, the Company has recognised such investments as follows:
- Investments in Subsidiaries, Joint Ventures, and Associates: At cost
- Investments in equity instruments: At FVOCI through an irrevocable election
- Investments in Mutual Funds: At FVTPL
The resulting fair value changes of these investments (other than equity instruments designated as at FVOCI) have been recognised in retained earnings as at the date of transition and subsequently in the profit or loss for the year ended 31st March, 2017. This has decreased the retained earnings by `8,565.85 lakhs as at 31st March, 2017 (1st April, 2016: `8,565.85 lakhs).
Fair value changes with respect to investments in equity shares designated as at FVOCI have been recognised in retained earnings as at the date of transition and subsequently in the other comprehensive income for the year ended 31st March, 2017. This has increased other reserves by `840.48 lakhs as at 31st March, 2017 (and retained earnings by `709.15 lakhs) as at 1st April, 2016. Correspondingly, other comprehensive income for the year ended March 31, 2017 increased by `131.33 lakhs.
c. Fair valuation of Property, Plant and Equipment The Company has fair valued its Investment in Land, which was carried at cost under Previous GAAP. The resulting fair value
changes have been recognised in Retained Earnings as at the date of transition. This has increased the retained earnings by `7,284.44 lakhs (1st April, 2016: `7,284.44 lakhs).
Also, the Company has written off Property, Plant and Equipment where the significant risks and rewards relating to such
Standalone Financial Statement as at and for the year ended 31st March, 2018

SPML Infra Limited Annual Report 2017-18160
assets have been transferred. This has resulted in decrease in the retained earnings by `558.22 lakhs as on March 31, 2017 (April 1, 2016: `558.22 lakhs).
d Fair valuation of Loans to Related Party Under Ind AS, all financial assets are required to be measured at fair value. Accordingly, the Company has fair valued these
loans to Related Party under Ind AS. Difference between the fair value and transaction cost of the loan has been recognised as Investment. Consequent to this change, Loans decreased by `2,024.25 lakhs as at 31st March, 2017 (1st April, 2016 : `2,024.25 lakhs). The Investment increased by `1,323.70 lakhs as at 31st March, 2017 (1st April, 2016 : `1,323.70 lakhs). As a result, the Profit for the year ended March 31, 2017 has increased by `148.12 lakhs due to notional interest income on Loans.
e Fair valuation of Financial Guarantee Under Ind AS, Financial Guarantees are required to be measured at Fair value. Accordingly, the Company has fair valued
these Corporate Guarantee given to Related Party. The resultant difference has been recognised as Investment. Consequent to this change, Profit for the year ended March 31, 2017 has increased by `168.15 lakhs on account of notional interest income on such Financial Guarantee contracts.
f Deferred Tax In the financial statements prepared under previous GAAP, deferred tax was accounted as per the income statement
approach which required creation of deferred tax asset/liability on timing differences between taxable profit and accounting profit. Under Ind AS, deferred tax is accounted as per the balance sheet approach which requires creation of deferred tax asset/liability on temporary differences between the carrying amount of an asset/liability in the balance sheet and its corresponding tax base.
The above changes have resulted in creation of deferred tax assets (net) amounting to `5,363.69 lakhs as at 31st March, 2017 (April 1, 2016: ̀ 4,694.10 lakhs). For the year ended 31st March, 2017, it has resulted in decrease in deferred tax expense by `683.67 lakhs in the statement of profit and loss for the year ended 31st March, 2017.
g Remeasurement of Post- employment Benefit obligation “In the financial statements prepared under previous GAAP, remeasurement benefit of defined plans, arising primarily due to
change in actuarial assumptions was recognised as employee benefits expense in the statement of profit and loss. Under Ind AS, such remeasurement benefits relating to defined benefit plans is recognised in other comprehensive income as per the requirements of Ind AS 19 - Employee Benefits.
As a result of this change, the profit for the year ended 31st March, 2017 increased by ̀ 46.89 lakhs and other comprehensive income has decreased by the same amount. There is no impact on the total equity as at 31st March, 2017.
NOTE 50. STANDARDS ISSUED BUT NOT YET EFFECTIVEMinistry of Corporate Affairs (“”MCA””) through Companies (Indian Accounting Standards) Amendment Rules, 2018 has notified the following new and amendments to Ind AS’s which the Company has not applied as they are effective for annual periods beginning on or after April 1, 2018:
Ind AS 115 – Revenue from Contracts with CustomersThe Company is currently evaluating the impact of implementation of Ind AS 115 “Revenue from Contracts with Customers” which is applicable to it w.e.f 01.04.2018. However, based on the evaluation done so far and based on the arrangement that the Company has with its customers for sale of its services, the implementation of Ind AS 115 will not have any significant recognition and measurement impact. However, there will be additional presentation and disclosure requirement, which will be provided in the next year’s financial statements.
Ind AS 21 – The Effect of Changes in Foreign Exchange RatesThe amendment clarifies on the accounting of transactions that include the receipt or payment of advance consideration in a foreign currency. The appendix explains that the date of the transaction, for the purpose of determining the exchange rate, is the date of initial recognition of the non-monetary prepayment asset or deferred income liability. If there are multiple payments or
Standalone Financial Statement as at and for the year ended 31st March, 2018

161Statutoryreports
Corporate Overview
Financial statements
receipts in advance, a date of transaction is established for each payment or receipt. The Company is evaluating the impact of this amendment on its financial statements.
Ind AS 12 - Income TaxesThe amendments clarify that an entity needs to consider whether tax law restricts the sources of taxable profits against which it may make deductions on the reversal of that deductible temporary difference. Furthermore, the amendments provide guidance on how an entity should determine future taxable profits and explain the circumstances in which taxable profit may include the recovery of some assets for more than their carrying amount. Entities are required to apply the amendments retrospectively. However, on initial application of the amendments, the change in the opening equity of the earliest comparative period may be recognised in opening retained earnings (or in another component of equity, as appropriate), without allocating the change between opening retained earnings and other components of equity. Entities applying this relief must disclose that fact. These amendments are effective for annual periods beginning on or after 1 April 2018. These amendments are not expected to have any impact on the Company as the Company has no deductible temporary differences or assets that are in the scope of the amendments.
Ind AS 28 - Investments in Associates and Joint venturesClarification that measuring investees at fair value through profit or loss is an investment-by investment choice :
i) An entity that is a venture capital organisation, or other qualifying entity, may elect, at initial recognition on an investment-by-investment basis, to measure its investments in associates and joint ventures at fair value through profit or loss.
ii) If an entity, that is not itself an investment entity, has an interest in an associate or joint venture that is an investment entity, the entity may, when applying the equity method, elect to retain the fair value measurement applied by that investment entity associate or joint venture to the investment entity associate’s or joint venture’s interests in subsidiaries. This election is made separately for each investment entity associate or joint venture, at the later of the date on which:
(a) the investment entity associate or joint venture is initially recognised;
(b) the associate or joint venture becomes an investment entity; and
(c) the investment entity associate or joint venture first becomes a parent.
Ind AS 40- Transfers of Investment Property — Amendments to Ind AS 40The amendments clarify when an entity should transfer property, including property under construction or development into, or out of investment property. The amendments state that a change in use occurs when the property meets, or ceases to meet, the definition of investment property and there is evidence of the change in use. A mere change in management’s intentions for the use of a property does not provide evidence of a change in use.
Entities should apply the amendments prospectively to changes in use that occur on or after the beginning of the annual reporting period in which the entity first applies the amendments. An entity should reassess the classification of property held at that date and, if applicable, reclassify property to reflect the conditions that exist at that date. Retrospective application in accordance with Ind AS 8 is only permitted if it is possible without the use of hindsight.
The amendments are effective for annual periods beginning on or after 1 April 2018. These amendments are not applicable to the Company.
Amendments to Ind 112 Disclosure of Interests in Other Entities: Clarification of the scope of disclosure requirements in Ind AS 112The amendments clarify that the disclosure requirements in Ind AS 112, other than those in paragraphs B10–B16, apply to an entity’s interest in a subsidiary, a joint venture or an associate (or a portion of its interest in a joint venture or an associate) that is classified (or included in a disposal group that is classified) as held for sale. Since the proposed amendments relate to relevant disclosures made in the financial statements, excepting those, entity does not expect any impact of the same.
Standalone Financial Statement as at and for the year ended 31st March, 2018

SPML Infra Limited Annual Report 2017-18162
NOTE 51: INFORMATION ON jOINT VENTURE ENTITIESDescription of Company’s interest in the joint operations ` In Lakhs Name of the entity As at 31-Mar-2018 As at 31-Mar-2017 As at 1 April 2016
Proportion of Interest
Country of Incorporation
Proportion of Interest
Country of Incorporation
Proportion of Interest
Country of Incorporation
Siddartha - Mahavir-SPML 10% India 10% India 10% IndiaOm Metal Consortium 5% India 5% India 5% IndiaKBL - SPML (JV)* 50% India 50% India 50% IndiaSPML - CISC JV 50% India 50% India 50% IndiaSPML - Simplex 50% India 50% India 50% IndiaSPML - HCIL* 33% India 33% India 33% IndiaM&P + Subhash JV 40% India 40% India 40% IndiaSPML - OM Metal JV 50% India 50% India 50% IndiaSuez Environment France & SPML Infra Limited India JV
48% India 48% India 48% India
MEIL-SPML (JV) 49% India 49% India Nil
* Represents joint ventures where the Company, through a supplementary agreement with the JV partner, has altered its risk and reward from 50% and 33% to a specific amount of the contract representing 50% and 99% respectively of the total contract value and for which ‘’back to back’’ work contract has been awarded to the Company by the joint venture entity. Accordingly, the Company’s share of assets, liabilities, income and expense in respect of these JV entities has not been disclosed in the table given below since these figures have got incorporated directly through the contract accounting. However, joint venture partners are, jointly and severally, liable to clients for any claims in these projects as per the original terms of the contract.
Description of Company’s interest in the joint ventures of the Company ` In Lakhs Name of the entity As at 31-Mar-2018 As at 31-Mar-2017 As at 1 April 2016
Proportion of Interest
Country of Incorporation
Proportion of Interest
Country of Incorporation
Proportion of Interest
Country of Incorporation
Malviya Nagar Water Services Private Limited
26% India 26% India 26% India
Gurha Thermal Power Company Limited
50% India 50% India 50% India
MVV Water Utility Private Limited 48% India 48% India 48% IndiaAurangabad City Water Utility Company Limited
40% India 40% India 40% India
Hydro Comp Enterprises (India) Limited 50% India 50% India 50% India
` In Lakhs Name of the Joint Operation Company’s Share in capital
expenditure commitments and contingent
liabilities
Assets Liabilities Income Expenses Profit/(Loss) (-) after tax
Siddartha-Mahavir-SPML * 2017-18 343.52 292.02 62.98 66.04 (3.07) –2016-17 357.42 302.26 193.54 189.76 3.78 –2015-16 477.88 413.05 – – – –
OM Metal Consortium * 2017-18 648.89 1.93 1.14 0.35 0.79 –2016-17 647.76 2.74 – – – –2015-16 647.76 2.74 – – – –
The Company’s share of assets, liabilities, income and expenses in the joint Operations as at and for the year ended March 31, 2018 is as follows:-
Standalone Financial Statement as at and for the year ended 31st March, 2018

163Statutoryreports
Corporate Overview
Financial statements
` In Lakhs Name of the Joint Venture Company’s Share in
Income Expenses Profit/(Loss) (–) after tax
Malviya Nagar Water Services Private Limited * 2017-18 637.27 829.55 (192.29)2016-17 817.30 866.34 (49.03)
Gurha Thermal Power Company Limited * 2017-18 – – –2016-17 – – –
MVV Water Utility Private Limited 2017-18 156.17 450.70 (294.53)2016-17 157.86 159.14 (1.28)
Hydro Comp Enterprises (India) Limited* 2017-18 – 0.53 (0.53)2016-17 – 0.28 (0.28)
Aurangabad City Water Utility Company Limited* 2017-18 0.87 256.47 (255.61)2016-17 2,063.23 2,642.17 (578.94)
* These financial statement have been accounted for based on the management certified financial statement.
The above table does not include the amount pertaining to joint ventures where the Company has renounced a major part of its risk and reward in the joint ventures through supplementary agreement in favour of the joint venturer partners for a specified consideration which was duly accounted for upfront as Company’s share of profit in the joint venture amounting to ̀ 194.34 lakhs (`194.34 lakhs).
The Company’s share of income and expenses in the joint Ventures as at and for the year ended March 31, 2018 is as follows:-
` In Lakhs Name of the Joint Operation Company’s Share in capital
expenditure commitments and contingent
liabilities
Assets Liabilities Income Expenses Profit/(Loss) (-) after tax
SPML CISC JV * 2017-18 11.72 2.87 – 0.86 (0.86) –2016-17 13.36 2.64 – – – –2015-16 13.36 2.64 – – – –
SPML - Simplex 2017-18 60.02 28.68 2.78 0.05 2.73 121.27 2016-17 57.52 28.91 12.44 9.22 3.22 121.27 2015-16 41.11 15.71 – – – –
Suez Environment France & SPML Infra Limited India JV *
2017-18 711.57 713.43 1,040.63 1,039.15 0.31 –2016-17 729.59 731.76 1,138.49 1,146.05 (7.28) –2015-16 982.89 977.78 – – – –
M&P + Subhash JV * 2017-18 2,164.40 2,148.93 1.70 0.19 1.51 –2016-17 2,162.33 2,148.91 1.79 0.06 1.74 –2015-16 (2,160.68) (2,149.00) – – – –
SPML - OM Metal JV * 2017-18 1,598.28 1,044.59 3,848.37 3,571.02 777.50 –2016-17 709.54 709.54 1,564.94 1,507.43 57.52 –2015-16 1,184.61 1,184.61 – – – –
Standalone Financial Statement as at and for the year ended 31st March, 2018

SPML Infra Limited Annual Report 2017-18164
` In Lakhs SL. Particulars Year ended
March 31, 2018Year ended
March 31, 20171 Segment revenue (gross)
a) Construction 1,10,724.85 1,04,433.57 b) Trading 24,867.70 65,691.90 Net sales/ Income from operations 1,35,592.55 1,70,125.47
2 Income/(expenses)Depreciation/amortisationa) Construction 765.56 1,034.46 b) Trading – –
3 Segment Profit / (Loss) (before tax and interest)a) Construction 20,843.86 17,163.86 b) Trading 1,082.15 491.79 Profit before taxes and Interest 21,926.01 17,655.65 Finance Expenses (Net) (16,354.66) (17,734.83)Profit before taxes 5,571.35 (79.18)Provision for taxation (Current tax, deferred tax, and adjustments on account of Previous years)
1,185.08 (294.13)
Profit after tax 4,386.27 214.95
` In Lakhs Particulars As on
March 31, 2018As on
March 31, 2017As on
April 1, 20164 Segment Assets
a) Construction 2,54,516.19 2,26,150.03 2,09,243.74 b) Trading 14,886.14 1,708.31 2,797.00 Total Segment Assets 2,69,402.33 2,27,858.34 2,12,040.74
5 Segment Liabilitiesa) Construction 1,99,004.72 1,51,142.93 1,63,314.27 b) Trading 26,834.95 37,539.00 9,765.00 Total Segment Liabilities 2,25,839.66 1,88,681.93 1,73,079.27
6 Capital expenditure 120.99 241.87 274.82 7 Investment in Associate and Joint Venture 6,382.32 6,398.66 6,399.24
Standalone Financial Statement as at and for the year ended 31st March, 2018
NOTE 52: SEGMENT REPORTINGThe Company is primarily engaged in the business of construction. In accordance with IND AS -108 notified pursuant to Companies (Indian Accounting Standards) Rules, 2015, (as amended), the Company has identified two reportable business segments viz. Constuction and Trading. The Company is primarily operating in India which is considered as single geographical segment.
Signatories to Notes 1 to 52As per report attached of even date
For Maheshwari & Associates For and on behalf of Board of Directors ofChartered Accountants SPML Infra LimitedICAI Firm Registration No. 311008E
CA Bijay Murmuria Subhash Chand Sethi Sushil Kr. SethiPartner Chairman Managing DirectorMembership No 055788 DIN No.00464390 DIN No.00062927
Place: Kolkata Abhay Raj Singh Sujit Kumar JhunjunwalaDate: 23rd May 2018 Company Secretary Chief Financial Officer

165Statutoryreports
Corporate Overview
Financial statements
PART
‘A’ -
Sum
mar
y of
Fin
anci
al In
form
atio
n of
Sub
sidi
ary
Com
pani
es `
In L
akhs
Sl
. N
o.N
ame
of th
e Co
mpa
nyRe
port
ing
perio
d fo
r the
su
bsid
airy
co
ncer
ned,
if
diff
eren
t fro
m
the
hold
ing
Com
pany
’s
repo
rtin
g pe
riod
Repo
rt-
ing
Cur-
renc
y
Ex-
chan
ge
Rate
Shar
e Ca
pita
lRe
serv
es &
Su
rplu
sTo
tal A
sset
sTo
tal L
iabi
litie
s To
tal I
nves
t-m
ents
Turn
over
Profi
t bef
ore
taxa
tion
Prov
isio
n fo
r ta
xatio
nPr
ofit a
fter
ta
xatio
nPr
opos
ed
Div
iden
d%
of
Shar
e-ho
ldin
g
1AD
D E
nerg
y M
anag
emen
t Com
pany
Pr
ivat
e Li
mite
d–
INR
1 1
,01,
200.
00
(95,
89,5
83.0
0)
1,4
8,91
,710
.00
2,4
3,80
,093
.00
– 2
4,59
,600
.00
3,5
8,93
3.00
–
3,5
8,93
3.00
–
44.
72
2Ad
d Te
chno
logi
es (I
ndia
) Lim
ited
–IN
R1
7,1
3,40
,000
.00
43,
98,1
67.0
0 1
5,15
,01,
265.
00
7,5
7,63
,097
.00
15,
00,0
00.0
0 1
4,57
,66,
259.
00
24,
99,2
23.0
0 6
,92,
637.
00
18,
06,5
86.0
0 –
45.
70
3Al
laha
bad
Was
te P
roce
ssin
g Co
mpa
ny L
imite
d–
INR
1 1
,21,
10,0
00.0
0 1
1,17
,93,
414.
00
30,
55,7
7,66
0.00
1
8,16
,74,
246.
00
2,0
00.0
0 –
(1,3
2,59
,421
.00)
1,2
2,28
,365
.00
(2,5
4,87
,786
.00)
–
95.
02
4Aw
a Po
wer
Com
pany
Priv
ate
Lim
ited
–IN
R1
2,7
7,68
,470
.00
16,
41,1
7,00
0.00
4
8,68
,56,
000.
00
29,
49,7
1,00
0.00
–
22,
53,0
00.0
0 (5
,05,
44,0
00.0
0)
10,
35,0
00.0
0 (5
,15,
79,0
00.0
0)
– 2
8.91
5Bh
agal
pur E
lect
ricity
Dis
trib
utio
n Co
mpa
ny P
rivat
e Li
mite
d–
INR
1 1
,00,
000.
00
(2,5
7,53
,000
.00)
1,
49,8
0,40
,000
.00
1,5
2,36
,94,
000.
00
–1,
64,9
0,54
,000
.00
(5,0
4,35
,000
.00)
(4
0,22
,000
.00)
(4
,64,
13,0
00.0
0)
– 9
9.99
6Bi
nwa
Pow
er C
ompa
ny P
rivat
e Li
mite
d–
INR
1 5
9,85
,000
.00
6,0
1,15
,000
.00
8,8
9,78
,000
.00
2,2
8,77
,000
.00
––
23,
76,0
00.0
0 –
23,
76,0
00.0
0 –
50.
79
7D
elhi
Was
te M
anag
emen
t Lim
ited
–IN
R1
1,5
0,00
,000
.00
76,
74,2
8,18
7.00
8
8,95
,13,
766.
00
10,
70,8
5,58
0.00
13,
54,5
7,12
1.00
2
9,26
,89,
473.
00
1,9
4,85
,199
.00
29,
05,9
13.0
0 1
,65,
79,2
86.0
0 –
52.
03
8D
oon
Valle
y W
aste
Man
agem
ent
Priv
ate
Lim
ited
–IN
R1
9,6
0,00
0.00
(3
,82,
80,8
09.0
0)
21,
04,3
85.0
0 3
,94,
25,1
94.0
0 –
–(4
9,42
,723
.00)
(1
0,48
,449
.00)
(3
8,94
,274
.00)
–
61.
45
9IQ
U P
ower
Com
pany
Priv
ate
Lim
ited
–IN
R1
2,9
4,75
,000
.00
5,1
5,26
,000
.00
26,
27,8
5,00
0.00
1
8,17
,84,
000.
00
– 1
,01,
23,0
00.0
0 (3
,02,
40,0
00.0
0)
(3,3
0,00
0.00
) (2
,99,
10,0
00.0
0)
– 2
8.89
10
Luni
Pow
er C
ompa
ny P
rivat
e Li
mite
d–
INR
1 2
,42,
13,0
00.0
0 2
0,26
,09,
000.
00
58,
74,2
7,00
0.00
3
6,06
,04,
000.
00
––
(12,
47,0
00.0
0)
(2,9
3,00
0.00
) (9
,54,
000.
00)
– 5
7.67
11M
adur
ai M
unic
ipal
Was
te
Proc
essi
ng C
ompa
ny P
rivat
e Li
mite
d
–IN
R1
22,
82,7
0,00
0.00
(7
,10,
78,2
48.0
0)
47,
78,2
6,55
4.00
3
2,06
,34,
802.
00
––
(2,6
5,16
,034
.00)
4
4,83
,156
.00
(3,0
9,99
,190
.00)
–
92.
33
12M
athu
ra N
agar
Was
te P
roce
ssin
g
Lim
ited
–IN
R1
61,
93,0
00.0
0 3
,91,
92,2
46.0
0 9
,21,
39,7
23.0
0 4
,67,
54,4
78.0
0 2
,700
.00
–(7
0,60
,869
.00)
26,
53,5
46.0
0 (9
7,14
,415
.00)
–
90.
25
13M
izor
am In
fras
truc
ture
D
evel
opm
ent C
ompa
ny L
imite
d–
INR
1 5
,00,
000.
00
(1,3
7,00
0.00
) 3
,78,
000.
00
15,
000.
00
––
(23,
000.
00)
–(2
3,00
0.00
) –
68.
99
14N
eoga
l Pow
er C
ompa
ny P
rivat
e Li
mite
d–
INR
1 2
,24,
73,0
00.0
0 1
2,46
,29,
000.
00
47,
34,5
7,00
0.00
3
2,63
,55,
000.
00
– 5
1,35
,000
.00
(3,3
4,87
,000
.00)
3
,08,
000.
00
(3,3
7,95
,000
.00)
–
26.
34
15PT
San
mat
i Nat
ural
Res
ourc
es
–ID
R21
1.19
72,
19,8
95.1
0 (4
0,87
,23,
571.
08)
34,
72,8
4,46
9.72
7
4,87
,88,
145.
70 1
7,14
,07,
092.
58
–(1
,54,
79,7
93.2
9)
–(1
,54,
79,7
93.2
9)
–17
SJA
DEV
ELO
PERS
PRI
VATE
LIM
ITED
–IN
R1
5,9
1,11
,000
.00
(2,4
5,18
,854
.00)
9
,55,
51,0
69.0
0 6
,09,
58,9
23.0
0 8
,83,
93,0
00.0
0 –
(29,
64,2
08.0
0)
(5,8
9,71
0.00
) (2
3,74
,498
.00)
–
43.
46
18SP
M H
oldi
ngs
Pte.
Lim
ited
–U
SD65
.04
41,
67,2
7,00
0.00
(18
,91,
54,1
67.8
3)
2,37
,70,
52,5
85.3
5 2
,14,
94,7
9,38
5.18
21,
00,7
8,41
1.80
4,
25,2
5,89
,749
.90
11,
24,8
3,73
8.93
4
4,91
,093
.71
10,
79,9
2,64
5.22
–
19SP
ML
Ener
gy L
imite
d–
INR
1 3
6,45
,00,
000.
00 (
25,4
0,92
,000
.00)
1
4,97
,88,
000.
00
3,9
3,80
,000
.00
6,5
1,46
,000
.00
–(1
,60,
97,0
00.0
0)
32,
000.
00
(1,6
1,29
,000
.00)
–
58.
07
20SP
ML
Infr
a D
evel
oper
s Li
mite
d–
INR
1 5
,00,
000.
00
(1,9
4,00
0.00
) 4
,68,
000.
00
1,6
1,00
0.00
–
–(4
2,00
0.00
) –
(42,
000.
00)
– 1
00.0
0 21
SPM
L In
fras
truc
ture
Lim
ited
–IN
R1
74,
33,0
42.0
0 2
7,16
,89,
431.
00
66,
43,6
2,99
2.00
3
8,52
,40,
518.
00 3
0,87
,05,
890.
00
77,
78,1
52.0
0 (8
,44,
59,5
50.0
0)
(43,
83,7
83.0
0)(8
,00,
75,7
67.0
0)
– 9
9.99
22
SPM
L U
tiliti
es L
imite
d–
INR
1 2
0,00
,00,
000.
00 (
12,8
2,57
,000
.00)
1
4,23
,91,
000.
00
7,0
6,48
,000
.00
7,9
7,26
,000
.00
– 8
,75,
000.
00
4,9
3,00
0.00
3
,82,
000.
00
– 1
00.0
0 23
Subh
ash
Kabi
ni P
ower
Cor
pora
tion
Lim
ited
–IN
R1
43,
74,0
0,00
0.00
4
5,85
,28,
000.
00
1,79
,31,
68,0
00.0
0 8
9,72
,40,
000.
00 7
4,92
,82,
000.
00
16,
47,6
1,00
0.00
1
,16,
09,0
00.0
0 4
,99,
000.
00
1,1
1,10
,000
.00
– 4
4.72
24Su
bhas
h U
rja P
rivat
e Li
mite
d–
INR
1 1
,00,
000.
00
(51,
000.
00)
78,
000.
00
28,
000.
00
––
(20,
000.
00)
–(2
0,00
0.00
) –
100
.00
AOC-
1
a.
Add
Urba
n En
viro
Lim
ited
and
Jam
shed
pur W
aste
Pro
cess
ing
Com
pany
Priv
ate
Lim
ited
have
bee
n m
erge
d w
ith S
PML
Infra
Lim
ited
and
as s
uch
have
not
bee
n se
pera
tely
dis
clos
ed a
bove
.b.
SP
ML
Infr
apro
ject
s Li
mite
d ha
ve b
een
strik
ed o
ff du
ring
the
year
and
as
such
hav
e no
t bee
n di
sclo
sed
c.
“the
follo
win
g co
mpa
nies
hav
e ap
plie
d fo
r str
ike
off d
urin
g th
e ye
ar a
nd th
e ap
plic
atio
n is
und
er p
roce
ss a
nd a
s su
ch h
ave
not b
een
sepe
rate
ly d
iscl
osed
:i.
Ru
pin
Tons
Pow
er C
ompa
ny P
rivat
e Li
mite
dii.
To
ns V
alle
y Po
wer
Com
pany
Priv
ate
Lim
ited
iii.
Utta
rkas
hi P
ower
Com
pany
Priv
ate
Lim
ited"
d.
D
urin
g th
e ye
ar S
yner
gy P
rom
oter
s Pv
t. Lt
d. h
as c
ease
d to
be
Subs
idia
ry o
f the
Com
pany
& s
o ha
ve n
ot b
een
sepa
rate
ly d
iscl
osed
.

SPML Infra Limited Annual Report 2017-18166
PART
‘B’ -
`
In L
akhs
Sl
. N
o.N
ame
of E
ntity
Late
st
Audi
ted
Bala
nce
Shee
t Dat
e
Repo
rtin
g Cu
rren
cyN
o. o
f Sh
ares
he
ld b
y th
e Co
mpa
ny in
as
soci
ate/
join
t ve
ntur
e on
th
e ye
ar
end
Amou
nt o
f In
vest
men
t in
as
ssoc
iate
/jo
int
vent
ure
Exte
nt o
f H
oldi
ng(%
)Si
gnifi
cant
In
fluen
ceRe
ason
w
hy th
e as
soci
ate/
join
t ven
ture
is
not
co
nsol
idat
ed
Net
wor
th
attr
ibut
able
to
shar
ehol
ding
as
per
late
st
bala
nce
shee
t
Shar
e of
pro
fit/l
oss
for t
he y
ear
Cons
ider
ed in
Co
nsol
idat
ion
Not
Con
side
red
in C
onso
lidat
ion
A.Jo
int V
entu
res
1Au
rang
abad
City
Wat
er U
tility
Co
mpa
ny L
imite
d31
st M
ar-1
8IN
R 1
9,40
5 1
,04,
77,0
00
40.0
1N
.A.
35,
85,7
6,42
1.70
(1,
99,9
9,79
8.70
) (2
,99,
87,2
01.3
0)
2G
urha
The
rmal
Pow
er C
ompa
ny
Lim
ited
31st
Mar
-18
INR
25,
000
2,5
0,00
0 50
.00
N.A
. 2
,50,
000.
00
––
3H
ydro
Com
p En
terp
rises
Indi
a Pr
ivat
e Li
mite
d31
st M
ar-1
8IN
R 2
2,96
,265
2
2,96
,265
50
.00
N.A
.(5
1,57
,000
.00)
(5
3,00
0.00
) (5
3,00
0.00
)
4M
alvi
ya N
agar
Wat
er S
ervi
ces
Priv
ate
Lim
ited
31st
Mar
-18
INR
22,
05,0
00
2,20
,50,
000
26.0
0N
.A.
(2,1
4,99
,920
.00)
1
,92,
28,8
80.0
0 5
,47,
28,3
50.7
7
5M
VV W
ater
Util
ity P
rivat
e Li
mite
d31
st M
ar-1
8IN
R 3
,74,
693
27,
25,7
90
47.9
9N
.A.
(2,5
1,35
,722
.30)
(2,
94,4
6,66
4.00
) (3
,19,
13,3
36.0
0)
6M
& P
Sub
hash
JV
31st
Mar
-18
INR
– 1
5,04
,415
40
.00
N.A
. 1
5,47
,200
.00
1,5
0,80
0.00
2
,26,
200.
00
7O
m M
etal
Con
sort
ium
31st
Mar
-18
INR
– 7
,18,
45,5
15
5.00
N.A
. 6
,46,
96,1
19.2
5 7
8,88
1.60
1
4,98
,750
.40
8SI
DD
HAR
TH+M
AHAV
IR+S
PML
(J.V
.)31
st M
ar-1
8IN
R–
88,
26,8
18
10.0
0N
.A.
54,
56,6
00.0
0 (1
,21,
900.
00)
(10,
97,1
00.0
0)
9SP
ML
- CI
SC
31st
Mar
-18
INR
– 3
,36,
837
50.0
0N
.A.
8,8
5,50
0.00
(8
6,50
0.00
) (8
6,50
0.00
)
10SP
ML
- H
CIL
31st
Mar
-18
INR
––
33.0
0N
.A.
(27,
45,6
00.0
0)
(26,
730.
00)
(54,
270.
00)
11SP
ML
- O
m M
etal
(JV)
Ujja
in31
st M
ar-1
8IN
R–
–50
.00
N.A
. 5
,53,
68,9
34.5
0 7
,77,
50,4
06.0
0 7
,77,
50,4
06.0
0
12SP
ML
- Si
mpl
ex
31st
Mar
-18
INR
– 3
1,34
,000
50
.00
N.A
. 3
1,34
,074
.50
2,7
2,61
5.00
2
,72,
615.
00
13Su
ez E
nviro
nnem
ent -
SPM
L JV
31
st M
ar-1
8IN
R–
–48
.00
N.A
.(1
,86,
240.
00)
1,0
3,68
0.00
1
,12,
320.
00

167Statutoryreports
Corporate Overview
Financial statements
PART
‘B’ -
`
In L
akhs
Sl
. N
o.N
ame
of E
ntity
Late
st
Audi
ted
Bala
nce
Shee
t Dat
e
Repo
rtin
g Cu
rren
cyN
o. o
f Sh
ares
he
ld b
y th
e Co
mpa
ny in
as
soci
ate/
join
t ve
ntur
e on
th
e ye
ar
end
Amou
nt o
f In
vest
men
t in
as
ssoc
iate
/jo
int v
entu
re
Exte
nt o
f H
oldi
ng(%
)Si
gnifi
cant
In
fluen
ceRe
ason
w
hy th
e as
soci
ate/
join
t ven
ture
is
not
co
nsol
idat
ed
Net
wor
th
attr
ibut
able
to
shar
ehol
ding
as
per
late
st
bala
nce
shee
t
Shar
e of
pro
fit/l
oss
for t
he y
ear
Cons
ider
ed in
Co
nsol
idat
ion
Not
Con
side
red
in C
onso
lidat
ion
B.As
soci
ates
1Au
rang
abad
Jal
Con
stru
ctio
n Pr
ivat
e Li
mite
d31
st M
ar-1
8IN
R 2
,600
2
6,00
0 26
.00
Cont
rols
mor
e th
an
20%
of s
hare
cap
ital
(66,
504.
36)
(9,8
80.0
0)
(28,
120.
00)
2Au
rang
abad
Jal
Sup
ply
Solu
tion
Priv
ate
Lim
ited
31st
Mar
-18
INR
2,6
00
26,
000
26.0
0Co
ntro
ls m
ore
than
20
% o
f sha
re c
apita
l(2
,23,
15,5
40.0
0)(1
,05,
96,0
40.0
0)
(3,0
1,57
,960
.00)
3Bh
ilwar
a Ja
ipur
Tol
l Roa
d Pr
ivat
e Li
mite
d31
st M
ar-1
8IN
R 3
5,20
,302
51,9
1,38
,000
51
.00
Cont
rols
mor
e th
an
20%
of s
hare
cap
ital
46,
42,2
8,86
2.88
(4,
51,7
6,51
5.53
)
4M
izor
am M
iner
al D
evel
opm
ent
Corp
orat
ion
Lim
ited*
*31
st M
ar-1
8IN
R 7
3,50
0 –
48.6
7Co
ntro
ls m
ore
than
20
% o
f sha
re c
apita
l 1
,76,
672.
10
(11,
194.
10)
(11,
805.
90)
5PT
Bin
a In
san
Suks
es M
andi
ri31
st M
ar-1
8ID
R 2
,738
72,5
8,82
,000
29
.14
Cont
rols
mor
e th
an
20%
of s
hare
cap
ital
8,6
9,96
,993
.01
28,
63,4
7,00
0.00
37
,09,
67,0
00.0
0
6PT
Var
dham
an L
ogis
tics
31st
Mar
-18
IDR
1,3
7,50
0 8
9,63
,000
17
.73
Cont
rols
mor
e th
an
20%
of s
hare
cap
ital
47,
20,4
28.4
0 7
9,00
0.00
1
,01,
000.
00
7PT
Var
dham
an M
inin
g Se
rvic
es31
st M
ar-1
8ID
R 4
,56,
500
3,1
6,92
,000
29
.44
Cont
rols
mor
e th
an
20%
of s
hare
cap
ital
(2,1
3,12
,396
.68)
–
–
8Ra
baan
(S) P
te L
imite
d31
st M
ar-1
8U
SD 7
,840
2
,48,
000
29.4
4Co
ntro
ls m
ore
than
20
% o
f sha
re c
apita
l–
(1,1
5,00
0.00
) (1
,47,
000.
00)
9Sa
nmat
i Inf
ra D
evel
oper
s Pr
ivat
e Li
mite
d31
st M
ar-1
8IN
R 5
,00,
000
50,
00,0
00
25.0
0Co
ntro
ls m
ore
than
20
% o
f sha
re c
apita
l(4
,69,
10,8
86.5
0) (
1,69
,96,
861.
50)
10SP
ML
Bhiw
andi
Wat
er S
uppl
y In
fra
Lim
ited
31st
Mar
-18
INR
2,2
4,70
0 2
,24,
700
44.9
4Co
ntro
ls m
ore
than
20
% o
f sha
re c
apita
l(3
,02,
895.
60)
(26,
514.
60)
(32,
485.
40)
11SP
ML
Bhiw
andi
Wat
er S
uppl
y M
anag
emen
t Lim
ited
31st
Mar
-18
INR
2,5
0,00
0 2
,50,
000
50.0
0Co
ntro
ls m
ore
than
20
% o
f sha
re c
apita
l(1
,45,
000.
00)
(29,
500.
00)
(29,
500.
00)

SPML Infra Limited Annual Report 2017-18168
COnsOlIdatedFINANCIAL STATEMENTS

169Statutoryreports
Corporate Overview
Financial statements
Report on the Consolidated Financial Statements1. We have audited the accompanying consolidated Ind
AS financial statements of SPML Infra Limited (“the Holding Company”) and its subsidiaries (the Holding Company and its subsidiaries together referred to as “the Group”), its associates and jointly controlled entities, which comprise the Consolidated Balance Sheet as at 31st March, 2018, the Consolidated Statement of Profit and Loss (including Other Comprehensive Income), the Consolidated Cash Flow Statement and the Consolidated Statement of Changes in Equity for the year then ended, and a summary of the significant accounting policies and other explanatory information (hereinafter referred to as “the consolidated financial statements”).
Management’s Responsibility for the Consolidated Financial Statements2. The Holding Company’s Board of Directors is
responsible for the preparation of these consolidated financial statements in terms of the requirements of the Companies Act, 2013 (“the Act”) that give a true and fair view of the consolidated state of affairs (consolidated financial position), consolidated profit or loss (consolidated financial performance including other comprehensive income), consolidated cash flows and consolidated changes in equity of the Group and its associates and jointly controlled entities in accordance with the accounting principles generally accepted in India, including the Indian Accounting Standards (Ind AS) prescribed under Section 133 of the Act. The Holding Company’s Board of Directors, and the respective Board of Director/management of the subsidiaries included in the Group, and of its associates and jointly controlled entities are responsible for the design, implementation and maintenance of internal control relevant to the preparation and presentation of the financial statements that give a true and fair view and are free from material misstatement, whether due to fraud or error. Further, in terms with the provisions of the Act, the respective Board of Directors of the Holding Company and its subsidiary, associate and jointly controlled companies, which are incorporated in India are responsible for maintenance of adequate accounting records, safeguarding the assets, preventing and detecting frauds and other irregularities, selection and application of appropriate accounting policies, making judgements and estimates that are reasonable and prudent, and design, implementation and maintenance of adequate internal financial controls, that
were operating effectively for ensuring the accuracy and completeness of the accounting records, relevant to the preparation and presentation of the financial statements that give a true and fair view and are free from material misstatement, whether due to fraud or error, which have been used for the purpose of preparation of the consolidated financial statements by the directors of the Holding Company, as aforesaid.
Auditors’ Responsibility3. Our responsibility is to express an opinion on these
consolidated financial statements based on our audit. While conducting the audit, we have taken into account the provisions of the Act, the accounting and auditing standards and matters which are required to be included in the audit report under the provisions of the Act and the Rules made there under.
4. We conducted our audit in accordance with the Standards on Auditing specified under Section 143(10) of the Act. Those Standards require that we comply with ethical requirements and plan and perform the audit to obtain reasonable assurance about whether the consolidated financial statements are free from material misstatement.
5. An audit involves performing procedures to obtain audit evidence about the amounts and the disclosures in the consolidated financial statements. The procedures selected depend on the auditor’s judgment, including the assessment of the risks of material misstatement of the consolidated financial statements, whether due to fraud or error. In making those risk assessments, the auditor considers internal financial control relevant to the Holding Company’s preparation of the consolidated financial statements that give a true and fair view in order to design audit procedures that are appropriate in the circumstances. An audit also includes evaluating the appropriateness of the accounting policies used and the reasonableness of the accounting estimates made by the Holding Company’s Board of Directors, as well as evaluating the overall presentation of the consolidated financial statements.
6. We believe that the audit evidence obtained by us and the audit evidence obtained by the other auditors in terms of their reports referred to in paragraph 14 of the Other Matters paragraph below, is sufficient and appropriate to provide a basis for our qualified audit opinion on the consolidated financial statements.
TO THE MEMBERS OF SPML INFRA LIMITED
Independent Auditor’s Report
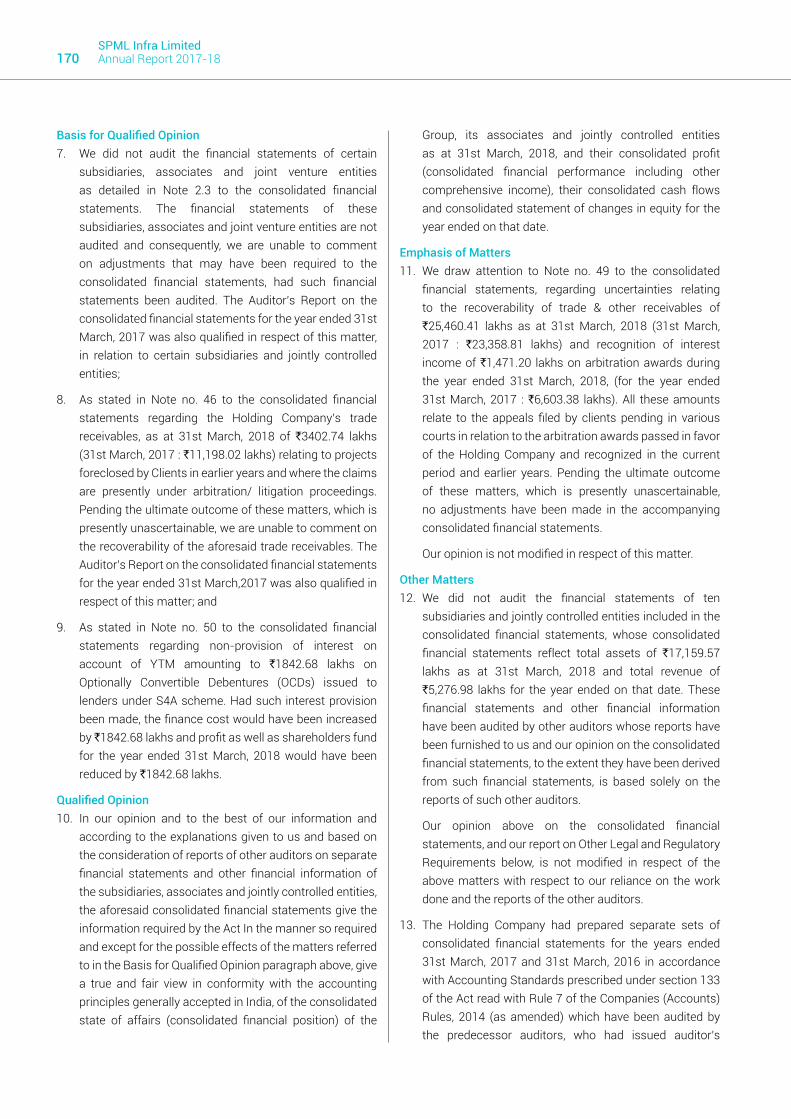
SPML Infra Limited Annual Report 2017-18170
Basis for Qualified Opinion7. We did not audit the financial statements of certain
subsidiaries, associates and joint venture entities as detailed in Note 2.3 to the consolidated financial statements. The financial statements of these subsidiaries, associates and joint venture entities are not audited and consequently, we are unable to comment on adjustments that may have been required to the consolidated financial statements, had such financial statements been audited. The Auditor’s Report on the consolidated financial statements for the year ended 31st March, 2017 was also qualified in respect of this matter, in relation to certain subsidiaries and jointly controlled entities;
8. As stated in Note no. 46 to the consolidated financial statements regarding the Holding Company’s trade receivables, as at 31st March, 2018 of `3402.74 lakhs (31st March, 2017 : `11,198.02 lakhs) relating to projects foreclosed by Clients in earlier years and where the claims are presently under arbitration/ litigation proceedings. Pending the ultimate outcome of these matters, which is presently unascertainable, we are unable to comment on the recoverability of the aforesaid trade receivables. The Auditor’s Report on the consolidated financial statements for the year ended 31st March,2017 was also qualified in respect of this matter; and
9. As stated in Note no. 50 to the consolidated financial statements regarding non-provision of interest on account of YTM amounting to `1842.68 lakhs on Optionally Convertible Debentures (OCDs) issued to lenders under S4A scheme. Had such interest provision been made, the finance cost would have been increased by `1842.68 lakhs and profit as well as shareholders fund for the year ended 31st March, 2018 would have been reduced by `1842.68 lakhs.
Qualified Opinion10. In our opinion and to the best of our information and
according to the explanations given to us and based on the consideration of reports of other auditors on separate financial statements and other financial information of the subsidiaries, associates and jointly controlled entities, the aforesaid consolidated financial statements give the information required by the Act In the manner so required and except for the possible effects of the matters referred to in the Basis for Qualified Opinion paragraph above, give a true and fair view in conformity with the accounting principles generally accepted in India, of the consolidated state of affairs (consolidated financial position) of the
Group, its associates and jointly controlled entities as at 31st March, 2018, and their consolidated profit (consolidated financial performance including other comprehensive income), their consolidated cash flows and consolidated statement of changes in equity for the year ended on that date.
Emphasis of Matters11. We draw attention to Note no. 49 to the consolidated
financial statements, regarding uncertainties relating to the recoverability of trade & other receivables of `25,460.41 lakhs as at 31st March, 2018 (31st March, 2017 : `23,358.81 lakhs) and recognition of interest income of `1,471.20 lakhs on arbitration awards during the year ended 31st March, 2018, (for the year ended 31st March, 2017 : `6,603.38 lakhs). All these amounts relate to the appeals filed by clients pending in various courts in relation to the arbitration awards passed in favor of the Holding Company and recognized in the current period and earlier years. Pending the ultimate outcome of these matters, which is presently unascertainable, no adjustments have been made in the accompanying consolidated financial statements.
Our opinion is not modified in respect of this matter.
Other Matters 12. We did not audit the financial statements of ten
subsidiaries and jointly controlled entities included in the consolidated financial statements, whose consolidated financial statements reflect total assets of `17,159.57 lakhs as at 31st March, 2018 and total revenue of `5,276.98 lakhs for the year ended on that date. These financial statements and other financial information have been audited by other auditors whose reports have been furnished to us and our opinion on the consolidated financial statements, to the extent they have been derived from such financial statements, is based solely on the reports of such other auditors.
Our opinion above on the consolidated financial statements, and our report on Other Legal and Regulatory Requirements below, is not modified in respect of the above matters with respect to our reliance on the work done and the reports of the other auditors.
13. The Holding Company had prepared separate sets of consolidated financial statements for the years ended 31st March, 2017 and 31st March, 2016 in accordance with Accounting Standards prescribed under section 133 of the Act read with Rule 7 of the Companies (Accounts) Rules, 2014 (as amended) which have been audited by the predecessor auditors, who had issued auditor’s

171Statutoryreports
Corporate Overview
Financial statements
reports dated 25th August, 2017 and 22nd August, 2016 respectively, expressing modified opinion with emphasis of matters. These consolidated financial statements have been adjusted for the differences in the accounting principles adopted by the Holding Company on transition to Ind AS, which have been audited by us.
Our opinion is not modified in respect of this matter.
Report on Other Legal and Regulatory Requirements14. As required by Section 143(3) of the Act, based on our
audit and on the consideration of the reports of the other auditors on separate financial statements and other financial information of the subsidiaries, associates and joint ventures, we report, to the extent applicable, that :
a. We have sought and, except for the possible effects of the matters described in the Basis for Qualified Opinion paragraph, obtained all the information and explanations which to the best of our knowledge and belief were necessary for the purpose of our audit of the aforesaid consolidated financial statements;
b. Except for the possible effects of the matters described in the Basis for Qualified Opinion paragraph, in our opinion, proper books of account as required by law relating to preparation of the aforesaid consolidated financial statements have been kept so far as it appears from our examination of those books and the reports of the other auditors;
c. The consolidated financial statements dealt with by this Report are in agreement with the relevant books of account maintained for the purpose of preparation of the consolidated financial statements;
d. Except for the possible effects of the matters described in the Basis for Qualified Opinion paragraph, in our opinion, the aforesaid consolidated financial statements comply with the Indian Accounting Standards (Ind AS) specified under Section 133 of the Act.
e. The matters described under the Basis for Qualified Opinion and Emphasis of Matters paragraphs, in our opinion, may have an adverse effect on the functioning of the Group;
f. On the basis of the written representations received from the directors of the Holding Company as on 31st March, 2018 taken on record by the Board of Directors of the Holding Company and the reports of the other statutory auditors of its subsidiary companies, associate companies and jointly controlled companies incorporated in India, none of
the directors of the Group companies, its associate companies and jointly controlled companies, incorporated in India is disqualified as on 31st March, 2018 from being appointed as a director in terms of Section 164 (2) of the Act.
g. With respect to the adequacy of the internal financial controls over financial reporting of the Holding Company, its subsidiary companies, associate companies and jointly controlled entities incorporated in India and the operating effectiveness of such controls, refer to our separate Report in “Annexure - A’.
h. With respect to the other matters to be included in the Auditor’s Report in accordance with Rule 11 of the Companies (Audit and Auditor’s) Rules, 2014, in our opinion and to the best of our information and according to the explanations given to us and based on the consideration of the report of the other auditors on separate financial statements as also the other financial information of the subsidiaries, associates and jointly controlled entities:
i. Except for the possible effects of the matters described under the Basis for Qualified Opinion paragraph, the consolidated financial statements disclose the impact of pending litigations on the consolidated financial position of the Group, its associates and jointly controlled entities;
ii. Except for the possible effects of the matters described under the Basis for Qualified Opinion paragraph, provision has been made in the consolidated financial statements, as required under the applicable law or Ind AS, for material foreseeable losses on long-term contracts including derivative contracts.
iii. There has been no delay in transferring amounts, required to be transferred, to the Investor Education and Protection Fund by the Holding Company, and its subsidiary companies, associate companies and jointly controlled companies incorporated in India during the year ended 31st March, 2018.
For Maheshwari & Associates Chartered Accountants FRN: 311008E
CA. Bijay MurmuriaPlace: Gurgaon Partner Date: 30th May, 2018 Membership No. : 055788

SPML Infra Limited Annual Report 2017-18172
1. In conjunction with our audit of the consolidated financial statements of the SPML Infra Limited (“the Holding Company”) and its subsidiaries, (the Holding Company and its subsidiaries together referred to as “the Group”), its associates and jointly controlled entities as of and for the year ended 31st March, 2018, we have audited the Internal Financial Controls over Financial Reporting (IFCoFR) of the Holding Company, its subsidiary companies, its associate companies and jointly controlled companies, which are companies incorporated in India as at that date.
Management’s Responsibility for Internal Financial Controls 2. The respective Board of Directors of the Holding
Company, its subsidiary companies, its associate companies and jointly controlled companies, which are companies incorporated in India, are responsible for establishing and maintaining internal financial controls based on the internal control over financial reporting criteria established by the Company considering the essential components of internal control stated in the Guidance Note on Audit of Internal Financial Controls Over Financial Reporting (“the Guidance Note”) issued by the Institute of Chartered Accountants of India (“ICAI”). These responsibilities include the design, implementation and maintenance of adequate internal financial controls that were operating effectively for ensuring the orderly and efficient conduct of the its business, including adherence to the respective Company’s policies, the safeguarding of its assets, the prevention and detection of frauds and errors, the accuracy and completeness of the accounting records, and the timely preparation of reliable financial information, as required under the Act.
Auditors’ Responsibility3. Our responsibility is to express an opinion on the IFCoFR
of the Holding Company, its subsidiary companies, its associate companies and jointly controlled companies as aforesaid, based on our audit. We conducted our audit in accordance with the Guidance Note issued by the ICAI and the Standards on Auditing, issued by ICAI and deemed to be prescribed under section 143(10) of the Act,
to the extent applicable to an audit of internal financial controls. Those Standards and the Guidance Note require that we comply with ethical requirements and plan and perform the audit to obtain reasonable assurance about whether adequate internal financial controls over financial reporting was established and maintained and if such controls operated effectively in all material respects.
Our audit involves performing procedures to obtain audit evidence about the adequacy of the IFCoFR and their operating effectiveness. Our audit of IFCoFR included obtaining an understanding of IFCoFR, assessing the risk that a material weakness exists, and testing and evaluating the design and operating effectiveness of internal control based on the assessed risk. The procedures selected depend on the auditor’s judgement, including the assessment of the risks of material misstatement of the financial statements, whether due to fraud or error.
We believe that the audit evidence we have obtained and the audit evidence obtained by the other auditors in terms of their reports referred to in the Other Matters paragraph below, is sufficient and appropriate to provide a basis for our audit opinion on the IFCoFR of the Holding Company, its subsidiary companies, its associate companies and jointly controlled companies as aforesaid.
Meaning of Internal Financial Controls Over Financial Reporting 4. A Company’s IFCoFR is a process designed to provide
reasonable assurance regarding the reliability of financial reporting and the preparation of financial statements for external purposes in accordance with generally accepted accounting principles. A Company’s IFCoFR includes those policies and procedures that (1) pertain to the maintenance of records that, in reasonable detail, accurately and fairly reflect the transactions and dispositions of the assets of the Company; (2) provide reasonable assurance that transactions are recorded as necessary to permit preparation of financial statements in accordance with generally accepted accounting principles, and that receipts and expenditures of the Company are being made only in accordance with authorizations
Report on the Internal Financial Controls under Clause (i) of Sub-section 3 of Section 143 of the Companies Act, 2013 (“the Act”)
“Annexure A” to the Independent Auditors’ Report

173Statutoryreports
Corporate Overview
Financial statements
of management and directors of the Company; and (3) provide reasonable assurance regarding prevention or timely detection of unauthorized acquisition, use, or disposition of the Company’s assets that could have a material effect on the financial statements.
Inherent Limitations of Internal Financial Controls Over Financial Reporting 5. Because of the inherent limitations of IFCoFR, including
the possibility of collusion or improper management override of controls, material misstatements due to error or fraud may occur and not be detected. Also, projections of any evaluation of the IFCoFR to future periods are subject to the risk that the IFCoFR may become inadequate because of changes in conditions, or that the degree of compliance with the policies or procedures may deteriorate.
Opinion 6. In our opinion, the Holding Company, its subsidiary
companies, its associate companies and jointly controlled companies, which are companies incorporate in India, have, in all material respects, an adequate internal financial controls system over financial reporting and such internal financial controls over financial reporting were operating effectively as at March 31, 2018, based
on the internal control over financial reporting criteria established by the Company considering the essential components of internal control stated in the Guidance Note issued by the ICAI.
Other Matters7. Our aforesaid report under Section 143(3)(i) of the Act on
the adequacy and operating effectiveness of the IFCoFR in so far as it relates to:
i) Certain subsidiaries and jointly controlled entities, which are companies incorporated in India, is based on the corresponding reports of the auditors of such companies incorporated in India;
ii) Certain subsidiaries, associates and joint venture companies, is based solely on the representation provided by the management.
For Maheshwari & Associates Chartered Accountants FRN: 311008E
CA. Bijay MurmuriaPlace: Gurgaon Partner Date: 30th May, 2018 Membership No. : 055788

SPML Infra Limited Annual Report 2017-18174
` In Lakhs Particulars Note
No.As at
March 31, 2018As at
March 31, 2017As at
April 1, 2016ASSETSNon-current assets(a) Property, plant and equipment 3 25,714.65 28,023.88 29,081.25 (b) Capital Work in Progress 4 4,840.84 5,440.65 7,247.70 (c) Intangible assets 5 3,699.77 2,757.65 2,119.56 (d) Investment Property 883.93 – –(e) Financial assets (i) Investments 6 12,782.10 19,365.09 18,568.17 (ii) Trade receivables 8 31,390.67 31,620.32 39,074.78 (iii) Loans 9 5,710.90 2,428.27 1,729.28 (iv) Other Non- Current Financial Assets 10 4,112.02 3,466.75 3,623.54 (f) Non Current Tax Assets 11.1 6,142.11 9,154.15 7,893.31 (g) Deferred Tax Assets 23 5,752.09 5,339.96 4,050.08 (h) Other non-current assets 12 28,262.96 22,338.08 13,374.62
1,29,292.04 1,29,934.80 1,26,762.29 Current assets(a) Inventories 13 7,735.79 7,230.28 7,483.51 (b) Financial assets
(i) Investments 7 2,442.32 – –(ii) Trade receivables 8 85,987.80 65,113.19 59,475.88 (iii) Cash and Cash Equivalents 14.1 2,480.62 4,294.43 4,594.84 (iv) Other Bank Balances 14.2 10,050.94 11,294.00 8,872.07 (v) Loans 9 2,464.70 4,554.69 5,375.35 (vi) Other Current financial Assets 10 3,136.43 2,061.51 2,969.74
(c) Current Tax Assets 11.1 123.37 482.47 1,389.31 (d) Other current assets 12 93,002.42 74,899.15 67,853.26
2,07,424.39 1,69,929.72 1,58,013.96 TOTAL ASSETS 3,36,716.43 2,99,864.52 2,84,776.25 EQUITY AND LIABILITIESEquity(a) Equity Share capital 15 819.45 819.45 819.45 (b) Other Equity 16 45,672.71 37,221.69 39,826.55 Equity attributable to equity holders of the parent 46,492.16 38,041.14 40,646.00 (c) Non-controlling interests 11,063.53 9,449.18 6,664.96 Total Equity 57,555.69 47,490.32 47,310.96 LIABILITIESNon-current liabilities(a) Financial liabilities
(i) Borrowings 17 73,479.57 28,813.30 25,977.84 (ii) Trade Payables 18 5,525.04 7,957.02 7,889.38 (iii) Other Non- Current Financial Liabilities 21 5,152.47 7,967.96 8,088.91
(b) Deferred Tax Liability 23 14.97 32.02 99.47 (c) Provisions 19 710.73 562.87 535.44
84,882.78 45,333.17 42,591.04 Current liabilities(a) Financial liabilities
(i) Borrowings 20 57,621.51 87,133.06 62,545.42 (ii) Trade payables 18 96,356.08 90,289.26 1,10,738.91 (iii) Other current financial liabilities 21 33,822.19 23,118.86 18,822.60
(b) Other current liabilities 22 5,873.07 5,907.40 2,013.84 (c) Provisions 19 142.40 331.95 418.54 (d) Current Tax Liability 11.2 462.71 260.50 334.94 Total liabilities 1,94,277.96 2,07,041.03 1,94,874.25 TOTAL EQUITY AND LIABILTIES 3,36,716.43 2,99,864.52 2,84,776.25 Significant Accounting Policies & Notes to Consolidated Financial Statements 1 to 57
The Notes referred to above form an integral part of the Consolidated Financial Statements. This is the Consolidated Balance Sheet referred in our report of even date
For Maheshwari & Associates For and on behalf of Board of Directors ofChartered Accountants SPML Infra LimitedICAI Firm Registration No. 311008E
CA Bijay Murmuria Subhash Chand Sethi Sushil Kr. SethiPartner Chairman Managing DirectorMembership No 055788 DIN No.00464390 DIN No.00062927
Place: Gurgaon Abhay Raj Singh Sujit Kumar JhunjunwalaDate: 30th May 2018 Company Secretary Chief Financial Officer
Consolidated Balance Sheet as at March 31, 2018

175Statutoryreports
Corporate Overview
Financial statements
` In Lakhs Particulars Note 2017-18 2016-17 INCOMERevenue from Operations 24 2,04,947.99 2,27,581.41 Other Income 25 6,070.74 9,761.17 Total Income 2,11,018.73 2,37,342.58 ExpensesMaterials consumed and direct expenses 26 97,937.38 89,941.39 Purchase of traded goods 65,378.60 95,607.70 Change in work in progress and traded goods 27 – 32.44 Employee benefits expenses 28 7,280.92 8,410.76 Depreciation and amortisation expenses 29 1,683.41 2,113.75 Finance Cost 30 21,357.13 26,035.51 Other Expenses 31 12,782.21 16,428.15 Total Expenses 2,06,419.65 2,38,569.70 Profit / (Loss) before share of (profit) / loss of associate and joint venture, exceptional items and tax
4,599.08 (1,227.12)
Share of profit / (loss) from investment in associates and joint ventures 1,363.22 151.09 Non - Controlling share of profit/(loss) (213.11) 425.86 Profit/(loss) before tax 6,175.41 (1,501.88) Tax ExpensesCurrent tax 1,499.78 561.05 Tax for earlier years 1.09 21.53 Minimum Alternate Tax credit (238.50) 10.33 Deferred tax credit (net) (127.27) (1,240.83) Total Tax Expense 1,135.10 (647.92) Profit for the year 5,040.31 (853.97) Other Comprehensive Income (OCI)Other comprehensive income not to be reclassified to profit or loss in subsequent periods:Re-Measurement gains on defined benefit plans 154.24 83.39 Income Tax effect on the above (53.38) (28.86) Other comprehensive income to be reclassified to profit or loss in subsequent periods:Translation difference of Foreign Operation 161.16 (59.10) Income Tax effect on fair valuation of investment (14.28) –Other Comprehensive Income for the year, (net of tax) 247.74 (4.57) Total Comprehensive Income for the year (net of tax) 5,288.05 (858.54) Earnings per share - Basic and Diluted (Nominal value `2 per share) 14.43 (2.34) Significant Accounting Policies & Notes to Consolidated Financial Statements 1 to 57The Notes referred to above form an integral part of the Consolidated Financial Statements. This is the Consolidated Statement of Profit and Loss referred to in our report of even date.
For Maheshwari & Associates For and on behalf of Board of Directors ofChartered Accountants SPML Infra LimitedICAI Firm Registration No. 311008E
CA Bijay Murmuria Subhash Chand Sethi Sushil Kr. SethiPartner Chairman Managing DirectorMembership No 055788 DIN No.00464390 DIN No.00062927
Place: Gurgaon Abhay Raj Singh Sujit Kumar JhunjunwalaDate: 30th May 2018 Company Secretary Chief Financial Officer
Consolidated Statement of Profit and Loss for the year ended 31 March 2018

SPML Infra Limited Annual Report 2017-18176
Consolidated Statement of Changes in Equity for the year ended 31 March 2018
A) Equity Share Capital (also refer note 15) ` In Lakhs Particulars Subscribed and
Fully Paid-up Total Equity share capital
No. of Shares Amount Amount Balance as at April 1, 2016 3,66,50,276 819.45 819.45 Balance as at March 31, 2017 3,66,50,276 819.45 819.45 Balance as at March 31, 2018 3,66,50,276 819.45 819.45
B) Other Equity (also refer note 16) ` In Lakhs Capital Reserve
Capital Reserve on
Consolidation
Securities Premium Account
General Reserve
Foreign Currency
Translation Reserve
Retained earnings
(including Other Comprehensive
Income)
Total
Balance as at April 1, 2016 1,368.86 782.79 16,171.44 5,929.05 – 15,574.41 39,826.55 Profit for the year – – – – – (853.97) (853.97)Other comprehensive income for the year, net of tax
– – – – – (4.57) (4.57)
Total comprehensive income for the year
– – – – – (858.54) (858.54)
Other Additions/ (deductions) – 500.77 – – (1,923.77) (323.32) (1,746.32)Balance as at March 31, 2017 1,368.86 1,283.56 16,171.44 5,929.05 (1,923.77) 14,392.55 37,221.69 Profit for the year – – – – – 5,040.30 5,040.30 Other comprehensive income for the year, net of tax
– – – – – 247.74 247.74
Total comprehensive income for the year
– – – – – 5,288.04 5,288.05
Other Additions/ (deductions) (266.23) 677.61 – – 1,024.55 1,727.04 3,162.97 Balance as at March 31, 2018 1,102.63 1,961.17 16,171.44 5,929.05 (899.22) 21,407.64 45,672.71 Significant Accounting Policies & Notes to Consolidated Financial Statements
1 to 57
The Notes referred to above form an integral part of the Consolidated Financial Statements.
For Maheshwari & Associates For and on behalf of Board of Directors ofChartered Accountants SPML Infra LimitedICAI Firm Registration No. 311008E
CA Bijay Murmuria Subhash Chand Sethi Sushil Kr. SethiPartner Chairman Managing DirectorMembership No 055788 DIN No.00464390 DIN No.00062927
Place: Gurgaon Abhay Raj Singh Sujit Kumar JhunjunwalaDate: 30th May 2018 Company Secretary Chief Financial Officer

177Statutoryreports
Corporate Overview
Financial statements
Consolidated Cash Flow Statement for the year ended 31 March 2018
` In Lakhs Particulars Year ended
March 31, 2018 Year ended
March 31, 2017 A. CASH FLOWS FROM OPERATING ACTIVITIES
Profit before tax 6,175.41 1,024.63 Adjustments for:
Depreciation and Amortisation expenses 1,683.41 2,113.75 Interest Expenses 21,254.47 25,948.03 Company's share in (profit) /loss of Joint Ventures – –Bad debts written off 1,653.06 4,586.89 Provision for doubtful debts 1,023.18 2,857.40 Profit on sale of property plant and equipment 86.33 4.68 Provisions/unspent Liabilities no longer required written back (1,385.06) (163.51)Interest Income (2,029.26) (14,219.44)
Operating Profit before Working Capital changes 28,461.54 22,152.43 Adjustment for:
Increase in trade payables 37,974.90 (20,218.50)Increase/(decrease) in provisions (7.06) (2,164.38)Increase in other current liabilities 5,797.60 5,199.86 Increase in trade receivables (23,321.19) (5,627.15)Decrease/ (increase) in inventories (505.51) 253.23 Increase in loans and advances (4,563.23) 269.81 Increase in other current assets (22,414.46) (14,812.82)
Cash generated from operations 21,422.59 (14,947.52)Taxes Paid (net of refunds) 2,009.07 (1,137.85)Net Cash from Operating Activities 23,431.66 (16,085.37)
B. CASH FLOWS FROM INVESTING ACTIVITIESPurchase of PPE including capital work in progress and capital advances (1,285.00) (699.95)Proceeds from sale of PPE 735.42 735.42 Advance given for purchase of sharesProfit from Joint VentureFixed Deposits encashed/matured 595.99 (2,267.07)Sale / (purchase) of non-current investments: 4,140.67 (796.92)Loans refunded by other related party 1,945.86 (425.82)Interest received 628.20 14,281.24 Net Cash used in Investing Activities 6,761.14 10,826.90

SPML Infra Limited Annual Report 2017-18178
` In Lakhs Particulars Year ended
March 31, 2018 Year ended
March 31, 2017 C. CASH FLOWS FROM FINANCING ACTIVITIES
Proceeds from issue of equity shares to minority shareholder in a subsidiary 3,965.88 2,535.81 Net movement in Long Term Borrowings (8,248.84) 5,459.33 Net movement in Short Term Borrowings (7,724.55) 24,587.64 Proceeds/ (Repayment) from / of Mobilisation Advances (net)Dividend Paid (including corporate dividend tax) – –Interest paid (21,023.65) (25,700.96)Net Cash used in Financing Activities (33,031.16) 6,881.82
D. Exchange differences on translation of foreign subsidiaries 1,024.55 (1,923.77)
Net Increase/(Decrease) in Cash & Cash Equivalents (1,813.81) (300.42)Cash & Cash Equivalents at the beginning of the year 4,294.43 4,594.84 Cash & Cash Equivalents at the end of the year (Refer note 14) 2,480.62 4,294.43
Significant Accounting Policies & Notes to Consolidated Financial Statements 1 to 57
Cash Flow Statement for the year ended 31 March 2018
The Notes referred to above form an integral part of the Consolidated Financial Statements.
For Maheshwari & Associates For and on behalf of Board of Directors ofChartered Accountants SPML Infra LimitedICAI Firm Registration No. 311008E
CA Bijay Murmuria Subhash Chand Sethi Sushil Kr. SethiPartner Chairman Managing DirectorMembership No 055788 DIN No.00464390 DIN No.00062927
Place: Gurgaon Abhay Raj Singh Sujit Kumar JhunjunwalaDate: 30th May 2018 Company Secretary Chief Financial Officer

179Statutoryreports
Corporate Overview
Financial statements
Consolidated Financial Statement as at and for the year ended 31st March, 2018
1. CORPORATE INFORMATION The Consolidated Financial Statements comprised Financial Statements of SPML Infra Limited (the ‘Company’) and its
Subsidiaries, Joint Operations & Joint Ventures (collectively, the ‘Group’) for the year ended 31 March 2018.
The Company is a public limited company domiciled in India and incorporated under the provisions of the Companies Act, 1956. Its equity shares are listed on two stock exchanges - The BSE Limited and the National Stock Exchange of India Limited in India. The Company is engaged in the business of infrastructure development which inter-alia includes water management, water infrastructure development, waste water treatment, power generation, transmission and distribution, solid waste management, and other civil infrastructures. Information about the Group Structure is given in Note 44.
The Consolidated financial statements were authorized for issue in accordance with a resolution of the directors on May 30, 2018.
2. SIGNIFICANT ACCOUNTING POLICIESBasis of Preparation and compliance with Ind AS(i) For all periods up to and including the year ended 31 March 2017, the Group prepared its financial statements in accordance
with accounting standards notified under the section 133 of the Companies Act 2013, read together with paragraph 7 of the Companies (Accounts) Rules, 2014 (Indian GAAP).
These Consolidated financial statements for the year ended March 31, 2018 have been prepared in accordance with Indian Accounting Standards (“Ind-AS”) consequent to the notification of The Companies (Indian Accounting Standards) Rules, 2015 (the Rules) issued by the MCA. These are the first Ind-AS financial statements of the Group, wherein the Group has restated its Balance Sheet as at 1st April 2016 (the date of transition) and financial statements for the year ended and as at 31st March 2017 also as per Ind-AS.
(ii) The estimates at 1 April 2016 and at 31 March 2017 are consistent with those made for the same dates in accordance with Indian GAAP (after adjustments to reflect any differences in accounting policies). The estimates used by the Group to present these amounts in accordance with Ind-AS reflect conditions at 1st April 2016 and as of 31 March 2017.
(iii) In accordance with Ind-AS 101, the Group has presented reconciliations of Shareholders’ equity under Previous GAAP and Ind AS as at March 31, 2017, and April 1, 2016 and of the Profit after Tax as per Previous GAAP and Total Comprehensive Income under Ind AS for the year ended March 31, 2017.
Basis of measurementThese Consolidated Ind AS Financial Statements have been prepared on a going concern basis using historical cost convention, except for certain investments measured at fair value, Freehold Land measured at Fair value and defined benefit plans which have been measured at actuarial valuation as required by relevant Ind AS (refer accounting policies for financial instruments, Property, plant and Equipment and employee benefits).
Functional and presentation currencyThese Ind AS Financial Statements are prepared in Indian Rupee which is the Company’s functional and presentation currency.
2.1 Basis of Consolidation The consolidated financial statements comprise the financial statements of the Company, Joint operations and its
subsidiaries as at 31 March 2018. Control is achieved when the Group is exposed, or has rights, to variable returns from its involvement with the investee and has the ability to affect those returns through its power over the investee. Specifically, the Group controls an investee if and only if the Group has:
a. Power over the investee (i.e. existing rights that give it the current ability to direct the relevant activities of the investee)
b. Exposure, or rights, to variable returns from its involvement with the investee, and
c. The ability to use its power over the investee to affect its returns.
The Group re-assesses whether or not it controls an investee if facts and circumstances indicate that there are changes to one or more of the three elements of control. Consolidation of a subsidiary begins when the Group obtains control over the subsidiary and ceases when the Group loses control of the subsidiary.

SPML Infra Limited Annual Report 2017-18180
Consolidated financial statements are prepared using uniform accounting policies for like transactions and other events in similar circumstances. If a member of the group uses accounting policies other than those adopted in the consolidated financial statements for like transactions and events in similar circumstances, appropriate adjustments are made to that group member’s financial statements in preparing the consolidated financial statements to ensure conformity with the group’s accounting policies.
The financial statements of all entities used for the purpose of consolidation are drawn up to same reporting date as that of the parent company, i.e., year ended on 31 March. When the end of the reporting period of the parent is different from that of any entity, the entity prepares, for consolidation purposes, additional financial information as of the same date as the financial statements of the parent to enable the parent to consolidate the financial information of the entity.
In term of Ind AS 110- “Consolidated Financial Statements”, the financial statements of the Group are consolidated on a line- by- line basis by adding together the book/ fair value of like items of assets, liabilities, income and expenditure, after fully eliminating intra group balances, intra group transactions and any unrealized Profit/ Loss included therein. Profit or loss and each component of other comprehensive income (OCI) are attributed to the equity holders of the parent of the Group and to the non-controlling interests, even if this results in the non-controlling interests having a deficit balance.
The excess/shortfall of the cost to the Company of its investments in Subsidiaries over its proportionate share in the equity of the respective investee companies as at the date of acquisition of stake is recognised in the Financial Statement as Goodwill /Capital Reserve, as the case may be.
Subsidiaries are entities over which the group has control. A change in the ownership interest of a subsidiary, without a loss of control, is accounted for as an equity transaction. If the Group loses control over a subsidiary, it:
• Derecognises the assets (including goodwill) and liabilities of the subsidiary
• Derecognises the carrying amount of any non-controlling interests
• Derecognises the cumulative translation differences recorded in equity
• Recognises the fair value of the consideration received
• Recognises the fair value of any investment retained
• Recognises any surplus or deficit in profit or loss
• Reclassifies the parent’s share of components previously recognised in OCI to profit or loss or retained earnings, as appropriate, as would be required if the Group had directly disposed of the related assets or liabilities
Investments in associates and Joint ventures are accounted for using the equity method of accounting, after initially being recognised at cost. Under the equity method of accounting, the investments are initially recognised at cost and adjusted thereafter to recognise the Group’s share of the post-acquisition profits or losses of the investee in profit and loss, and the Group’s share of other comprehensive income of the investee in other comprehensive income (“”OCI””).
When the Group’s share of losses in an equity accounted investment equals or exceeds its interest in the entity, including any other unsecured long-term receivables, the Group does not recognise further losses, unless it has incurred obligations or made payments on behalf of the other entity.
The financial statements of certain subsidiaries and associates have been prepared in accordance with the following Accounting Standards:
Name of the Company Accounting StandardsSubsidiariesSPM Holdings Pte Limited Singapore Financial Reporting Standards PT Sanmati Natural Resources Indonesian Financial Accounting StandardsAssociatesPT Vardhaman Mining Services Indonesian Financial Accounting StandardsPT Vardhaman Logistics Indonesian Financial Accounting StandardsRabaan (S) Pte Limited Singapore Financial Reporting Standards PT Bina Insan Sukses Mandiri Indonesian Financial Accounting Standards
Consolidated Financial Statement as at and for the year ended 31st March, 2018

181Statutoryreports
Corporate Overview
Financial statements
The impact on account of any differences due to adoption of different accounting standards as stated above, in comparison to the Indian Accounting Standards is not material.
2.2 Investment in Joint Venture A joint venture is a type of joint arrangement whereby the entities that have joint control of the arrangement have rights
to the net assets of the joint venture. Joint control is the contractually agreed sharing of control of an arrangement, which exists only when decisions about the relevant activities require unanimous consent of the entities sharing control.
The Group’s investments in its joint venture are accounted for using the equity method. Under the equity method, the investment in a joint venture is initially recognized at cost. The carrying amount of the investment is adjusted to recognize changes in the Group’s share of net assets of the joint venture since the acquisition date. Goodwill relating to the joint venture is included in the carrying amount of the investment and is not tested for impairment individually.
The statement of profit and loss reflects the Group’s share of the results of operations of the joint venture. Any change in OCI of those investees is presented as part of the Group’s OCI. In addition, when there has been a change recognized directly in the equity of the joint venture, the Group recognizes its share of any changes, when applicable, in the statement of changes in equity.
2.3 The Consolidated Financial Statements are based on the audited financial statements of subsidiaries, associates and joint ventures except in the following cases where figures have been incorporated based on unaudited financial statements as certified by the management:
Nature of Entity Name of EntitySubsidiaries Bhagalpur Electricity Distribution Company Private Limited
Mizoram Infrastructure Development Company LimitedPT Sanmati Natural ResourcesSPM Holding Pte. LimitedSPML Utilities LimitedSubhash Urja Private Limited
Associates Aurangabad Jal Constructions Private LimitedAurangabad Jal Supply Solution Private LimitedBhilwara Jaipur Toll Road Private LimitedPT Bina Insan Sukses MandiriPT Vardhaman LogisticsPT Vardhaman Mining ServicesRabban (S) PTE LimitedSPML Bhiwandi Water Supply Infra LimitedSPML Bhiwandi Water Supply Management Limited
Joint Ventures Aurangabad City Water Utility Company LimitedGurha Thermal Power Company LimitedHydro Comp Enterprises (India) LimitedM & P – Subhash JVMalviya Nagar Water Services Private LimitedOm Metal Consortium JVSiddartha - Mahavir SPMLSPML-CISC JVSPML – Om Metal JV (Ujjain)Suez – SPML (JV)
2.4 Summary of significant accounting policies a) Property, Plant and equipment Property, Plant and Equipment are stated at cost of acquisition including attributable interest and finance cost, if any, till
the date of acquisition/ installation of the assets less accumulated depreciation and impairment losses, if any.
Consolidated Financial Statement as at and for the year ended 31st March, 2018

SPML Infra Limited Annual Report 2017-18182
Subsequent expenditure relating to Property, Plant and Equipmentis capitalised only when it is probable that future economic benefits associated with the item will flow to the Company and the cost of the item can be measured reliably. All other repairs and maintenance costs are charged to the Statement of Profit and Loss as incurred. The cost and related accumulated depreciation are eliminated from the financial statements, either on disposal or when retired from active use and the resultant gain or loss are recognized in the Statement of Profit and Loss.
Capital work-in-progress, representing expenditure incurred in respect of assets under development and not ready for their intended use, are carried at cost. Cost includes related acquisition expenses, construction cost, related borrowing cost and other direct expenditure.
On transition to Ind AS, the Group has elected to use the fair value of certain assets on the date of transition and designate the same as deemed cost on the date of transition. For the remaining assets, the Group has applied Ind AS retrospectively, from the date of their acquisition.
b) Intangible assets and Amortisation Intangible assets acquired separately are measured on initial recognition at cost. Following initial recognition, intangible
assets are carried at cost less any accumulated amortisation and accumulated impairment losses, if any.
The Group’s intangible assets constitutes software which has finite useful economic lives and these are amortised on a straight line basis, over their useful life of 3 years. The amortization period and the amortisation method are reviewed at the end of each reporting period
On transition to Ind AS, the Group has applied Ind AS retrospectively, from the date of their acquisition for Intangible Assets.
Depreciation and useful lives Depreciation on items of Property, Plant & Equipment is calculated on a straight-line basis using the rates arrived at
based on the useful lives estimated by the management.
The Group has used the following useful economic lives to provide depreciation on its property, plant & equipment.
Useful economic life (in years)Buildings (including temporary structure) 3- 60Furniture & Fixtures 10Plant & Equipment 9- 20Computers 3 - 6 Vehicles 8- 10Office Equipment 5Software (Intangible asset) 5
The useful economic lives of buildings and plant and equipment as estimated by the management, is supported by independent assessment by professionals, are lower than those indicated in Schedule II to the Companies Act, 2013. The residual values, useful lives and methods of depreciation of property, plant and equipment are reviewed and adjusted, if appropriate, at the end of each reporting period.
The Group’s intangible assets constitutes software which has finite useful economic lives and these are amortised on a straight line basis, over their useful life of 5 years. The amortisation period and the amortisation method are reviewed at the end of each reporting period.
c) Intangible assets Intangible assets acquired separately are measured on initial recognition at cost. Following initial recognition, intangible
assets are carried at cost less any accumulated amortisation and accumulated impairment losses, if any.
On transition to Ind AS, The Company has applied Ind AS retrospectively, from the date of their acquisition for Intangible Assets
Consolidated Financial Statement as at and for the year ended 31st March, 2018

183Statutoryreports
Corporate Overview
Financial statements
d) Impairment of property plant and equipment and intangible assets The carrying amount of assets are reviewed at each balance sheet date to determine if there is any indication of
impairment based on external or internal factors. An impairment loss is recognized wherever the carrying amount of an asset exceeds its recoverable amount which represents the greater of the net selling price of assets and their ‘value in use’. The estimated future cash flows are discounted to their present value using pre-tax discount rates and risks specific to the asset.
e) Revenue Recognition Construction Contracts: Revenue from contracts is recognized on “percentage completion method” based on the stage of completion of the
contract. The stage of completion is determined as a proportion that contract costs incurred for work performed upto the reporting date bear to the estimated total costs. When it is probable that the total contract cost will exceed the total contract revenue, the future loss is recognized immediately. The future loss is adjusted with unbilled revenue. For this purpose, total contract costs are ascertained on the basis of actual costs incurred and costs to be incurred for completion of contracts in progress, which is arrived at by the management based on current technical data, forecasts and estimate of expenditure to be incurred in future including contingencies. Revisions in projected profit or loss arising from change in the estimates are reflected in each accounting period.
Overhead expenses representing indirect costs that cannot be directly aligned with the jobs are allocated over the various contracts on a systematic basis. Disputed claims towards extra work, damages etc. are accounted for on settlement of the arbitration proceedings / legal cases.
The Group collects Value Added Tax (VAT), Sales tax, Service and Goods and Sevices tax on behalf of the government and therefore, these are not economic benefits flowing to the Company and have been excluded from revenue.
Arbitration awards which are granted in favor of the Company by independent arbitrators are accounted for when the management is reasonable certain of its ultimate recovery. The interest granted on such awards is recognized as per terms of the award.
Sale of Goods Revenue from sale of goods is recognized when all the significant risks and rewards of ownership of the goods have
passed to the buyer, which generally coincides with delivery to the customers. The Group collects Goods and Service tax (GST) on behalf of the Government and therefore, these are not economic benefits flowing to the Group and have been excluded from Revenue.
Sale of Electricty Earnings from sale of electricity are net of discount for prompt payment of bills and do not include electricity duty
payable to the state Government. Where the ability to assess the ultimate collection with reasonable certatinty is lacking at the time of sale, revenue recognition is postponed to the extent of uncertainty involved. In such cases, it is appropriate to recognise revenue only when it is reasonably certain that the ultimate collection will be made. Where there is no uncertainty as to ultimate collection, revenue is recognized at the time of sale even though payments are made by installments. Income from meter rent is accounted for as per the approved rates.
Income from Services Revenue from Operation and Maintenance contracts are recognized as per terms of the contract as and when services
are rendered.
Dividends Revenue for dividend income is recognized when the right to receive payment is established by the reporting date.
Interest income Interest income is recognized on a time proportion basis taking into account the amount outstanding and the applicable
effective interest rate (EIR). EIR is the rate that exactly discounts the estimated future cash payments or receipts over the expected life of a financial asset or a financial liability to their gross carrying amount.
Consolidated Financial Statement as at and for the year ended 31st March, 2018

SPML Infra Limited Annual Report 2017-18184
Interest and Dividend income are included under the head “other income” in the Statement of Profit and Loss.
f) Foreign Currency Translations In the financial statements of the Group, transactions in foreign currencies are translated into the functional currency
at the exchange rates ruling at the date of the transaction. Foreign currency monetary items are translated into the functional currency at exchange rates prevailing on the reporting date. Exchange differences arising on settlement or translations of monetary items are recognized in statement of profit and loss.
g) Government Grants Grants and subsidies from the government are recognized when there is reasonable assurance that the grant / subsidy
will be received and all attaching conditions will be complied with. When the grant or subsidy relates to an expense item, it is recognized as income over the periods necessary to match them on a systematic basis to the costs, which it is intended to compensate. Grants received against fixed assets are netted off from the cost of the related asset and the depreciation is provided on the net carrying value of those assets.
h) Inventories Materials, components and stores & spares to be used in contracts are valued at lower of cost, or net realizable value.
Cost is determined on weighted average basis.
Stock of trading goods is valued at lower of cost, or net realizable value. Cost is determined on First in First out (FIFO) basis.
Net Realizable Value is the estimated selling price in the ordinary course of business, less estimated costs of completion and estimated cost necessary to make the sale.
Unbilled Revenue (WIP) is valued at net realizable value. NRV is the estimated selling price in the ordinary course of business, less estimated costs of completion and estimated costs necessary to make the sale.
i) Employee benefits (A) Short-term employee benefits Employee benefits payable wholly within twelve months of receiving employee services are classified as short-term
employee benefits. These benefits include salaries and wages, bonus and ex-gratia.
Accumulated leave, which is expected to be utilized within the next 12 months, is treated as short-term employee benefit. The Group measures expected cost of such absences as the additional amount that it expects to pay as a result of the unused entitlement that has accumulated at the reporting date. Such short-term compensated absences are provided for in the Statement of Profit and Loss based on estimates.
(B) Post-employment benefits The Company operates the following post-employment schemes:
i) Employee benefits in the form of Provident Fund is made to a government administered fund and charged as an expense to the Statement of Profit and Loss, when an employee renders the related service. There are no obligations other than the contributions payable to the fund.
ii) Gratuity is administered through an approved benefit fund. Gratuity liability is defined benefit obligation and is provided for on the basis of an actuarial valuation on projected unit credit method done at the end of each financial year.
iii) Re-measurements, comprising of actuarial gains and losses excluding amounts included in net interest on the net defined benefit liability and the return on plan assets (excluding amounts included in net interest on the net defined benefit liability), are recognised immediately in the balance sheet with a corresponding debit or credit to retained earnings through Other Comprehensive Income in the period in which they occur. Re-measurements are not reclassified to profit or loss in subsequent periods.
j) Leases A lease is classified at the inception date as a finance lease or an operating lease. A lease that transfers substantially
Consolidated Financial Statement as at and for the year ended 31st March, 2018
185Statutoryreports
Corporate Overview
Financial statements
all the risks and rewards incidental to ownership to the Company is classified as a finance lease. All other leases are operating lease.
The determination of whether an arrangement is (or contains) a lease is based on the substance of the arrangement at the inception of the lease. The arrangement is, or contains, a lease if fulfilment of the arrangement is dependent on the use of a specific asset or assets and the arrangement conveys a right to use the asset or assets, even if that right is not explicitly specified in an arrangement. For arrangements entered into prior to 1 April 2016, the Company has determined whether the arrangement contains lease on the basis of facts and circumstances existing on the date of transition.
Operating lease payments are recognized as an expense in the statement of profit and loss on a straight-line basis over the lease term, unless the payments are structured to increase in line with expected general inflation to compensate for the lessor’s expected inflationary cost increases.
k) Borrowing costs Borrowing cost includes interest, amortisation of ancillary costs incurred in connection with the arrangement of
borrowings measured at Effective Interest rate (EIR).
Borrowing costs directly attributable to the acquisition, construction or production of an asset that necessarily takes a substantial period of time to get ready for its intended use or sale are capitalized as part of the cost of the respective asset.
All other borrowing costs are expensed in the period they are incurred.
l) Taxes Tax expense comprises of current (net of Minimum Alternate Tax (MAT) credit entitlement) and deferred tax.
Current income tax Current income tax is measured at the amount expected to be paid to the tax authorities in accordance with Indian
Income Tax Act. Management periodically evaluates positions taken in the tax returns Vis a Vis position taken in books of account which are subject to interpretation and creates provisions where appropriate.
Deferred tax Deferred tax is recognized on temporary differences between the tax bases and accounting bases of assets and
liabilities at the tax rates and laws that have been enacted or substantively enacted at the Balance Sheet date.
Deferred tax assets are recognized to the extent that it is probable that taxable profit will be available against which the deductible temporary differences can be utilized. The carrying amount of deferred tax assets is reviewed at each Balance Sheet date and reduced to the extent that it is no longer probable that sufficient taxable profit will be available to allow all or part of the deferred tax asset to be utilized. Unrecognized deferred tax assets are re-assessed at each reporting date and are recognized to the extent that it has become probable that future taxable profits will allow the deferred tax asset to be recovered.
For items recognized in OCI or equity, deferred / current tax is also recognized in OCI or equity.
m) Provisions A provision is recognized when an enterprise has a present obligation as a result of past event; it is probable that an
outflow of resources will be required to settle the obligation, in respect of which a reliable estimate can be made.
If the effect of time value of money is material, provisions are discounted using a current pre-tax rate that reflects, when appropriate, the risks specific to the liability. When discounting is used the increase in the provision due to the passage of time is recognized as a finance cost.
n) Contingent liabilities A contingent liability is a possible obligation that arises from past events whose existence will be confirmed by the
occurrence or non-occurrence of one or more uncertain future events beyond the control of the group or a present obligation that is not recognized because it is not probable that an outflow of resources will be required to settle the obligation. The group does not recognize a contingent liability but discloses its existence in the financial statements.
Consolidated Financial Statement as at and for the year ended 31st March, 2018

SPML Infra Limited Annual Report 2017-18186
o) Earnings Per Share Basic Earnings per share is calculated by dividing the net profit or loss before OCI for the year by the weighted average
number of equity shares outstanding during the year. Partly paid equity shares are treated as a fraction of an equity share to the extent that they are entitled to participate in dividends relative to a fully paid equity share during the reporting period.
For the purpose of calculating diluted earnings per share, the net profit or loss for the year attributable to equity shareholders and the weighted average number of shares outstanding during the year are adjusted for the effects of all dilutive potential equity shares.
p) Cash Flow Statement Cash flows are reported using indirect method as set out in Ind AS -7 “Statement of Cash Flows”, whereby profit /
(loss) before tax is adjusted for the effects of transactions of non-cash nature and any deferrals or accruals of past or future cash receipts or payments. The cash flows from operating, investing and financing activities of the Group are segregated based on the available information.
q) Financial Instruments A financial instrument is any contract that gives rise to a financial asset of one entity and a financial liability or equity
instrument of another entity
a) Classification The Group classifies its financial assets in the following measurement categories:
- those to be measured subsequently at fair value (either through other comprehensive income, or through profit or loss), and
- those measured at amortised cost.
The classification depends on the entity’s business model for managing the financial assets and the contractual terms of the cash flows.
b) Initial Recognition Financial assets are recognised initially at fair value considering the concept of materiality. Transaction costs that
are directly attributable to the acquisition of the financial asset (other than financial assets at fair value through profit or loss) are added to the fair value measured on initial recognition of financial assets.
c) Subsequent Measurement of Financial Assets Financial assets are subsequently measured at amortised cost if they are held within a business whose objective
is to hold these assets in order to collect contractual cash flows and the contractual terms of the financial asset give rise on specified dates to cash flows that are solely payments of principal and interest on the principal amount outstanding.
Financial assets at fair value through other comprehensive income (FVTOCI): Financial assets are subsequently measured at fair value through other comprehensive income (FVTOCI), if it is held within a business model whose objective is achieved by both from collection of contractual cash flows and selling the financial assets, where the assets’ cash flows represent solely payments of principal and interest. Further equity instruments where the Company has made an irrevocable election based on its business model, to classify as instruments measured at FVTOCI, are measured subsequently at fair value through other comprehensive income.
d) Impairment of Financial Assets The Group assesses on a forward looking basis the expected credit losses associated with its assets carried at
amortised cost and FVTOCI debt instruments. The impairment methodology applied depends on whether there has been a significant increase in credit risk.
In accordance with Ind AS 109: Financial Instruments, the Group recognizes impairment loss allowance on trade receivables based on historically observed default rates. Impairment loss allowance recognized during the year is charged to the Statement of Profit and Loss.
Consolidated Financial Statement as at and for the year ended 31st March, 2018

187Statutoryreports
Corporate Overview
Financial statements
e) Derecognition of financial assets A financial asset is primarily derecognised when:
- The rights to receive cash flows from the asset have expired, or
- The group has transferred its rights to receive cash flows from the asset or has assumed an obligation to pay the received cash flows in full without material delay to a third party under a ‘pass-through’ arrangement; and either (a) the group has transferred substantially all the risks and rewards of the asset, or (b) the Company has neither transferred nor retained substantially all the risks and rewards of the asset, but has transferred control of the asset.
When the group has transferred its rights to receive cash flows from an asset or has entered into a pass-through arrangement, it evaluates if and to what extent it has retained the risks and rewards of ownership. When it has neither transferred nor retained substantially all of the risks and rewards of the asset, nor transferred control of the asset, the Company continues to recognise the transferred asset to the extent of the Company’s continuing involvement. In that case, the Company also recognises an associated liability. The transferred asset and the associated liability are measured on a basis that reflects the rights and obligations that the Company has retained.
Financial Liabilities: a) Classification The group classifies its financial liabilities in the following measurement categories:
- those to be measured subsequently at fair value through profit or loss, and
- those measured at amortised cost using the effective interest method.
The classification depends on the entity’s business model for managing the financial liabilities and the contractual terms of the cash flows.
b) Initial Recognition Financial liabilities are recognized at fair value on initial recognition considering the concept of materiality.
Transaction costs that are directly attributable to the issue of financial liabilities, that are not at fair value through profit or loss, are reduced from the fair value on initial recognition.
c) Subsequent Measurement of Financial Liabilities The measurement of financial liabilities depends on their classification, as described below:
Amortised cost: After initial recognition, interest-bearing loans and borrowings are subsequently measured at amortised cost using the Effective interest rate (EIR) method. Gains and losses are recognised in profit or loss when the liabilities are derecognised as well as through the EIR amortisation process.
Amortised cost is calculated by taking into account any discount or premium on acquisition and fees or costs that are an integral part of the EIR. The EIR amortisation is included as finance costs in the statement of profit and loss.
d) Derecognition of financial liabilities A financial liability is derecognised when the obligation under the liability is discharged or cancelled or expires.
When an existing financial liability is replaced by another from the same lender on substantially different terms, or the terms of an existing liability are substantially modified, such an exchange or modification is treated as the derecognition of the original liability and the recognition of a new liability. The difference in the respective carrying amounts is recognised in the statement of profit or loss.
Offsetting of financial instruments The Group offsets a financial asset and a financial liability when it currently has a legally enforceable right to set off the
recognized amounts and the Company intends either to settle on a net basis, or to realize the asset and settle the liability simultaneously.
Consolidated Financial Statement as at and for the year ended 31st March, 2018

SPML Infra Limited Annual Report 2017-18188
r) Current versus non-current classification The Group presents assets and liabilities in the balance sheet based on current/ non-current classification. An asset is
treated as current when it is:
• Expected to be realized or intended to be sold or consumed in normal operating cycle
• Held primarily for the purpose of trading
• Expected to be realized within twelve months after the reporting period, or
• Cash or cash equivalent unless restricted from being exchanged or used to settle a liability for at least twelve months after the reporting period.
All other assets are classified as non-current.
A liability is current when:
• It is expected to be settled in normal operating cycle
• It is held primarily for the purpose of trading
• It is due to be settled within twelve months after the reporting period, or
• There is no unconditional right to defer the settlement of the liability for at least twelve months after the reporting period
The Group classifies all other liabilities as non-current.
Deferred tax assets and liabilities are classified as non-current assets and liabilities.
The operating cycle is the time between the acquisition of assets for processing and their realization in cash and cash equivalents. The Group has identified twelve months as its operating cycle.
2.5 Significant Accounting judgements, estimates and assumptions: The preparation of the financial statements requires management to make judgements, estimates and assumptions that
affect the reported amounts of revenues, expenses, assets and liabilities, and the accompanying disclosures, and the disclosure of contingent liabilities. Uncertainty about these assumptions and estimates could result in outcomes that require a material adjustment to the carrying amount of assets or liabilities affected in future periods
In the process of applying the Group’s accounting policies, management has made the following judgements, which have the most significant effect on the amounts recognized in the financial statements:
The areas involving critical estimates or judgement are:
a) Measurement of defined benefit obligations
b) Estimated useful life of intangible assets, property, plant and equipment
c) Recognition of revenue – Contract Revenue is recognized under Percentage of Completion method. When the outcome of a construction contract can be estimated reliably, contract revenue and contract costs associated with the construction contracts are recognized as Revenue and Expenses respectively by reference to the stage of completion of the Contract activity.
d) Provision for expected credit losses
These critical estimates are explained in detail in note no 2.4 - Summary of Significant Accounting Policy.
Consolidated Financial Statement as at and for the year ended 31st March, 2018

189Statutoryreports
Corporate Overview
Financial statements
NO
TE 3
: PRO
PERT
Y, P
LAN
T AN
D EQ
UIP
MEN
T `
In L
akhs
Part
icul
ars
Fre
ehol
d
land
L
ease
hold
La
nd
Bui
ldin
gs
owne
d B
uild
ings
le
ased
T
empo
rary
si
te s
heds
and
sh
utte
ring
mat
eria
ls
Pla
nt a
nd
mac
hine
ry
Fur
nitu
re
and
fixtu
res
Veh
icle
s S
ite o
ffice
/ eq
uipm
ents
T
otal
GRO
SS B
LOCK
As
at A
pril
1, 2
016
(ref
er n
ote
a) 7
,659
.45
44.
34
6,6
07.7
4 –
2,5
00.7
9 2
8,63
7.69
1
,773
.44
2,6
58.5
3 2
,132
.06
52,
014.
03
Addi
tions
––
230
.26
1,0
94.5
8 –
828
.96
24.
24
109
.76
105
.98
2,3
93.7
9 D
educ
tions
––
(322
.49)
(483
.86)
– (1
,344
.00)
(975
.12)
(496
.44)
(66.
24)
(3,6
88.1
6)As
at M
arch
31,
201
7 7
,659
.45
44.
34
6,5
15.5
2 6
10.7
2 2
,500
.79
28,
122.
65
822
.56
2,2
71.8
6 2
,171
.79
50,
719.
67
Addi
tions
––
6.4
3 –
16.
65
112
.20
22.
30
12.
23
72.
48
242
.28
Cons
olid
atio
n ad
just
men
t–
––
––
(129
.75)
––
– (1
29.7
5)D
educ
tions
(9.1
7)–
– (6
10.7
2)–
(120
.27)
(9.6
1) (9
0.68
) (7
.59)
(848
.06)
As a
t Mar
ch 3
1, 2
018
7,6
50.2
7 4
4.34
6
,521
.94
– 2
,517
.44
27,
984.
82
835
.24
2,1
93.4
0 2
,236
.68
49,
984.
15
ACCU
MU
LATE
D D
EPRE
CIAT
ION
As
at A
pril
1, 2
016
(ref
er n
ote
a)–
11.
63
2,8
59.4
5 –
2,3
39.8
6 1
2,79
0.70
1
,235
.62
1,6
79.3
5 2
,016
.18
22,
932.
77
Char
ge fo
r the
yea
r–
4.3
1 2
25.2
3 –
19.
02
1,2
31.1
9 2
20.8
5 2
47.2
2 1
61.0
8 2
,108
.91
Ded
uctio
ns–
– (9
8.46
)–
– (9
75.2
7) (7
44.7
6) (4
65.1
5) (6
2.25
) (2
,345
.90)
As a
t Mar
ch 3
1, 2
017
– 1
5.94
2
,986
.22
– 2
,358
.88
13,
046.
62
711
.71
1,4
61.4
2 2
,115
.01
22,
695.
79
Char
ge fo
r the
yea
r–
4.3
1 1
94.1
9 –
6.3
0 1
,184
.25
45.
93
154
.29
91.
60
1,6
80.8
8 Co
nsol
idat
ion
adju
stm
ent
––
––
(63.
81)
– (1
7.07
)–
0.0
1 (8
0.87
)D
educ
tions
––
––
– (6
.83)
(5.6
9) (1
2.12
) (1
.66)
(26.
30)
As a
t Mar
ch 3
1, 2
018
– 2
0.26
3
,180
.41
– 2
,301
.36
14,
224.
04
734
.88
1,6
03.5
9 2
,204
.96
24,
269.
49
NET
BLO
CKAs
at A
pril
1, 2
016
7,6
59.4
5 3
2.72
3
,748
.29
– 1
60.9
3 1
5,84
6.99
5
37.8
2 9
79.1
8 1
15.8
8 2
9,08
1.25
As
at M
arch
31,
201
7 7
,659
.45
28.
40
3,5
29.3
0 6
10.7
2 1
41.9
1 1
5,07
6.03
1
10.8
5 8
10.4
4 5
6.78
2
8,02
3.88
As
at M
arch
31,
201
8 7
,650
.27
24.
09
3,3
41.5
3 –
216
.08
13,
760.
78
100
.36
589
.82
31.
72
25,
714.
65
Ind
AS 1
01 p
erm
its a
n en
tity
to e
lect
to m
easu
re a
n ite
m o
f Pro
pert
y, Pl
ant a
nd E
quip
men
t at t
he d
ate
of tr
ansi
tion
to In
d AS
at i
ts fa
ir va
lue
and
use
that
fair
valu
e as
its
deem
ed
cost
at t
hat d
ate.
Acc
ordi
ngly
, the
Gro
up h
as e
lect
ed to
use
the
fair
valu
e of
cer
tain
ass
ets
on th
e da
te o
f tra
nsiti
on a
nd d
esig
nate
the
sam
e as
dee
med
cos
t on
the
date
of
tran
sitio
n. F
air v
alue
has
bee
n de
term
ined
, by
obta
inin
g an
ext
erna
l thi
rd p
arty
val
uatio
n, a
leve
l 3 v
alua
tion
tech
niqu
e. F
or th
e re
mai
ning
ass
ets,
the
Gro
up h
as a
pplie
d In
d AS
re
trosp
ectiv
ely,
from
the
date
of t
heir
acqu
isiti
on.
Cons
olid
ated
Fin
anci
al S
tate
men
t as
at a
nd fo
r the
yea
r end
ed 3
1st M
arch
, 201
8

SPML Infra Limited Annual Report 2017-18190
NOTE 4: CAPITAL WORK IN PROGRESS ` In Lakhs
Particulars Building under
construction
Plant & Machinery
Under Erection
Toll Road under
Construction
Project Development Expenditure
Subsidy Total
As at April 1, 2016 2,261.99 5,832.71 (47.26) 2,618.45 (3,418.19) 7,247.70 Additions (1.40) – – 594.72 – 593.32 Adjustment pursuant to acquisition of Joint Venture/Subsidiary
– – – 193.21 – 193.21
Less: Adjustment for CWIP written off/Capitalized during the year
(914.13) (476.81) – (4,115.08) 2,960.69 (2,545.33)
Ind AS Adjustment (48.25) – – – – (48.25)As at March 31, 2017 1,298.22 5,355.89 (47.26) (708.70) (457.50) 5,440.65 Additions 293.44 – – 55.28 – 348.72 Adjustment pursuant to acquisition of Joint Venture/Subsidiary
– – – – – –
Less: Adjustment for CWIP written off/Capitalized during the year
– (16.35) 47.26 (100.62) 33.68 (36.02)
Transfer to investment property (601.38) – – (311.14) – (912.52) As at March 31, 2018 990.28 5,339.55 – (1,065.18) (423.82) 4,840.84
NOTE 5: INTANGIBLE ASSETS ` In Lakhs
Particulars Rights under service
concession arrangement
Computer Softwares
Goodwill on Consolidation
Total
GROSS BLOCK As at April 1, 2016 0.01 415.19 2,091.82 2,507.02 Additions 0.00 0.17 642.74 642.92 Consolidation Adjustment – 0.01 – 0.01 Deductions – – – –As at March 31, 2017 0.01 415.37 2,734.56 3,149.95 Additions 0.00 – 944.64 944.64 Deductions – 0.01 – 0.01 As at March 31, 2018 0.01 415.38 3,679.20 4,094.60 ACCUMULATED AMORTISATIONAs at April 1, 2016 – 387.46 – 387.46 Charge for the year – 4.84 – 4.84 Deductions – – – –As at March 31, 2017 – 392.29 – 392.29 Charge for the year – 2.53 – 2.53 Deductions – – – –As at March 31, 2018 – 394.83 – 394.83 NET BLOCKAs at April 1, 2016 0.01 27.73 2,091.82 2,119.56 As at March 31, 2017 0.01 23.08 2,734.56 2,757.65 As at March 31, 2018 0.01 20.56 3,679.20 3,699.77
The Group has applied Ind AS 38 retrospectively, from the date of their acquisition for Intangible Assets.
Consolidated Financial Statement as at and for the year ended 31st March, 2018

191Statutoryreports
Corporate Overview
Financial statements
Consolidated Financial Statement as at and for the year ended 31st March, 2018
NOTE 6: NON- CURRENT INVESTMENTS ` In LakhsParticulars No. of Shares/ Units/ Debentures
As at March 31,Face Value per Share/
Unit/ Debenture
H
As at March 31,
2018
As at March 31,
2017
As atApril 1, 20162018 2017 2016
Long Term (At Cost) (A) Other than Trade (at Fair value through
Profit and Loss) Quoted (a) Equity Shares (Fully Paid - up)
Arihant Leasing & Holding Limited 24,000 24,000 24,000 10 – – –Indian Arcylics Limited 100 100 100 10 – – –Petrochem Industries Limited 500 500 500 10 – – –Best & Crompton Engineering Limited 200 200 200 10 – – –SPML India Limited 10,000 10,000 10,000 10 – – –Hindustan Engineering & Industries Limited (Bonus Shares)
4 4 4 10 – – –
(b) Debt Instruments (Fully Paid - up)(at Amortised Cost) Escorts Tractors Limited 25 25 25 1 0.01 0.01 0.01 Hindustan Engineering & Industries Limited
110 110 110 1 0.06 0.06 0.06
0.07 0.07 0.07 Less: Provision for Diminution in Value of investments
0.06 0.06 0.06
Net Quoted Investments 0.01 0.01 0.01
(B) Trade (at Fair value through profit and Loss)
Unquoted Equity Shares (Fully Paid-up)
Bharat Hydro Power Corporation Limited 32,94,150 32,94,150 32,94,150 10 1,911.48 1,849.58 921.00
Jarora Nayagaon Toll Road Company Private Limited (The said shares are pledged with OBC against loan taken by the Investee Company)
2,44,23,700 2,44,23,700 2,44,23,700 10 0.05 2,442.37 2,442.37
ADD Realty Limited 15,000 15,000 – 1 15.00 15.00 –Om Metals- SPML Infra Projects Private Limited
4,999 4,999 – 10 0.50 0.50 0.50
1,927.03 4,307.45 3,363.87 In Associate Companies (at Deemed Cost) Pondicherry Port Limited 1,81,600 1,81,600 1,81,600 10 – 0.01 0.01 Less : Share in losses of the Associate Company
– -0.01 -0.01
Sanmati Infra Developers Private Limited 5,00,000 5,00,000 5,00,000 10 50.00 50.00 50.00 Less : Share in losses of the Associate Company
(50.00) (50.00) (50.00)
– – –PT Vardhaman Mining Services 4,56,500 4,56,500 4,56,500 USD 1 232.59 232.59 232.59 Less : Share in losses of the Associate Company
(316.92) (296.70) (302.20)

SPML Infra Limited Annual Report 2017-18192
NOTE 6: NON- CURRENT INVESTMENTS ` In LakhsParticulars No. of Shares/ Units/ Debentures
As at March 31,Face Value per Share/
Unit/ Debenture
H
As at March 31,
2018
As at March 31,
2017
As atApril 1, 20162018 2017 2016
Add: Foreign Currency Translation differences
84.33 64.11 69.61
– – –PT Vardhaman Logistics 1,37,500 1,37,500 1,37,500 USD 1 69.78 69.78 69.78 Add : Share in profits of the Associate Company
27.26 25.46 19.61
Add: Foreign Currency Translation differences
(7.41) (11.29) 0.42
89.63 83.96 89.81 Rabaan (S) Pte. Limited 11,413 11,413 11,413 SGD 1 4.49 4.49 4.49 Less : Share in losses of the Associate Company
29.44 30.60 (5.19)
Add: Foreign Currency Translation differences
(31.46) 5.89 0.70
2.48 40.98 –PT Bina Insan Sukes Mandiri 2,738 2,738 2,738 IDR 1 million 1,710.79 8,276.20 8,276.20 Add : Share in Profit of the Associate Company
4,673.13 1,809.66 312.30
Add: Foreign Currency Translation differences
874.90 1,219.30 2,132.62
7,258.82 11,305.17 10,721.12 Aurangabad Jal Supply Solutions Private Limited
2,600 2,600 2,600 10 0.26 0.26 0.26
Less : Share in losses of the Associate Company
(0.26) (0.26) (0.06)
– – 0.20 SPML Bhiwandi Water Supply Infra Limited
2,24,700 2,24,700 2,24,700 1 2.25 2.25 2.25
Less : Share in losses of the Associate Company
(0.18) (0.18) (0.18)
2.07 2.07 2.07 SPML Bhiwandi Water Supply Management Limited
2,50,000 2,50,000 2,50,000 1 2.50 2.50 2.50
Less : Share in losses of the Associate Company
(0.24) (0.24) (0.24)
2.26 2.26 2.26 Aurangabad Jal Constructions Private Limited
2,600 2,600 2,600 10 0.26 0.26 0.26
Less : Share in losses of the Associate Company
(0.26) (0.26) (0.26)
0.00 0.00 0.00 Bhilwara Jaipur Toll Road Private Limited 3,408.96 4,123.28 4,637.33 Less : Share in losses of the Associate Company
(477.71) (714.32) (514.04)
(of the above 12,49,336 equity shares are pledged with ICICI Bank and PNB against loans obtained by the said investee company)
2,931.25 3,408.96 4,123.28
Total 10,286.52 14,843.39 14,938.75
Consolidated Financial Statement as at and for the year ended 31st March, 2018

193Statutoryreports
Corporate Overview
Financial statements
Consolidated Financial Statement as at and for the year ended 31st March, 2018
NOTE 6: NON- CURRENT INVESTMENTS ` In LakhsParticulars No. of Shares/ Units/ Debentures
As at March 31,
Face Value
per Share/
Unit/
Debenture
H
As at
March 31,
2018
As at
March 31,
2017
As at
April 1,
20162018 2017 2016
In Joint Ventures (at Deemed Cost)
Gurha Thermal Power Company Limited 25,000 25,000 25,000 10 2.50 2.50 2.50
MVV Water Utility Private Limited 3,64,693 3,64,693 3,64,693 10 23.88 30.56 13.03
Add / (Less) : Share in Profit / (Loss) of the
Joint Venture
3.38 (6.67) 17.53
27.26 23.88 30.56
Malviya Nagar Water Services Private Limited 22,05,000 22,05,000 22,05,000 10 – 25.88 41.73
Less : Share in Loss of the Joint Venture 220.50 (25.88) (15.85)
220.50 – 25.88
Aurangabad City Water Utility Company
Limited
19,405 19,405 19,405 1 2.00 2.00 1.94
Add : Share in Profit of the Associate
Company
(2.00) (2.00) 69.21
– – 71.15
HYDRO Comp Enterprises (India) Limited 22,96,265 22,96,265 22,96,265 1 22.96 22.96 22.96
Less : Share in losses of the Associate
Company
(22.96) (22.96) (22.96)
– – –
Total 250.26 26.38 130.09
Debt Instruments (at Amortised Cost)
ADD Realty Limited 5,47,50,000 5,47,50,000 3,21,50,000 1 218.69 118.95 66.55
Add Industrial Park Tamil Nadu Private
Limited
2,29,00,000 – – 10 75.70 – –
MVV Water Utility Private Limited 18,380 18,380 18,380 100 18.38 18.38 18.38
Sanmati Infra Developers Private Limited 4,50,000 4,50,000 4,50,000 10 – 45.00 45.00
312.77 182.33 129.93
Others (at fair value through Profit and Loss)
Unquoted
National Saving Certificate 0.52 0.52 0.52
Units of PNB Mutual Fund 50,000 50,000 50,000 10 5.00 5.00 5.00
5.52 5.52 5.52
Total 12,782.10 19,365.09 18,568.17
On Pledge of Investments as held by SPML Infra Limited in Associate Companies:
Investments of SPML Infra Limited i.e.2,24,700 Equity Shares in SPML Bhiwandi Water Supply Infra Limited; 2,50,000 Equity Shares in SPML Bhiwandi Water Supply Management Limited has been pledged as on the Balance Sheet date in favour of the SBICAP Trustee/ S4A Lenders for securing the due repayment of the Debts as restructured under the “SPML S4A Scheme” as approved by the Overseeing Committee (governed under RBI) with the super majority of the Lenders Banks.
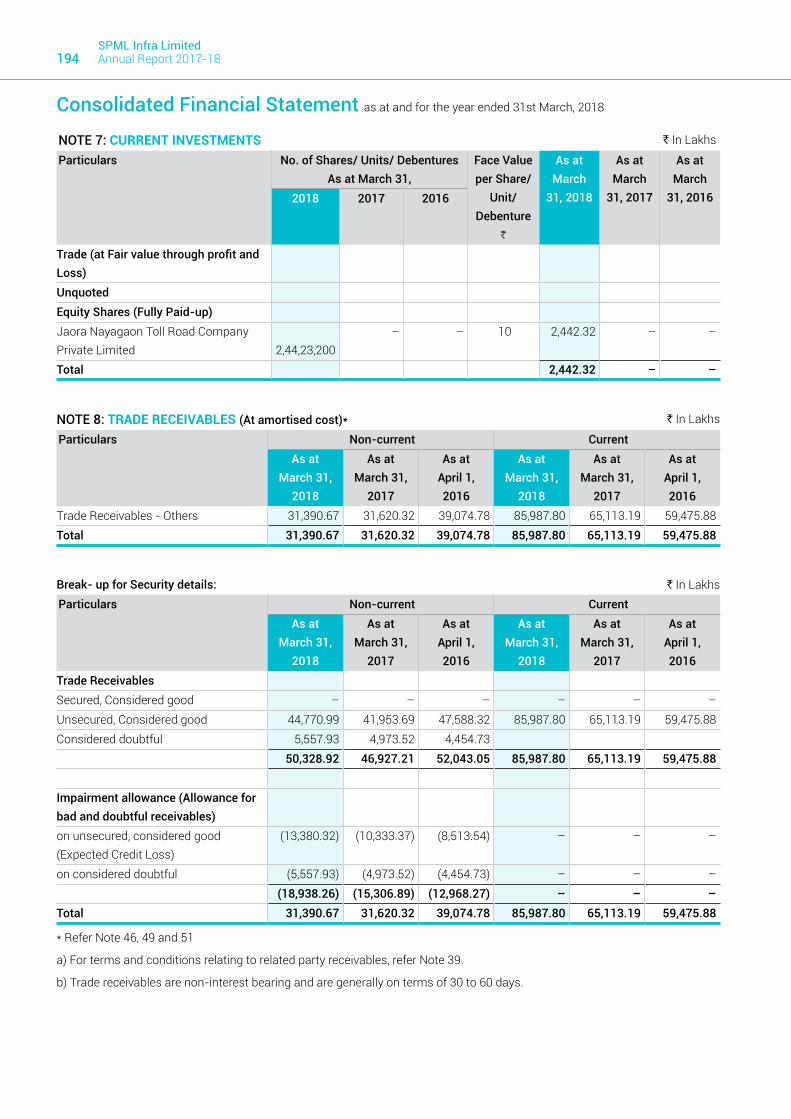
SPML Infra Limited Annual Report 2017-18194
NOTE 7: CURRENT INVESTMENTS ` In Lakhs
Particulars No. of Shares/ Units/ DebenturesAs at March 31,
Face Value per Share/
Unit/ Debenture
H
As at March
31, 2018
As at March
31, 2017
As at March
31, 20162018 2017 2016
Trade (at Fair value through profit and Loss) Unquoted Equity Shares (Fully Paid-up) Jaora Nayagaon Toll Road Company Private Limited
2,44,23,200
– – 10 2,442.32 – –
Total 2,442.32 – –
NOTE 8: TRADE RECEIVABLES (At amortised cost)* ` In Lakhs
Particulars Non-current CurrentAs at
March 31, 2018
As at March 31,
2017
As atApril 1, 2016
As at March 31,
2018
As at March 31,
2017
As atApril 1, 2016
Trade Receivables - Others 31,390.67 31,620.32 39,074.78 85,987.80 65,113.19 59,475.88 Total 31,390.67 31,620.32 39,074.78 85,987.80 65,113.19 59,475.88
Break- up for Security details: ` In Lakhs Particulars Non-current Current
As at March 31,
2018
As at March 31,
2017
As atApril 1, 2016
As at March 31,
2018
As at March 31,
2017
As atApril 1, 2016
Trade ReceivablesSecured, Considered good – – – – – –Unsecured, Considered good 44,770.99 41,953.69 47,588.32 85,987.80 65,113.19 59,475.88 Considered doubtful 5,557.93 4,973.52 4,454.73
50,328.92 46,927.21 52,043.05 85,987.80 65,113.19 59,475.88
Impairment allowance (Allowance for bad and doubtful receivables)on unsecured, considered good (Expected Credit Loss)
(13,380.32) (10,333.37) (8,513.54) – – –
on considered doubtful (5,557.93) (4,973.52) (4,454.73) – – – (18,938.26) (15,306.89) (12,968.27) – – –
Total 31,390.67 31,620.32 39,074.78 85,987.80 65,113.19 59,475.88
* Refer Note 46, 49 and 51
a) For terms and conditions relating to related party receivables, refer Note 39.
b) Trade receivables are non-interest bearing and are generally on terms of 30 to 60 days.
Consolidated Financial Statement as at and for the year ended 31st March, 2018

195Statutoryreports
Corporate Overview
Financial statements
NOTE 9: LOANS (At amortised cost) ` In Lakhs
Particulars Non-current CurrentAs at
March 31, 2018
As at March 31,
2017
As atApril 1, 2016
As at March 31,
2018
As at March 31,
2017
As atApril 1, 2016
Unsecured Considered good: Advance for Share Application Money to others 45.00 – – – 6.00 –Security Deposits/Earnest Money Deposits 3,502.69 193.59 249.28 807.25 977.85 1,469.65 Loans to related parties (Refer Note 39) 2,163.21 2,234.68 1,480.00 672.50 421.09 2,205.48 Loans to others – – – 984.95 3,149.75 1,700.22 Total 5,710.90 2,428.27 1,729.28 2,464.70 4,554.69 5,375.35
Loans and receivables are non-derivative financial assets which generate a fixed or variable interest income of the Company. The Carrying value may be affected by changes in the credit risk of the counterparties.
Consolidated Financial Statement as at and for the year ended 31st March, 2018
NOTE 10: OTHER FINANCIAL ASSETS (At Amortised Cost) ` In Lakhs
Particulars Non-current CurrentAs at
March 31, 2018
As at March 31,
2017
As atApril 1, 2016
As at March 31,
2018
As at March 31,
2017
As atApril 1, 2016
Unsecured Considered good: Non-Current Bank Balances 4,112.02 3,466.75 3,623.54 – – –Interest Accrued on Fixed deposit/ Loan – – – 2,690.51 1,289.45 1,351.25 Advance against Sale of Investments – – – 200.00 772.06 1,618.49 Other Receivables – – – 245.92 – –Total 4,112.02 3,466.75 3,623.54 3,136.43 2,061.51 2,969.74
NOTE 11.1: TAX ASSETS ` In Lakhs
Particulars Non-current CurrentAs at
March 31, 2018
As at March 31,
2017
As atApril 1, 2016
As at March 31,
2018
As at March 31,
2017
As atApril 1, 2016
Advance income-tax (net of provision for taxation)
6,142.11 9,154.15 7,893.31 123.37 482.47 1,389.31
Total 6,142.11 9,154.15 7,893.31 123.37 482.47 1,389.31
NOTE 11.2: TAX LIABILITY ` In Lakhs
Particulars CurrentAs at
March 31, 2018As at
March 31, 2017As at
April 1, 2016Provision for income-tax (net of advance tax) 462.71 260.50 334.94 Total 462.71 260.50 334.94

SPML Infra Limited Annual Report 2017-18196
NOTE 12: OTHER ASSETS ` In Lakhs
Particulars Non-current CurrentAs at
March 31, 2018
As at March 31,
2017
As atApril 1, 2016
As at March 31,
2018
As at March 31,
2017
As atApril 1, 2016
Unsecured considered good:Capital advances
to related parties (Refer Note 39) 291.86 170.78 170.78 84.83 66.83 2.15 others 1,072.60 1,348.86 1,341.12 – – –
Unbilled RevenueConstruction Contracts – – – 78,009.07 64,504.33 54,709.40 Power Distribution – – – 0.45 1,149.90 1,266.83
Advances recoverable in cash or kindto related parties (Refer Note 39) 195.01 – – 4.20 64.31 4.20 others – – – 9,357.91 3,739.90 6,757.80
Mat Credit Entitlement 781.12 660.37 683.18 11.42 10.32 10.74 Prepaid expenses – – – 1,114.72 1,305.07 1,321.15 Balances with statutory / government authorities 220.66 785.18 939.17 4,419.82 2,430.57 1,998.90 Subsidies Recievable 291.34 291.34 291.34 – – –Interest accrued on arbitration awards (Refer Note 49)
18,955.82 13,633.77 6,275.36 – 1,541.78 1,695.95
Other non current assets 6,454.55 5,447.78 3,673.67 – 86.14 86.14 Total 28,262.96 22,338.08 13,374.62 93,002.42 74,899.15 67,853.26
Consolidated Financial Statement as at and for the year ended 31st March, 2018
NOTE 13: INVENTORIES (Valued at lower of Cost and Net Realisable Value) ` In Lakhs
Particulars CurrentAs at
March 31, 2018As at
March 31, 2017As at
April 1, 2016Material at sites 4,358.06 3,879.58 3,933.54 Work in progress 2,222.02 2,222.02 2,594.72 Finished Goods 49.77 36.46 –Stores and spares 1,105.94 1,092.22 955.25 Total 7,735.79 7,230.28 7,483.51

197Statutoryreports
Corporate Overview
Financial statements
NOTE 14: CASH AND BANK BALANCES ` In Lakhs
Particulars Non-current CurrentAs at
March 31, 2018
As at March 31,
2017
As atApril 1, 2016
As at March 31,
2018
As at March 31,
2017
As atApril 1, 2016
14.1 Cash and cash equivalents*Balances with banks :
On current accounts – – – 2,447.39 4,260.66 2,501.57 Deposits with original maturity of less than three months **
– – – – – 1,960.89
Cheque in Hand – – – – – 1.00 Cash on hand – – – 33.23 33.77 131.38
(A) – – – 2,480.62 4,294.43 4,594.84
14.2 Other bank balances (other than included in note 14.1 above)Balances with banks :On unpaid dividend account – – – 1.42 3.22 5.15 Deposits with original maturity for more than 12 months **
4,112.02 3,466.75 3,623.54 8,836.62 9,220.31 3,224.13
Deposits with original maturity for more than 3 months but less than 12 months**
– – – 1,212.90 2,070.47 5,642.79
(B) 4,112.02 3,466.75 3,623.54 10,050.94 11,294.00 8,872.07 Amount disclosed under non-current assets (Refer Note No. 10)
(4,112.02) (3,466.75) (3,623.54) – – –
(A+B) – – – 12,531.56 15,588.43 13,466.91
* The above are considered as Cash and Cash equivalents for the purpose of Statement of Cash flows
** Receipts lying with banks as security against letters of credits and Guarantees issued by them and with clients
Consolidated Financial Statement as at and for the year ended 31st March, 2018
NOTE 15: SHARE CAPITALParticulars As at March 31, 2018 As at March 31, 2017 As at April 1, 2016
No. of Shares
` In Lakhs
No. of Shares
` In Lakhs
No. of Shares
` In Lakhs
Authorized capitalEquity shares `2 each 20,00,00,000 4,000.00 20,00,00,000 4,000.00 20,00,00,000 4,000.00
Preference shares `100 each 10,00,000 1,000.00 10,00,000 1,000.00 10,00,000 1,000.00 5,000.00 5,000.00 5,000.00
Issued, subscribed and paid-up capitalEquity shares `2 each 3,66,50,276 733.01 3,66,50,276 733.01 3,66,50,276 733.01 Add : Forfeited shares (amount originally paid up)
86.44 86.44 86.44
Total 3,66,50,276 819.45 3,66,50,276 819.45 3,66,50,276 819.45

SPML Infra Limited Annual Report 2017-18198
a. Reconciliation of the equity shares outstanding at the beginning and at the end of the yearEquity SharesParticulars 2017-18 2016-17 2015-16
No. of Shares
` In Lakhs
No. of Shares
` In Lakhs
No. of Shares
` In Lakhs
At the beginning of the year 3,66,50,276 733.01 3,66,50,276 733.01 3,66,50,276 733.01 Calls in arrears – – – – – –Outstanding at the end of the year 3,66,50,276 733.01 3,66,50,276 733.01 3,66,50,276 733.01
b. Terms/ rights attached to equity sharesThe Company has only one class of equity shares having par value of `2 per share. Each holder of equity shares is entitled one vote per share. The Company declares and pays dividends in Indian Rupees. The holder of equity shares are entitled to receive dividend as declared from time to time and are entitled to one vote per share.
In the event of liquidation of the Company, the holders of equity shares will be entitled to receive remaining assets of the Company, after distribution of all preferential amounts. The distribution will be in proportion to the number of equity shares held by the shareholders.
c. Details of shareholders holding more than 5% equity shares of the CompanyName of Shareholders As at March 31, 2018 As at March 31, 2017 As at April 1, 2016
No. of Shares
% holding No. of Shares
% holding No. of Shares
% holding
Client Rosehill Limited 35,21,575 9.61 35,21,575 9.61 35,21,575 9.61State Bank of India 28,49,006 7.77 – – – – Zoom Industrial Services Limited 25,00,000 6.82 30,73,510 8.39 30,73,510 8.39SPML India Limited 21,19,055 5.78 23,35,735 6.37 23,35,735 6.37CVCIGP II Employee Rosehill Limited 19,72,301 5.38 19,72,301 5.38 19,72,301 5.38Anil Kumar Sethi 17,75,780 4.85 19,02,835 5.19 19,02,835 5.19Udgam Commercial Limited 17,06,906 4.66 18,89,236 5.15 19,92,531 5.44
d. No bonus shares or shares issued for consideration other than cash or shares bought back over the last five years immediately preceeding the reporting date.
e. In pursuance of the implementation of “SPML S4A Scheme”, the Promoters of the Company had diluted their shareholding in the Company to the extent of “Principle of Proportionate loss sharing by Lenders (S4A Lenders)” in favour of the Lender Banks to entitle them to hold 21.44% stake in the Company.
f. In terms of the “SPML S4A Scheme” as approved by the Overseeing Committee (governed under RBI) the entire debt of the Company as bifurcated into Part A Debt and Part B Debt together with all interest thereon is also secured by pledge of the Shares of the Company held by Promoters in favour of SBICAP Trustee Limited for the benefit of the Secured Parties. The Promoters & the Promoter Group of the Company as on 31.03.2018 had pledged 34.31% of the Shares as held by them in the Company in favour of the Security Trustee. Further, the promoters had further pledged 01.52 % Shares upto the date of signing of the financials.
Consolidated Financial Statement as at and for the year ended 31st March, 2018

199Statutoryreports
Corporate Overview
Financial statements
NOTE 16: OTHER EQUITY ` In Lakhs
Particulars As at March 31, 2018
As at March 31, 2017
As atApril 1, 2016
A. Capital reserve (as per the last financial statements) 1,102.63 1,368.86 1,368.86 B. Capital reserve on consolidation 1,961.17 1,283.56 782.79 C. Securities premium account (as per the last financial statements) 16,171.44 16,171.44 16,171.44 D. General reserve (as per the last financial statements) 5,929.05 5,929.05 5,929.05 E. Foreign Currency Translation Reserve (899.22) (1,923.77) –F. Other Comprehensive Income 243.17 (4.57) –G. Retained Earnings (movements given below) 21,164.48 14,397.12 15,574.41 Total - Other equity 45,672.72 37,221.69 39,826.55
Movement in Retained Earnings ` In Lakhs Particulars As at
March 31, 2018As at
March 31, 2017As at
April 1, 2016Opening Balance 14,397.12 15,574.44 21,615.51
Add: Profit for the year 5,040.31 (853.97) (1,102.21)Add: Adjustment on disposal of subsidiary 215.95 – 362.91 Add: On account of Minority Adjustment – – 52.55 Add: De-Console Profit/(Loss) 1,511.10 (323.35) 313.99 Add: Ind AS Adjustments – – (5,668.29)
Closing Balance 21,164.48 14,397.12 15,574.44
NOTE 17: BORROWINGS ` In Lakhs
Particulars Non-current CurrentAs at
March 31, 2018
As at March 31,
2017
As atApril 1, 2016
As at March 31,
2018
As at March 31,
2017
As atApril 1, 2016
SecuredTerm loans
from banks (Refer note 17.1) 8,978.29 13,061.86 12,898.29 9,436.29 6,561.68 4,258.15 from financial institutions (Refer note 17.2) 1,111.53 2,466.32 3,308.42 – 848.24 631.58
0.01% Optionally Convertible Debenturesfrom banks (Refer note 17.6) 52,855.37 – – – – –from financial institutions (Refer note 17.6 (c)) 1,681.83 – – – – –
Deferred payment credits from banks (Refer note 17.3) 33.22 70.59 119.08 32.41 223.96 19.51 from others (Refer note 17.3) 613.84 118.40 115.68 – 7.93 108.70
UnsecuredTerm loans
from related parties (Refer note 17.5) 5,345.61 10,142.71 7,681.33 – – –from Body Corporate (Refer note 17.4) 2,859.88 2,953.42 1,855.04 – – –
Total 73,479.57 28,813.30 25,977.84 9,468.70 7,641.81 5,017.94 Amount disclosed under other current financial liabilities (Refer Note No. 20)
– – – (9,468.70) (7,641.81) (5,017.94)
Total 73,479.57 28,813.30 25,977.84 – – –
Consolidated Financial Statement as at and for the year ended 31st March, 2018

SPML Infra Limited Annual Report 2017-18200
Cons
olid
ated
Fin
anci
al S
tate
men
t as
at a
nd fo
r the
yea
r end
ed 3
1st M
arch
, 201
8
17.1
Sec
urity
and
repa
ymen
t ter
ms
in re
spec
t of t
erm
loan
s fr
om b
anks
N
atur
e of
sec
uriti
es
Out
stan
ding
(`
in L
akhs
)N
os. o
f ins
tallm
ents
ou
tsta
ndin
g as
on
Mar
ch 3
1,20
18
(rem
aini
ng)
Rate
of
inte
rest
As a
t M
arch
31,
20
18
As a
t M
arch
31,
20
17
As a
t M
arch
31,
20
16
Qua
rter
lyM
onth
ly
The
Loan
is s
ecur
ed b
y hy
poth
ecat
ion
ove
r all
the
curr
ent a
sset
s in
clud
ing
rece
ivab
les
and
inve
ntor
y, an
d ot
her f
ree/
non
encu
mbe
red
mov
able
fixe
d as
sets
of A
llaha
bad
Was
te P
roce
ssin
g Pr
ivat
e Li
mite
d (b
oth
pres
ent a
nd fu
ture
) in
any
form
and
man
ner s
atis
fact
ory
to th
e Ba
nk. A
n ad
ditio
nal C
orpo
rate
G
uara
ntee
of t
he U
ltim
ate
Hol
ding
Com
pany
is a
lso
give
n as
sec
urity
.
499
.33
600
.00
997
.31
5BP
LR +
4.
15%
Firs
t ch
arge
on
all m
ovab
le a
nd im
mov
able
ass
ets
of t
he
Com
pany
, pre
sent
and
fut
ure,
equ
itabl
e M
ortg
age
crea
ted
on P
rivat
e la
nd, a
ssig
nmen
t of a
ll pr
ojec
t con
trac
ts a
nd d
ocum
ents
in fa
vour
of
the
bank
, cha
rge
on a
ll fu
ture
rece
ivab
les
and
also
per
sona
l gua
rant
ee o
f all
the
prom
oter
dire
ctor
s of
Aw
a Po
wer
Com
pany
Priv
ate
Lim
ited.
# To
tal o
verd
ue a
mou
nt o
f Ter
m L
oan
as o
n 31
Mar
ch 2
018
is `
541
lakh
s in
clud
ing
inte
rest
.
497
.95
660
.41
787
.42
#BP
LR +
3%
Firs
t ch
arge
on
all m
ovab
le a
nd im
mov
able
ass
ets
of B
haga
lpur
Ele
ctric
ity D
istr
ibut
ion
Com
pany
Pr
ivat
e Li
mite
d (b
oth
pres
ent a
nd fu
ture
, equ
itabl
e m
ortg
age
on P
rivat
e la
nd, a
ssig
nmen
t of a
ll pro
ject
co
ntra
cts
and
docu
men
ts in
favo
ur o
f the
ban
k, c
harg
e on
all
futu
re re
ceiv
able
s an
d al
so b
y pe
rson
al
guar
ante
e of
all
prom
oter
dire
ctor
s of
Bha
galp
ur E
lect
ricity
Dis
trib
utio
n Co
mpa
ny P
rivat
e Li
mite
d.
––
9.8
8 BP
LR +
2.
75%
Firs
t ch
arge
on
all m
ovab
le a
nd im
mov
able
ass
ets
of I
QU
Pow
er C
ompa
ny P
rivat
e Li
mite
d bo
th
pres
ent a
nd fu
ture
, equ
itabl
e M
ortg
age
crea
ted
on P
rivat
e la
nd, a
ssig
nmen
t of a
ll pr
ojec
t con
trac
ts
and
docu
men
ts in
favo
ur o
f the
ban
k, c
harg
e on
all
futu
re re
ceiv
able
s co
rpor
ate
guar
ante
e of
SPM
L En
ergy
and
per
sona
l gua
rant
ee o
f all
the
prom
oter
dire
ctor
s of
IQU
Pow
er C
ompa
ny P
rivat
e Li
mite
d.#
Tota
l ove
rdue
loan
am
ount
as
on 3
1 M
arch
201
8 is
`28
9 la
khs
incl
udin
g in
tere
st.
158
.68
442
.98
537
.07
#BP
LR +
3
%
The
loan
is s
ecur
ed b
y fir
st P
ari-
Pass
u an
d ex
clus
ive
char
ge b
y w
ay o
f Equ
itabl
e m
ortg
age
of th
e en
tire
proj
ect a
sset
s (b
oth
mov
able
and
imm
ovab
le) o
f Lun
i Pow
er C
ompa
ny P
rivat
e Li
mite
d, b
oth
pres
ent a
nd fu
ture
, firs
t Par
i- pa
ssu
and
excl
usiv
e ch
arge
by
way
of h
ypot
heca
tion
of th
e en
tire
Proj
ect
mov
able
ass
ets
of th
e Co
mpa
ny, b
oth
Pres
ent a
nd fu
ture
, equ
itabl
e m
ortg
age
of la
nd m
easu
ring
1.01
he
ctar
es, a
ssig
nmen
t of a
ll pr
ojec
t rev
enue
and
rece
ivab
les
excl
usiv
ely
to th
e Ba
nk, a
ssig
nmen
t of
deve
lopm
ent r
ight
s ov
er 4
.06
hect
ares
of f
ores
t/ g
over
nmen
t lan
d, d
epos
it of
` 4
0 la
khs,
36.
23%
of
shar
es o
f Lun
i Pow
er C
ompa
ny P
rivat
e Li
mite
d he
ld b
y Su
bhas
h Ka
bini
Pow
er C
orpo
ratio
n Li
mite
d,
corp
orat
e gu
aran
tee
by S
ubha
sh K
abin
i Cor
pora
tion
Priv
ate
Lim
ited
and
pers
onal
gua
rant
ee b
y th
e pr
omot
or d
irect
or o
f the
Lun
i Pow
er C
ompa
ny P
rivat
e Li
mite
d.To
tal o
verd
ue L
oan
amou
nt a
s on
31s
t Mar
ch, 2
018
is `
241
lakh
s (in
clud
ing
Inte
rest
).
1,1
94.8
3 1
,800
.28
1,5
67.3
1 24
BPLR
+
4.75
%

201Statutoryreports
Corporate Overview
Financial statements
Cons
olid
ated
Fin
anci
al S
tate
men
t as
at a
nd fo
r the
yea
r end
ed 3
1st M
arch
, 201
8
17.1
Sec
urity
and
repa
ymen
t ter
ms
in re
spec
t of t
erm
loan
s fr
om b
anks
N
atur
e of
sec
uriti
es
Out
stan
ding
(`
in L
akhs
)N
os. o
f ins
tallm
ents
ou
tsta
ndin
g as
on
Mar
ch 3
1,20
18
(rem
aini
ng)
Rate
of
inte
rest
As a
t M
arch
31,
20
18
As a
t M
arch
31,
20
17
As a
t M
arch
31,
20
16
Qua
rter
lyM
onth
ly
The
said
loan
is s
ecur
ed b
y fir
st H
ypot
heca
tion
char
ge o
ver a
ll th
e fix
ed A
sset
s pu
rcha
sed
out o
f ban
k fin
ance
pre
sent
and
futu
re, a
ssig
nmen
t of a
ll co
ntra
ct/li
cens
es in
con
nect
ion
with
pro
ject
, neg
ativ
e lie
n on
the
shar
es o
f the
Com
pany
and
cha
rge
on c
arbo
n cr
edit
rece
ivab
le. S
econ
d ch
arge
on
the
othe
r fix
ed a
sset
s an
d co
llate
ral s
ecur
ity o
f Mad
urai
Mun
icip
al W
aste
Pro
cess
ing
Com
pany
Priv
ate
Lim
ited
give
n fo
r Ter
m L
oan
(firs
t cha
rge
for t
he T
erm
Loa
n). P
erso
nal g
uara
ntee
of M
r. Su
shil
Kum
ar S
ethi
an
d Ri
shab
h Se
thi.
Corp
orat
e gu
aran
tee
of U
ltim
ate
Hol
ding
Com
pany
and
SPM
L U
tiliti
es L
imite
d.
Tota
l ove
rdue
Loa
n am
ount
as
on 3
1st M
arch
, 201
8 is
`1,
321.
27 la
khs
(incl
udin
g In
tere
st).
1,2
80.0
0 1
,280
.00
1,2
80.0
0 19
BPLR
+
6.50
%
The
said
loan
is s
ecur
ed b
y hy
poth
ecat
ion
of a
ll th
e cu
rren
t ass
ets
and
othe
r fre
e/no
n- e
ncum
bere
d m
ovab
le fi
xed
asse
ts o
f M
athu
ra N
agar
Was
te P
roce
ssin
g Co
mpa
ny P
rivat
e Li
mite
d, b
oth
pres
ent
and
futu
re, i
n an
y fo
rm a
nd m
anne
r sa
tisfa
ctor
y to
the
Ban
k an
d fu
rthe
r ba
cked
by
the
corp
orat
e gu
aran
tee
of U
ltim
ate
hold
ing
com
pany
.
70.
00
419
.98
694
.60
1BP
LR +
4.
15 %
The
said
loan
is s
ecur
ed b
y hy
poth
ecat
ion
char
ge o
ver
the
proj
ect a
sset
s w
hich
incl
ude
civi
l wor
k an
d el
ectro
- m
echa
nica
l pla
nt p
rocu
red
by N
eoga
l Pow
er C
ompa
ny P
rivat
e Li
mite
d ou
t of t
he s
aid
loan
, Equ
itabl
e M
ortg
age
of la
nd m
easu
ring
2.60
hec
tare
s, h
ypot
heca
tion
char
ge o
ver r
ecei
vabl
es o
f th
e Co
mpa
ny, 3
3.04
lakh
s sh
ares
of N
eoga
l Pow
er C
ompa
ny P
rivat
e Li
mite
d he
ld b
y Su
bhas
h Ka
bini
Po
wer
Cor
pora
tion
Lim
ited,
sec
ond
char
ge o
ver t
he re
ceiv
able
of S
ubha
sh K
abin
i Pow
er C
orpo
ratio
n Li
mite
d, f
urth
er t
he p
erso
nal g
uara
ntee
of
prom
oter
dire
ctor
s ha
ve b
een
give
n ag
ains
t th
e lo
an in
ad
ditio
n to
the
cor
pora
te g
uara
ntee
giv
en b
y Su
bhas
h Ka
bini
Pow
er C
orpo
ratio
n Li
mite
d an
d th
e U
ltim
ate
hold
ing
com
pany
.
650
.00
840
.18
867
.87
––
Base
Ra
te +
5.
5 %

SPML Infra Limited Annual Report 2017-18202
17.1
Sec
urity
and
repa
ymen
t ter
ms
in re
spec
t of t
erm
loan
s fr
om b
anks
N
atur
e of
sec
uriti
es
Out
stan
ding
(`
in L
akhs
)N
os. o
f ins
tallm
ents
ou
tsta
ndin
g as
on
Mar
ch 3
1,20
18
(rem
aini
ng)
Rate
of
inte
rest
As a
t M
arch
31,
20
18
As a
t M
arch
31,
20
17
As a
t M
arch
31,
20
16
Qua
rter
lyM
onth
ly
The
said
loan
is s
ecur
ed b
y fir
st c
harg
e an
d m
ortg
age
of a
ll m
ovab
le a
nd im
mov
able
pro
pert
ies,
bot
h pr
esen
t and
futu
re o
f Sub
hash
Kab
ini P
ower
Cor
pora
tion
Lim
ited,
Equ
itabl
e m
ortg
age
of L
and
and
build
ing,
Tra
il Ra
ce W
ork,
and
capi
tal w
ork
in p
rogr
ess
of K
abin
i Hyd
ro P
ower
Pro
ject
, hyp
othe
catio
n of
Pla
nt a
nd M
achi
nery
, Fur
nitu
re &
fixt
ure
and
Oth
er e
quip
men
t of
the
Com
pany
, ple
dge
of 3
0%
prom
oter
sha
reho
ldin
g in
the
Com
pany
, ple
dge
of P
rom
oter
's s
hare
hold
ing
to th
e ex
tent
of 3
0% in
tw
o As
soci
ate
Com
pani
es-
Awa
Pow
er C
ompa
ny P
rivat
e Li
mite
d an
d IQ
U P
ower
Com
pany
Priv
ate
Lim
ited,
The
loan
is a
lso
back
ed b
y th
e pe
rson
al g
uara
ntee
of t
he p
rom
otor
dire
ctor
. To
tal o
verd
ue L
oan
amou
nt a
s on
31s
t Mar
ch, 2
018
is `
544
lakh
s.
3,6
82.6
1 5
,154
.64
5,9
13.0
4 10
Base
Ra
te +
3.
5%
The
said
loan
is s
ecur
ed b
y ex
clus
ive
char
ge o
n th
e SJ
A D
evel
oper
s Pr
ivat
e Li
mite
d’s
prop
erty
at
Wor
li, M
umba
i, M
/s D
elhi
Was
te M
anag
emen
t Li
mite
d an
d M
r D
eepa
k Se
thi a
s co
-app
lican
ts a
nd
pers
onal
gua
rant
ee o
f pro
mot
or d
irect
or.
585
.97
585
.97
585
.97
120
8.85
%
a.
Term
Loa
n fro
m IC
ICI B
ank
of `
937.
50 la
khs
(`93
7.50
lakh
s) h
as b
een
conv
erte
d du
ring
the
year
in
to O
CD (S
erie
s G
) pur
suan
t to
“SPM
L S4
A Sc
hem
e” a
nd s
ecur
ed b
y th
e se
curit
ies
men
tione
d th
ere
agai
nst.
b.
Term
loan
of
`39.
00 la
khs
from
Yes
Ban
k ca
rrie
s (`
507.
80 la
khs)
inte
rest
@ 1
1.75
% p
.a. (
YBL
+1.5
0% p
.a.)
and
is re
paya
ble
in 5
qua
rter
ly in
stal
men
ts o
f `7.
75 la
khs
each
alo
ng w
ith in
tere
st
ther
eon
star
ting
from
Feb
ruar
y 20
19 a
nd e
ndin
g by
Feb
ruar
y 20
20. T
he s
aid
loan
is s
ecur
ed b
y w
ay o
f S
ubse
rvie
nt c
harg
e on
all
mov
able
fixe
d as
sets
and
cur
rent
ass
ets
(bot
h pr
esen
t an
d fu
ture
) of t
he C
ompa
ny. F
urth
er, l
oan
is b
acke
d by
the
pers
onal
gua
rant
ee o
f the
Cha
irman
of t
he
Com
pany
and
ple
dge
of s
hare
s of
the
Com
pany
by
the
prom
oter
s/ a
ssoc
iate
s.
5,4
98.6
8 7
,245
.30
3,6
00.0
0
Cons
olid
ated
Fin
anci
al S
tate
men
t as
at a
nd fo
r the
yea
r end
ed 3
1st M
arch
, 201
8

203Statutoryreports
Corporate Overview
Financial statements
17.1
Sec
urity
and
repa
ymen
t ter
ms
in re
spec
t of t
erm
loan
s fr
om b
anks
N
atur
e of
sec
uriti
es
Out
stan
ding
(`
in L
akhs
)N
os. o
f ins
tallm
ents
ou
tsta
ndin
g as
on
Mar
ch 3
1,20
18
(rem
aini
ng)
Rate
of
inte
rest
As a
t M
arch
31,
20
18
As a
t M
arch
31,
20
17
As a
t M
arch
31,
20
16
Qua
rter
lyM
onth
ly
c.
Corp
orat
e Lo
an o
f ̀4,
983.
47 la
khs
(`5,
800
lakh
s) fr
om C
onso
rtiu
m M
embe
r-Ba
nks
carr
ies
inte
rest
ra
ngin
g fro
m @
12.
65%
p.a
. to
14.4
5% p
.a. a
nd a
re r
epay
able
in u
neve
n qu
arte
rly in
stal
men
ts
alon
g w
ith in
tere
st th
ereo
n by
FY
2022
-202
3. T
he s
aid
loan
s ar
e se
cure
d on
par
i-pas
su b
asis
by
(i)
Exte
nsio
n on
all t
he c
urre
nt a
sset
s of
the
Com
pany
(bot
h pr
esen
t and
futu
re) &
mov
able
mac
hine
ry
tang
ible
& in
tang
ible
mov
eabl
e as
sets
(bot
h pr
esen
t and
futu
re),
(ii) E
xclu
sive
mor
tgag
e on
two
Imm
ovab
le P
rope
rtie
s si
tuat
ed a
t Sar
ita V
ihar
, New
Del
hi o
wne
d by
rela
tives
of t
he P
rom
oter
s (ii
i) N
egat
ive
lien
on o
ne p
rope
rty
at N
ew D
elhi
ow
ned
by o
ne o
f the
ass
ocia
tes
(iv) P
ledg
ed s
hare
s of
th
e Co
mpa
ny h
eld
by P
rom
oter
s/As
soci
ates
wor
th `
5,00
0 la
khs.
In a
dditi
on, t
hese
loan
s ar
e al
so
secu
red
by P
erso
nal G
uara
ntee
of t
wo
prop
erty
ow
ners
to th
e ex
tent
of t
he v
alue
of t
he p
rope
rtie
s as
wel
l as
Pers
onal
Gua
rant
ees
of th
e Pr
omot
ers
of th
e Co
mpa
ny.
d.
As a
t the
yea
r end
ed M
arch
31,
201
8, th
e U
ltim
ate
Hol
ding
Com
pany
has
def
aulte
d in
repa
ymen
t of
prin
cipa
l am
ount
of l
oan
and
inte
rest
upt
o 90
day
s am
ount
ing
to `
646.
50 la
khs
and
`686
.75
lakh
s, re
spec
tivel
y; th
e de
faul
t bet
wee
n 91
to 1
80 d
ays
amou
nted
to `
120.
00 la
khs
and
`39.
87
lakh
s to
ban
ks a
nd fi
nanc
ial i
nstit
utio
ns.
Faci
litie
s av
aile
d fro
m U
nion
and
UCO
Ban
k ar
e se
cure
d by
firs
t ch
arge
on
Curr
ent A
sset
s of
SPM
H
oldi
ngs
Pte
Lim
ited,
Cas
h M
argi
n by
way
of
FDR
unde
r lie
n to
Ban
k- U
nion
Ban
k- 1
5% a
nd U
CO
Bank
- 18
.33%
. The
se f
acili
ties
are
also
bac
ked
by C
orpo
rate
Gua
rant
ee o
f Su
bhas
h Ka
bini
Pow
er
Corp
orat
ion
Lim
ited
(Hol
ding
Com
pany
) and
Ulti
mat
e H
oldi
ng C
ompa
ny, P
erso
nal g
uara
ntee
of M
r Su
bhas
h Ch
and
Seth
i and
Mr H
arsh
vard
han
Seth
i.
4,2
14.8
6 –
–
Tota
l 1
8,33
2.91
1
9,02
9.74
1
6,84
0.47
Cons
olid
ated
Fin
anci
al S
tate
men
t as
at a
nd fo
r the
yea
r end
ed 3
1st M
arch
, 201
8

SPML Infra Limited Annual Report 2017-18204
17.2 Security and repayment terms in respect of term loans from financial Institutions a. Loan of `1,111.53 lakhs (March 31, 2017: `3,314.56 lakhs, April 1, 2016: `3,940 lakhs) taken from a financial institution
carries interest @ 13.00% p.a. (IBR +2.80% p.a.) and is repayable in thirteen equated quarterly instalments by April 2021. The said loan is secured against an exclusive charge over the free hold property located at Faridabad, owned by SPML Industries Limited and corporate gurantee provided by SPML Industries Limited. The said loan is also secured against an exclusive charge over Company’s landed property situated at village – Bucholai, Tehsil- Gangapur, Dist- Sawaimadhopur, Rajasthan, Pledge of shares of the Company held by Promoters/Associates giving coverage of Loan amount. Further, loan is backed by the personal guarantees of Main Promoters, Corporate Guarantee & PDCs given by one of associates of the Company
The loans referred above are secured against hypothecation of respective construction equipments.
17.3 Deferred payment credits from banks and others are secured against hypothecation of vehicles / construction equipments purchased against such loans and are repayable in equated monthly instalments (ranging from 8 to 40) carrying interest rates ranging from 9.60% to 11.46% p.a.
17.4 Loan from Body Corporate:a. Loans from body corporates are repayable within a maximum period of 10 years
17.5 Loan from Related Parties:a. `5345.61 lakhs (March 31, 2017: `10,745.77 lakhs, April 1, 2016: `8,281.66 lakhs) is repayable after one year and carries
interest rate @ 12% p.a.
17.6 Security and repayment terms in respect of Optionally Convertible Debentures (OCDs)The Ultimate Holding Company had allotted Unlisted, Unrated, Redeemable, Optionally Convertible Debentures (OCDs) of the `1000/- each under eight series to the Lender Banks in proportion to their participation in the S4A restructuring scheme against conversion of part of their dues. The said eight series of OCDs are secured by way of:
a. OCDs issued under Series A, B, C & H are secured by way of first ranking charge in favour of the Security Trustee (appointed for the benefit of the Secured Parties/debenture holders on pari-passu basis) on (i) Hypothecation of Stocks and Book Debts of the Ultimate Holding Company, both present and future and all other current assets and non-current receivable (ii) Hypothecation of Plant and Machinery, Furniture & Fixtures and office equipment (iii) Lien on Fixed Deposit having issue value of ̀ 38 lakhs in favour of Lead Banks. These loans are additionally secured by the Personal Guarantee of three Promoter Directors of the Ultimate Holding Company and Corporate Guarantee of one of the associates of the Company, except for OCDs issued to ICICI Bank under Series B & under Series C to Yes Bank which are also secured by extension of exclusive securities with them.
b. OCDs issued under Series D are secured by way of exclusive charge in favour of Yes Bank on Pledge of shares of the Ultimate Holding Company held by Promoters/ Associates as well as subservient charge on moveable fixed assets and all current assets of the Company, both present and future. Further, these OCDs are also backed by Personal Guarantee of one Promoter of the Company.
c. OCDs issued under Series E are secured by way of first ranking charge in favour of the Security Trustee (appointed for the benefit of the Secured Parties/debenture holders on pari-passu basis) (i) on all the current assets of the Ultimate Holding Company (both present and future) & movable machinery tangible & intangible moveable assets (both present and future), (ii) Exclusive charge on two Immovable Properties situated at Sarita Vihar, New Delhi, (iii) Pledge of Shares of the Company held by Promoters/Associates having market value of `50 crores (iv) Negative lien on one property at New Delhi owned by one of the Associates. In addition, these OCDs are also secured by Personal Guarantee of two property owners to the extent of the value of the properties as well as Personal Guarantee of Promoters.
d. OCDs issued under Series F are secured by way of exclusive charge in favour of IFCI Limited on (i) the Immovable Properties owned by one of group entities situated in Faridabad. (ii) Immovable Property owned by the Company situated in Sawai Madhopur, Rajasthan (iii) Pledge of shares of the Company held by Promoters/Group entities giving coverage of 1x of loan amount. Further, the Loan is also backed by Personal Guarantee of Main Pormoters, Corporate Guarantee and PDCs given by one of group entities of the Company.
e. OCDs issued under Series G are secured by way of exclusive charge in favour of ICICI Bank Limited on the Immovable Property of the Ultimate Holding Company situated in Gurugram.
f. OCD carry Coupon Rate of 0.01% p.a. to be paid in the first instance from 1st November, 2017 to 31st March, 2018 and
Consolidated Financial Statement as at and for the year ended 31st March, 2018

205Statutoryreports
Corporate Overview
Financial statements
thereafter at the end of each financial quarter commencing from last coupon payment date and ending on the next coupon payment date. OCDs also carry Yield-to-Maturity (YTM) of 8.15% p.a. are redeemable after a moratorium period of five years from the date of issue starting from quarter ending December, 2022 and ending on quarter ending September, 2027.
17.7 Restructuring of entire Debts as availed from the Banks/Financial Institutions under Scheme for Sustainable Structuring of Stressed Assets (“SPML S4A Scheme”)In terms of the Scheme for Sustainable Structuring of Stressed Assets (“SPML S4A Scheme”) as approved by the Super Majority of the Lender Banks with Reference Date as 22nd March, 2017 which was further agreed and approved by the Overseeing Committee (constituted under the aegis of the RBI) on 6th October, 2017 and by the Shareholders of the ultimate Holding Company at their meeting held on 20th November, 2017, the entire crystalized fund-based debts of the Ultimate holding Company had been bifurcated into “Part A” i.e. sustainable part of debt to be serviced as per existing terms and conditions of those debts and “Part B” i.e. non-sustainable part of debt, which has been adjusted against by virtue of transfer of 7859575 Equity Shares as held by Promoters in the Company to the extent of the principal of Proportionate loss sharing by Lenders in favour of the lender banks to entitle them to hold 21.44% stake in the Company & balance of Part B debt converted into unlisted, unrated, reedemable 54,53,517 Optionally Convertible Debentures (OCDs) of `1000 each (carrying coupon rate @0.01 % p.a. with an YTM @8.15% p.a.) in favour of the lender Banks based on their subscription to the OCDs.
17.8 Note for Right of Re-compensation:In the instant arrangement, the Ultimate Holding Company acknowledges that the S4A Lenders reserves a right of recompense (“RoR”) for Concessional Interest Rates. The recompense payable by the Company after the final redemption date depends on various factors such as improved performance of the Company, Cash Inflow & other conditions. Further the quantum of the recompense amount would be ascertained/determined by the Steering Committee of Lenders within a period of one Month from the Final Redemption Date. However, the same is adjustable with the Upside Gain in the event the Debenture holders decide to sell the conversion shares (transferred/sold by Promoters to Lenders pursuant to the SPML S4A Scheme) at any time prior to the final settlement date.
NOTE 18: TRADE PAYABLES (at amortised cost) ` In Lakhs
Particulars Non-current CurrentAs at
March 31, 2018
As at March 31,
2017
As atApril 1, 2016
As at March 31,
2018
As at March 31,
2017
As atApril 1, 2016
Trade Payables :Total outstanding dues of micro and small enterprises (Refer note 36 for details of dues to Micro and Small Enterprises)
– – – – – –
Total outstanding dues of creditors other than micro and small enterprises
5,525.04 7,957.02 7,889.38 96,356.08 90,289.26 1,10,738.91
Total Trade Payables 5,525.04 7,957.02 7,889.38 96,356.08 90,289.26 1,10,738.91
a) Trade payables are non-interest bearing and are normally settled on 60 days terms
b) For terms and conditions with related parties, refer note 39
NOTE 19: PROVISION ` In Lakhs
Particulars Non-current CurrentAs at
March 31, 2018
As at March 31,
2017
As atApril 1, 2016
As at March 31,
2018
As at March 31,
2017
As atApril 1, 2016
Provision for employee benefitsGratuity (refer note 35) 708.60 558.68 526.08 5.32 148.80 161.27 Compensated absences 2.13 4.19 9.36 126.88 142.09 143.48 Provision for Expenses – – – 10.20 41.06 113.79 Total 710.73 562.87 535.44 142.40 331.95 418.54
Consolidated Financial Statement as at and for the year ended 31st March, 2018

SPML Infra Limited Annual Report 2017-18206
NOTE 20: BORROWINGS ` In Lakhs
Particulars As at March 31, 2018
As at March 31, 2017
As atApril 1, 2016
From banksIn Indian Rupee
Cash Credit and working capital facilities (refer note 20.1, 20.2 and 20.3 below)
50,207.10 67,013.67 46,919.67
UnsecuredFrom Related Parties and Bodies Corporates (refer note 20.4, 20.5 and 39)
7,414.41 9,877.78 8,825.26
Cash Credit facilities - In foreign currency (refer note 20.1 and 20.2 below)
– 10,241.61 6,800.49
Total 57,621.51 87,133.06 62,545.42
20.1. Demand loans and cash credit and working capital facilities in Indian rupees are secured by hypothecation of stocks and book debts of the Company, both present and future, hypothecation of certain specific plant and machinery, furniture/fixtures and office equipments and also the lien on fixed deposit of ` 38 lakhs in favour of lead banker as a pari passu charge with other consortium banks. These loans are additionally secured by the guarantees of three promoter directors of the Company and corporate guarantee of SPM Engineers Limited (related party). The demand loans and cash credit and working capital facilities carry interest @ 13.50% to 16.25% p.a.
20.2. This Cash Credit facility from Punjab National Bank is secured by hyphothecation of stock and book debts of ADD Technologies (India) Limited. Interest being paid as per bank lending rate (presently at the rate 11.05%).
20.3. Working Capital loan from NSIC Limited taken by ADD Technologies (India) Limited is Secured by Guarantee and carries interest @ 11% to 13.50% p.a.
20.4. Loan from related parties is repayable on demand and carry interest @ 0% to 18%.
20.5. Loans from bodies corporate carries interest @ 12% p.a to 18% p.a.
NOTE 21: OTHER FINANCIAL LIABILITIES ` In Lakhs
Particulars Non-current CurrentAs at
March 31, 2018
As at March 31,
2017
As atApril 1, 2016
As at March 31,
2018
As at March 31,
2017
As atApril 1, 2016
Current maturities of long-term borrowings (Note 17)
– – – 9,468.70 7,641.81 5,017.94
Advance from Customers 5,152.47 7,967.96 8,088.91 19,948.92 11,301.50 9,874.25 Interest Accrued on mobilzation advance – – – 2,852.54 3,510.49 3,584.70 Interest accrued and due on borrowings – – – 1,527.54 636.66 308.51 Interest accrued and not due on borrowings – – – 23.52 25.63 32.50 Unpaid dividend* – – – 0.97 2.77 4.70 Total 5,152.47 7,967.96 8,088.91 33,822.19 23,118.86 18,822.60
* There is no amount due and outstanding which is to be transferred to investor education & protection fund.
Consolidated Financial Statement as at and for the year ended 31st March, 2018

207Statutoryreports
Corporate Overview
Financial statements
NOTE 22: OTHER CURRENT LIABILITIES ` In Lakhs
Particulars As at March 31, 2018
As at March 31, 2017
As atApril 1, 2016
Statutory Dues payable 1,696.54 1,781.40 2,013.84 Other Current Liabilities 4,176.53 4,126.00 –Total 5,873.07 5,907.40 2,013.84
NOTE 23: DEFERRED TAX ASSETS / (LIABILITIES) ` In Lakhs
Particulars As at March 31, 2018
As at March 31, 2017
As atApril 1, 2016
Deferred tax liabilitiesArising out of temporary difference in property, plant and equipment 14.97 32.02 –Arising due to other temporary differences – – 99.47 Gross Deferred tax liabilities 14.97 32.02 99.47
Deferred tax assetsArising due to temporary differences due to Ind AS Adjustments 4,581.96 4,695.58 3,918.65 Arising out of temporary difference in property, plant and equipment 870.54 617.62 1.33 Others 212.96 – 107.76 Brought Forward Losses 74.89 6.97 –Expenses disallowed under Income Tax Act 11.74 19.79 22.34 Gross Deferred tax assets 5,752.09 5,339.96 4,050.08
Income tax expense in the Statement of profit and loss ` In Lakhs Particulars 2017-18 2016-17Current income tax charge 1,499.78 561.05 Adjustments in respect of current income tax of previous year 1.09 21.53 MAT Credit utilisation (238.50) 10.33 Deferred tax (127.27) (1,240.83)Total 1,135.10 (647.92)
Reconciliation of tax expense and the accounting profit multiplied by India’s domestic tax rate ` In Lakhs Particulars 2017-18 2016-17Profit before tax 6,175.41 (1,501.88)At India’s statutory income tax rate of 34.608% (31 March 2017: 34.608 %) 2,137.19 (519.77)
Effect of Profit chargeable at different rate and disallowances under IT Act (592.67) 543.75 Effect of tax on Elimination due to consolidation 51.52 0.21 Effect of Other income not chargeable to Income tax 207.72 821.10 Effect of share of Associates and Minority interest (245.46) (312.91) Others (58.52) 28.67Current tax expense reported in the statement of profit and loss 1,499.78 561.05
Consolidated Financial Statement as at and for the year ended 31st March, 2018
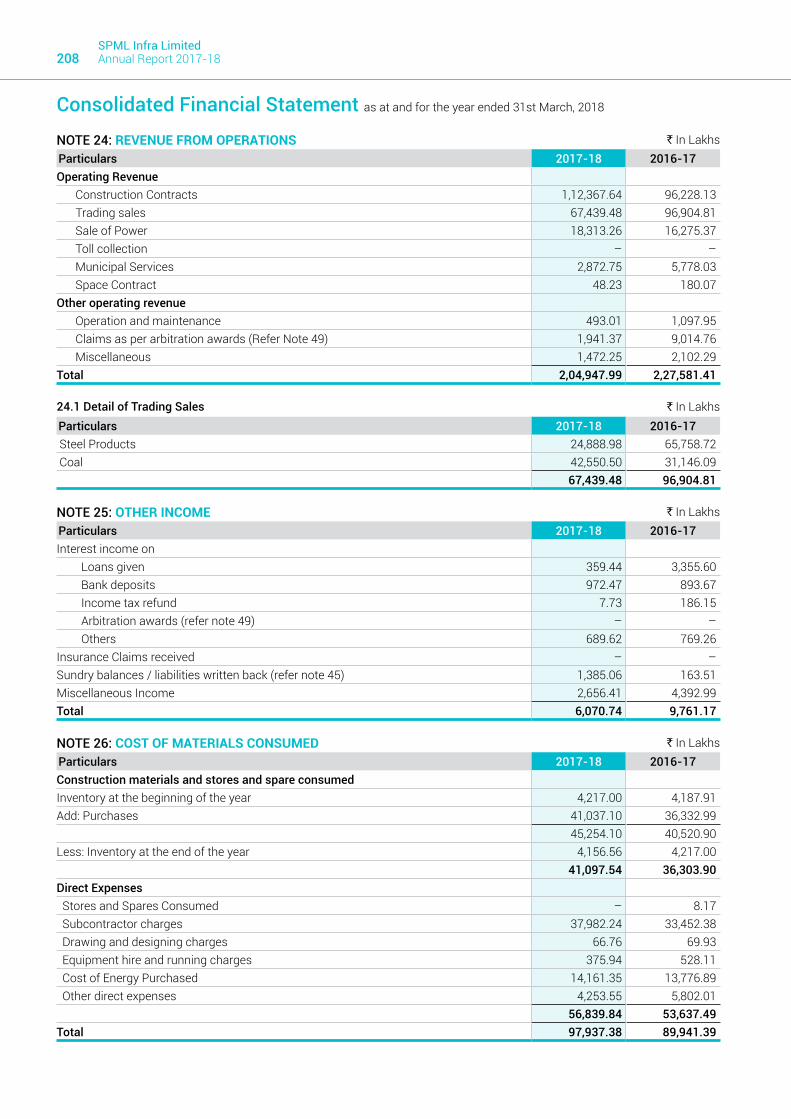
SPML Infra Limited Annual Report 2017-18208
NOTE 24: REVENUE FROM OPERATIONS ` In Lakhs Particulars 2017-18 2016-17Operating Revenue
Construction Contracts 1,12,367.64 96,228.13 Trading sales 67,439.48 96,904.81 Sale of Power 18,313.26 16,275.37 Toll collection – –Municipal Services 2,872.75 5,778.03 Space Contract 48.23 180.07
Other operating revenueOperation and maintenance 493.01 1,097.95 Claims as per arbitration awards (Refer Note 49) 1,941.37 9,014.76 Miscellaneous 1,472.25 2,102.29
Total 2,04,947.99 2,27,581.41
24.1 Detail of Trading Sales ` In Lakhs Particulars 2017-18 2016-17 Steel Products 24,888.98 65,758.72 Coal 42,550.50 31,146.09
67,439.48 96,904.81
NOTE 25: OTHER INCOME ` In Lakhs Particulars 2017-18 2016-17Interest income on
Loans given 359.44 3,355.60 Bank deposits 972.47 893.67 Income tax refund 7.73 186.15 Arbitration awards (refer note 49) – – Others 689.62 769.26
Insurance Claims received – –Sundry balances / liabilities written back (refer note 45) 1,385.06 163.51 Miscellaneous Income 2,656.41 4,392.99 Total 6,070.74 9,761.17
NOTE 26: COST OF MATERIALS CONSUMED ` In Lakhs Particulars 2017-18 2016-17Construction materials and stores and spare consumedInventory at the beginning of the year 4,217.00 4,187.91 Add: Purchases 41,037.10 36,332.99
45,254.10 40,520.90 Less: Inventory at the end of the year 4,156.56 4,217.00
41,097.54 36,303.90 Direct Expenses Stores and Spares Consumed – 8.17 Subcontractor charges 37,982.24 33,452.38 Drawing and designing charges 66.76 69.93 Equipment hire and running charges 375.94 528.11 Cost of Energy Purchased 14,161.35 13,776.89 Other direct expenses 4,253.55 5,802.01
56,839.84 53,637.49 Total 97,937.38 89,941.39
Consolidated Financial Statement as at and for the year ended 31st March, 2018

209Statutoryreports
Corporate Overview
Financial statements
NOTE 28: EMPLOYEE BENEFIT EXPENSES ` In Lakhs
Particulars 2017-18 2016-17Salaries, Wages and Bonus 6,478.23 7,696.09 Contribution to Provident and Others Funds 425.53 407.24 Gratuity expense (Refer Note 35) 256.76 160.55 Staff Welfare Expenses 120.40 146.88 Total 7,280.92 8,410.76
NOTE 29: DEPRECIATION ` In Lakhs
Particulars 2017-18 2016-17Depreciation on Tangible assets 1,680.88 2,108.92 Amortisation of Intangible Assets 2.53 4.84 Total 1,683.41 2,113.75
NOTE 30: FINANCE COSTS ` In Lakhs
Particulars Year ended March 31, 2018
Year ended March 31, 2017
Interest (including interest on mobilisation advance amounting to `1,437.50 lakhs (31 March, 2017- `1,271.32 lakhs)
21,254.47 25,948.03
Other borrowing costs 102.66 87.48 Total 21,357.13 26,035.51
NOTE 27: CHANGES IN WORK IN PROGRESS AND TRADED GOODS ` In Lakhs
Particulars 2017-18 2016-17Inventories at the end of the year:
Work in Progress (2,222.02) (2,222.02)Finished Goods – –
Inventories at the beginning of the year:Work in Progress 2,222.02 2,254.46 Finished Goods – –
Increase/ (Decrease) in Inventories – 32.44
Consolidated Financial Statement as at and for the year ended 31st March, 2018

SPML Infra Limited Annual Report 2017-18210
NOTE 31: OTHER EXPENSES ` In Lakhs
Particulars 2017-18 2016-17Rent (Refer Note 34) 648.68 736.43 Rates and taxes 120.97 357.13 Repairs and maintenance:
Building 27.09 16.31 Plant and machinery 81.85 92.79 Others 280.91 373.81
Insurance 370.12 395.79 Advertisement expenses 45.28 23.14 Professional charges and consultancy fees 2,179.03 1,627.98 Vehicle running charges 439.22 591.26 Travelling and conveyance 782.16 849.90 Communication expenses 100.94 156.90 Power and fuel 166.06 218.78 Charity and donations 7.75 13.88 Auditor's remuneration 70.45 112.91 Business promotion 243.40 95.53 Loss on sale of fixed assets (net) 86.33 4.68 Bad debts / sundry balances written off 1,653.06 4,586.89 Provision on Trade Receivables 1,023.18 2,857.40 Miscellaneous expenses 4,455.73 3,316.64 Total 12,782.21 16,428.15
NOTE 32: BASIS FOR CALCULATION OF BASIC AND DILUTED EARNINGS PER SHARE IS AS UNDERParticulars 2017-18 2016-17Profit attributable to equity holders of the parent for basic earnings (` In Lakhs) 5,288.03 (858.54)Weighted average number of equity shares for basic EPS 3,66,50,276 3,66,50,276 Nominal value of equity per share (`) 2 2
Earnings per Share - Basic & Diluted (`) 14.43 (2.34)
NOTE 33: COMMITMENT AND CONTINGENCIESa. Commitments ` In Lakhs Particulars As at
March 31, 2018As at
March 31, 2017As at
April 1, 2016Estimated amount of contracts remaining to be executed on Capital Account(net of capital advance of `140.86 lakhs (31 March 2017: `140.86 lakhs, 1 April 2016: `113.95 lakhs)
140.86 140.86 113.95
Consolidated Financial Statement as at and for the year ended 31st March, 2018
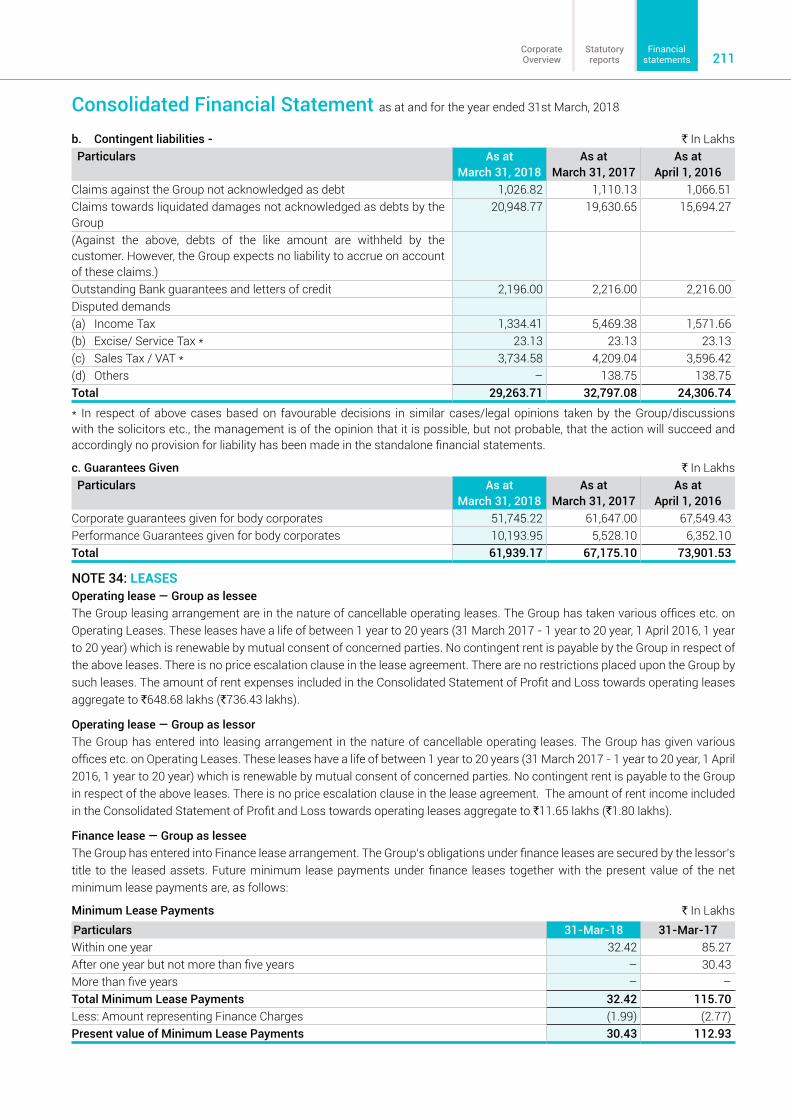
211Statutoryreports
Corporate Overview
Financial statements
b. Contingent liabilities - ` In Lakhs Particulars As at
March 31, 2018As at
March 31, 2017As at
April 1, 2016Claims against the Group not acknowledged as debt 1,026.82 1,110.13 1,066.51 Claims towards liquidated damages not acknowledged as debts by the Group
20,948.77 19,630.65 15,694.27
(Against the above, debts of the like amount are withheld by the customer. However, the Group expects no liability to accrue on account of these claims.)Outstanding Bank guarantees and letters of credit 2,196.00 2,216.00 2,216.00 Disputed demands(a) Income Tax 1,334.41 5,469.38 1,571.66 (b) Excise/ Service Tax * 23.13 23.13 23.13 (c) Sales Tax / VAT * 3,734.58 4,209.04 3,596.42 (d) Others – 138.75 138.75 Total 29,263.71 32,797.08 24,306.74
* In respect of above cases based on favourable decisions in similar cases/legal opinions taken by the Group/discussions with the solicitors etc., the management is of the opinion that it is possible, but not probable, that the action will succeed and accordingly no provision for liability has been made in the standalone financial statements.
c. Guarantees Given ` In Lakhs Particulars As at
March 31, 2018As at
March 31, 2017As at
April 1, 2016Corporate guarantees given for body corporates 51,745.22 61,647.00 67,549.43Performance Guarantees given for body corporates 10,193.95 5,528.10 6,352.10 Total 61,939.17 67,175.10 73,901.53
NOTE 34: LEASESOperating lease — Group as lessee The Group leasing arrangement are in the nature of cancellable operating leases. The Group has taken various offices etc. on Operating Leases. These leases have a life of between 1 year to 20 years (31 March 2017 - 1 year to 20 year, 1 April 2016, 1 year to 20 year) which is renewable by mutual consent of concerned parties. No contingent rent is payable by the Group in respect of the above leases. There is no price escalation clause in the lease agreement. There are no restrictions placed upon the Group by such leases. The amount of rent expenses included in the Consolidated Statement of Profit and Loss towards operating leases aggregate to `648.68 lakhs (`736.43 lakhs).
Operating lease — Group as lessor The Group has entered into leasing arrangement in the nature of cancellable operating leases. The Group has given various offices etc. on Operating Leases. These leases have a life of between 1 year to 20 years (31 March 2017 - 1 year to 20 year, 1 April 2016, 1 year to 20 year) which is renewable by mutual consent of concerned parties. No contingent rent is payable to the Group in respect of the above leases. There is no price escalation clause in the lease agreement. The amount of rent income included in the Consolidated Statement of Profit and Loss towards operating leases aggregate to `11.65 lakhs (`1.80 lakhs).
Finance lease — Group as lesseeThe Group has entered into Finance lease arrangement. The Group’s obligations under finance leases are secured by the lessor’s title to the leased assets. Future minimum lease payments under finance leases together with the present value of the net minimum lease payments are, as follows:
Minimum Lease Payments ` In Lakhs Particulars 31-Mar-18 31-Mar-17Within one year 32.42 85.27 After one year but not more than five years – 30.43 More than five years – –Total Minimum Lease Payments 32.42 115.70 Less: Amount representing Finance Charges (1.99) (2.77)Present value of Minimum Lease Payments 30.43 112.93
Consolidated Financial Statement as at and for the year ended 31st March, 2018

SPML Infra Limited Annual Report 2017-18212
Present value of Minimum Lease Payments ` In Lakhs Particulars 31-Mar-18 31-Mar-17Within one year 30.43 85.27 After one year but not more than five years – 27.66 More than five years – –Total Present value of Minimum Lease Payments 30.43 112.93
NOTE 35: EMPLOYEE BENEFIT OBLIGATION(a) Defined Benefit Plan The following tables summaries the components of net benefit expenses recognized in the Consolidated Statement of Profit
& Loss and OCI amounts recognized in the balance sheet: ` In Lakhs Particulars Gratuity Unfunded
As at March 31, 2018
As at March 31, 2017
Changes in the present value of defined benefit obligationPresent value of defined benefit obligation as at year beginning 468.92 422.22Current Service Cost 173.16 107.76Interest Cost 83.60 52.79Remeasurements (gains)/losses
Actuarial (gains)/losses arising from changes in demographic assumptions 20.16 (27.59)Actuarial (gains)/losses arising from changes in financial assumptions (31.03) 25.45 Actuarial (gains)/losses arising from changes in experience adjustments (42.21) (111.71)
Present value of defined benefit obligation as at year end 672.60 468.92
` In Lakhs Particulars As at
March 31, 2018As at
March 31, 2017Plan Assets at the beginning of the year – –Expected return on Plan assets – –Contribution by Employer – –Actual benefits paid – –Actuarial Gains/ (losses) – –Plan Assets at the end of the year – –
` In Lakhs Particulars As at
March 31, 2018As at
March 31, 2017Amounts Recognised in the Balance SheetPresent value of defined benefit obligation at the year end 723.87 707.48 Fair Value of the Plan Assets at the year end – –Liability/(Asset) Recognised in the Balance Sheet 723.87 707.48
Consolidated Financial Statement as at and for the year ended 31st March, 2018

213Statutoryreports
Corporate Overview
Financial statements
` In Lakhs Particulars 2017-18 2016-17Expense recognised in the Statement of Profit and Loss:Current Service Cost 173.16 92.76 Net Interest Cost/(Income) 83.60 44.12 Net Cost Recognised in the Statement of Profit and Loss 256.76 136.88
Expense recognised in the Other Comprehensive Income:Remeasurements (gains)/losses (53.08) (113.85)Net Cost Recognised in Other Comprehensive Income (53.08) (113.85)
(i) The principal assumptions used in determining gratuity obligations for the Company’s plans are shown belowSignificant Actuarial Assumptions As at
March 31, 2018As at
March 31, 2017Discount Rate 7.75% 8.00%Mortality Rate 100% 100%Withdrawal Rate Varying
between 8% per annum and 1% per annum
depending on duration and age of employees
Varying between 8%
per annum and 1% per annum
depending on duration and age of employees
Salary Growth Rate (%) 5-10% 5-10%Experience Adjustments on Plan Liabilities Not Available Not Available
(ii) A quantitative sensitivity analysis for significant assumption is as shown below ` In LakhsAssumptions As at March 31, 2018 As at March 31, 2017
Discount rate Discount rate1% increase 1% decrease 1% increase 1% decrease
Sensitivity LevelImpact on defined benefit obligation 782.41 880.21 787.99 901.23
` In LakhsAssumptions As at March 31, 2018 As at March 31, 2017
Withdrawal rate Withdrawal rate1% increase 1% decrease 1% increase 1% decrease
Sensitivity LevelImpact on defined benefit obligation 696.75 682.89 664.18 653.13
` In LakhsAssumptions As at March 31, 2018 As at March 31, 2017
Future Salary Future Salary1% increase 1% decrease 1% increase 1% decrease
Sensitivity LevelImpact on defined benefit obligation 785.31 694.80 756.05 651.92
Consolidated Financial Statement as at and for the year ended 31st March, 2018
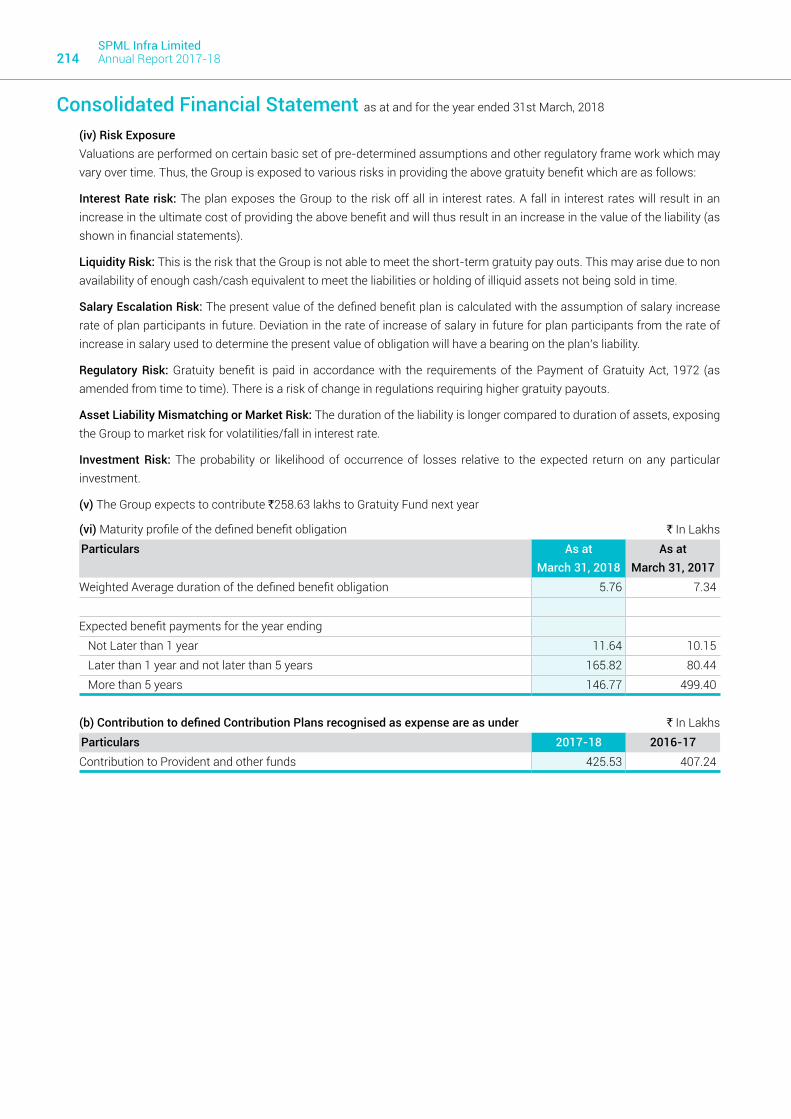
SPML Infra Limited Annual Report 2017-18214
(iv) Risk Exposure Valuations are performed on certain basic set of pre-determined assumptions and other regulatory frame work which may vary over time. Thus, the Group is exposed to various risks in providing the above gratuity benefit which are as follows:
Interest Rate risk: The plan exposes the Group to the risk off all in interest rates. A fall in interest rates will result in an increase in the ultimate cost of providing the above benefit and will thus result in an increase in the value of the liability (as shown in financial statements).
Liquidity Risk: This is the risk that the Group is not able to meet the short-term gratuity pay outs. This may arise due to non availability of enough cash/cash equivalent to meet the liabilities or holding of illiquid assets not being sold in time.
Salary Escalation Risk: The present value of the defined benefit plan is calculated with the assumption of salary increase rate of plan participants in future. Deviation in the rate of increase of salary in future for plan participants from the rate of increase in salary used to determine the present value of obligation will have a bearing on the plan’s liability.
Regulatory Risk: Gratuity benefit is paid in accordance with the requirements of the Payment of Gratuity Act, 1972 (as amended from time to time). There is a risk of change in regulations requiring higher gratuity payouts.
Asset Liability Mismatching or Market Risk: The duration of the liability is longer compared to duration of assets, exposing the Group to market risk for volatilities/fall in interest rate.
Investment Risk: The probability or likelihood of occurrence of losses relative to the expected return on any particular investment.
(v) The Group expects to contribute `258.63 lakhs to Gratuity Fund next year
(vi) Maturity profile of the defined benefit obligation ` In Lakhs Particulars As at
March 31, 2018As at
March 31, 2017Weighted Average duration of the defined benefit obligation 5.76 7.34
Expected benefit payments for the year ending Not Later than 1 year 11.64 10.15 Later than 1 year and not later than 5 years 165.82 80.44 More than 5 years 146.77 499.40
(b) Contribution to defined Contribution Plans recognised as expense are as under ` In Lakhs Particulars 2017-18 2016-17Contribution to Provident and other funds 425.53 407.24
Consolidated Financial Statement as at and for the year ended 31st March, 2018

215Statutoryreports
Corporate Overview
Financial statements
` In Lakhs Particulars As at
March 31, 2018As at
March 31, 2017Contract income recognized as revenue during the year 1,12,367.64 96,228.13 Aggregate amount of costs incurred and recognized profits (less recognized losses) till date for contracts in progress
5,32,748.82 6,06,862.90
Advances received (unadjusted) for contracts in progress 39,767.47 16,958.88 Retention amount for contracts in progress 22,617.27 19,967.47 Gross amount due from customers for contract work for contracts in progress 20,932.57 47,002.57 Gross amount due to customers for contract work for contracts in progress 65,878.91 352.00
NOTE 36: BASED ON THE INFORMATION / DOCUMENTS AVAILABLE WITH THE COMPANY, INFORMATION AS PER THE REQUIREMENT OF SECTION 22 OF THE MICRO, SMALL AND MEDIUM ENTERPRISES DEVELOPMENT ACT, 2006 ARE AS UNDER:
NOTE 37: a. Information relating to Construction contracts as per Ind AS 11 “Construction Contracts”- Amount due from/ to Customers
on Construction Contracts are given below:
b The Group has a process whereby periodically all long term contracts are assessed for material foreseeable losses. At the year end, the Group has reviewed and ensured that adequate provision as required under the law for the material foreseeable losses on such long term contracts has been made in the books of accounts.
Details of dues to Micro and Small Enterprises as per MSMED Act, 2006 ` In Lakhs Particulars As at
March 31, 2018As at
March 31, 2017As at
April 1, 2016The amount of interest paid by the buyer in terms of Section 16, of the Micro, Small and Medium Enterprises Development Act, 2006 along with the amounts of the payment made to the supplier beyond the appointed day during each accounting year.
Principal – 0.19 –Interest – – –
The amount of interest paid by the buyer in terms of Section 16, of the Micro, Small and Medium Enterprises Development Act, 2006 along with the amounts of the payment made to the supplier beyond the appointed day during each accounting year.
Principal – – –Interest – – –
The amount of interest due and payable for the period of delay in making payment (which have been paid but beyond the appointed day during the year) but without adding the interest specified under Micro, Small and Medium Enterprises Development Act, 2006.
– – –
Amount of interest accrued for the year and remaining unpaid at the end of each accounting year
– – 52.56
The amount of further interest remaining due and payable even in the succeeding years, until such date when the interest dues as above are actually paid to the small enterprise for the purpose of disallowance as a deductible expenditure under Section 23 of the Micro Small and Medium Enterprise Development Act, 2006
– – –
The above information regarding micro, small and medium enterprises have been determined to the extent such parties have been identified on the basis of information available with the Group.
Consolidated Financial Statement as at and for the year ended 31st March, 2018
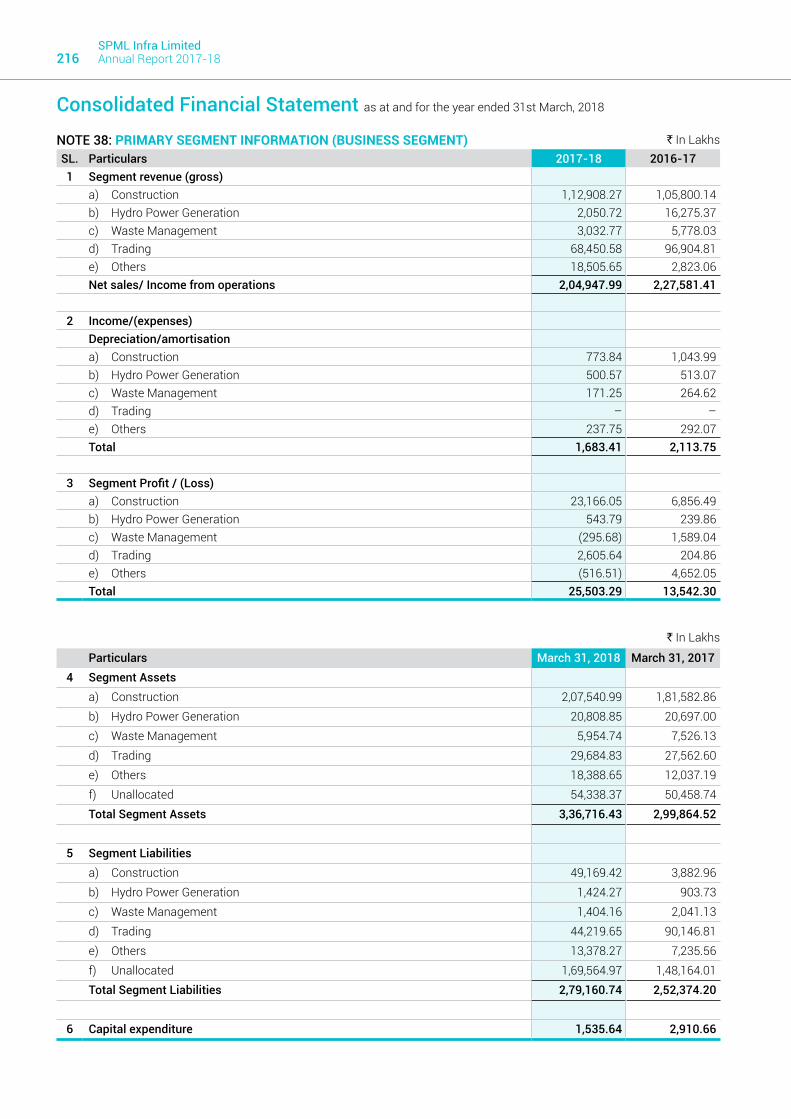
SPML Infra Limited Annual Report 2017-18216
NOTE 38: PRIMARY SEGMENT INFORMATION (BUSINESS SEGMENT) ` In Lakhs SL. Particulars 2017-18 2016-171 Segment revenue (gross)
a) Construction 1,12,908.27 1,05,800.14 b) Hydro Power Generation 2,050.72 16,275.37 c) Waste Management 3,032.77 5,778.03 d) Trading 68,450.58 96,904.81 e) Others 18,505.65 2,823.06 Net sales/ Income from operations 2,04,947.99 2,27,581.41
2 Income/(expenses)Depreciation/amortisationa) Construction 773.84 1,043.99 b) Hydro Power Generation 500.57 513.07 c) Waste Management 171.25 264.62 d) Trading – –e) Others 237.75 292.07 Total 1,683.41 2,113.75
3 Segment Profit / (Loss) a) Construction 23,166.05 6,856.49 b) Hydro Power Generation 543.79 239.86 c) Waste Management (295.68) 1,589.04 d) Trading 2,605.64 204.86 e) Others (516.51) 4,652.05 Total 25,503.29 13,542.30
` In Lakhs
Particulars March 31, 2018 March 31, 20174 Segment Assets
a) Construction 2,07,540.99 1,81,582.86 b) Hydro Power Generation 20,808.85 20,697.00 c) Waste Management 5,954.74 7,526.13 d) Trading 29,684.83 27,562.60 e) Others 18,388.65 12,037.19 f) Unallocated 54,338.37 50,458.74 Total Segment Assets 3,36,716.43 2,99,864.52
5 Segment Liabilitiesa) Construction 49,169.42 3,882.96 b) Hydro Power Generation 1,424.27 903.73 c) Waste Management 1,404.16 2,041.13 d) Trading 44,219.65 90,146.81 e) Others 13,378.27 7,235.56 f) Unallocated 1,69,564.97 1,48,164.01 Total Segment Liabilities 2,79,160.74 2,52,374.20
6 Capital expenditure 1,535.64 2,910.66
Consolidated Financial Statement as at and for the year ended 31st March, 2018

217Statutoryreports
Corporate Overview
Financial statements
Reconciliation of amounts reflected in the financial statements ` In Lakhs SL. Particulars 2017-18 2016-17
Segment profit 25,503.29 13,542.30 Less / (Add)i Finance Expenses - Net 19,327.88 15,044.19 ii Unallocable expenditure net of income – –Profit/Loss before tax 6,175.42 (1,501.89)
(a) Revenue from external customers: ` In Lakhs SL. Particulars 2017-18 2016-17
India 1,61,365.11 1,94,039.27Outside India 43,582.88 33,542.14Total 2,04,947.99 2,27,581.41
(b) Non-current operating Assets: ` In Lakhs SL. Particulars March 31, 2018 March 31, 2017
India 1,15,626.00 1,10,569.71Outside India – –Total 1,15,626.00 1,10,569.71
NOTE 39: RELATED PARTIES(a) Particulars of Related Parties with whom transactions have taken place during the year
Associates Companies Sanamti Infra Developers Private LimitedPT Vardhaman Mining ServicesPT Vardhaman LogisticsRabaan (S) Pte LimitedPT Bina Insan Sukses MandiriBhilwara Jaipur Toll Road Private LimitedSPML Bhiwandi Water Supply Infra LimitedSPML Bhiwandi Water Supply Management LimitedAurangabad Jal Constructions Private LimitedAurangabad Jal Supply Solution Private Limited
Joint Operations SPML-CISC JVSPML - Simplex JVSPML-HCIL JVOM Metals Consortium JVSiddharth- Mahaveer SPML –JVKBL-SPML JVSPML - OM Metals JVM&P+Subhash JVSPML-SEW-AMR Joint VentureSMS-SPML JVSUEZ -SPML JVMEIL-SPML (JV)
Joint Ventures Malviya Nagar Water Services Private LimitedMVV Water Utility Private Limited Gurha Thermal Power Company LimitedAurangabad City Water Utility Company LimitedHydro Comp Enterprises (India) Limited
Consolidated Financial Statement as at and for the year ended 31st March, 2018

SPML Infra Limited Annual Report 2017-18218
Key Management Personnel (KMP) Mr. Subhash Chand Sethi, ChairmanMr. Sushil Kumar Sethi, Managing DirectorMr. Sujit Kumar Jhunjhunwala, Chief Financial OfficerMr. Abhay Raj Singh, Company Secretary
Relatives of Key Management PersonnelMr. Anil Kumar Sethi Brother of Chaiman & Managing DirectorMr. Harshavardhan Sethi Son of ChairmanMrs. Maina Devi Sethi Mother of Chairman and Managing DirectorMrs. Noopur Jain Daughter of Managing DirectorMrs. Suman Sethi Wife of ChairmanMr. Abhinandan Sethi Son of ChairmanMrs. Sandhya Rani Sethi Wife of Managing DirectorMr. Rishabh Sethi Son of Managing DirectorMrs. Shilpa Sethi Daughter in law of ChairmanDr. Ankit Jain Son-in-law of Managing DirectorMrs. Priyanshi Sethi Daughter in law of ChairmanMrs. Aanchal Sethi Daughter in law of Managing Director
Enterprises owned by KMP's or their relatives or where the KMP's havesignificantly influence
Add Technologies (India) Limited (Become a subsidiary w.e.f. 31st March, 2017)Arihant Leasing & Holding Company LimitedADD Realty LimitedAdd Eco Enviornment LimitedADD Industrial Park (TN) LimitedBharat Hydro Power Corporation LimitedDWMG Software Private LimitedInternational Construction LimitedLatur Water Supply Managment Company LimitedMeena Holdings LimitedMeena ADD Charity Initiative FoundationNiral Enterprises Private LimitedOm Metal-SPML Infra Project Private LimitedPondicherry Sez Company Private LimitedPondicherry Port LimitedPOM POM Recycling Private LimitedSanmati Corporate Investments Private LimitedSanmati Power Company Private LimitedVidyaEdutech Private LimitedSPM Engineers LimitedSPML India LimitedSethi Infratech Private LimtedSubhash Systems Private LimitedSPML Industries LimitedZoom Industrial Services Limited20th Century Engineering LimitedPeacock Pearl Business Solution Private LimitedRishabh Homes Private Limited Techno Mechanical Services Private Limited
Note:- Related party relationships as mentioned in the above list are determined by the management based on nature of ‘control’ that the Company exercises over the other companies.
Consolidated Financial Statement as at and for the year ended 31st March, 2018

219Statutoryreports
Corporate Overview
Financial statements
Cons
olid
ated
Fin
anci
al S
tate
men
t as
at a
nd fo
r the
yea
r end
ed 3
1st M
arch
, 201
8
Rela
ted
part
y tr
ansa
ctio
ns(b
) Agg
rega
ted
Rela
ted
part
y di
sclo
sure
s as
at a
nd fo
r the
yea
r end
ed M
arch
31,
201
8 `
In L
akhs
Co
mpa
ny N
ame
Tran
sact
ions
dur
ing
the
year
Out
stan
ding
as
on th
e Ba
lanc
e Sh
eet d
ate
Sal
e of
G
oods
&
Serv
ices
Pur
chas
e of
G
oods
&
Serv
ices
Inte
rest
Pa
idD
onat
ion
Paid
Inte
rest
Re
ceiv
ed
Loa
n/Ad
vanc
e Ta
ken
Loa
n/Ad
vanc
e G
iven
/Re-
paid
/ Sha
re
Appl
icat
ion
Mon
ey
Sal
e/tr
ansf
er
of In
vest
-m
ents
Pur
chas
e of
Inve
st-
men
ts
Ren
t Pa
id/
Accr
ued
Man
ager
ial
Rem
uner
atio
n / S
alar
y
Com
mis
sion
Re
ceiv
ed D
ebit
bala
nce
Cre
dit
bala
nce
Gua
rant
ee
Giv
en
ASSO
CIAT
ES
COM
PAN
IES
Miz
oram
Min
eral
D
evel
opm
ent
Corp
orat
ion
Lim
ited
201
7-18
–
––
––
––
––
––
––
––
201
6-17
–
––
––
(2.8
5)–
––
––
––
––
201
5-16
(2
.85)
––
Sanm
ati I
nfra
D
evel
oper
s Pr
ivat
e Li
mite
d
201
7-18
–
––
– 1
0.24
–
0.8
1 –
––
––
82.
84
––
201
6-17
–
––
– (8
.08)
– (1
.30)
––
––
– (7
2.81
)–
–
201
5-16
(6
4.24
)–
–
SPM
L Bh
iwan
di W
ater
Su
pply
Infr
a Li
mite
d 2
017-
18
––
––
147
.68
– 0
.01
––
––
– 1
,290
.26
93.
80
201
6-17
–
––
– (1
24.7
2)–
(0.0
7)–
––
––
(1,1
52.4
2) (9
3.80
)–
201
5-16
(1
,036
.56)
––
SPM
L Bh
iwan
di W
ater
Su
pply
Man
agem
ent
Lim
ited
201
7-18
–
––
– 4
.32
– 0
.01
––
––
– 6
2.20
–
–
201
6-17
–
––
– (3
.90)
– (0
.11)
––
––
– (5
5.99
)–
–
201
5-16
(5
2.37
)–
–
P.T
Vard
hman
Min
ing
Se
rvic
es 2
017-
18
201
6-17
–
––
––
––
––
––
– (5
29.4
2)–
–
201
5-16
(5
10.5
6)–
–
P.T
Bina
Insa
n Su
kes
Man
diri
201
7-18
–
––
––
1,8
09.1
1 –
––
––
––
3,6
49.8
1 –
201
6-17
–
––
––
––
––
––
––
(1,8
84.4
4)–
201
5-16
–
(2,4
95.5
7)–
Raba
an (S
) Pte
Lim
ited
201
7-18
201
6-17
–
––
––
––
––
––
– (3
.24)
––
201
5-16
(8
8.97
)–
–

SPML Infra Limited Annual Report 2017-18220
Rela
ted
part
y tr
ansa
ctio
ns(b
) Agg
rega
ted
Rela
ted
part
y di
sclo
sure
s as
at a
nd fo
r the
yea
r end
ed M
arch
31,
201
8 `
In L
akhs
Co
mpa
ny N
ame
Tran
sact
ions
dur
ing
the
year
Out
stan
ding
as
on th
e Ba
lanc
e Sh
eet d
ate
Sal
e of
G
oods
&
Serv
ices
Pur
chas
e of
G
oods
&
Serv
ices
Inte
rest
Pa
idD
onat
ion
Paid
Inte
rest
Re
ceiv
ed
Loa
n/Ad
vanc
e Ta
ken
Loa
n/Ad
vanc
e G
iven
/Re-
paid
/ Sha
re
Appl
icat
ion
Mon
ey
Sal
e/tr
ansf
er
of In
vest
-m
ents
Pur
chas
e of
Inve
st-
men
ts
Ren
t Pa
id/
Accr
ued
Man
ager
ial
Rem
uner
atio
n / S
alar
y
Com
mis
sion
Re
ceiv
ed D
ebit
bala
nce
Cre
dit
bala
nce
Gua
rant
ee
Giv
en
JOIN
T VE
NTU
RES
Mal
viya
Nag
ar W
ater
Se
rvic
es P
rivat
e Li
mite
d
201
7-18
–
––
––
––
––
––
– 4
50.1
6 –
–
201
6-17
–
––
––
––
––
––
– (4
50.1
6)–
–
201
5-16
(5
47.3
5)–
–
Gur
ha T
herm
al P
ower
Co
mpa
ny L
imite
d 2
017-
18
––
––
120
.26
––
––
––
– 1
,070
.53
––
201
6-17
–
––
– (9
8.39
)–
(102
.52)
––
––
– (9
62.3
0)–
–
201
5-16
(7
71.2
3)–
(261
.00)
MVV
Wat
er U
tility
Pr
ivat
e Li
mite
d 2
017-
18
––
––
2.5
7 3
1.15
5
4.65
–
––
––
372
.60
––
201
6-17
(8
51.2
1)–
––
(2.5
7) (7
.41)
––
––
––
(370
.42)
––
201
5-16
–
(488
.20)
(551
.00)
Aura
ngab
ad C
ity
Wat
er U
tility
Com
pany
Li
mite
d
201
7-18
–
––
––
––
––
––
– 2
27.4
0 –
–
201
6-17
–
––
––
––
––
––
– (2
27.4
0)–
–
201
5-16
(2
27.4
0)–
–
Hyd
ro C
omp
Ente
rpris
es (I
ndia
) Li
mite
d
201
7-18
–
––
––
– 0
.31
––
––
– 1
31.8
0 –
–
201
6-17
–
––
––
––
––
––
– (1
31.4
8)–
–
201
5-16
(1
31.4
8)–
–
JOIN
T O
PERA
TIO
NS
OM
Met
als
Cons
ortiu
m
JV 2
017-
18
––
––
––
––
––
––
918
.46
––
201
6-17
–
––
––
––
––
––
– (9
18.4
6)–
–
201
5-16
(9
18.4
6)–
–
Sidd
ahar
th-
Mah
avee
r SP
ML
–JV
201
7-18
–
––
––
––
3.8
8 –
––
– 8
8.27
–
201
6-17
–
––
––
(10.
00)
––
––
––
(92.
15)
– (2
,127
.22)
201
5-16
(1
02.1
5)–
(2,1
27.2
2)
SPM
L-CI
SC J
V 2
017-
18
––
––
––
– 1
6.69
–
––
– 3
.37
––
201
6-17
–
––
––
––
––
––
– (2
0.06
)–
–
201
5-16
(2
0.06
)–
–
Cons
olid
ated
Fin
anci
al S
tate
men
t as
at a
nd fo
r the
yea
r end
ed 3
1st M
arch
, 201
8
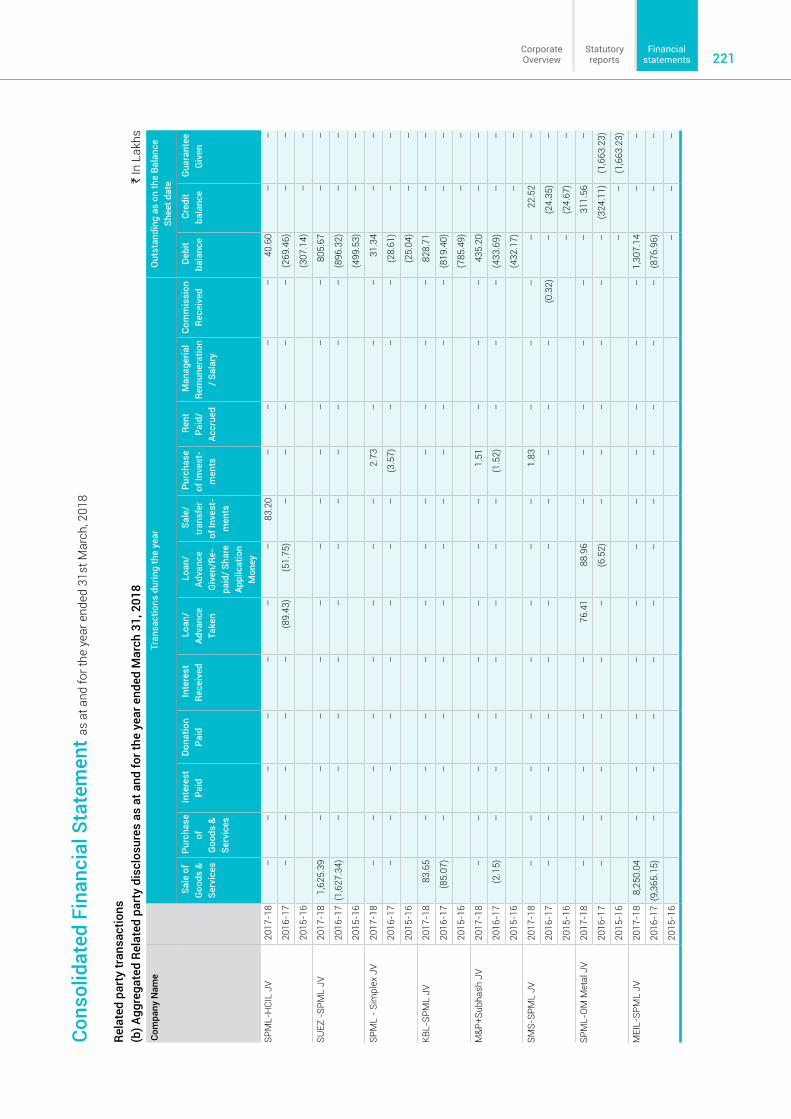
221Statutoryreports
Corporate Overview
Financial statements
Rela
ted
part
y tr
ansa
ctio
ns(b
) Agg
rega
ted
Rela
ted
part
y di
sclo
sure
s as
at a
nd fo
r the
yea
r end
ed M
arch
31,
201
8 `
In L
akhs
Co
mpa
ny N
ame
Tran
sact
ions
dur
ing
the
year
Out
stan
ding
as
on th
e Ba
lanc
e Sh
eet d
ate
Sal
e of
G
oods
&
Serv
ices
Pur
chas
e of
G
oods
&
Serv
ices
Inte
rest
Pa
idD
onat
ion
Paid
Inte
rest
Re
ceiv
ed
Loa
n/Ad
vanc
e Ta
ken
Loa
n/Ad
vanc
e G
iven
/Re-
paid
/ Sha
re
Appl
icat
ion
Mon
ey
Sal
e/tr
ansf
er
of In
vest
-m
ents
Pur
chas
e of
Inve
st-
men
ts
Ren
t Pa
id/
Accr
ued
Man
ager
ial
Rem
uner
atio
n / S
alar
y
Com
mis
sion
Re
ceiv
ed D
ebit
bala
nce
Cre
dit
bala
nce
Gua
rant
ee
Giv
en
SPM
L-H
CIL
JV 2
017-
18
––
––
––
– 8
3.20
–
––
– 4
0.60
–
–
201
6-17
–
––
––
(89.
43)
(51.
75)
––
––
– (2
69.4
6)–
–
201
5-16
(3
07.1
4)–
–
SUEZ
-SP
ML
JV 2
017-
18
1,6
25.3
9 –
––
––
––
––
––
805
.67
––
201
6-17
(1,
627.
34)
––
––
––
––
––
– (8
96.3
2)–
–
201
5-16
(4
99.5
3)–
–
SPM
L -
Sim
plex
JV
201
7-18
–
––
––
––
– 2
.73
––
– 3
1.34
–
–
201
6-17
–
––
––
––
– (3
.57)
––
– (2
8.61
)–
–
201
5-16
(2
5.04
)–
–
KBL-
SPM
L JV
201
7-18
8
3.65
–
––
––
––
––
––
828
.71
––
201
6-17
(8
5.07
)–
––
––
––
––
––
(819
.40)
––
201
5-16
(7
85.4
9)–
–
M&P
+Sub
hash
JV
201
7-18
–
––
––
––
– 1
.51
––
– 4
35.2
0 –
–
201
6-17
(2
.15)
––
––
––
– (1
.52)
––
– (4
33.6
9)–
–
201
5-16
(4
32.1
7)–
–
SMS-
SPM
L JV
201
7-18
–
––
––
––
– 1
.83
––
––
22.
52
–
201
6-17
–
––
––
––
––
––
(0.3
2)–
(24.
35)
–
201
5-16
–
(24.
67)
–
SPM
L-O
M M
etal
JV
201
7-18
–
––
––
76.
41
88.
96
––
––
––
311
.56
–
201
6-17
–
––
––
– (6
.52)
––
––
––
(324
.11)
(1,6
63.2
3)
201
5-16
–
– (1
,663
.23)
MEI
L-SP
ML
JV 2
017-
18
8,2
50.0
4 –
––
––
––
––
––
1,3
07.1
4 –
–
201
6-17
(9,
365.
15)
––
––
––
––
––
– (8
76.9
6)–
–
201
5-16
–
––
Cons
olid
ated
Fin
anci
al S
tate
men
t as
at a
nd fo
r the
yea
r end
ed 3
1st M
arch
, 201
8

SPML Infra Limited Annual Report 2017-18222
Rela
ted
part
y tr
ansa
ctio
ns(b
) Agg
rega
ted
Rela
ted
part
y di
sclo
sure
s as
at a
nd fo
r the
yea
r end
ed M
arch
31,
201
8 `
In L
akhs
Co
mpa
ny N
ame
Tran
sact
ions
dur
ing
the
year
Out
stan
ding
as
on th
e Ba
lanc
e Sh
eet d
ate
Sal
e of
G
oods
&
Serv
ices
Pur
chas
e of
G
oods
&
Serv
ices
Inte
rest
Pa
idD
onat
ion
Paid
Inte
rest
Re
ceiv
ed
Loa
n/Ad
vanc
e Ta
ken
Loa
n/Ad
vanc
e G
iven
/Re-
paid
/ Sha
re
Appl
icat
ion
Mon
ey
Sal
e/tr
ansf
er
of In
vest
-m
ents
Pur
chas
e of
Inve
st-
men
ts
Ren
t Pa
id/
Accr
ued
Man
ager
ial
Rem
uner
atio
n / S
alar
y
Com
mis
sion
Re
ceiv
ed D
ebit
bala
nce
Cre
dit
bala
nce
Gua
rant
ee
Giv
en
SPM
L -
SMC
Infr
astr
uctu
re 2
017-
18
––
––
––
––
––
––
60.
00
––
201
6-17
–
––
––
(104
.89)
––
––
––
(60.
00)
––
201
5-16
(1
82.2
2)–
–
SPM
L-SE
W-A
MR
Join
t Ve
ntur
e 2
017-
18
––
––
––
––
––
– 7
9.42
–
––
201
6-17
–
––
––
––
––
––
(72.
95)
––
–
201
5-16
(1
7.64
)–
–
KEY
MAN
AGEM
ENT
PERS
ON
NEL
(KM
P)
Mr.
Subh
ash
Chan
d Se
thi
201
7-18
–
––
––
19.
50
158
.33
––
– 1
13.1
4 –
– 2
02.6
7 –
201
6-17
–
––
––
(114
.42)
(138
.30)
––
– (7
7.04
)–
– (3
46.1
5)–
201
5-16
–
(246
.50)
–
Mr.
Sush
il Ku
mar
Set
hi 2
017-
18
––
12.
50
––
– 0
.40
––
– 1
19.1
4 –
– 1
10.8
5 –
201
6-17
–
– (1
5.31
)–
– (5
8.00
) (9
4.85
)–
––
(78.
24)
––
(100
.00)
–
201
5-16
–
(123
.07)
–
Mr.
Rish
abh
Seth
i 2
017-
18
––
––
––
––
––
––
––
–
201
6-17
–
– (7
.93)
––
(29.
00)
(138
.50)
––
– (1
7.90
)–
––
–
201
5-16
–
––
––
––
––
––
––
(102
.37)
–
Mr.
Sujit
Kum
ar
Jhun
jhun
wal
a 2
017-
18
––
––
––
––
––
22.
73
––
––
201
6-17
–
––
––
––
––
––
––
––
201
5-16
–
––
––
––
––
––
––
––
Mr.
Lalit
Kum
ar K
heta
n 2
017-
18
––
––
––
––
––
––
––
–
201
6-17
–
––
––
––
––
– (2
5.34
)–
––
–
201
5-16
–
––
––
––
––
––
––
––
Mr.
Abha
y Ra
j Sin
gh 2
017-
18
––
––
––
––
––
24.
15
––
––
201
6-17
–
––
––
––
––
– (2
4.15
)–
––
–
201
5-16
–
––
––
––
––
––
––
––
Cons
olid
ated
Fin
anci
al S
tate
men
t as
at a
nd fo
r the
yea
r end
ed 3
1st M
arch
, 201
8

223Statutoryreports
Corporate Overview
Financial statements
Rela
ted
part
y tr
ansa
ctio
ns(b
) Agg
rega
ted
Rela
ted
part
y di
sclo
sure
s as
at a
nd fo
r the
yea
r end
ed M
arch
31,
201
8 `
In L
akhs
Co
mpa
ny N
ame
Tran
sact
ions
dur
ing
the
year
Out
stan
ding
as
on th
e Ba
lanc
e Sh
eet d
ate
Sal
e of
G
oods
&
Serv
ices
Pur
chas
e of
G
oods
&
Serv
ices
Inte
rest
Pa
idD
onat
ion
Paid
Inte
rest
Re
ceiv
ed
Loa
n/Ad
vanc
e Ta
ken
Loa
n/Ad
vanc
e G
iven
/Re-
paid
/ Sha
re
Appl
icat
ion
Mon
ey
Sal
e/tr
ansf
er
of In
vest
-m
ents
Pur
chas
e of
Inve
st-
men
ts
Ren
t Pa
id/
Accr
ued
Man
ager
ial
Rem
uner
atio
n / S
alar
y
Com
mis
sion
Re
ceiv
ed D
ebit
bala
nce
Cre
dit
bala
nce
Gua
rant
ee
Giv
en
Mr.
Kish
ore
Kum
ar
Thak
ur 2
017-
18
––
––
––
––
––
––
––
–
201
6-17
–
––
––
––
––
– (4
8.35
)–
– (2
.05)
–
201
5-16
–
––
Mr.
Pukh
raj J
ain
201
7-18
–
––
––
––
––
––
––
––
201
6-17
–
––
––
––
––
– (8
.97)
––
––
201
5-16
–
––
Mr.
Srin
ivas
a Su
ndar
ajal
yeng
ar
Kalla
halli
201
7-18
–
––
––
– 2
.83
––
– 1
2.84
–
– 1
.07
–
201
6-17
–
––
––
––
––
– (1
2.84
)–
– (1
.07)
–
201
5-16
–
–
Mr.
Prith
vi G
urur
ajar
a 2
017-
18
––
––
––
2.3
2 –
––
14.
64
––
1.2
7 –
201
6-17
–
––
––
––
––
– (1
4.36
)–
– (1
.20)
–
201
5-16
–
––
Mr.
Will
iam
Dso
uza
201
7-18
–
––
––
– 3
.84
––
– 1
9.83
–
– 1
.65
–
201
6-17
–
––
––
––
––
– (1
9.83
)–
– (1
.65)
–
201
5-16
–
––
RELA
TIVE
S O
F KE
Y M
ANAG
EMEN
T PE
RSO
NN
EL
Mr.
Anil
Kum
ar S
ethi
201
7-18
–
– 8
.64
––
12.
00
12.
00
––
– 6
3.00
–
– 4
8.00
–
201
6-17
–
– (8
.64)
––
––
––
– (8
4.00
)–
– (7
0.70
)–
201
5-16
–
––
Mr.
Har
shav
ardh
an
Seth
i 2
017-
18
––
––
––
6.0
0 –
––
––
6.0
0 –
–
201
6-17
–
––
––
––
––
––
––
(9.2
5)–
201
5-16
–
––
Mrs
. Shi
lpa
Seth
i 2
017-
18
––
––
––
––
––
12.
06
––
0.8
6 –
201
6-17
–
––
––
––
––
– (1
2.06
)–
– (0
.86)
–
201
5-16
–
(0.8
6)–
Cons
olid
ated
Fin
anci
al S
tate
men
t as
at a
nd fo
r the
yea
r end
ed 3
1st M
arch
, 201
8

SPML Infra Limited Annual Report 2017-18224
Rela
ted
part
y tr
ansa
ctio
ns(b
) Agg
rega
ted
Rela
ted
part
y di
sclo
sure
s as
at a
nd fo
r the
yea
r end
ed M
arch
31,
201
8 `
In L
akhs
Co
mpa
ny N
ame
Tran
sact
ions
dur
ing
the
year
Out
stan
ding
as
on th
e Ba
lanc
e Sh
eet d
ate
Sal
e of
G
oods
&
Serv
ices
Pur
chas
e of
G
oods
&
Serv
ices
Inte
rest
Pa
idD
onat
ion
Paid
Inte
rest
Re
ceiv
ed
Loa
n/Ad
vanc
e Ta
ken
Loa
n/Ad
vanc
e G
iven
/Re-
paid
/ Sha
re
Appl
icat
ion
Mon
ey
Sal
e/tr
ansf
er
of In
vest
-m
ents
Pur
chas
e of
Inve
st-
men
ts
Ren
t Pa
id/
Accr
ued
Man
ager
ial
Rem
uner
atio
n / S
alar
y
Com
mis
sion
Re
ceiv
ed D
ebit
bala
nce
Cre
dit
bala
nce
Gua
rant
ee
Giv
en
Mrs
. Vin
eeta
Set
hi 2
017-
18
––
21.
78
––
15.
50
––
––
––
– 1
36.5
0 –
201
6-17
–
– (2
6.40
)–
– (1
00.0
0)–
– (0
.26)
––
––
(121
.00)
–
201
5-16
–
––
Mrs
. Pre
eti D
evi S
ethi
201
7-18
–
– 3
.78
––
––
––
14.
16
––
– 4
1.63
–
201
6-17
–
– (3
.78)
––
––
––
(13.
80)
––
– (3
3.40
)–
201
5-16
–
(9.4
1)–
Mr.
Abhi
nand
an S
ethi
201
7-18
–
––
––
8.0
7 8
.07
––
––
––
––
201
6-17
–
––
––
(5.2
1) (5
.21)
––
– (2
5.40
)–
––
–
201
5-16
–
––
Mr.
Dee
pak
Seth
i 2
017-
18
––
––
––
––
––
––
––
–
201
6-17
–
––
––
––
––
– (8
0.10
)–
– (5
.36)
–
201
5-16
–
(2.1
0)–
Mrs
. San
dhya
Sr
iniv
asa
201
7-18
–
––
––
––
––
– 7
.99
––
0.6
7 –
201
6-17
–
––
––
––
––
– (7
.99)
––
(0.6
7)–
201
5-16
–
––
Mrs
. Anu
radh
a Pr
ithvi
201
7-18
–
––
––
––
––
– 6
.71
––
0.5
6 –
201
6-17
–
––
––
––
––
– (6
.71)
––
(0.5
6)–
201
5-16
–
––
ENTE
RPRI
SES
OW
NED
O
R SI
GN
IFIC
ANTL
Y IN
FLU
ENCE
D B
Y KM
P O
R TH
EIR
RELA
TIVE
S
Add
Eco
Envi
ornm
ent
Priv
ate
Lim
ited
201
7-18
–
– 1
.35
––
––
––
––
––
6.9
2 –
201
6-17
–
– (6
.90)
––
(1,0
08.0
0) (1
,008
.51)
––
––
––
(5.7
1)–
201
5-16
–
––
ADD
Indu
stria
l Par
k (T
N) L
imite
d 2
017-
18
––
––
– 0
.20
0.2
2 –
229
.00
––
– 2
29.0
0 –
–
201
6-17
–
––
––
––
––
––
– (1
70.7
8)–
–
201
5-16
(1
70.7
8)–
–
Cons
olid
ated
Fin
anci
al S
tate
men
t as
at a
nd fo
r the
yea
r end
ed 3
1st M
arch
, 201
8
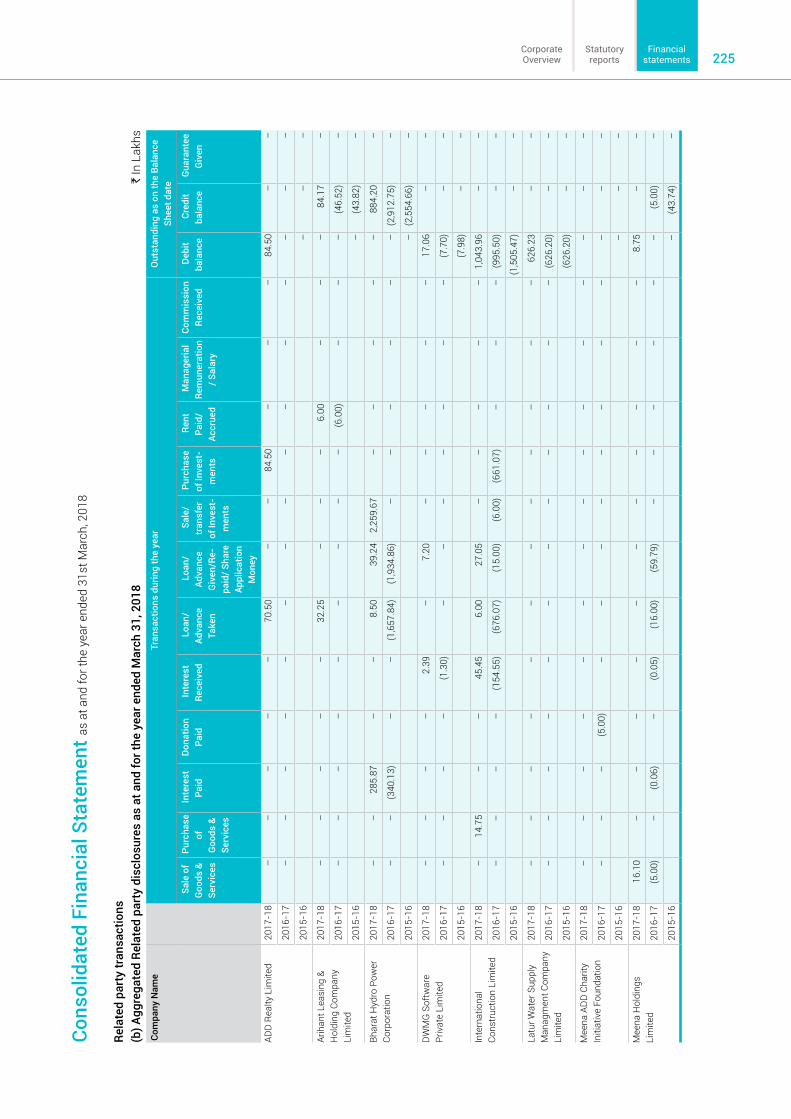
225Statutoryreports
Corporate Overview
Financial statements
Rela
ted
part
y tr
ansa
ctio
ns(b
) Agg
rega
ted
Rela
ted
part
y di
sclo
sure
s as
at a
nd fo
r the
yea
r end
ed M
arch
31,
201
8 `
In L
akhs
Co
mpa
ny N
ame
Tran
sact
ions
dur
ing
the
year
Out
stan
ding
as
on th
e Ba
lanc
e Sh
eet d
ate
Sal
e of
G
oods
&
Serv
ices
Pur
chas
e of
G
oods
&
Serv
ices
Inte
rest
Pa
idD
onat
ion
Paid
Inte
rest
Re
ceiv
ed
Loa
n/Ad
vanc
e Ta
ken
Loa
n/Ad
vanc
e G
iven
/Re-
paid
/ Sha
re
Appl
icat
ion
Mon
ey
Sal
e/tr
ansf
er
of In
vest
-m
ents
Pur
chas
e of
Inve
st-
men
ts
Ren
t Pa
id/
Accr
ued
Man
ager
ial
Rem
uner
atio
n / S
alar
y
Com
mis
sion
Re
ceiv
ed D
ebit
bala
nce
Cre
dit
bala
nce
Gua
rant
ee
Giv
en
ADD
Rea
lty L
imite
d 2
017-
18
––
––
– 7
0.50
–
– 8
4.50
–
––
84.
50
––
201
6-17
–
––
––
––
––
––
––
––
201
5-16
–
––
Arih
ant L
easi
ng &
H
oldi
ng C
ompa
ny
Lim
ited
201
7-18
–
––
––
32.
25
––
– 6
.00
––
– 8
4.17
–
201
6-17
–
––
––
––
––
(6.0
0)–
––
(46.
52)
–
201
5-16
–
(43.
82)
–
Bhar
at H
ydro
Pow
er
Corp
orat
ion
201
7-18
–
– 2
85.8
7 –
– 8
.50
39.
24
2,2
59.6
7 –
––
––
884
.20
–
201
6-17
–
– (3
40.1
3)–
– (1
,657
.84)
(1,9
34.8
6)–
––
––
– (2
,912
.75)
–
201
5-16
–
(2,5
54.6
6)–
DW
MG
Sof
twar
e Pr
ivat
e Li
mite
d 2
017-
18
––
––
2.3
9 –
7.2
0 –
––
––
17.
06
––
201
6-17
–
––
– (1
.30)
––
––
––
– (7
.70)
––
201
5-16
(7
.98)
––
Inte
rnat
iona
l Co
nstr
uctio
n Li
mite
d 2
017-
18
– 1
4.75
–
– 4
5.45
6
.00
27.
05
––
––
– 1
,043
.96
––
201
6-17
–
––
– (1
54.5
5) (6
76.0
7) (1
5.00
) (6
.00)
(661
.07)
––
– (9
95.5
0)–
–
201
5-16
(1
,505
.47)
––
Latu
r Wat
er S
uppl
y M
anag
men
t Com
pany
Li
mite
d
201
7-18
–
––
––
––
––
––
– 6
26.2
3 –
–
201
6-17
–
––
––
––
––
––
– (6
26.2
0)–
–
201
5-16
(6
26.2
0)–
–
Mee
na A
DD
Cha
rity
Initi
ativ
e Fo
unda
tion
201
7-18
–
––
––
––
––
––
––
––
201
6-17
–
––
(5.0
0)–
––
––
––
––
––
201
5-16
–
––
Mee
na H
oldi
ngs
Lim
ited
201
7-18
1
6.10
–
––
––
––
––
––
8.7
5 –
–
201
6-17
(5
.00)
– (0
.06)
– (0
.05)
(16.
00)
(59.
79)
––
––
––
(5.0
0)–
201
5-16
–
(43.
74)
–
Cons
olid
ated
Fin
anci
al S
tate
men
t as
at a
nd fo
r the
yea
r end
ed 3
1st M
arch
, 201
8

SPML Infra Limited Annual Report 2017-18226
Rela
ted
part
y tr
ansa
ctio
ns(b
) Agg
rega
ted
Rela
ted
part
y di
sclo
sure
s as
at a
nd fo
r the
yea
r end
ed M
arch
31,
201
8 `
In L
akhs
Co
mpa
ny N
ame
Tran
sact
ions
dur
ing
the
year
Out
stan
ding
as
on th
e Ba
lanc
e Sh
eet d
ate
Sal
e of
G
oods
&
Serv
ices
Pur
chas
e of
G
oods
&
Serv
ices
Inte
rest
Pa
idD
onat
ion
Paid
Inte
rest
Re
ceiv
ed
Loa
n/Ad
vanc
e Ta
ken
Loa
n/Ad
vanc
e G
iven
/Re-
paid
/ Sha
re
Appl
icat
ion
Mon
ey
Sal
e/tr
ansf
er
of In
vest
-m
ents
Pur
chas
e of
Inve
st-
men
ts
Ren
t Pa
id/
Accr
ued
Man
ager
ial
Rem
uner
atio
n / S
alar
y
Com
mis
sion
Re
ceiv
ed D
ebit
bala
nce
Cre
dit
bala
nce
Gua
rant
ee
Giv
en
Nira
l Ent
erpr
ises
Pr
ivat
e Li
mite
d 2
017-
18
––
136
.63
––
– 2
3.70
–
––
––
– 1
,192
.50
–
201
6-17
–
– (1
03.6
3)–
– (9
99.9
7)–
––
––
––
(1,0
93.2
3)–
201
5-16
–
––
Om
Met
al-S
PML
Infr
a Pr
ojec
t Priv
ate
Lim
ited
201
7-18
–
––
––
––
––
––
––
––
201
6-17
–
––
––
(165
.54)
––
––
––
––
–
201
5-16
(1
65.5
4)–
–
Peac
ock
Pear
l Bu
sine
ss S
olut
ion
Priv
ate
Lim
ited
201
7-18
–
––
––
– 0
.02
––
––
– 0
.13
––
201
6-17
–
––
––
– (0
.03)
––
––
– (0
.11)
––
201
5-16
(0
.08)
––
Chah
el In
fras
truc
ture
Li
mite
d (fo
rmer
ly
: Pon
dich
erry
Por
t Li
mite
d)
201
7-18
–
––
––
– 2
.24
––
––
– 5
77.0
8 –
–
201
6-17
–
––
––
– (6
5.00
)–
––
––
(574
.84)
––
201
5-16
(5
09.8
4)–
–
Pond
iche
rry
Sez
Com
pany
Priv
ate
Lim
ited
201
7-18
–
– 9
5.22
–
––
36.
50
––
––
––
772
.77
–
201
6-17
–
– (8
5.94
)–
––
(42.
75)
––
––
––
(723
.57)
–
201
5-16
–
(688
.97)
–
POM
PO
M R
ecyc
ling
Priv
ate
Lim
ited
201
7-18
0
.51
––
––
––
––
––
– 1
63.7
2 –
–
201
6-17
(1
63.2
1)–
––
––
––
––
––
(163
.21)
––
201
5-16
–
––
Rish
abh
Hom
es
Priv
ate
Lim
ited
(fore
mer
ly a
s Ri
sabh
Fi
re M
anag
emen
t Pr
ivat
e Li
mite
d)
201
7-18
–
––
––
––
––
––
––
––
201
6-17
–
––
––
(5.0
0) (5
.00)
––
––
––
––
201
5-16
–
––
Sanm
ati C
orpo
rate
In
vest
men
ts P
rivat
e Li
mite
d
201
7-18
–
––
––
– –
–
––
––
––
–
201
6-17
–
––
––
(0.0
3)–
––
––
––
––
201
5-16
(0
.07)
––
Cons
olid
ated
Fin
anci
al S
tate
men
t as
at a
nd fo
r the
yea
r end
ed 3
1st M
arch
, 201
8

227Statutoryreports
Corporate Overview
Financial statements
Rela
ted
part
y tr
ansa
ctio
ns(b
) Agg
rega
ted
Rela
ted
part
y di
sclo
sure
s as
at a
nd fo
r the
yea
r end
ed M
arch
31,
201
8 `
In L
akhs
Co
mpa
ny N
ame
Tran
sact
ions
dur
ing
the
year
Out
stan
ding
as
on th
e Ba
lanc
e Sh
eet d
ate
Sal
e of
G
oods
&
Serv
ices
Pur
chas
e of
G
oods
&
Serv
ices
Inte
rest
Pa
idD
onat
ion
Paid
Inte
rest
Re
ceiv
ed
Loa
n/Ad
vanc
e Ta
ken
Loa
n/Ad
vanc
e G
iven
/Re-
paid
/ Sha
re
Appl
icat
ion
Mon
ey
Sal
e/tr
ansf
er
of In
vest
-m
ents
Pur
chas
e of
Inve
st-
men
ts
Ren
t Pa
id/
Accr
ued
Man
ager
ial
Rem
uner
atio
n / S
alar
y
Com
mis
sion
Re
ceiv
ed D
ebit
bala
nce
Cre
dit
bala
nce
Gua
rant
ee
Giv
en
Sanm
ati P
ower
Co
mpa
ny P
rivat
e Li
mite
d
201
7-18
–
––
––
––
––
––
– 2
51.2
5 –
–
201
6-17
–
––
––
––
––
––
– (2
51.2
5)–
–
201
5-16
(2
51.2
5)–
–
Seth
i Inf
rate
ch P
rivat
e Li
mte
d 2
017-
18
––
0.0
1 –
––
0.0
4 –
––
––
– 0
.06
–
201
6-17
–
– (0
.01)
––
––
––
––
––
(0.0
9)–
201
5-16
–
(0.0
8)–
Vidy
aEdu
tech
Priv
ate
Lim
ited
201
7-18
–
––
––
––
––
––
– 2
.68
––
201
6-17
–
––
– (0
.27)
––
––
––
––
(2.3
6)–
201
5-16
–
(2.3
7)–
SPM
Eng
inee
rs
Lim
ited
201
7-18
–
– 8
9.22
–
––
12.
00
996
.80
––
––
– 3
2.77
–
201
6-17
–
– (1
11.5
8)–
– (1
,198
.53)
(308
.85)
––
––
––
(1,0
88.4
7)–
201
5-16
–
(18.
31)
–
SPM
L In
dia
Lim
ited
201
7-18
–
– 9
3.08
–
– 1
80.0
0 1
00.0
0 –
––
––
– 8
93.2
2 –
201
6-17
–
– (6
1.66
)–
– (6
98.0
0) (8
2.35
)–
––
––
– (7
29.4
5)–
201
5-16
–
(58.
31)
–
SPM
L In
dust
ries
Lim
ited
201
7-18
–
– 1
41.1
3 –
– 5
93.0
0 3
2.55
–
104
.00
––
––
1,3
80.3
9 –
201
6-17
–
– (1
03.3
4)–
– (3
4.19
) (3
25.2
1)–
– (3
4.97
)–
––
(820
.89)
–
201
5-16
–
(1,0
00.5
2)–
Subh
ash
Syst
ems
Priv
ate
Lim
ited
201
7-18
–
––
––
––
––
15.
63
––
– 7
.89
–
201
6-17
–
––
––
(34.
19)
(51.
35)
––
(17.
49)
––
(3.3
9)–
–
201
5-16
–
(8.2
1)–
Zoom
Indu
stria
l Se
rvic
es L
imite
d 2
017-
18
––
172
.11
––
– 2
6.61
–
––
––
– 1
,506
.28
–
201
6-17
–
– (1
63.9
1)–
––
(212
.19)
––
––
––
(1,3
78.0
0)–
201
5-16
–
(1,4
42.6
7)–
Tech
no m
echn
ical
se
rvic
es P
rivat
e Li
mite
d
201
7-18
–
––
––
––
––
––
––
––
201
6-17
–
(677
.97)
––
––
––
––
––
– (3
69.8
8)–
201
5-16
(0
.01)
––
Cons
olid
ated
Fin
anci
al S
tate
men
t as
at a
nd fo
r the
yea
r end
ed 3
1st M
arch
, 201
8

SPML Infra Limited Annual Report 2017-18228
Rela
ted
part
y tr
ansa
ctio
ns(b
) Agg
rega
ted
Rela
ted
part
y di
sclo
sure
s as
at a
nd fo
r the
yea
r end
ed M
arch
31,
201
8 `
In L
akhs
Co
mpa
ny N
ame
Tran
sact
ions
dur
ing
the
year
Out
stan
ding
as
on th
e Ba
lanc
e Sh
eet d
ate
Sal
e of
G
oods
&
Serv
ices
Pur
chas
e of
G
oods
&
Serv
ices
Inte
rest
Pa
idD
onat
ion
Paid
Inte
rest
Re
ceiv
ed
Loa
n/Ad
vanc
e Ta
ken
Loa
n/Ad
vanc
e G
iven
/Re-
paid
/ Sha
re
Appl
icat
ion
Mon
ey
Sal
e/tr
ansf
er
of In
vest
-m
ents
Pur
chas
e of
Inve
st-
men
ts
Ren
t Pa
id/
Accr
ued
Man
ager
ial
Rem
uner
atio
n / S
alar
y
Com
mis
sion
Re
ceiv
ed D
ebit
bala
nce
Cre
dit
bala
nce
Gua
rant
ee
Giv
en
20th
Cen
tury
En
gine
erin
g Li
mite
d 2
017-
18
––
0.0
0 –
––
––
––
––
– 0
.02
–
201
6-17
–
– (0
.01)
––
– (0
.16)
––
––
––
(0.0
2)–
201
5-16
–
(0.1
6)–
Emco
Ove
rsea
s Pt
e.
Lim
ited
201
7-18
–
––
––
––
––
––
––
––
201
6-17
–
––
––
––
––
––
– (5
05.7
5)–
–
201
5-16
(9
59.8
4)–
–
Not
e:
C.
Det
ails
of r
emun
erat
ion
to K
ey M
anag
eria
l Per
sonn
el is
giv
en b
elow
` In
Lak
hs
Part
icul
ars
201
7-18
2
016-
17
Shor
t-te
rm e
mpl
oyee
ben
efits
407
.36
528
.00
Post
em
ploy
men
t ben
efits
8.8
7 1
5.28
4
16.2
3 5
43.2
8 * U
nsec
ured
Loa
ns ta
ken
from
Bha
rat H
ydro
Pow
er C
ompa
ny L
imite
d an
d SP
M E
ngin
eers
Lim
ited
in e
arlie
r yea
rs h
ave
been
se
ttled
dur
ing
the
year
201
7-18
thro
ugh
sale
of i
nves
tmen
ts in
equ
ity s
hare
s he
ld b
y th
e Co
mpa
ny in
gro
up c
ompa
nies
.
Term
s an
d co
nditi
ons
of tr
ansa
ctio
ns w
ith re
late
d pa
rtie
s:
The
tran
sact
ions
with
rel
ated
par
ties
are
mad
e on
ter
ms
equi
vale
nt t
o th
ose
that
pre
vail
in a
rm’s
leng
th t
rans
actio
ns.
Out
stan
ding
bal
ance
s at
the
year
-end
are
uns
ecur
ed a
nd s
ettle
men
t occ
urs
in c
ash
exce
pt a
s ot
herw
ise
men
tione
d.
Cons
olid
ated
Fin
anci
al S
tate
men
t as
at a
nd fo
r the
yea
r end
ed 3
1st M
arch
, 201
8

229Statutoryreports
Corporate Overview
Financial statements
NOTE 40.1: CATEGORIzATION OF FINANCIAL INSTRUMENTS ` In Lakhs
Carrying value/ Fair valueParticulars As at
March 31, 2018As at
March 31, 2017As at
April 1, 2016(i) Financial Assets a) Measured at FVTPL - Investments in Equity Instruments 1,927.03 4,307.45 3,363.87 b) Measured at Amortised Cost*
- Investments in Joint Ventures and Associates 13,297.39 15,057.64 15,204.30 - Loans 8,175.60 6,982.96 7,104.63 - Trade Receivables 1,17,378.47 96,733.51 98,550.66 - Other Financial Assets 7,248.45 5,528.26 6,593.28 - Cash and Cash Equivalents 2,480.62 4,294.43 4,594.84 - Other Bank Balances 10,050.94 11,294.00 8,872.07
(ii) Financial Liabilities a) Measured at Amortised Cost*
- Borrowings (Secured and Unsecured) 1,31,101.08 1,15,946.36 88,523.26 - Trade Payables 1,01,881.12 98,246.28 1,18,628.29 - Other Financial Liabilities 38,974.66 31,086.82 26,911.51
*Carrying Value of assets / liabilities carried at amortized cost are reasonable approximation of its fair values.
The Group has disclosed financial instruments such as cash and cash equivalents, other bank balances, trade receivables and trade payables at carrying value because their carrying amounts are a reasonable approximation of the fair values due to their short term nature.
NOTE 40.2: FAIR VALUE HIERARCHYThe table shown below analyses financial instruments carried at fair value. The different levels have been defined below:-
Level 1: Quoted Prices (unadjusted) in active markets for identical assets or liabilities
Level 2: Inputs other than quoted prices included within Level 1 that are observable for the asset or liability, either directly (i.e., as prices) or indirectly (i.e., derived from prices)
Level 3: Inputs for the asset or liability that are not based on observable market data (unobservable inputs)
a) Financial assets and liabilities measured at fair value at 31 March 2018 ` In Lakhs Particulars Level 1 Level 2 Level 3 Total Financial Assets Investment at FVTPL Investment in Equity Instruments – – 1,927.03 1,927.03
Financial assets and liabilities measured at fair value at 31 March 2017 ` In Lakhs Particulars Level 1 Level 2 Level 3 Total Financial AssetsInvestment at FVTPL Investment in Equity Instruments – – 4,307.45 4,307.45
Financial assets and liabilities measured at fair value at 1 April 2016 ` In Lakhs Particulars Level 1 Level 2 Level 3 Total Financial AssetsInvestment at FVTPL Investment in Equity Instruments – – 3,363.87 3,363.87
Consolidated Financial Statement as at and for the year ended 31st March, 2018

SPML Infra Limited Annual Report 2017-18230
(b) Financial instruments at amortised cost The carrying amount of financial assets and financial liabilities measured at amortised cost in the financial statements are
a reasonable approximation of their fair values since the Group does not anticipate that the carrying amounts would be significantly different from the values that would eventually be received or settled.
(c) During the year there has been no transfer from one level to another
(d) Description of Significant Unobservable inputs to Valuation:Particulars Valuation
technique Significant
unobservable inputs Sensitivity to the input of the fair value
Unquoted Equity Shares
Discounted Cash Flow approach
Discount rate 1% decrease in the discount rate will result in PL gain of INR 51.74 lakhs and 1% increase will have an equal but opposite effect.
NOTE 41: FINANCIAL RISK MANAGEMENT OBjECTIVES AND POLICIESThe Group’s principal financial liabilities, other than derivatives, comprise loans and borrowings, trade and other payables, and financial guarantee contracts. The main purpose of these financial liabilities is to finance the Group’s operations and to provide guarantees to support its operations. The Group’s principal financial assets include loans, trade and other receivables, and cash and cash equivalents that derive directly from its operations. The Group also holds FVTOCI investments and enters into derivative transactions.
The Group is exposed to market risk, credit risk and liquidity risk. The Group’s senior management oversees the management of these risks. The Group’s senior management is supported by a financial risk committee that advises on financial risks and the appropriate financial risk governance framework for the Group. The financial risk committee provides assurance to the Group’s senior management that the Group’s financial risk activities are governed by appropriate policies and procedures and that financial risks are identified, measured and managed in accordance with the Group’s policies and risk objectives. All derivative activities for risk management purposes are carried out by specialist teams that have the appropriate skills, experience and supervision. It is the Group’s policy that no trading in derivatives for speculative purposes may be undertaken.
The Board of Directors reviews and agrees policies for managing each of these risks, which are summarised below.
A. Credit Risk Credit risk is the risk that a counterparty fails to discharge its obligation to the Group.
The Group’s exposure to credit risk is influenced mainly by cash and cash equivalents, trade receivables and financial assets measured at amortised cost.
The group continuously monitors defaults of customers and other counterparties and incorporates this information into its credit risk controls. Credit risk related to cash and cash equivalents and bank deposits is managed by only accepting highly rated banks and diversifying bank deposits. Other financial assets measured at amortised cost includes security deposits, Loans given and others. Credit risk related to these other financial assets is managed by monitoring the recoverability of such amounts continuously, while at the same time internal control system in place ensure the amounts are within defined limits.
a) Credit Risk Management 1. Credit Risk Rating The Group assesses and manages credit risk of financial assets based on following categories arrived on the basis
of assumptions, inputs and factors specific to the class of financial assets.
A. Low Credit Risk
B. Moderate Credit risk
C. High credit risk
Consolidated Financial Statement as at and for the year ended 31st March, 2018

231Statutoryreports
Corporate Overview
Financial statements
Consolidated Financial Statement as at and for the year ended 31st March, 2018
The Group provides for the Expected Credit Loss based on the following: Asset Group Description Provision for Expected Credit Loss*Low Credit Risk Cash and cash equivalents, other bank balances, investments,
loans, trade receivables and other financial assets12 month expected credit loss/life time expected credit loss
Moderate Credit Risk
Trade receivables, loans and other financial assets 12 month expected credit loss/life time expected credit loss
High Credit Risk Trade receivables, loans and other financial assets Life time expected credit loss
*Based on business environment in which the Group operates, a default on a financial asset is considered when the counterparty fails to make payments within the agreed time period as per contract. Loss rates reflecting defaults are based on actual credit loss experience and considering differences between current and historical economic conditions
Assets are written off when there is no reasonable expectation of recovery, such as a debtor declaring bankruptcy or a litigation decided against the Group. The Group continues to engage with parties whose balances are written off and attempts to enforce repayment. Recoveries made are recognized in statement of profit and loss.
March 31, 2018 ` In LakhsParticulars Estimated Gross
Carrying amount at default
Expected Credit Loss
Carrying amount net of Impairment
ProvisionInvestments 13,297.39 – 13,297.39 Trade Receivables 1,32,380.78 15,002.31 1,17,378.47 Loans 8,175.60 – 8,175.60 Cash and cash Equivalents 2,480.62 – 2,480.62 Other Bank Balances 10,050.94 – 10,050.94 Other Financial Assets 7,248.45 – 7,248.45
March 31, 2017 ` In LakhsParticulars Estimated Gross
Carrying amount at default
Expected Credit Loss
Carrying amount net of Impairment
ProvisionInvestments 15,057.64 – 15,057.64 Trade Receivables 1,10,712.65 13,979.13 96,733.51 Loans 6,982.96 – 6,982.96 Cash and cash Equivalents 4,294.43 – 4,294.43 Other Bank Balances 11,294.00 – 11,294.00 Other Financial Assets 5,528.26 – 5,528.26
` In Lakhs Credit Rating Particulars March 31, 2018 March 31, 2017 April 1, 2016Low Credit Risk Cash and cash equivalents, other bank
balances, investments, loans and other financial assets
33,077.40 36,174.33 35,264.49
High Credit Risk Loans and Trade Receivables 1,25,554.07 1,03,716.47 1,05,655.29
b) Credit Risk Exposure Provision for Expected Credit Loss The Group provides for expected credit loss based on 12 month and lifetime expected credit loss basis for following
financial assets:

SPML Infra Limited Annual Report 2017-18232
B. Liquidity Risk Liquidity risk is the risk that the Group will encounter difficulty in meeting the obligations associated with its financial liabilities
that are settled by delivering cash or another financial asset. The Group’s approach to managing liquidity is to ensure as far as possible, that it will have sufficient liquidity to meet its liabilities when they are due.
Management monitors rolling forecasts of the Group’s liquidity position and cash and cash equivalents on the basis of expected cash flows. The Group takes into account the liquidity of the market in which the entity operates.
Maturities of Financial Liabilities The table below analyse the Group’s Financial Liabilities into relevant maturity groupings based on their contractual
maturities
April 1, 2016 ` In LakhsParticulars Estimated Gross
Carrying amount at default
Expected Credit Loss
Carrying amount net of Impairment
ProvisionInvestments 15,204.30 – 15,204.30 Trade Receivables 1,09,672.39 11,121.73 98,550.66 Loans 7,104.63 – 7,104.63 Cash and cash Equivalents 4,594.84 – 4,594.84 Other Bank Balances 8,872.07 – 8,872.07 Other Financial Assets 6,593.28 – 6,593.28
The Company’s allowance for Expected Credit Loss on Trade Receivables is created using Provision Matrix Approach.
` In LakhsReconciliation of Loss Allowance Trade ReceivablesAs on April 1, 2016 11,121.73 Allowance for Expected Credit Loss 2,857.40 As on March 31, 2017 13,979.13 Allowance for Expected Credit Loss 1,023.18 As on March 31, 2018 15,002.31
March 31, 2018 ` In Lakhs Particulars Less than 1
year1-5 years More than
5 yearsTotal
Borrowings 57,621.51 17,324.15 56,155.42 1,31,101.08 Trade Payable 96,356.08 4,420.03 1,105.01 1,01,881.12 Other Financial Liabilities 33,822.19 4,592.91 559.56 38,974.66
March 31, 2017 ` In Lakhs Particulars Less than 1
year1-5 years More than
5 yearsTotal
Borrowings 87,133.06 22,841.16 5,972.14 1,15,946.36 Trade Payable 90,289.26 6,365.61 1,591.41 98,246.28 Other Financial Liabilities 23,118.86 7,117.38 850.58 31,086.82
April 1, 2016 ` In Lakhs Particulars Less than 1
year1-5 years More than
5 yearsTotal
Borrowings 62,545.42 15,816.42 10,161.42 88,523.26 Trade Payable 1,10,738.91 5,493.37 2,396.01 1,18,628.29 Other Financial Liabilities 18,822.60 6,752.13 1,336.78 26,911.51
Consolidated Financial Statement as at and for the year ended 31st March, 2018

233Statutoryreports
Corporate Overview
Financial statements
Consolidated Financial Statement as at and for the year ended 31st March, 2018
C. Market Risk a. Interest Rate Risk The Group has taken debt to finance its working capital, which exposes it to interest rate risk. Borrowings issued at
variable rates expose the Group to interest rate risk.
Interest rate sensitivity Profit or loss and equity is sensitive to higher/lower interest expense from borrowings as a result of changes in interest
rates.
b. Price Risk The Group’s exposure to price risk arises from investments held and classified as FVTPL. To manage the price risk
arising from investments, the Group diversifies its portfolio of assets.
Interest Rate Risk Exposure ` In Lakhs Particulars March 31, 2018 March 31, 2017 April 1, 2016Variable Rate Borrowing 1,04,476.48 88,390.93 63,703.35 Fixed Rate Borrowing 26,624.60 27,555.43 24,819.91
` In Lakhs Particulars March 31, 2018 March 31, 2017Interest Sensitivity*Interest Rates increase by 100 basis points (1,230.89) (1,145.19)Interest Rates decrease by 100 basis points 1,230.89 1,145.19
*Holding all other variables constant
Sensitivity Analysis ` In Lakhs Particulars March 31, 2018 March 31, 2017Price Sensitivity*Price increase by 5%- FVTPL 22.56 15.75 Price decrease by 5%- FVTPL (22.56) (15.75)
*Holding all other variables constant
NOTE 42: CAPITAL MANAGEMENTFor the purpose of the Group’s capital management, capital includes issued equity capital, convertible preference shares, securities premium and all other equity reserves attributable to the equity holders of the parent. The primary objective of the Group’s capital management is to maximise the shareholder value.
The Group’s objectives when managing capital is to safeguard continuity, maintain a strong credit rating and healthy capital ratios in order to support its business and provide adequate return to shareholders through continuing growth and maximise the shareholders value. The Group’s overall strategy remains unchanged from previous year.The Group sets the amount of capital required on the basis of annual business and long-term operating plans which include capital and other strategic investments. The funding requirements are met through a mixture of equity, internal fund generation and borrowed funds. The Group’s policy is to use short term and long term borrowings to meet anticipated funding requirements. The Group monitors capital on the basis of the net debt to equity ratio. The Group is not subject to any externally imposed capital requirements. Net debt are long term and short term debts as reduced by cash and cash equivalents (including restricted cash and cash equivalents). Equity comprises share capital and free reserves (total reserves excluding OCI). The following table summarizes the capital of the Group: ` In Lakhs Particulars As at
March 31, 2018As at
March 31, 2017As at
April 1, 2016Borrowings 1,40,569.78 1,23,588.17 93,541.20 Trade payables 1,01,881.12 98,246.28 1,18,628.29 Less: cash and cash equivalents 2,480.62 4,294.43 4,594.84 Net debt 2,39,970.28 2,17,540.02 2,07,574.65 Total capital 46,492.16 38,041.14 40,646.00 Capital and net debt 2,86,462.44 2,55,581.16 2,48,220.65 Gearing ratio 84% 85% 84%

SPML Infra Limited Annual Report 2017-18234
NOTE 43: RECONCILIATION OF FAIR VALUE OF INVESTMENT PROPERTY ` In Lakhs
Particulars As at March 31, 2018
As at March 31, 2017
As atApril 1, 2016
Fair value of opening balance of investment property 860.04 – –Fair value adjsutement on opening balance of investment property 23.89 – –Fair value of transfer in / out – – –Fair value of closing balance of investment property 883.93 – –
NOTE 44: GROUP INFORMATION
Particulars Country of incorporation and operation
As at March 31, 2018
As at March 31, 2017
As atApril 1, 2016
SUBSIDIARIES (%) (%) (%)ADD Energy Management Company Private Limited India 44.72 64.49 64.49 Add Technologies (India) Limited India 45.70 45.70 87.48 Allahabad Waste Processing Company Limited India 95.02 95.01 95.01 Awa Power Company Private Limited India 28.91 70.76 83.65 Bhagalpur Electricity Distribution Company Private Limited
India 99.99 99.99 100.00
Binwa Power Company Private Limited India 50.79 61.59 85.38 Delhi Waste Management Limited India 52.03 52.03 56.03 Doon Valley Waste Management Private Limited India 61.45 61.46 61.46 IQU Power Company Private Limited India 28.89 54.95 63.92 Luni Power Company Private Limited India 57.67 85.26 85.35 Madurai Municipal Waste Processing Company Private Limited
India 92.33 92.33 92.33
Mathura Nagar Waste Processing Limited India 90.25 90.25 90.25 Mizoram Infrastructure Development Company Limited
India 68.99 68.99 69.00
Neogal Power Company Private Limited India 26.34 70.16 83.88 PT Sanmati Natural Resources Indonesia 44.27 63.85 63.85 Rupin Tons Power Company Private Limited India 45.05 69.13 69.13 SJA DEVELOPERS PRIVATE LIMITED India 43.46 43.14 45.37 SPM Holdings Pte. Limited Singapore 44.72 64.49 64.49 SPML Energy Limited India 58.07 87.48 87.48 SPML Infra Developers Limited India 100.00 100.00 100.00 SPML InfraProjects Limited* India – 100.00 100.00 SPML Infrastructure Limited India 99.99 99.99 99.99 SPML Utilities Limited India 100.00 100.00 100.00 Subhash Kabini Power Corporation Limited India 44.72 64.49 64.49 Subhash Urja Private Limited India 100.00 100.00 100.00 Synergy Promoters Private Limited* India – 43.30 45.81 Tons Valley Power Company Private Limited India 54.38 83.46 83.46 Uttarkashi Tons Hydro Power Private Limited India 47.21 72.46 72.46 Jamshedpur Waste Processing Company Private Limited#
India – 99.66 99.66
Add Urban Enviro Limited# India – 99.99 99.99
Consolidated Financial Statement as at and for the year ended 31st March, 2018

235Statutoryreports
Corporate Overview
Financial statements
Consolidated Financial Statement as at and for the year ended 31st March, 2018
Particulars Country of incorporation and operation
As at March 31, 2018
As at March 31, 2017
As atApril 1, 2016
ASSOCIATEAurangabad jal construction Private Limited India 26.00 26.00 26.00 Aurangabad jal Supply Solution Private Limited India 26.00 26.00 26.00 Bhilwara Jaipur Toll Road Private Limited India 51.00 51.00 51.00 Mizoram Mineral Development Corporation Limited** India – – 48.67 PT Bina Insan Sukses Mandiri Indonesia 20.00 29.14 29.14 PT Vardhaman Logistics Indonesia 12.09 17.73 17.73 PT Vardhaman Mining Services Indonesia 20.09 29.44 29.44 Rabaan (S) Pte Limited Singapore 20.09 29.44 29.44 Sanmati Infra Developers Private Limited India 25.00 25.00 25.00 SPML Bhiwandi Water Supply Infra Limited India 44.94 44.94 44.94 SPML Bhiwandi Water Supply Management Limited India 50.00 50.00 50.00 JOINT VENTUREAurangabad City Water Utility Company Limited India 40.01 40.01 38.81 Gurha Thermal Power Company Private Limited India 50.00 50.00 50.00 Hydro Comp Enterprises India Private Limited India 50.00 50.00 50.00 Malviya Nagar Water Services Private Limited India 26.00 26.00 26.00 MVV Water Utility Private Limited India 47.99 47.99 47.99 JOINT OPERATIONM & P Subhash JV India 40.00 40.00 40.00 Om Metal Consortium India 5.00 5.00 5.00 SIDDHARTH+MAHAVIR+SPML (J.V.) India 10.00 10.00 10.00 SPML - CISC India 50.00 50.00 50.00 SPML - HCIL India 33.00 33.00 33.00 SPML - Om Metal (JV) Ujjain India 50.00 50.00 50.00 SPML - Simplex India 50.00 50.00 50.00 Suez Environnement - SPML JV India 48.00 48.00 48.00
* ceased to be a subsidiary in 2017-18
** Company striked off in 2016-17
#Two companies Add Urban Enviro Limited and Jamshedpur Waste Processing Company Private Limited merged with SPML Infra Limited w.e.f 1st April, 2016 wide court order dated 31st Jan, 2018
Four subsidiary companies namely Tons Valley Power Company Private Limited, Rupin Tons Power Company Private Limited, Uttarkashi Tons Hydro Power Private Limited and SPML Infraprojects Limited have applied for striking off their names from the Register of Companies under the Companies Act, 2013. Considering the concept of materiality and the aforsesaid development that arose subsequent to 31.03.2018, the figures of these subsidiary companies have not been considered for the purpose of Disclosure under Related Parties.
Note 45. Sundry balances/liabilities written back aggregating ̀ 1,385.06 lakhs (`163.51 lakhs) consisting of numerous balances being unclaimed / unmoved since long (mostly more than three years) have been written back during the year as the management believes that these amounts are no longer payable.
Note 46. Clients of the Ultimate Holding Company have foreclosed the certain contracts which are under arbitration / litigation proceedings. The management, based on the fact of the case is confident to recover the trade receivables of `3,402.74 lakhs as on 31st march 2018 (`11,198.02 lakhs as on 31st March 2017 and `4,829.10 lakhs as on 1st April 2016). Pursuant to adoption

SPML Infra Limited Annual Report 2017-18236
of IND AS following the expected credit loss model, `7,795.28 lakhs have been provided out of the gross debtors of `11,198.02 lakhs which are under arbitration/dispute and were a subject matter of the auditors’ qualification as at March 31, 2017.
Note 47. The auditors of two subsidiaries of the group have drawn attention that the said subsidaries had suo-moto foreclosed their running projects due to the breach of concession agreement by the client on account of non-payment of the dues to the companies. the management has filed the petition for arbitration in above mentioned subsidiaries and, based on the legal opinion obtained, is confident of recovery of the receivables and gross book value of fixed assets of `1,068.90 lakhs and `637.91 lakhs respectively. Accordingly, no adjustments have been considered necessary in these financials results.
Note 48. The auditors of a subsidiary company has drawn attention on the fact that the net worth of the Company has fully eroded and has incurred a net cash loss during the current and previous years and the Company has current liabilities exceeding its current assets as at the balance sheet date. However, the financial statements of the Company has been prepared on a going concern basis because the immediate holding Company of the subsidiary Company has undertaken to provide continuing financial support to meet their liabilities.
Note 49. The Ultimate Holding Company has Trade and Other Receivables amounting `25,460.41 lakhs as on March 31, 2018 (`23,358.81 lakhs as on March 31, 2017, `15,997.75 lakhs as on April 1, 2016) and has recognized interest of `1,471.20 lakhs (`6,603.68 lakhs as on March 31, 2017; `796.68 lakhs as on April 1, 2016) during the year arising out of arbitration awards pronounced in favour of the Company. Against these awards, the customers have preferred appeals in the jurisdictional courts and the legal proceedings are going on. Pending the outcome of the said legal proceedings, the above amounts are being carried forward as receivable as the management believes that the final outcome of the appeals would be in favor of the Company based on the facts of the respective cases and is confident to recover the aforesaid claims in full.
Note 50. The Ultimate Holding Company has made no provision for interest on account of Yield to Maturity amounting to `1842.68 lakhs has been made on Optionally Convertible Debentures (OCDs) issued to lenders under SPML S4A Scheme, as the management believes that the same is not payable until maturity of such OCD.
Note 51. Trade receivables aggregating `8,216.06 lakhs (31st March, 2017 `9,842.77 lakhs; 1st April, 2016: `2,135.12 lakhs) are under arbitration proceedings. The management is confident that based on the facts of the respective cases; there is no uncertainty as regards their realization.
Note 52. In accordance with the provisions of Section 135 of the Companies Act 2013, the Ultimate Holding Company was to spend a sum of `28.10 lakhs towards the CSR activities during the year ended March 31, 2018. During the year, the Company has spent Nil for the aforesaid activities.
Note 53. Previous periods’s figures have been regrouped/rearranged wherever considered necessary to confirm to the figures presented in the current year. Certain balances of Trade Receivables, Loans, Unsecured Borrowings and Trade Payables are subject to confirmations and subequent reconciliations.
Note 54: FIRST TIME ADOPTION OF IND ASThese consolidated financial statements, for the year ended 31st March 2018, are the first the Group has prepared in accordance with Ind AS. For periods up to and including the year ended 31st March 2017, the Group had prepared its financial statements in accordance with accounting standards notified under section 133 of the Companies Act 2013, read together with paragraph 7 of the Companies (Accounts) Rules, 2014 (Previous GAAP).
Accordingly, the Group has prepared consolidated financial statements which comply with Ind AS applicable for period ending on 31st March 2018, together with the comparative period data as at and for the year ended 31 March 2017, as described in the summary of significant accounting policies. In preparing these financial statements, the Group’s opening balance sheet was prepared as at 1st April 2016, the Group’s date of transition to Ind AS. The reconciliation of Total Equity as at 31st March 2017 and 1st April 2016 and Net Profit after Tax for the year ended 31st March 2017 between previous GAAP and Ind AS is as under:
Consolidated Financial Statement as at and for the year ended 31st March, 2018
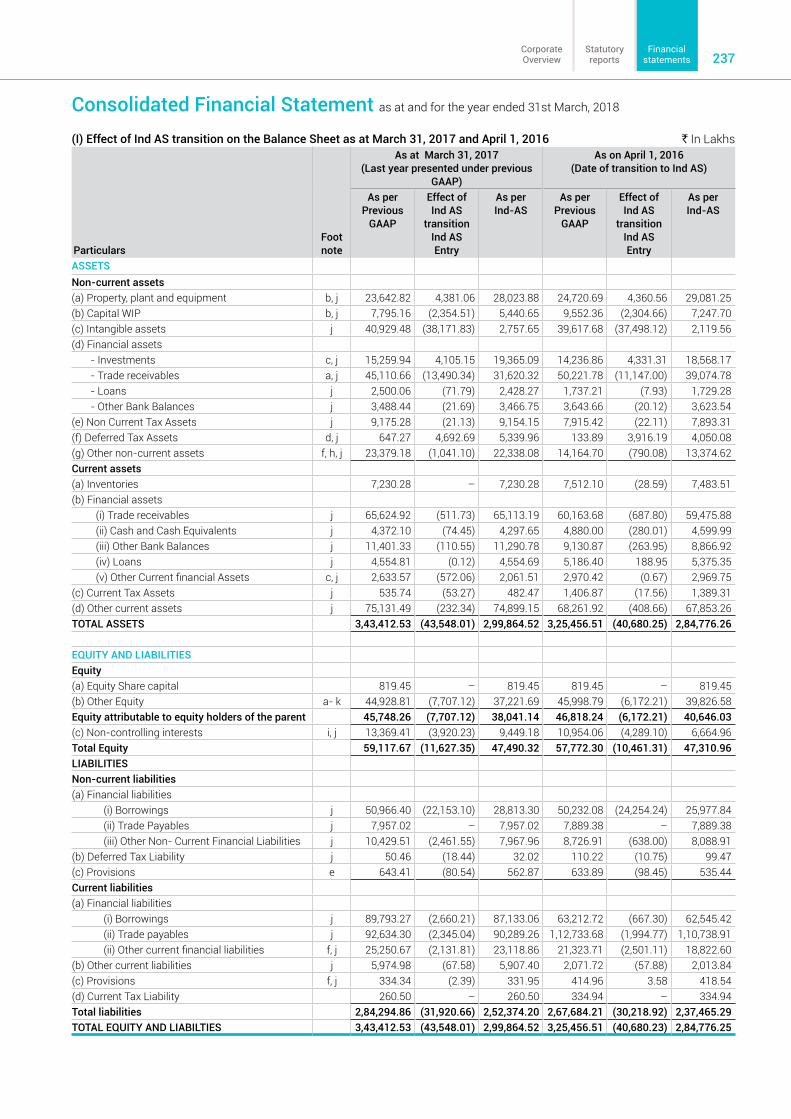
237Statutoryreports
Corporate Overview
Financial statements
Consolidated Financial Statement as at and for the year ended 31st March, 2018
(I) Effect of Ind AS transition on the Balance Sheet as at March 31, 2017 and April 1, 2016 ` In Lakhs
ParticularsFoot note
As at March 31, 2017(Last year presented under previous
GAAP)
As on April 1, 2016 (Date of transition to Ind AS)
As perPrevious
GAAP
Effect of Ind AS
transition Ind AS Entry
As perInd-AS
As perPrevious
GAAP
Effect of Ind AS
transition Ind AS Entry
As perInd-AS
ASSETSNon-current assets(a) Property, plant and equipment b, j 23,642.82 4,381.06 28,023.88 24,720.69 4,360.56 29,081.25 (b) Capital WIP b, j 7,795.16 (2,354.51) 5,440.65 9,552.36 (2,304.66) 7,247.70 (c) Intangible assets j 40,929.48 (38,171.83) 2,757.65 39,617.68 (37,498.12) 2,119.56 (d) Financial assets
- Investments c, j 15,259.94 4,105.15 19,365.09 14,236.86 4,331.31 18,568.17 - Trade receivables a, j 45,110.66 (13,490.34) 31,620.32 50,221.78 (11,147.00) 39,074.78 - Loans j 2,500.06 (71.79) 2,428.27 1,737.21 (7.93) 1,729.28 - Other Bank Balances j 3,488.44 (21.69) 3,466.75 3,643.66 (20.12) 3,623.54
(e) Non Current Tax Assets j 9,175.28 (21.13) 9,154.15 7,915.42 (22.11) 7,893.31 (f) Deferred Tax Assets d, j 647.27 4,692.69 5,339.96 133.89 3,916.19 4,050.08 (g) Other non-current assets f, h, j 23,379.18 (1,041.10) 22,338.08 14,164.70 (790.08) 13,374.62 Current assets(a) Inventories 7,230.28 – 7,230.28 7,512.10 (28.59) 7,483.51 (b) Financial assets
(i) Trade receivables j 65,624.92 (511.73) 65,113.19 60,163.68 (687.80) 59,475.88 (ii) Cash and Cash Equivalents j 4,372.10 (74.45) 4,297.65 4,880.00 (280.01) 4,599.99 (iii) Other Bank Balances j 11,401.33 (110.55) 11,290.78 9,130.87 (263.95) 8,866.92 (iv) Loans j 4,554.81 (0.12) 4,554.69 5,186.40 188.95 5,375.35 (v) Other Current financial Assets c, j 2,633.57 (572.06) 2,061.51 2,970.42 (0.67) 2,969.75
(c) Current Tax Assets j 535.74 (53.27) 482.47 1,406.87 (17.56) 1,389.31 (d) Other current assets j 75,131.49 (232.34) 74,899.15 68,261.92 (408.66) 67,853.26 TOTAL ASSETS 3,43,412.53 (43,548.01) 2,99,864.52 3,25,456.51 (40,680.25) 2,84,776.26
EQUITY AND LIABILITIESEquity(a) Equity Share capital 819.45 – 819.45 819.45 – 819.45 (b) Other Equity a- k 44,928.81 (7,707.12) 37,221.69 45,998.79 (6,172.21) 39,826.58 Equity attributable to equity holders of the parent 45,748.26 (7,707.12) 38,041.14 46,818.24 (6,172.21) 40,646.03 (c) Non-controlling interests i, j 13,369.41 (3,920.23) 9,449.18 10,954.06 (4,289.10) 6,664.96 Total Equity 59,117.67 (11,627.35) 47,490.32 57,772.30 (10,461.31) 47,310.96 LIABILITIESNon-current liabilities(a) Financial liabilities
(i) Borrowings j 50,966.40 (22,153.10) 28,813.30 50,232.08 (24,254.24) 25,977.84 (ii) Trade Payables j 7,957.02 – 7,957.02 7,889.38 – 7,889.38 (iii) Other Non- Current Financial Liabilities j 10,429.51 (2,461.55) 7,967.96 8,726.91 (638.00) 8,088.91
(b) Deferred Tax Liability j 50.46 (18.44) 32.02 110.22 (10.75) 99.47 (c) Provisions e 643.41 (80.54) 562.87 633.89 (98.45) 535.44 Current liabilities(a) Financial liabilities
(i) Borrowings j 89,793.27 (2,660.21) 87,133.06 63,212.72 (667.30) 62,545.42 (ii) Trade payables j 92,634.30 (2,345.04) 90,289.26 1,12,733.68 (1,994.77) 1,10,738.91 (ii) Other current financial liabilities f, j 25,250.67 (2,131.81) 23,118.86 21,323.71 (2,501.11) 18,822.60
(b) Other current liabilities j 5,974.98 (67.58) 5,907.40 2,071.72 (57.88) 2,013.84 (c) Provisions f, j 334.34 (2.39) 331.95 414.96 3.58 418.54 (d) Current Tax Liability 260.50 – 260.50 334.94 – 334.94 Total liabilities 2,84,294.86 (31,920.66) 2,52,374.20 2,67,684.21 (30,218.92) 2,37,465.29 TOTAL EQUITY AND LIABILTIES 3,43,412.53 (43,548.01) 2,99,864.52 3,25,456.51 (40,680.23) 2,84,776.25

SPML Infra Limited Annual Report 2017-18238
(II) Effect of Ind AS transition on the Statement of Profit and Loss for the year ended March 31, 2017 ` In Lakhs Particulars Footnote
ReferenceAs per Previous
GAAPEffect of Ind AS
transitionAs per Ind AS
IncomeRevenue from Operations j 2,21,961.49 5,619.92 2,27,581.41 Other Income a,c, j 18,268.06 (8,506.89) 9,761.17 Total Income 2,40,229.55 (2,886.97) 2,37,342.58 ExpensesMaterials consumed and direct expenses j 90,553.79 (612.40) 89,941.39 Cost of traded goods j 95,608.70 (1.00) 95,607.70 Decrease in inventories j 61.03 (28.59) 32.44 Employee Benefit Expense g, j 8,514.96 (104.20) 8,410.76 Depreciation and amortisation expense b, j 2,576.38 (462.63) 2,113.75 Finance Cost f, j 29,030.65 (2,995.14) 26,035.51 Other Expenses a, j 13,917.49 2,510.66 16,428.15 Total Expenses 2,40,263.00 (1,693.30) 2,38,569.70 Profit/ before share of (profit) / loss of associate and joint venture, exceptional items and tax
(33.45) (1,193.67) (1,227.13)
Share of profit / (loss) from investment in associate and joint venture
j 906.23 (755.14) 151.09
Adjustment for Non-controlling interests i, j 2.08 423.78 425.86 Profit/(loss) before tax 870.70 (2,372.58) (1,501.89)Tax Expenses
Current tax 561.05 – 561.05 Tax for earlier years 21.53 – 21.53 Minimum Alternate Tax credit 10.33 – 10.33 Deferred tax credit (net) d (456.64) (784.19) (1,240.83)
Income Tax Expense 136.27 (784.19) (647.92)Profit for the year 734.43 (1,588.39) (853.97)Other Comprehensive Income (OCI)Other comprehensive income not to be reclassified to profit or loss in subsequent periods:Translation difference on Foreign operation k – (59.10) (59.10)Income Tax effect – – –Other comprehensive income to be reclassified to profit or loss in subsequent periods:Re-Measurement gains on defined benefit plans e – 54.53 54.53 Income Tax effect – – –Other Comprehensive Income for the year – (4.58) (4.58)Total Comprehensive Income for the year 734.43 (1,592.98) (858.55)
Consolidated Financial Statement as at and for the year ended 31st March, 2018

239Statutoryreports
Corporate Overview
Financial statements
Consolidated Financial Statement as at and for the year ended 31st March, 2018
(III) Effect of Ind AS transition on the Other Equity as at March 31, 2017 and April 1, 2016 ` In Lakhs Particulars Footnote
ReferenceAs at
March 31, 2017As at
April 1, 2016Total Equity as per IGAAP 45,748.26 46,818.24
Ind AS AdjustmentsImpairment loss on Trade Receivables a (13,460.35) (11,121.73)Fair valuation gain on Property, Plant and Equipment b 2,785.27 2,733.16 Prior Period expenses f (198.03) (17.78)Fair valuation Gain on Investments c (560.49) (517.41)Impact of Deferred Tax d 4,695.58 3,918.65 Impairment of Capital Advance h (805.95) (757.70)Minority Interest i 262.53 –Impact of Actuarial Valuation e 78.24 94.52 Impact of Control Assessment j (503.92) (503.92)
Total Ind AS Adjustments (7,707.12) (6,172.21)Total Equity as per Ind AS 38,041.14 40,646.00
Footnotes to Reconciliationa Impairment Loss as per Expected Credit loss The Group has recognised impairment loss as per Expected Credit Loss on Trade Receivables and Loans as per Ind AS
109. As a result, the loss allowance on Trade Receivables as at March 31, 2017 increased by `13,460.35 lakhs (April 1, 2016:`11,121.73 lakhs). Consequently, the total Equity as at March 31, 2017 decreased by `13,460.35 lakhs (April 1, 2016: `11,121.73 lakhs) and profit for the year ended March 31, 2017 reduced by `2,338.62 lakhs (net of Interest unwinding)
b. Fair valuation of Property, Plant and Equipment The Group has fair valued its Investment in Land, which was carried at cost under Previous GAAP. The resulting fair value
changes have been recognised in Retained Earnings as at the date of transition. This has increased the retained earnings by `7,375.50 lakhs (1st April, 2016: `7,375.50 lakhs).
Also, the Group has impaired its Property Plant and Equipment where the carrying value is more than its recoverable value. This has resulted in decrease in the retained earnings by `4,590.23 lakhs as on March 31, 2017 (April 1, 2016: `4,642.34 lakhs). As a result, Profit for the year ended March 31, 2017 has increased by `52.11 lakhs due to reversal of depreciation on impaired Property, Plant and Equipment.
c. Fair valuation of Investments In the financial statements under the previous GAAP, investments of the Company were classified as long-term investments
or current investments based on the intended holding period and realisability. Long-term investments were carried at cost less provision for other than temporary diminution in carrying amount of such investments. Current investments were carried at lower of cost and fair value. Under Ind AS, the Company has recognised such investments as follows:
Investments in Joint Ventures and Associates: At cost
Investments in equity instruments: At FVTPL
The resulting fair value changes of these investments have been recognised in retained earnings as at the date of transition and subsequently in the profit or loss for the year ended March 31, 2017. This has decreased the retained earnings by `560.49 lakhs as at 31st March, 2017 (April 1, 2016: `517.41 lakhs). Consequently, the Profit for the year ended March 31, 2017 has decreased by `43.08 lakhs.
d. Deferred Tax In the financial statements prepared under previous GAAP, deferred tax was accounted as per the income statement
approach which required creation of deferred tax asset/liability on timing differences between taxable profit and accounting profit. Under Ind AS, deferred tax is accounted as per the balance sheet approach which requires creation of deferred tax

SPML Infra Limited Annual Report 2017-18240
asset/liability on temporary differences between the carrying amount of an asset/liability in the balance sheet and its corresponding tax base.
The above changes have resulted in creation of deferred tax assets (net) amounting to `4,695.58 lakhs as at 31st March, 2017 (April 1, 2016: ̀ 3,918.65 lakhs). For the year ended 31st March, 2017, it has resulted in decrease in deferred tax expense by `776.93 lakhs in the statement of profit and loss for the year ended 31st March, 2017.
e. Remeasurement of Post- employment Benefit obligation In the financial statements prepared under previous GAAP, remeasurement benefit of defined plans, arising primarily due to
change in actuarial assumptions was recognised as employee benefits expense in the statement of profit and loss. Under Ind AS, such remeasurement benefits relating to defined benefit plans is recognised in other comprehensive income as per the requirements of Ind AS 19 - Employee Benefits.
As a result of this change, the profit for the year ended 31st March, 2017 decreased by ̀ 70.81 lakhs and other comprehensive income has increased by `54.53 lakhs. Subsequently, there has been an increase in total Equity as on March 31, 2017 by `78.24 lakhs (April 1, 2016: `94.52 lakhs)
f. Prior Period items Under Ind AS 8, Prior Period expenses needs to be accounted in the year to which the same pertains. This has resulted in
decrease of `198.03 lakhs in Other Equity as on March 31, 2017. (April 1, 2016: `17.78 lakhs). Consequently, the Profit for the year ended March 31, 2017 has also decreased by `180.25 lakhs.
g. Reclassification of Exchange difference The Company has opted to reset the balance appearing in the foreign currency translation reserve to zero as at 1st April,
2015. Accordingly, cumulative translation differences for all foreign operations translation reserve balance under previous GAAP of `13,590 lakhs has been transferred to retained earnings at its date of transition to Ind AS. However, there is no impact on total equity as a result of this adjustment. Subsequent exchange differences arising on translation of foreign operations amounting to `3,384 lakhs for the year ended 31st March, 2016 has been recognised in other comprehensive income.
h. Impairment of Capital Advance The Group has impaired the Capital Advances given where it does not expect the same to be recovered. This has resulted
in a decrease of `805.95 lakhs as on March 31, 2017 (April 1, 2016: `757.70 lakhs). Consequently, there has been a further decrease in Profit for the year ended March 31, 2017 by `48.25 lakhs.
i. Non- Controlling Interest Impact of Ind AS Adjustments for Partly owned Subsidiaries has been attributed to Non Controlling Interest. This has resulted
in increase in total Equity as on March 31, 2017 by `262.53 lakhs.
j. Impact of Control Assessment Under Ind AS, Subsidiaries, Joint Arrangements and Associates have been evaluated by the Company based on the existence
of Control. As a result, there has been a decrease in total Equity of ̀ 503.92 lakhs as on March 31, 2017 (April 1, 2016: ̀ 503.92 lakhs). There has been no impact in the Profit and loss for the year ended March 31, 2017.
k. Foreign Currency Translation Reserve The Company has opted to reset the balance appearing in the foreign currency translation reserve to zero as at 1st April,
2016. Accordingly, cumulative translation differences for foreign operations translation reserve balance under previous GAAP has been transferred to retained earnings at its date of transition to Ind AS. However, there is no impact on total equity as a result of this adjustment. Subsequent exchange loss arising on translation of foreign operations amounting to `59.10 lakhs for the year ended 31st March, 2017 has been recognised in other comprehensive income.
NOTE 55. STANDARDS ISSUED BUT NOT YET EFFECTIVEMinistry of Corporate Affairs (“MCA”) through Companies (Indian Accounting Standards) Amendment Rules, 2018 has notified the following new and amendments to Ind AS’s which the Company has not applied as they are effective for annual periods beginning on or after April 1, 2018:
Ind AS 115 – Revenue from Contracts with CustomersThe Company is currently evaluating the impact of implementation of Ind AS 115 “Revenue from Contracts with Customers” which is applicable to it w.e.f 01.04.2018. However, based on the evaluation done so far and based on the arrangement that
Consolidated Financial Statement as at and for the year ended 31st March, 2018

241Statutoryreports
Corporate Overview
Financial statements
Consolidated Financial Statement as at and for the year ended 31st March, 2018
the Company has with its customers for sale of its services, the implementation of Ind AS 115 will not have any significant recognition and measurement impact. However, there will be additional presentation and disclosure requirement, which will be provided in the next year’s financial statements.
Ind AS 21 – The Effect of Changes in Foreign Exchange RatesThe amendment clarifies on the accounting of transactions that include the receipt or payment of advance consideration in a foreign currency. The appendix explains that the date of the transaction, for the purpose of determining the exchange rate, is the date of initial recognition of the non-monetary prepayment asset or deferred income liability. If there are multiple payments or receipts in advance, a date of transaction is established for each payment or receipt. The Company is evaluating the impact of this amendment on its financial statements.
Ind AS 12 - Income TaxesThe amendments clarify that an entity needs to consider whether tax law restricts the sources of taxable profits against which it may make deductions on the reversal of that deductible temporary difference. Furthermore, the amendments provide guidance on how an entity should determine future taxable profits and explain the circumstances in which taxable profit may include the recovery of some assets for more than their carrying amount. Entities are required to apply the amendments retrospectively. However, on initial application of the amendments, the change in the opening equity of the earliest comparative period may be recognised in opening retained earnings (or in another component of equity, as appropriate), without allocating the change between opening retained earnings and other components of equity. Entities applying this relief must disclose that fact. These amendments are effective for annual periods beginning on or after 1 April 2018. These amendments are not expected to have any impact on the Company as the Company has no deductible temporary differences or assets that are in the scope of the amendments.
Ind AS 28 - Investments in Associates and Joint venturesClarification that measuring investees at fair value through profit or loss is an investment-by investment choice :
i) An entity that is a venture capital organisation, or other qualifying entity, may elect, at initial recognition on an investment-by-investment basis, to measure its investments in associates and joint ventures at fair value through profit or loss.
ii) If an entity, that is not itself an investment entity, has an interest in an associate or joint venture that is an investment entity, the entity may, when applying the equity method, elect to retain the fair value measurement applied by that investment entity associate or joint venture to the investment entity associate’s or joint venture’s interests in subsidiaries. This election is made separately for each investment entity associate or joint venture, at the later of the date on which:
(a) the investment entity associate or joint venture is initially recognised;
(b) the associate or joint venture becomes an investment entity; and
(c) the investment entity associate or joint venture first becomes a parent.
Transfers of Investment Property — Amendments to Ind AS 40The amendments clarify when an entity should transfer property, including property under construction or development into, or out of investment property. The amendments state that a change in use occurs when the property meets, or ceases to meet, the definition of investment property and there is evidence of the change in use. A mere change in management’s intentions for the use of a property does not provide evidence of a change in use.
Entities should apply the amendments prospectively to changes in use that occur on or after the beginning of the annual reporting period in which the entity first applies the amendments. An entity should reassess the classification of property held at that date and, if applicable, reclassify property to reflect the conditions that exist at that date. Retrospective application in accordance with Ind AS 8 is only permitted if it is possible without the use of hindsight.
The amendments are effective for annual periods beginning on or after 1 April 2018.
Amendments to Ind 112 Disclosure of Interests in Other Entities: Clarification of the scope of disclosure requirements in Ind AS 112The amendments clarify that the disclosure requirements in Ind AS 112, other than those in paragraphs B10–B16, apply to an entity’s interest in a subsidiary, a joint venture or an associate (or a portion of its interest in a joint venture or an associate) that is classified (or included in a disposal group that is classified) as held for sale. Since the proposed amendments relate to relevant disclosures made in the financial statements, excepting those, entity does not expect any impact of the same.

SPML Infra Limited Annual Report 2017-18242
` In Lakhs
Name of entity
Net Assets, ie, Total Assets minus Total Li-
abilities
Share in profit or loss
Share in Other Comprehensive
Income
Share in Total Comprehensive
Income
As % of consoli-
dated net assets
Amount As % of consoli-
dated profit or loss
Amount As % of consoli-
dated profit or loss
Amount As % of consoli-
dated profit or loss
Amount
Parent
SPML Infra Limited 93.70% 43,562.67 85.54% 4,311.63 13.16% 32.61 82.15% 4,344.24
Subsidiaries
ADD Energy Management Company Private Limited
-0.09% (42.43) 0.03% 1.61 0.00% – 0.03% 1.61
Add Technologies (India) Limited 0.74% 346.12 0.16% 8.26 0.00% – 0.16% 8.26
Allahabad Waste Processing Company Limited
2.53% 1,177.20 -4.80% (242.16) 0.00% – -4.58% (242.16)
Awa Power Company Private Limited
1.19% 554.74 -2.96% (149.12) 2.26% 5.59 -2.71% (143.53)
Bhagalpur Electricity Distribution Company Private Limited
-0.69% (320.97) -9.89% (498.49) 3.43% 8.50 -9.27% (489.99)
Binwa Power Company Private Limited
0.72% 335.72 -0.24% (12.07) 0.00% – -0.23% (12.07)
Delhi Waste Management Limited 8.76% 4,070.97 1.71% 86.26 0.00% – 1.63% 86.26
Doon Valley Waste Management Private Limited
-0.49% (229.34) -0.47% (23.93) 0.00% – -0.45% (23.93)
IQU Power Company Private Limited
0.50% 234.01 -1.71% (86.41) 3.85% 9.54 -1.45% (76.87)
Luni Power Company Private Limited
2.81% 1,308.08 -0.11% (5.50) 3.41% 8.46 0.06% 2.96
Madurai Municipal Waste Processing Company Private Limited
3.12% 1,451.35 -5.68% (286.22) 0.00% – -5.41% (286.22)
Mathura Nagar Waste Processing Limited
0.88% 409.60 -1.74% (87.67) 0.00% – -1.66% (87.67)
Mizoram Infrastructure Development Company Limited
0.01% 2.50 0.00% (0.16) 0.00% – 0.00% (0.16)
Neogal Power Company Private Limited
0.83% 387.47 -1.77% (89.02) 3.25% 8.04 -1.53% (80.98)
PT Sanmati Natural Resources 0.00% 2.02 -0.03% (1.41) 0.00% – -0.03% (1.41)
Rupin Tons Power Company Private Limited
0.00% – 0.00% – 0.00% – 0.00% –
SJA Developers Private Limited 0.55% 254.88 -0.01% (0.46) 0.00% – -0.01% (0.46)
SPM Holdings Pte. Limited 6.49% 3,018.65 14.47% 729.14 0.00% – 13.79% 729.14
SPML Energy Limited 1.43% 664.76 -0.50% (25.40) 0.52% 1.28 -0.46% (24.12)
SPML Infra Developers Limited 0.01% 3.11 -0.01% (0.37) 0.00% – -0.01% (0.37)
SPML InfraProjects Limited 0.00% – 0.00% – 0.00% – 0.00% –
SPML Infrastructure Limited 6.00% 2,790.95 -15.89% (800.68) 0.00% – -15.14% (800.68)
SPML Utilities Limited 1.54% 717.43 0.08% 3.82 0.00% – 0.07% 3.82
Subhash Kabini Power Corporation Limited
8.62% 4,006.59 0.99% 49.68 70.12% 173.72 4.22% 223.40
Subhash Urja Private Limited 0.00% 0.49 0.00% (0.20) 0.00% – 0.00% (0.20)
Synergy Promoters Private Limited 0.00% – -0.01% (0.39) 0.00% – -0.01% (0.39)
NOTE 56. Additional information as required by paragraph 2 of the general instructions for preparation of consolidation financial statements to schedule III to the Companies Act 2013:
Consolidated Financial Statement as at and for the year ended 31st March, 2018

243Statutoryreports
Corporate Overview
Financial statements
Consolidated Financial Statement as at and for the year ended 31st March, 2018
` In Lakhs
Name of entity
Net Assets, ie, Total Assets minus Total Li-
abilities
Share in profit or loss
Share in Other Comprehensive
Income
Share in Total Comprehensive
Income
As % of consoli-
dated net assets
Amount As % of consoli-
dated profit or loss
Amount As % of consoli-
dated profit or loss
Amount As % of consoli-
dated profit or loss
Amount
Tons Valley Power Company Private Limited
0.00% – 0.00% – 0.00% – 0.00% –
Uttarkashi Tons Hydro Power Private Limited
0.00% – 0.00% – 0.00% – 0.00% –
Joint Ventures
Aurangabad City Water Utility Company Limited
0.00% – 0.00% – 0.00% – 0.00% –
Gurha Thermal Power Company Limited
0.00% – 0.00% – 0.00% – 0.00% –
Hydro Comp Enterprises India Private Limited
0.00% – -0.01% (0.53) 0.00% – -0.01% (0.53)
Malviya Nagar Water Services Private Limited
0.00% – 0.00% – 0.00% – 0.00% –
MVV Water Utility Private Limited 0.00% – -5.84% (294.53) 0.00% – -5.57% (294.53)
Joint Operations
M & P Subhash JV 0.03% 15.47 0.03% 1.51 0.00% – 0.03% 1.51
Om Metal Consortium 1.39% 646.96 0.02% 0.79 0.00% – 0.01% 0.79
SIDDHARTH+MAHAVIR+SPML (J.V.)
0.12% 54.56 0.00% (0.12) 0.00% – 0.00% (0.12)
SPML - CISC 0.02% 8.86 -0.02% (0.86) 0.00% – -0.02% (0.86)
SPML - HCIL -0.06% (27.45) -0.02% (0.81) 0.00% – -0.02% (0.81)
SPML - Om Metal (JV) Ujjain 1.19% 553.69 15.43% 777.50 0.00% – 14.70% 777.50
SPML - Simplex 0.07% 31.34 0.05% 2.73 0.00% – 0.05% 2.73
Suez Environnement - SPML JV 0.00% (1.86) 0.01% 0.31 0.00% – 0.01% 0.31
Associate
Aurangabad jal construction Private Limited
0.00% – 0.00% (0.09) 0.00% – 0.00% (0.09)
Aurangabad jal Supply Solution Private Limited
0.00% – 0.00% – 0.00% – 0.00% –
Bhilwara Jaipur Toll Road Private Limited
0.00% – -8.96% (451.77) 0.00% – -8.54% (451.77)
Mizoram Mineral Development Corporation Limited
0.00% – 0.00% – 0.00% – 0.00% –
PT Bina Insan Sukses Mandiri 0.00% – 130.41% 6,573.14 0.00% – 124.30% 6,573.14
PT Vardhaman Logistics 0.00% – 0.04% 1.80 0.00% – 0.03% 1.80
PT Vardhaman Mining Services 0.00% – -0.40% (20.22) 0.00% – -0.38% (20.22)
Rabaan (S) Pte Limited 0.00% – -0.05% (2.62) 0.00% – -0.05% (2.62)
Sanmati Infra Developers Private Limited
0.00% – -3.37% (169.97) 0.00% – -3.21% (169.97)
SPML Bhiwandi Water Supply Infra Limited
0.00% – -0.01% (0.27) 0.00% – -0.01% (0.27)
SPML Bhiwandi Water Supply Management Limited
0.00% – -0.01% (0.30) 0.00% – -0.01% (0.30)
Intra-group eliminations -41.93% (19,495.99) -84.44% (4,256.14) 0.00% (0.00) -80.49% (4,256.15)
Total 100% 46,492.16 100% 5,040.30 100% 247.74 100% 5,288.04

SPML Infra Limited Annual Report 2017-18244
Consolidated Financial Statement as at and for the year ended 31st March, 2018
Note 57: MATERIAL PARTLY- OWNED SUBSIDIARIES:Financial information of subsidiaries that have material non-controlling interests is provided below:
Proportion of equity interest held by non-controlling interests:Name Country of
incorporation and operation
March 31, 2018 March 31, 2017 April 1, 2016
Subhash Kabini Power Corporation Limited India 55.28% 35.51% 35.51%SPM Holdings Pte. Limited Singapore 55.28% 35.51% 35.51%Delhi Waste Management Limited India 47.97% 47.97% 43.97%
Information regarding non-controlling interests: ` In LakhsName March 31, 2018 March 31, 2017 April 1, 2016Accumulated balances of material non-controlling interest:Subhash Kabini Power Corporation Limited 3,280.95 4,518.88 4,466.86 SPM Holdings Pte. Limited (1,643.56) (1,596.59) (682.95)Delhi Waste Management Limited (149.03) 3,461.26 2,920.22 Profit/(loss) allocated to material non-controlling interest:Subhash Kabini Power Corporation Limited 31.19 (16.44) 73.00 SPM Holdings Pte. Limited 597.87 818.22 57.40 Delhi Waste Management Limited 126.47 646.96 252.02
The summarised financial information of these subsidiaries are provided below. This information is based on amounts before inter-Company eliminations.
Summarised Balance Sheet as at 31 March 2018: ` In LakhsName Subhash
Kabini Power Corporation
Limited
SPM Holdings PTE. Limited
Delhi Waste Management
Limited
Inventories and cash and cash equivalents (current) 281.12 2,317.00 1,361.52 Property, plant and equipment and other non-current financial assets (non-current)
11,083.05 4,526.77 1,542.05
Trade and other payable (current) 1,768.95 13,233.06 828.43 Interest-bearing loans and borrowing and deferred tax liabilities (non-current)
3,344.08 – –
Total equity 8,959.28 6,922.64 7,824.28 Attributable to:Equity holders of parent 4,006.59 3,095.80 4,070.97 Non-controlling interest 4,952.69 3,826.84 3,753.31
Summarised Balance Sheet as at 31 March 2017: ` In LakhsName Subhash
Kabini Power Corporation
Limited
SPM Holdings PTE. Limited
Delhi Waste Management
Limited
Inventories and cash and cash equivalents (current) 390.33 2,047.76 1,509.93 Property, plant and equipment and other non-current financial assets (non-current)
11,129.55 69.60 2,494.11
Trade and other payable (current) 2,430.30 19,186.51 1,206.96 Interest-bearing loans and borrowing and deferred tax liabilities (non-current)
3,338.00 – 260.08
Total equity 8,839.98 5,104.03 7,674.83 Attributable to:Equity holders of parent 5,700.90 3,291.59 3,993.22 Non-controlling interest 3,139.08 1,812.44 3,681.62
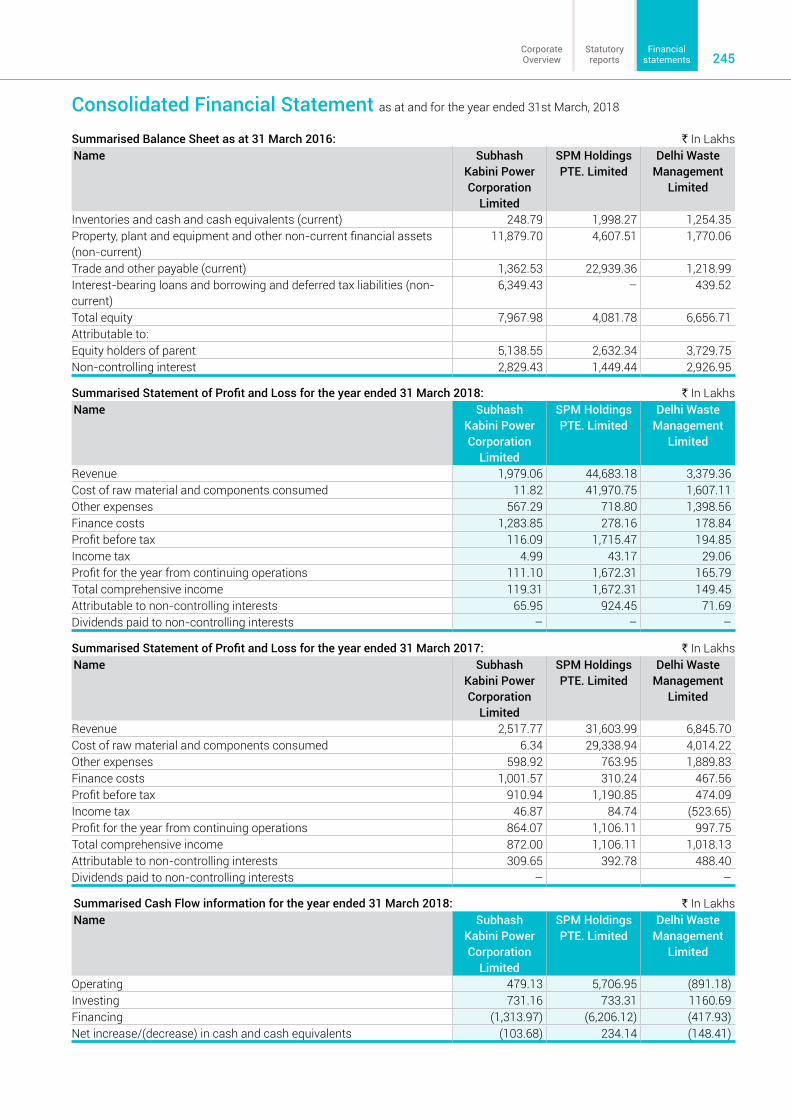
245Statutoryreports
Corporate Overview
Financial statements
Summarised Statement of Profit and Loss for the year ended 31 March 2018: ` In LakhsName Subhash
Kabini Power Corporation
Limited
SPM Holdings PTE. Limited
Delhi Waste Management
Limited
Revenue 1,979.06 44,683.18 3,379.36 Cost of raw material and components consumed 11.82 41,970.75 1,607.11 Other expenses 567.29 718.80 1,398.56 Finance costs 1,283.85 278.16 178.84 Profit before tax 116.09 1,715.47 194.85 Income tax 4.99 43.17 29.06 Profit for the year from continuing operations 111.10 1,672.31 165.79 Total comprehensive income 119.31 1,672.31 149.45 Attributable to non-controlling interests 65.95 924.45 71.69 Dividends paid to non-controlling interests – – –
Consolidated Financial Statement as at and for the year ended 31st March, 2018
Summarised Balance Sheet as at 31 March 2016: ` In LakhsName Subhash
Kabini Power Corporation
Limited
SPM Holdings PTE. Limited
Delhi Waste Management
Limited
Inventories and cash and cash equivalents (current) 248.79 1,998.27 1,254.35 Property, plant and equipment and other non-current financial assets (non-current)
11,879.70 4,607.51 1,770.06
Trade and other payable (current) 1,362.53 22,939.36 1,218.99 Interest-bearing loans and borrowing and deferred tax liabilities (non-current)
6,349.43 – 439.52
Total equity 7,967.98 4,081.78 6,656.71 Attributable to:Equity holders of parent 5,138.55 2,632.34 3,729.75 Non-controlling interest 2,829.43 1,449.44 2,926.95
Summarised Statement of Profit and Loss for the year ended 31 March 2017: ` In LakhsName Subhash
Kabini Power Corporation
Limited
SPM Holdings PTE. Limited
Delhi Waste Management
Limited
Revenue 2,517.77 31,603.99 6,845.70 Cost of raw material and components consumed 6.34 29,338.94 4,014.22 Other expenses 598.92 763.95 1,889.83 Finance costs 1,001.57 310.24 467.56 Profit before tax 910.94 1,190.85 474.09 Income tax 46.87 84.74 (523.65) Profit for the year from continuing operations 864.07 1,106.11 997.75 Total comprehensive income 872.00 1,106.11 1,018.13 Attributable to non-controlling interests 309.65 392.78 488.40 Dividends paid to non-controlling interests – –
Summarised Cash Flow information for the year ended 31 March 2018: ` In LakhsName Subhash
Kabini Power Corporation
Limited
SPM Holdings PTE. Limited
Delhi Waste Management
Limited
Operating 479.13 5,706.95 (891.18)Investing 731.16 733.31 1160.69Financing (1,313.97) (6,206.12) (417.93)Net increase/(decrease) in cash and cash equivalents (103.68) 234.14 (148.41)

SPML Infra Limited Annual Report 2017-18246
Summarised Cash Flow information for the year ended 31 March 2017: ` In LakhsName Subhash
Kabini Power Corporation
Limited
SPM Holdings PTE. Limited
Delhi Waste Management
Limited
Operating 1708.49 959.29 1293.05Investing 2139.09 226.94 (320.32)Financing (3,723.16) (1114.57) (717.14)Net increase/(decrease) in cash and cash equivalents 124.41 71.66 255.58
Interest in Joint Venture:The Company has a 5% interest in Om Metal Consortium, a joint venture involved in Infrastructure business in India. The Company’s interest in Om Metal Consortium is accounted for using the equity method in the consolidated financial statements.
The Company has a 48% interest in Suez Environment France & SPML Infra Limited India JV, a joint venture involved in Infrastructure business in India. The Company’s interest in Suez Environment France & SPML Infra Limited India JV is accounted for using the equity method in the consolidated financial statements.
The Company has a 40% interest in M&P + Subhash JV, a joint venture involved in Infrastructure business in India. The Company’s interest in M&P + Subhash JV is accounted for using the equity method in the consolidated financial statements.
The Company has a 50% interest in SPML OM Metal JV, a joint venture involved in Infrastructure business in India. The Company’s interest in SPML - OM Metal JV is accounted for using the equity method in the consolidated financial statements.
Summarised Balance Sheet as at 31 March 2018: ` In LakhsName OM Metal
Consortium *Suez
Environment France & SPML
Infra Limited India JV *
M&P + Subhash JV *
SPML - OM Metal JV *
Non- Current Assets 12,336.58 999.83 – 90.74 Current Assets 641.28 476.18 5,411.01 3,105.83 Non- Current Liabilities – (6.44) – 679.43 Current liabilities 38.63 1,486.31 5,372.33 1,409.76 Equity 12,939.22 (3.88) 38.68 1,107.38 Proportion of the Company’s ownership 5% 48% 40% 50%Carrying amount of the Investment – – – –
Summarised Balance Sheet as at 31 March 2017: ` In LakhsName OM Metal
Consortium *Suez
Environment France & SPML
Infra Limited India JV *
M&P + Subhash JV *
SPML - OM Metal JV *
Non- Current Assets 12,332.25 999.83 – 90.74 Current Assets 639.25 476.18 5,411.01 3,105.83 Non- Current Liabilities 35.32 (6.44) – 679.43 Current liabilities 14.82 1,486.31 5,372.33 1,409.76 Equity 12,921.36 (3.88) 38.68 1,107.38 Proportion of the Company’s ownership 5% 48% 40% 50%Carrying amount of the Investment – – – –
Consolidated Financial Statement as at and for the year ended 31st March, 2018

247Statutoryreports
Corporate Overview
Financial statements
Summarised Balance Sheet as at 31 March 2016: ` In LakhsName OM Metal
Consortium *Suez
Environment France & SPML
Infra Limited India JV *
M&P + Subhash JV *
SPML - OM Metal JV *
Non- Current Assets 12,321.68 381.65 – 76.78 Current Assets 633.48 1,666.03 5,401.70 489.11 Non- Current Liabilities 25.00 478.37 – 1,308.80 Current liabilities 29.78 1,558.66 5,372.49 1,060.43 Equity 12,900.37 10.65 29.21 –Proportion of the Company’s ownership 5% 48% 40% 50%Carrying amount of the Investment – – – –
Consolidated Financial Statement as at and for the year ended 31st March, 2018
Summarised Statement of Profit and Loss for the year ended 31 March 2018: ` In LakhsName OM Metal
Consortium *Suez
Environment France & SPML
Infra Limited India JV *
M&P + Subhash JV *
SPML - OM Metal JV *
Revenue 22.83 2167.98 4.24 7696.75Cost of raw material and components consumed 0.00 2106.57 0.00 5338.08Depreciation & amortization 0.00 8.45 0.00 4.84Finance cost 0.00 0.26 0.00 90.99Employee benefit 0.00 0.00 0.00 232.34Other expense 0.00 49.62 0.47 320.95Profit before tax 22.83 3.07 3.77 1709.55Income tax expense 7.05 2.43 0.00 154.54Profit for the year 15.78 0.64 3.77 1555.01Total comprehensive income for the year 15.78 0.64 3.77 1555.01Group’s share of profit for the year 0.79 0.31 1.51 777.50
Summarised Statement of Profit and Loss for the year ended 31 March 2017: ` In LakhsName OM Metal
Consortium *Suez
Environment France & SPML
Infra Limited India JV *
M&P + Subhash JV *
SPML - OM Metal JV *
Revenue 29.50 2371.85 4.48 3129.89Cost of raw material and components consumed 0.00 2328.45 0.00 1990.82Depreciation & amortization 0.00 8.45 0.00 10.50Finance cost 0.00 0.01 0.00 283.10Employee benefit 0.00 0.00 0.00 159.95Other expense 0.00 50.69 0.13 508.58Profit before tax 29.50 (15.75) 4.34 176.93Income tax expense 9.11 (0.59) 0.00 61.90Profit for the year 20.38 (15.16) 4.34 115.03Total comprehensive income for the year 20.38 (15.16) 4.34 115.03Group’s share of profit for the year 1.02 (7.28) 1.74 57.52
The Company has no Contingent liabilities or Capital Commitments relating to its Interest in Om Metal Consortium, Suez Environment France & SPML Infra Limited India JV, M&P + Subhash JV, SPML-OM Metal JV as at 31 March 2018, 31 March 2017 and 1 April, 2016.

SPML Infra Limited Annual Report 2017-18248
Interest in Associates:The Company has a 51% interest in Bhilwara Jaipur Toll Road Private Limited, a joint venture involved in Infrastructure business in India. The Company’s interest in Bhilwara Jaipur Toll Road Private Limited is accounted for using the equity method in the consolidated financial statements.
Summarised Balance Sheet as at 31 March 2018: ` In LakhsName March 31, 2018 March 31, 2017 April 1, 2016Non- Current Assets 36,964.98 37,423.40 36,819.39 Current Assets 350.08 208.69 594.16 Non- Current Liabilities 21,887.11 21,550.04 23,653.92 Current liabilities 5,270.27 6,289.27 4,129.30 Equity 10,157.67 9,792.78 9,630.34 Proportion of the Company’s ownership 51% 51% 51%Carrying amount of the Investment 2,931.25 3,408.96 4,123.28
Summarised Statement of Profit and Loss ` In LakhsName March 31, 2018 March 31, 2017Revenue 3,396.99 2,850.38 Cost of raw material and components consumed 78.55 28.59 Depreciation & amortization 459.62 394.67 Finance cost 2,973.01 3,193.43 Employee benefit 128.30 82.43 Other expense 643.32 551.89 Profit before tax (885.81) (1,400.64) Income tax expense – –Profit for the year (885.81) (1,400.64) Total comprehensive income for the year (885.81) (1,400.64)Group’s share of profit for the year (451.77) (714.32)
Consolidated Financial Statement as at and for the year ended 31st March, 2018
Signatories to Note nos. 1 to 57
As per our report of even date
For Maheshwari & Associates For and on behalf of Board of Directors ofChartered Accountants SPML Infra LimitedICAI Firm Registration No. 311008E
CA Bijay Murmuria Subhash Chand Sethi Sushil Kr. SethiPartner Chairman Managing DirectorMembership No 055788 DIN No.00464390 DIN No.00062927
Place: Kolkata Abhay Raj Singh Sujit Kumar JhunjunwalaDate: 30th May 2018 Company Secretary Chief Financial Officer

Corporate InformationBoard of DirectorsMr. Subhash Chand SethiChairman & Whole Time Director
Mr. Sushil Kumar SethiManaging Director
Mr. Sarthak BehuriaIndependent Director
Mr. Sushil Kumar RoongtaIndependent Director
Mr. P. S. RanaIndependent Director
Mrs. Archana CapoorIndependent Director
Mr. Dinesh Kumar GoyalIndependent Director
Mr. Supriyo Kumar ChaudhuriNominee Director
Mr. Deepak SethiNon-Executive Director
Key Managerial Personnel:Mr. Sujit Kumar JhunjhunwalaChief Financial Officer
Mr. Abhay Raj SinghCompany Secretary
Registered Office:F-27/2, Okhla Industrial Area, Phase-II,New Delhi-110020Tel: +91-11-26387091CIN: L40106DL1981PLC012228
Head Office:22, Camac Street, Block-A, 3rd Floor, Kolkata-700016Tel: +91-33-40091200
Corporate Office:SPML House, Plot No. 65, Sector-32, Institutional Area, Gurgaon- 122001, HaryanaTel: +91-124-2384141
Regional Office:BangaloreB wing (South Block), 5th floor, Cristu Complex,No-41/7, Lavelle Road, Bangalore-560001Tel: +91-80-48524898
Bankers/ Financial InstitutionsState Bank of IndiaCanara BankICICI Bank Ltd.Syndicate BankPunjab National BankBank of BarodaIFCI LimitedOriental Bank of CommerceUnion Bank of IndiaYes Bank Ltd.Andhra Bank
AuditorsMaheshwari & AssociatesChartered Accountants (FRN No.311008E)Geetanjali Apartments, Flat No. 6A, 8B, Middleton Street, Kolkata-700071
Registrar & Share Transfer AgentMaheshwari Datamatics Pvt. Ltd.,23, R. N. Mukherjee Road, 5th Floor,Kolkata- 700001

SPML Infra LimitedRegistered Office: F-27/2, Okhla Industrial Area, Phase II, New Delhi - 110020Tel.: +91-11-26387091
Head Office: 22, Camac Street, Block A, 3rd Floor, Kolkata - 700016Tel.: +91-33-40091200
Corporate Office: SPML House, Plot No. 65, Sector-32, Institutional Area, Gurgaon-122001 (Haryana)Tel: +91-124-2384141 [email protected], www.spml.co.in Offices in Ahmedabad, Bengaluru, Chennai, Mumbai