Embed Size (px)
Citation preview
Current and future climate of the Fiji Islands
Southern Lau Group
Northern Lau Group
Vanua LevuTaveuni
Koro
Kadavu
Viti Levu
Rotuma
SUVA
Nadi
Ahau
Koro Sea
South Pacific Ocean
Bligh Water
Yasa
wa
Gro
up
Great Sea Reef
Ono-i-lau
> Fiji Meteorological Service > Australian Bureau of Meteorology> Commonwealth Scientific and Industrial Research Organisation (CSIRO)
Pacific-Australia Climate Change Science and Adaptation Planning Program
2 Current and future climate of the Fiji Islands
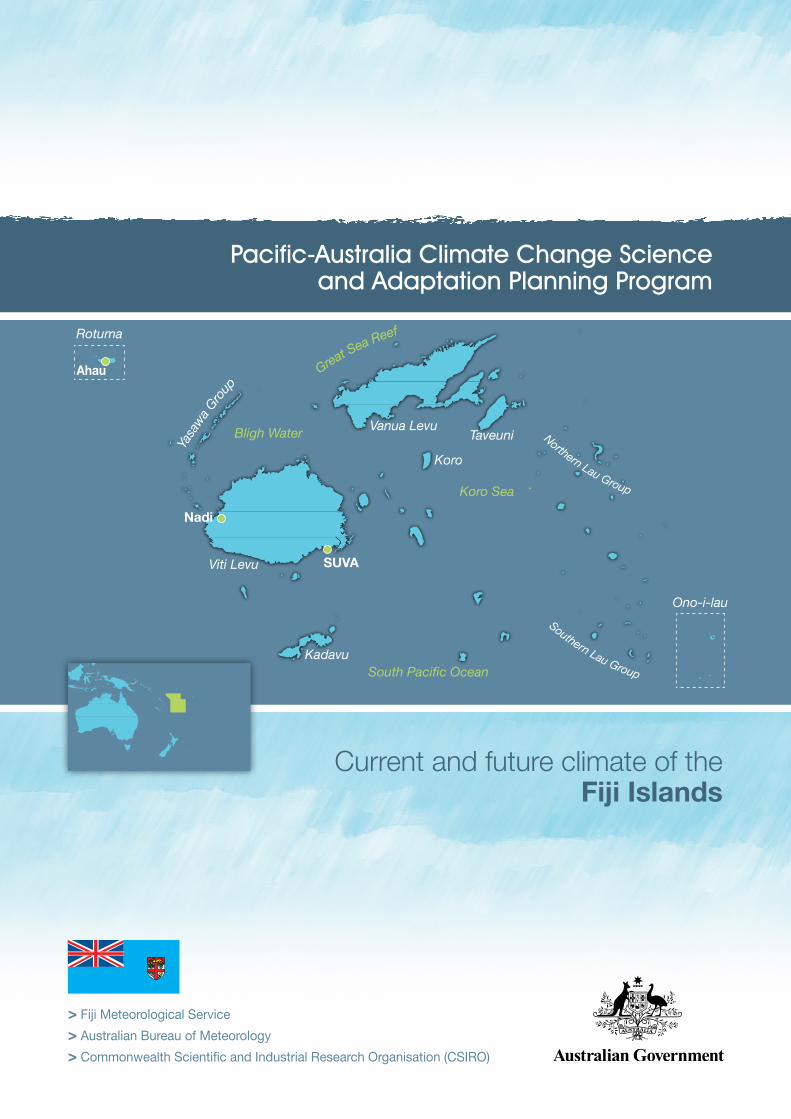
Fiji’s current climateTemperatureAcross Fiji the annual average temperature is between 20–27°C. Changes in the temperature from season to season are relatively small and strongly tied to changes in the surrounding ocean temperature.
Around the coast, the average night-time temperatures can be as low as 18°C and the average maximum day-time temperatures can be as high as 32°C. In the central parts of the main islands, average night-time temperatures can be as low as 15ºC. The country has two distinct seasons – a warm wet season from November to April and a cooler dry season from May to October (Figure 1).
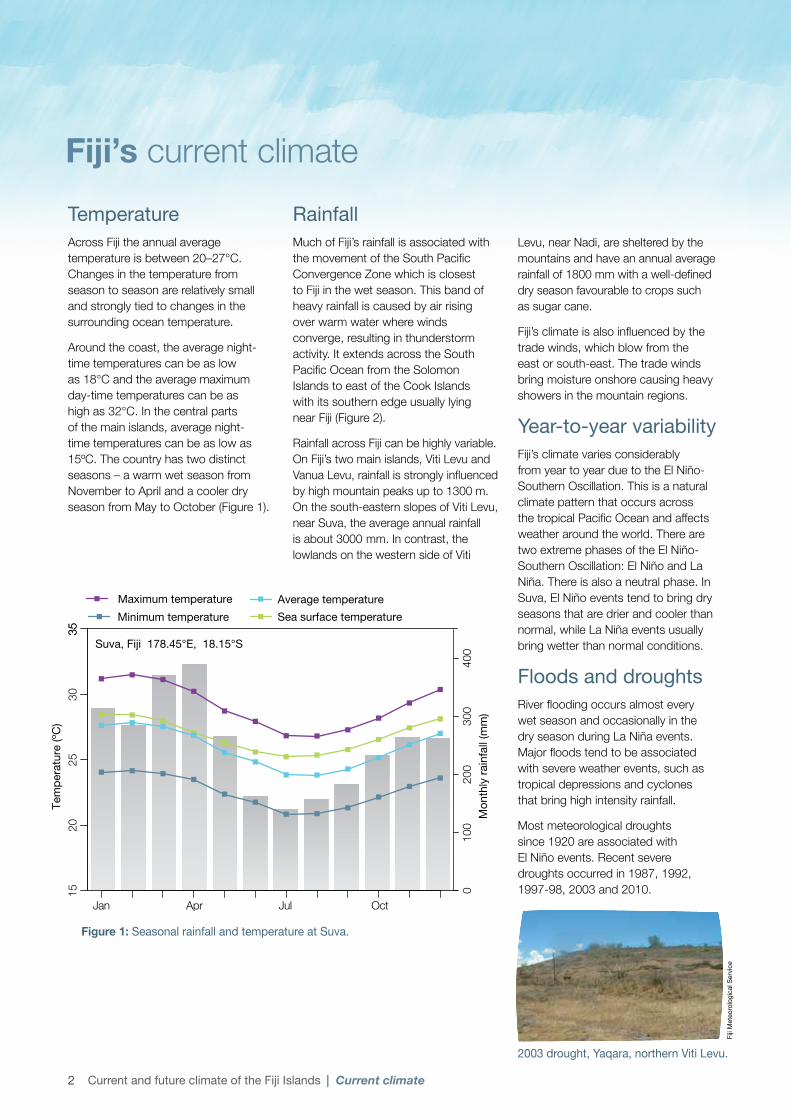
RainfallMuch of Fiji’s rainfall is associated with the movement of the South Pacific Convergence Zone which is closest to Fiji in the wet season. This band of heavy rainfall is caused by air rising over warm water where winds converge, resulting in thunderstorm activity. It extends across the South Pacific Ocean from the Solomon Islands to east of the Cook Islands with its southern edge usually lying near Fiji (Figure 2).
Rainfall across Fiji can be highly variable. On Fiji’s two main islands, Viti Levu and Vanua Levu, rainfall is strongly influenced by high mountain peaks up to 1300 m. On the south-eastern slopes of Viti Levu, near Suva, the average annual rainfall is about 3000 mm. In contrast, the lowlands on the western side of Viti
Levu, near Nadi, are sheltered by the mountains and have an annual average rainfall of 1800 mm with a well-defined dry season favourable to crops such as sugar cane.
Fiji’s climate is also influenced by the trade winds, which blow from the east or south-east. The trade winds bring moisture onshore causing heavy showers in the mountain regions.
Year-to-year variabilityFiji’s climate varies considerably from year to year due to the El Niño-Southern Oscillation. This is a natural climate pattern that occurs across the tropical Pacific Ocean and affects weather around the world. There are two extreme phases of the El Niño- Southern Oscillation: El Niño and La Niña. There is also a neutral phase. In Suva, El Niño events tend to bring dry seasons that are drier and cooler than normal, while La Niña events usually bring wetter than normal conditions.
Floods and droughtsRiver flooding occurs almost every wet season and occasionally in the dry season during La Niña events. Major floods tend to be associated with severe weather events, such as tropical depressions and cyclones that bring high intensity rainfall.
Most meteorological droughts since 1920 are associated with El Niño events. Recent severe droughts occurred in 1987, 1992, 1997-98, 2003 and 2010.
Figure 1: Seasonal rainfall and temperature at Suva.
2003 drought, Yaqara, northern Viti Levu.
Fiji
Met
eoro
logi
cal S
ervi
ce
| Current climate
3 Current and future climate of the Fiji Islands
H
H
T r a d e W i n d s
0 500 1,000 1,500 2,000Kilometres
Palau Federated States of Micronesia Marshall Islands
KiribatiNauru
Papua New GuineaSolomon Islands
Vanuatu
Tuvalu
FijiSamoa
Tonga
Niue
Cook Islands
East Timor
30o S
20o S
10o S
0o
10o N
2
0o N
110o E
120o E
130o E
140o E
150o E
160o E
170o E
180o
170o W
160o W
150o W
140o W
I n t e r t r o p i c a l C o n v e r g e n c e Z o n e
S o u t h P a c i f i c C o n v e r g e n c e Z o n e
M o n s o o n
W a r m p o o l
Figure 2: Average positions of the major climate features in November to April. The arrows show near surface winds, the blue shading represents the bands of rainfall convergence zones, the dashed oval shows the West Pacific Warm Pool and H represents typical positions of moving high pressure systems.
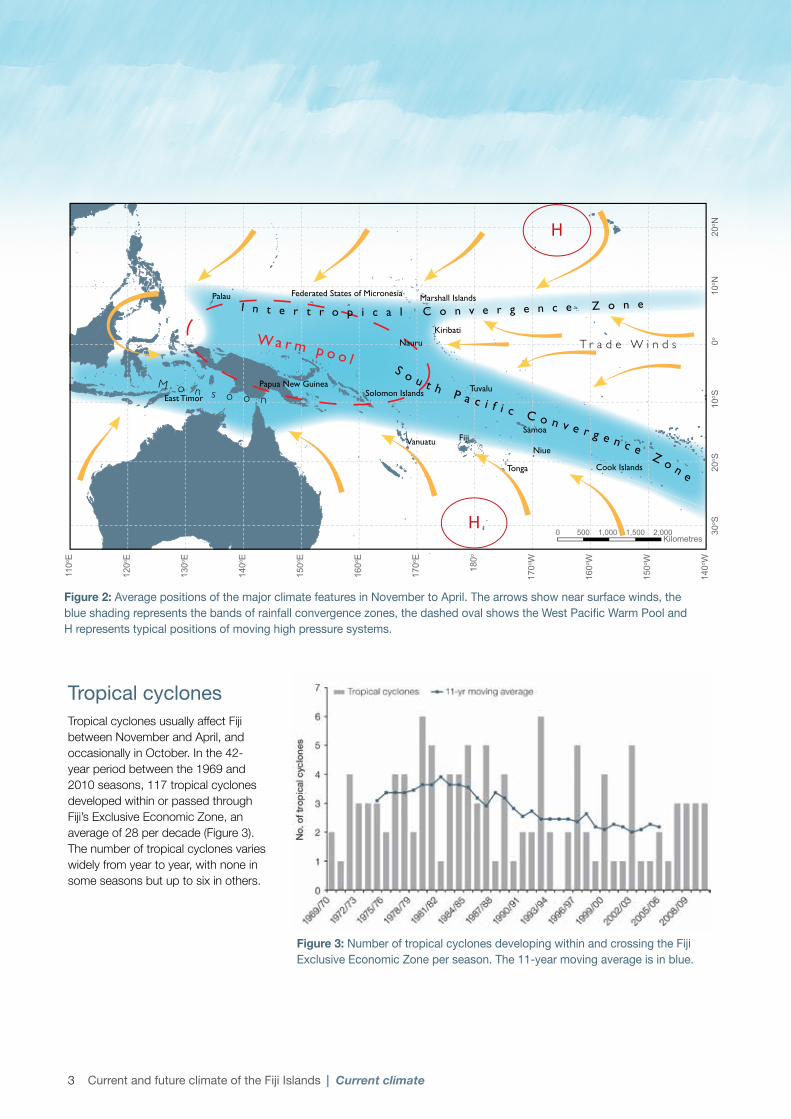
Tropical cyclonesTropical cyclones usually affect Fiji between November and April, and occasionally in October. In the 42-year period between the 1969 and 2010 seasons, 117 tropical cyclones developed within or passed through Fiji’s Exclusive Economic Zone, an average of 28 per decade (Figure 3). The number of tropical cyclones varies widely from year to year, with none in some seasons but up to six in others.
Figure 3: Number of tropical cyclones developing within and crossing the Fiji Exclusive Economic Zone per season. The 11-year moving average is in blue.
| Current climate
4 Current and future climate of the Fiji Islands | Current climate
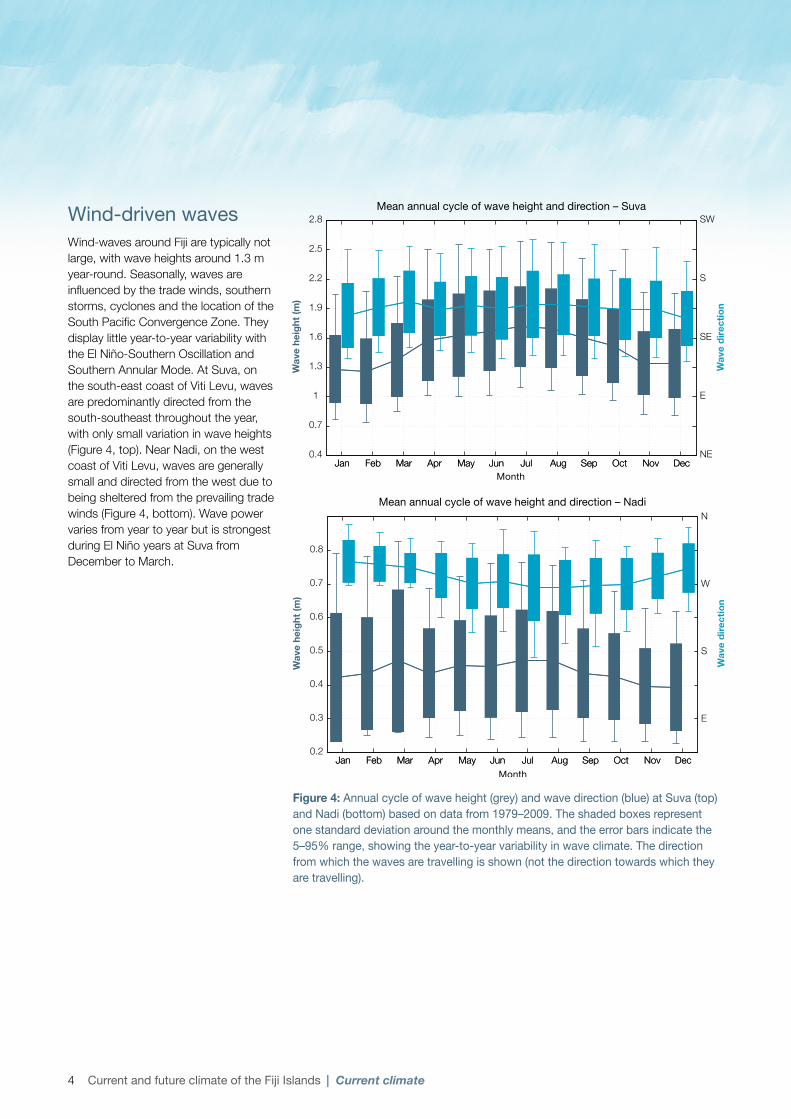
Wind-driven wavesWind-waves around Fiji are typically not large, with wave heights around 1.3 m year-round. Seasonally, waves are influenced by the trade winds, southern storms, cyclones and the location of the South Pacific Convergence Zone. They display little year-to-year variability with the El Niño-Southern Oscillation and Southern Annular Mode. At Suva, on the south-east coast of Viti Levu, waves are predominantly directed from the south-southeast throughout the year, with only small variation in wave heights (Figure 4, top). Near Nadi, on the west coast of Viti Levu, waves are generally small and directed from the west due to being sheltered from the prevailing trade winds (Figure 4, bottom). Wave power varies from year to year but is strongest during El Niño years at Suva from December to March.
Figure 4: Annual cycle of wave height (grey) and wave direction (blue) at Suva (top) and Nadi (bottom) based on data from 1979–2009. The shaded boxes represent one standard deviation around the monthly means, and the error bars indicate the 5–95% range, showing the year-to-year variability in wave climate. The direction from which the waves are travelling is shown (not the direction towards which they are travelling).
5 Current and future climate of the Fiji Islands
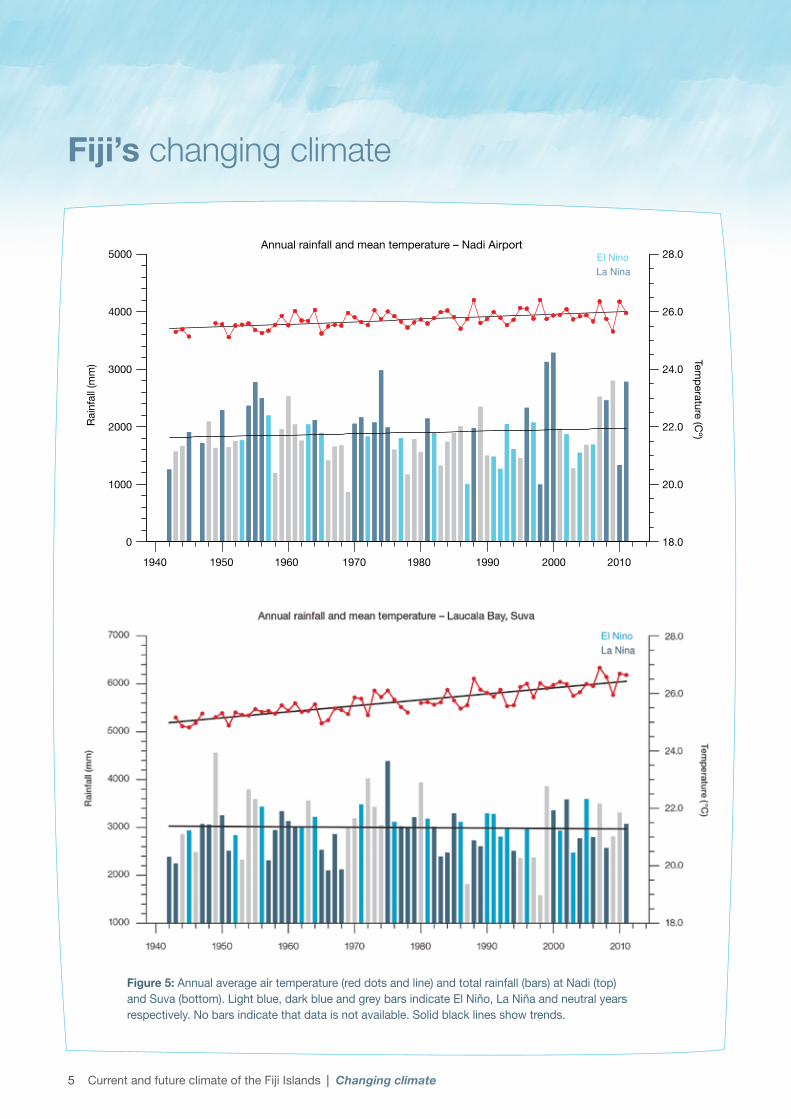
Figure 5: Annual average air temperature (red dots and line) and total rainfall (bars) at Nadi (top) and Suva (bottom). Light blue, dark blue and grey bars indicate El Niño, La Niña and neutral years respectively. No bars indicate that data is not available. Solid black lines show trends.
Fiji’s changing climate
| Changing climate
Annual rainfall and mean temperature – Nadi Airport
Rain
fall
(mm
) Temperature (C
º)
1940 1950 1960 1970 1980 1990 2000 2010
5000
4000
3000
2000
1000
0
28.0
26.0
24.0
22.0
20.0
18.0
6 Current and future climate of the Fiji Islands
Temperatures have increasedAnnual maximum and minimum temperatures have increased in both Suva and Nadi since 1942 (Figure 5). In Suva, maximum temperatures have increased at a rate of 0.15°C per decade. At Nadi Airport the rate of increase has been 0.04°C per decade. Minimum temperature trends are greater than maximum temperature trends. In Suva, minimum temperatures have increased at a rate of 0.26°C per decade and at Nadi Airport the rate of increase has been 0.13°C per decade. These temperature increases are consistent with the global pattern of warming.
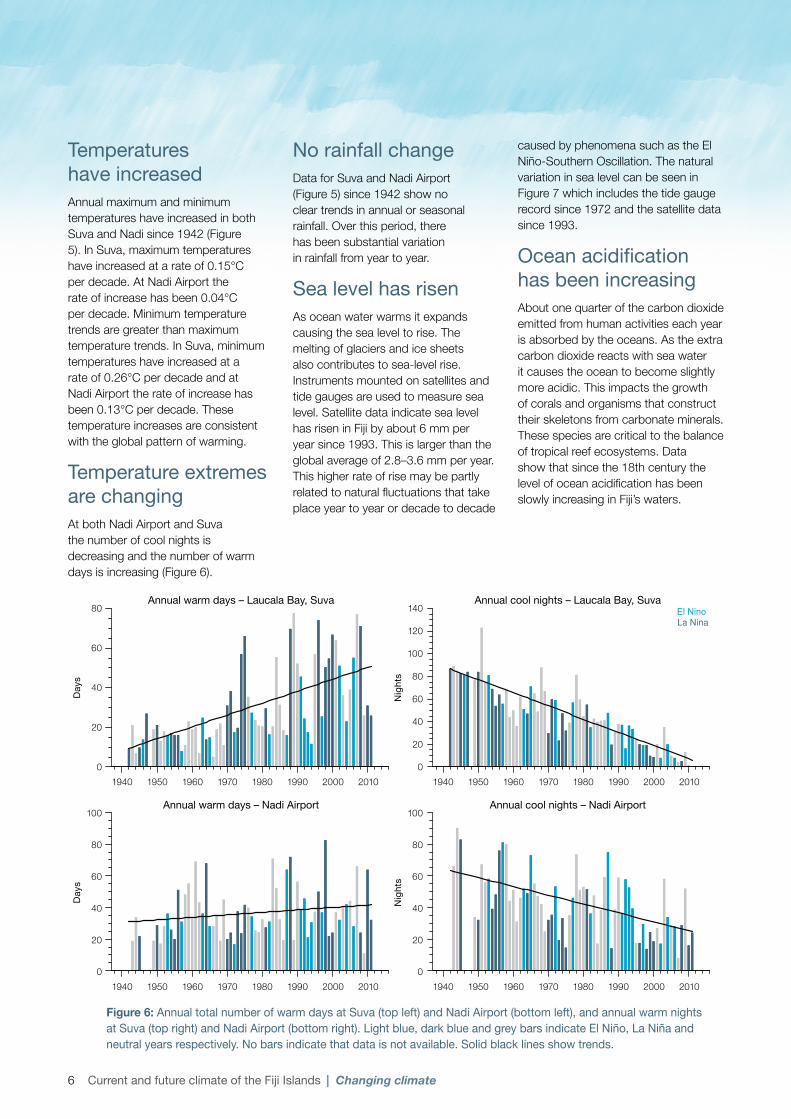
Temperature extremes are changingAt both Nadi Airport and Suva the number of cool nights is decreasing and the number of warm days is increasing (Figure 6).
No rainfall changeData for Suva and Nadi Airport (Figure 5) since 1942 show no clear trends in annual or seasonal rainfall. Over this period, there has been substantial variation in rainfall from year to year.
Sea level has risenAs ocean water warms it expands causing the sea level to rise. The melting of glaciers and ice sheets also contributes to sea-level rise. Instruments mounted on satellites and tide gauges are used to measure sea level. Satellite data indicate sea level has risen in Fiji by about 6 mm per year since 1993. This is larger than the global average of 2.8–3.6 mm per year. This higher rate of rise may be partly related to natural fluctuations that take place year to year or decade to decade
caused by phenomena such as the El Niño-Southern Oscillation. The natural variation in sea level can be seen in Figure 7 which includes the tide gauge record since 1972 and the satellite data since 1993.
Ocean acidification has been increasingAbout one quarter of the carbon dioxide emitted from human activities each year is absorbed by the oceans. As the extra carbon dioxide reacts with sea water it causes the ocean to become slightly more acidic. This impacts the growth of corals and organisms that construct their skeletons from carbonate minerals. These species are critical to the balance of tropical reef ecosystems. Data show that since the 18th century the level of ocean acidification has been slowly increasing in Fiji’s waters.
Figure 6: Annual total number of warm days at Suva (top left) and Nadi Airport (bottom left), and annual warm nights at Suva (top right) and Nadi Airport (bottom right). Light blue, dark blue and grey bars indicate El Niño, La Niña and neutral years respectively. No bars indicate that data is not available. Solid black lines show trends.
| Changing climate
Day
s
60
80
40
20
01940 1960 1970 1980 1990 2000 2010
Nig
hts
100
120
140
80
60
40
20
019401950 1950 1960 1970 1980 1990 2000 2010
Annual warm days – Laucala Bay, Suva Annual cool nights – Laucala Bay, Suva
Day
s
100
80
60
40
20
01940 1960 1970 1980 1990 2000 2010
Nig
hts 60
80
100
40
20
019401950 1950 1960 1970 1980 1990 2000 2010
Annual warm days – Nadi Airport Annual cool nights – Nadi Airport
7 Current and future climate of the Fiji Islands
Fiji’s future climate
• El Niño and La Niña events will continue to occur in the future, but there is little consensus on whether these events will change in intensity or frequency.
• Annual mean temperatures and extremely high daily temperatures will continue to rise.
• There is a range in model projections in mean rainfall, with the model average indicating little change in annual rainfall but an increase in the wet season, with more extreme rain events.
• The proportion of time in drought is projected to decrease slightly.
• Sea level will continue to rise.
• Ocean acidification is expected to continue.
• The risk of coral bleaching is expected to increase.
• Wave height is projected to decrease across the area in the wet season, with a possible small increase in dry season wave heights.
• Tropical cyclones are projected to be less frequent but more intense.
At a glance
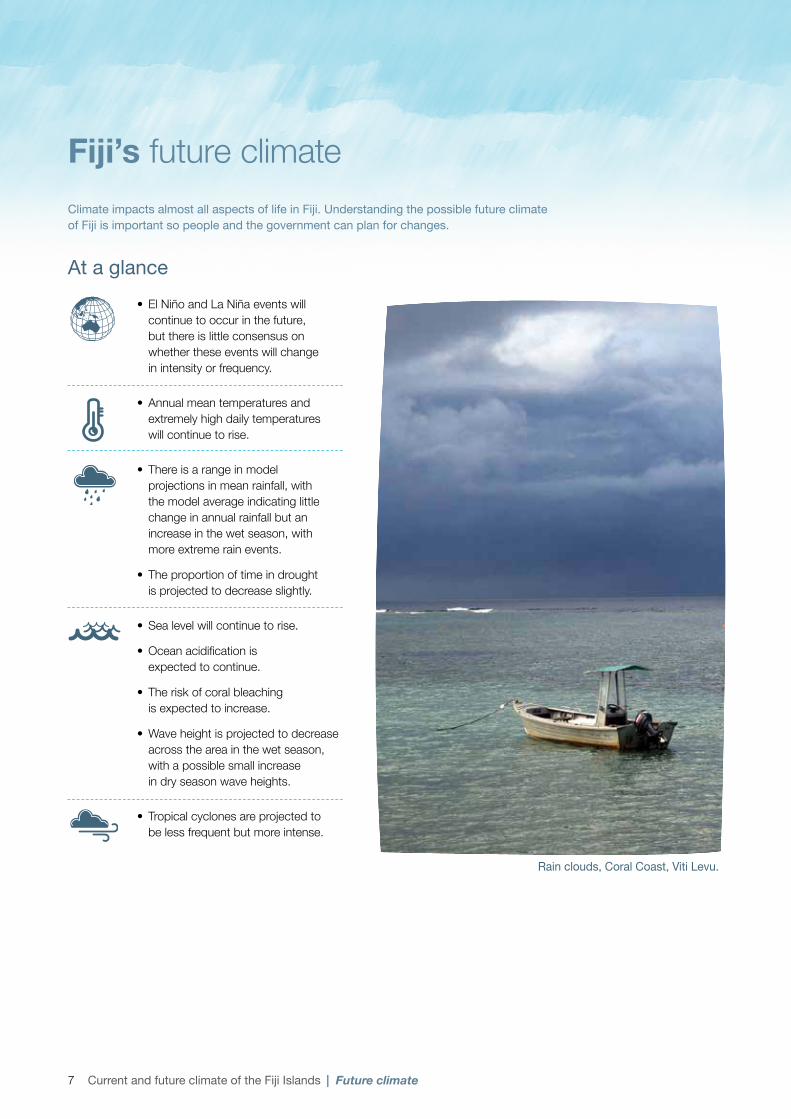
Rain clouds, Coral Coast, Viti Levu.
| Future climate
Climate impacts almost all aspects of life in Fiji. Understanding the possible future climate of Fiji is important so people and the government can plan for changes.
8 Current and future climate of the Fiji Islands
Taking rainfall observations, Laucala Bay Meteorology Office.
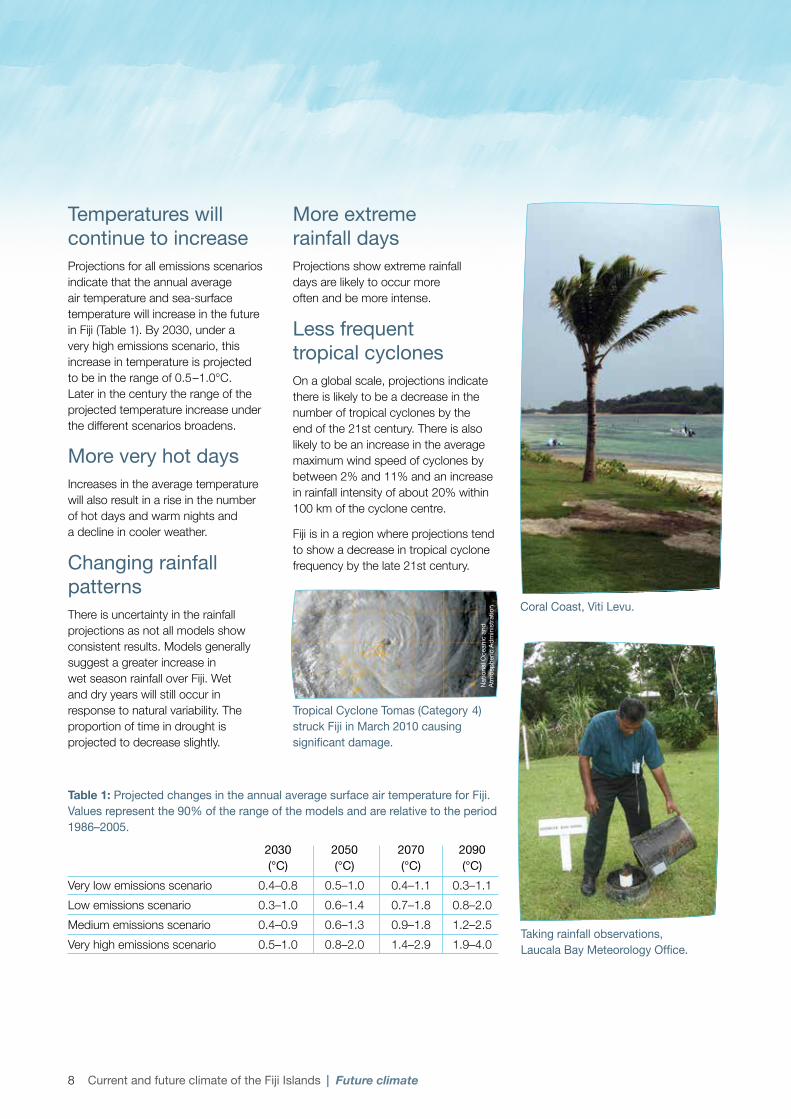
Coral Coast, Viti Levu.
More extreme rainfall days Projections show extreme rainfall days are likely to occur more often and be more intense.
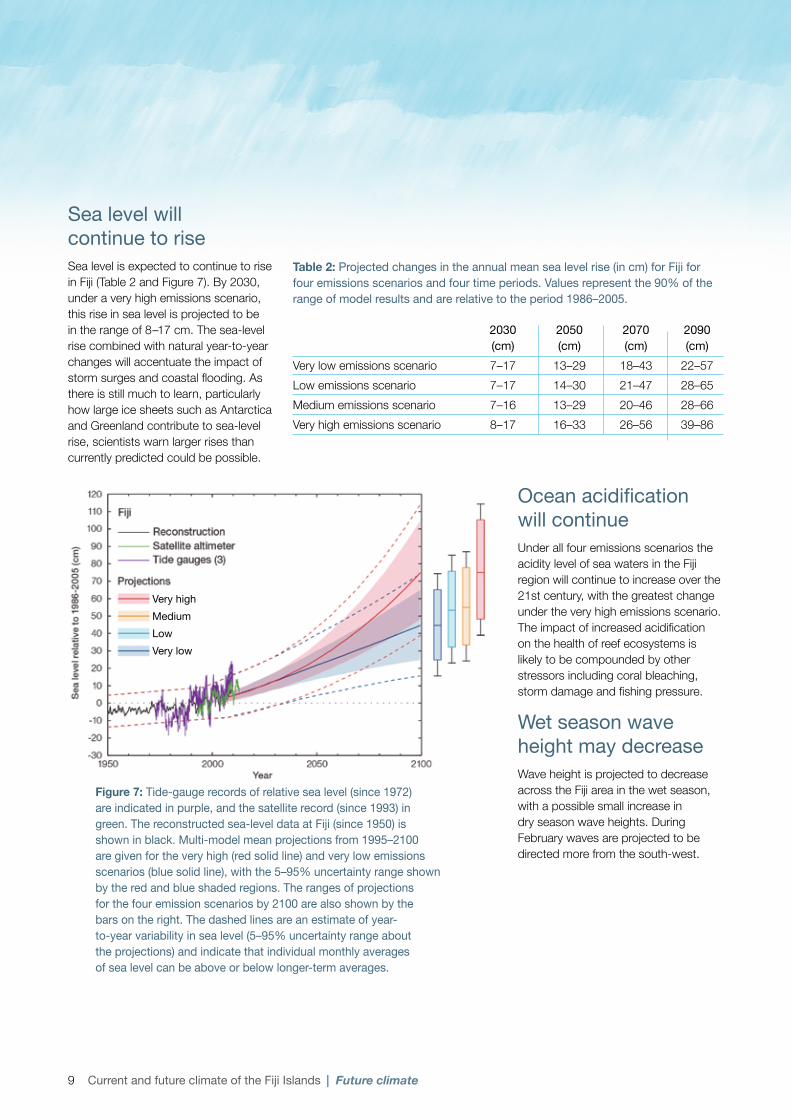
Less frequent tropical cyclones On a global scale, projections indicate there is likely to be a decrease in the number of tropical cyclones by the end of the 21st century. There is also likely to be an increase in the average maximum wind speed of cyclones by between 2% and 11% and an increase in rainfall intensity of about 20% within 100 km of the cyclone centre.
Fiji is in a region where projections tend to show a decrease in tropical cyclone frequency by the late 21st century.
Temperatures will continue to increaseProjections for all emissions scenarios indicate that the annual average air temperature and sea-surface temperature will increase in the future in Fiji (Table 1). By 2030, under a very high emissions scenario, this increase in temperature is projected to be in the range of 0.5–1.0°C. Later in the century the range of the projected temperature increase under the different scenarios broadens.
More very hot daysIncreases in the average temperature will also result in a rise in the number of hot days and warm nights and a decline in cooler weather.
Changing rainfall patternsThere is uncertainty in the rainfall projections as not all models show consistent results. Models generally suggest a greater increase in wet season rainfall over Fiji. Wet and dry years will still occur in response to natural variability. The proportion of time in drought is projected to decrease slightly.
Tropical Cyclone Tomas (Category 4) struck Fiji in March 2010 causing significant damage.
Nat
iona
l Oce
anic
and
At
mos
pher
ic A
dmin
istra
tion
Table 1: Projected changes in the annual average surface air temperature for Fiji. Values represent the 90% of the range of the models and are relative to the period 1986–2005.
2030 2050 2070 2090 (°C) (°C) (°C) (°C)Very low emissions scenario 0.4–0.8 0.5–1.0 0.4–1.1 0.3–1.1Low emissions scenario 0.3–1.0 0.6–1.4 0.7–1.8 0.8–2.0Medium emissions scenario 0.4–0.9 0.6–1.3 0.9–1.8 1.2–2.5Very high emissions scenario 0.5–1.0 0.8–2.0 1.4–2.9 1.9–4.0
| Future climate
9 Current and future climate of the Fiji Islands
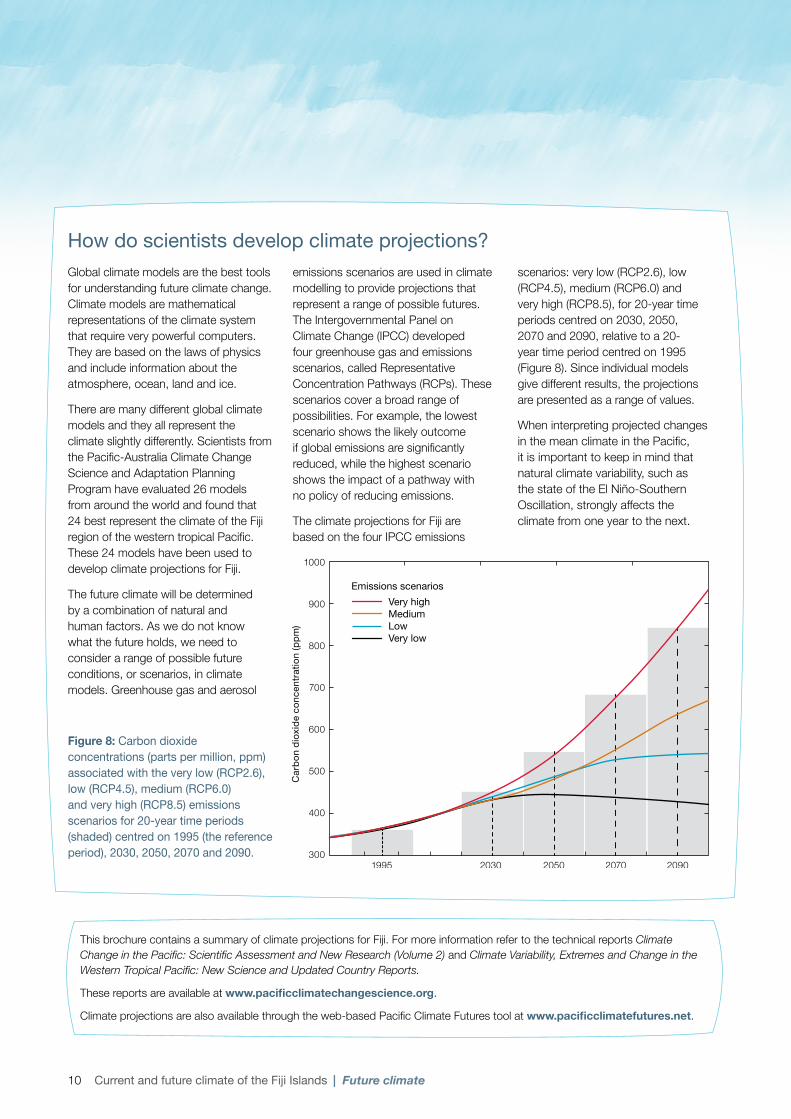
Sea level will continue to riseSea level is expected to continue to rise in Fiji (Table 2 and Figure 7). By 2030, under a very high emissions scenario, this rise in sea level is projected to be in the range of 8–17 cm. The sea-level rise combined with natural year-to-year changes will accentuate the impact of storm surges and coastal flooding. As there is still much to learn, particularly how large ice sheets such as Antarctica and Greenland contribute to sea-level rise, scientists warn larger rises than currently predicted could be possible.
Ocean acidification will continueUnder all four emissions scenarios the acidity level of sea waters in the Fiji region will continue to increase over the 21st century, with the greatest change under the very high emissions scenario. The impact of increased acidification on the health of reef ecosystems is likely to be compounded by other stressors including coral bleaching, storm damage and fishing pressure.
Wet season wave height may decreaseWave height is projected to decrease across the Fiji area in the wet season, with a possible small increase in dry season wave heights. During February waves are projected to be directed more from the south-west.
Table 2: Projected changes in the annual mean sea level rise (in cm) for Fiji for four emissions scenarios and four time periods. Values represent the 90% of the range of model results and are relative to the period 1986–2005.
2030 2050 2070 2090 (cm) (cm) (cm) (cm)Very low emissions scenario 7–17 13–29 18–43 22–57Low emissions scenario 7–17 14–30 21–47 28–65Medium emissions scenario 7–16 13–29 20–46 28–66Very high emissions scenario 8–17 16–33 26–56 39–86
Figure 7: Tide-gauge records of relative sea level (since 1972) are indicated in purple, and the satellite record (since 1993) in green. The reconstructed sea-level data at Fiji (since 1950) is shown in black. Multi-model mean projections from 1995–2100 are given for the very high (red solid line) and very low emissions scenarios (blue solid line), with the 5–95% uncertainty range shown by the red and blue shaded regions. The ranges of projections for the four emission scenarios by 2100 are also shown by the bars on the right. The dashed lines are an estimate of year-to-year variability in sea level (5–95% uncertainty range about the projections) and indicate that individual monthly averages of sea level can be above or below longer-term averages.
| Future climate
Very highMediumLowVery low
10 Current and future climate of the Fiji Islands
This brochure contains a summary of climate projections for Fiji. For more information refer to the technical reports Climate Change in the Pacific: Scientific Assessment and New Research (Volume 2) and Climate Variability, Extremes and Change in the Western Tropical Pacific: New Science and Updated Country Reports.
These reports are available at www.pacificclimatechangescience.org.
Climate projections are also available through the web-based Pacific Climate Futures tool at www.pacificclimatefutures.net.
Global climate models are the best tools for understanding future climate change. Climate models are mathematical representations of the climate system that require very powerful computers. They are based on the laws of physics and include information about the atmosphere, ocean, land and ice.
There are many different global climate models and they all represent the climate slightly differently. Scientists from the Pacific-Australia Climate Change Science and Adaptation Planning Program have evaluated 26 models from around the world and found that 24 best represent the climate of the Fiji region of the western tropical Pacific. These 24 models have been used to develop climate projections for Fiji.
The future climate will be determined by a combination of natural and human factors. As we do not know what the future holds, we need to consider a range of possible future conditions, or scenarios, in climate models. Greenhouse gas and aerosol
emissions scenarios are used in climate modelling to provide projections that represent a range of possible futures. The Intergovernmental Panel on Climate Change (IPCC) developed four greenhouse gas and emissions scenarios, called Representative Concentration Pathways (RCPs). These scenarios cover a broad range of possibilities. For example, the lowest scenario shows the likely outcome if global emissions are significantly reduced, while the highest scenario shows the impact of a pathway with no policy of reducing emissions.
The climate projections for Fiji are based on the four IPCC emissions
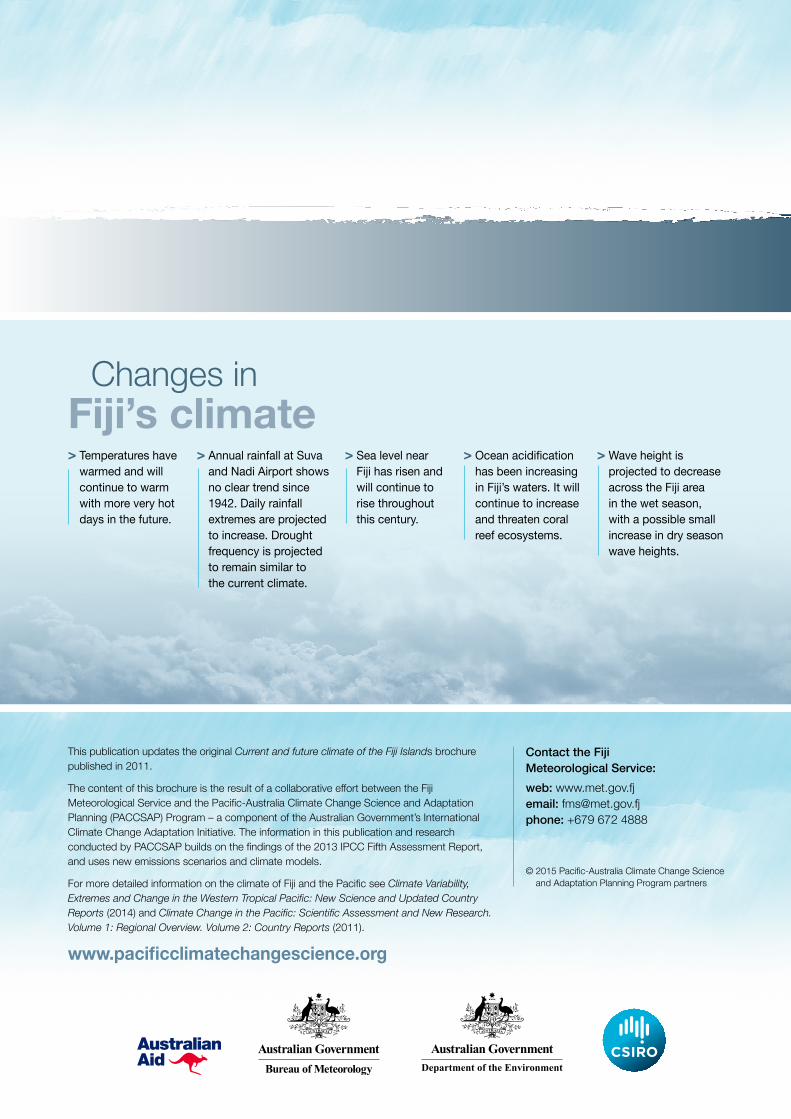
scenarios: very low (RCP2.6), low (RCP4.5), medium (RCP6.0) and very high (RCP8.5), for 20-year time periods centred on 2030, 2050, 2070 and 2090, relative to a 20-year time period centred on 1995 (Figure 8). Since individual models give different results, the projections are presented as a range of values.
When interpreting projected changes in the mean climate in the Pacific, it is important to keep in mind that natural climate variability, such as the state of the El Niño-Southern Oscillation, strongly affects the climate from one year to the next.
How do scientists develop climate projections?
Figure 8: Carbon dioxide concentrations (parts per million, ppm) associated with the very low (RCP2.6), low (RCP4.5), medium (RCP6.0) and very high (RCP8.5) emissions scenarios for 20-year time periods (shaded) centred on 1995 (the reference period), 2030, 2050, 2070 and 2090.
| Future climate
This publication updates the original Current and future climate of the Fiji Islands brochure published in 2011.
The content of this brochure is the result of a collaborative effort between the Fiji Meteorological Service and the Pacific-Australia Climate Change Science and Adaptation Planning (PACCSAP) Program – a component of the Australian Government’s International Climate Change Adaptation Initiative. The information in this publication and research conducted by PACCSAP builds on the findings of the 2013 IPCC Fifth Assessment Report, and uses new emissions scenarios and climate models.
For more detailed information on the climate of Fiji and the Pacific see Climate Variability, Extremes and Change in the Western Tropical Pacific: New Science and Updated Country Reports (2014) and Climate Change in the Pacific: Scientific Assessment and New Research. Volume 1: Regional Overview. Volume 2: Country Reports (2011).
www.pacificclimatechangescience.org
Contact the Fiji Meteorological Service:web: www.met.gov.fj email: [email protected] phone: +679 672 4888
© 2015 Pacific-Australia Climate Change Science and Adaptation Planning Program partners
Fiji’s climateChanges in
> Temperatures have warmed and will continue to warm with more very hot days in the future.
> Annual rainfall at Suva and Nadi Airport shows no clear trend since 1942. Daily rainfall extremes are projected to increase. Drought frequency is projected to remain similar to the current climate.
> Sea level near Fiji has risen and will continue to rise throughout this century.
> Ocean acidification has been increasing in Fiji’s waters. It will continue to increase and threaten coral reef ecosystems.
> Wave height is projected to decrease across the Fiji area in the wet season, with a possible small increase in dry season wave heights.