Embed Size (px)
Citation preview
1
Pacific Islands Development in Long-run Perspective
Geoff BertramInstitute of Policy Studies
February 2011
2
Top-down versus bottom-up
• Seen from above, ‘resilience’ is a set of qualities that aid donors want island economies and societies to exhibit – outcomes to be purchased.
• Seen from below, ‘resilience’ (including adaptability, flexibility, opportunism) has always been the fundamental long-run characteristic of Pacific Island communities, from way back before European contact.
• Quite a few metropolitan policymakers are still preoccupied with – blocking some of the consequences of bottom-up resilience,– denying elements of its economic logic, and– imposing preconceived (top-down) views of what resilience looks like or should look
like
• A recurrent failing of aid agencies and metropolitan governments is to impose a particular top-down conception of what it means to “develop”, and to make aid conditional upon a shadow-play of compliance with this vision by the recipients.
3
To get a sense of how bottom-up resilience works, evidence-based analysis is a good place to start
• Rather than telling island peoples or states how to “develop sustainably”, or what to develop, watch what they have actually done within the limits of the external constraints placed upon them
• One early casualty would be the degree of emphasis and expectations placed by large-country analysts on commodity trade and trade agreements. Export-led growth has had a bad century in the Pacific, and the next century’s prospects hinge more on regulatory capacity than free-trade treaties
• Another casualty would be simplistic claims about the benefits of shifting resources from the public sector to the private sector (getting the public sector working more effectively is another matter)
• Another would be several core assumptions in mainstream development thinking about decolonisation and the virtues of sovereign statehood
• My own work has tended to focus on gathering comparative numbers and using them to chart the big trends in islander development – not only in the Pacific but worldwide.
4
“Sustainable development” is a term badly in need of careful unpacking.
• Whenever anyone recommends it or appeals to it they should be asked to explain what exactly is “developing”, what it means to “develop”, what mechanism is to do the “sustaining”, whether this mechanism is politically acceptable or not, and which structural options are being ruled out by use of the term.
• Unless very specific content is added, the words are mere rhetoric which confuse and conceal.
• From my perspective, what is to be developed is the material welfare, life chances and cultural identity of each people, seen holistically as a people without regard to national borders unless and until those borders clearly have become effective dividing lines within the people.
• Development is sustainable so long as material welfare, life chances and cultural cohesion are maintained or enhanced through time without running up large collective balance-sheet liabilities that at some later stage are apt to prove destructive.
• This means that certain indicators often appealed to in the name of “sustainability” are in fact often irrelevant – especially “trade imbalance”, “capital outflow”, “brain drain”, and that ugly expression, “aid dependence”.
5
Conceptually one ought to be thinking of “viability” and “sustainability” in terms of socioeconomic units – often
transnational units - rather than “national” ones.
• Much of the ‘modern sector’ of any Pacific island people with migration outlets will lie offshore, inhabited by the diaspora of entrepreneurs and wage-workers which controls a large share of the financial and human capital of the people as a whole.
• Remittances form a direct cashflow link between the diaspora and the home population, but other links are equally important for long-run growth – especially patterns of return migration, back-and-forth visiting, communication via media channels, and accumulation of financial assets in metropolitan banks and share registers.
• National-accounts aggregates prepared for the home-resident population in isolation not only ignore much of the actual (but offshore) modern sector; they also miss the degree of success in preserving non-material wealth in the form of culture and human capital while raising material welfare.
6
• Living standards need not depend upon production in the same locality; they can be fully “sustained” from sources that look “external” to the national-accounts statistician, so long as those sources are firmly internal to the transnational ethnic unit.
• The home-resident pole’s living standards become unsustainable only if national borders are used to blockade and divide the people as a whole. The ethnic unit should be accounted on the same P&L and balance-sheet basis as any transnational enterprise.
• The most obvious gap in the Stiglitz-Sen report on revising the traditional national-accounting framework is that they focus on measuring happiness within geographically-bounded territories rather than for peoples located across multiple territories.
7
A paradox for Adam Smith and Karl Marx: “Unproductive” Capital is Productive;
“Productive” Capital is Unproductive
• Infrastructure provided direct use values: schools, hospitals, roads, reef passages, ports, airports, water supply, radio links, government buildings …..
• Development-project-related capital was moribund, loss-making, often idle…
• The large weight of the public sector in onshore economies is therefore logical, as is the tendency for the private sector to be located offshore in the diaspora, hence off-the-radar in traditional national accounts
8
Migration-adjusted national income accounting (bringing diasporas into the statistics) is in its infancy and is a rich area for empirical
macroeconomic research
• Kenichi Ueda, Kenichi, 2002, Implications of Migration on Income and Welfare of Nationals, International Monetary Fund Working Paper No. 02/215
• Roberto Cardarelli and Kenichi Ueda, “Domestic and Global Perspectives of Migration to the United States”, in United States: Selected Issues, IMF Country Report 04/228, July 2004, pp.16-29.
• Michael Clemens and Lant Pritchett, “Income per Natural: Measuring Development for People Rather than Places”, Population and Development Review 34(3): 395-434, September 2008
9
Outline of the rest of the paper• How imports are funded (more or less sustainably….)
• Importance of remittances
• How population (including labour, human capital, and entrepreneurship) is allocated across geographic space => island peoples, their societies and economies, are transnational in scope
• Sovereignty is like a tax which places a deadweight burden on prosperity => some sacrifices of sovereignty can have economic and social payoffs
• Ignoring or downplaying the development experience and performance of sub-national jurisdictions is a big analytical mistake
• Some long-run charts on New Zealand’s relationships with the Pacific
10
In terms of the traditional national-accounts approach, imports rule
• The ability to fund imports of goods and services is the key means to the end of sustaining private and public consumption, and hence material welfare, within the geographical territory of an island ‘state’ (including SNJs)
• Getting the imports at least cost (in terms of leisure and social capital) is the strategic game. There are several ways to work on getting the constraint relaxed in practice. Commodity exports are way down the list, for good reason
• The place to start is with the relationship of imports to well-being, and the identification of the components of well-being that are not sustainable by imports.
• Much of the latter has to do with “the village”, its way of life and the problem of how important it is to hold young people in the village economy, and for players in the village to have cash opportunities for sale of products outside.
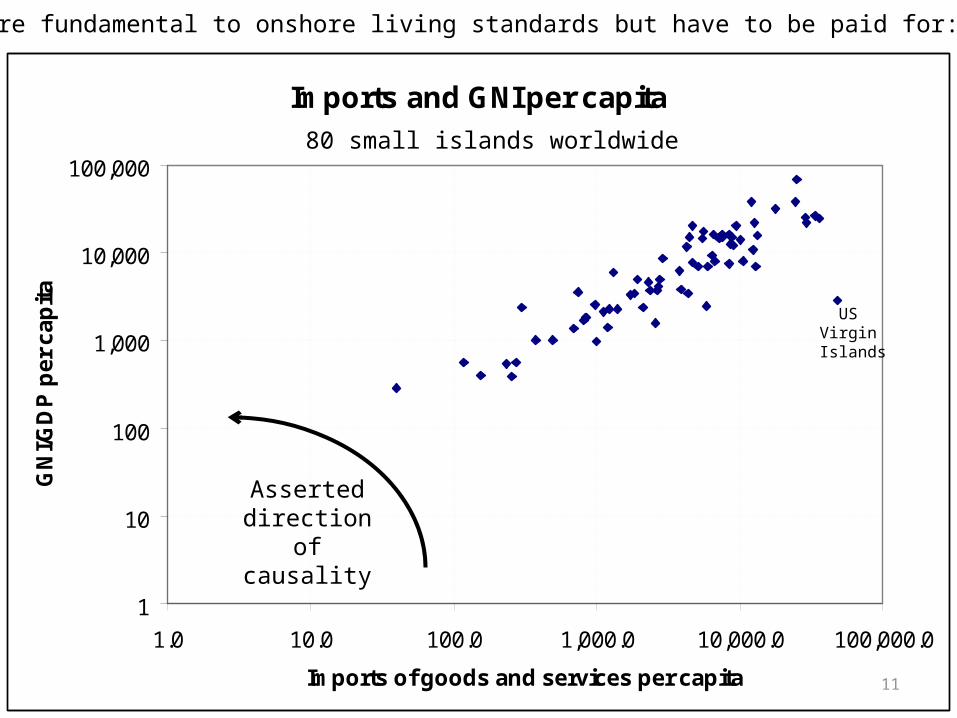
11
Imports and GNI per capita
1
10
100
1,000
10,000
100,000
1.0 10.0 100.0 1,000.0 10,000.0 100,000.0
Imports of goods and services per capita
GN
I/GD
P p
er
ca
pit
a
US Virgin Islands
Imports are fundamental to onshore living standards but have to be paid for:
Asserted direction of
causality
80 small islands worldwide
12
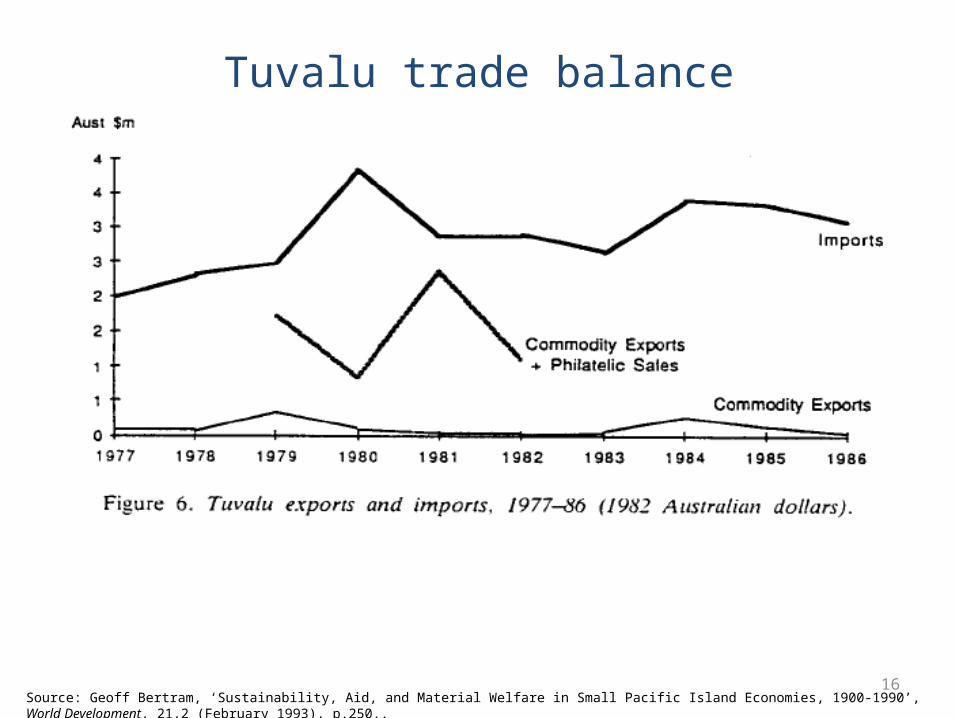
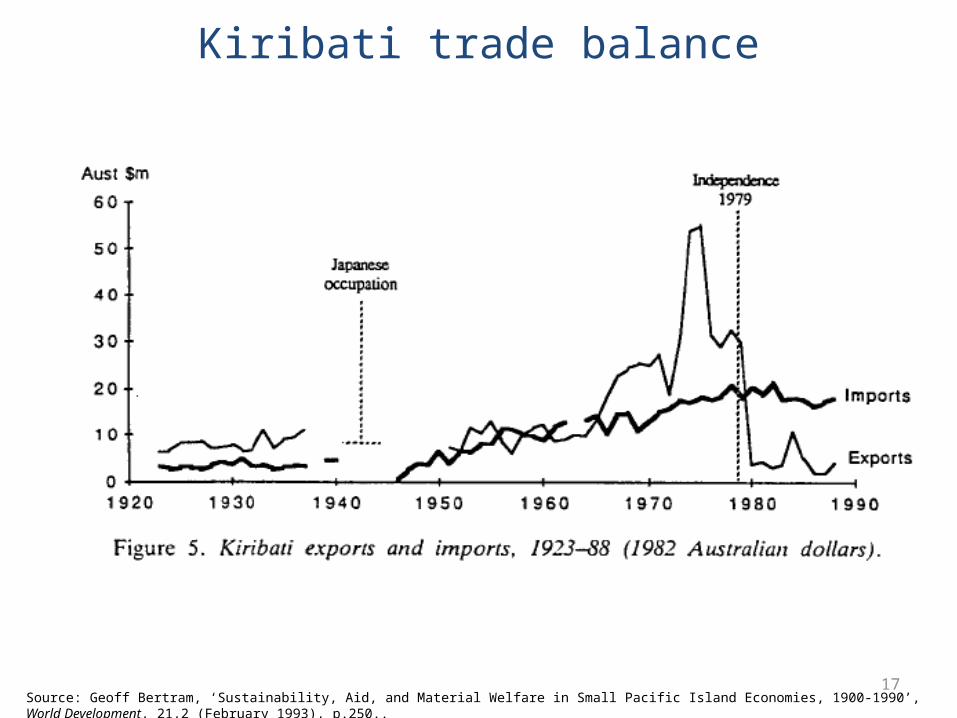
Back in 1984 Ray Watters and I discovered the “jaws effect” in some small Pacific islands
Imports had become disconnected from merchandise exports as the colonial era came
to an end
13
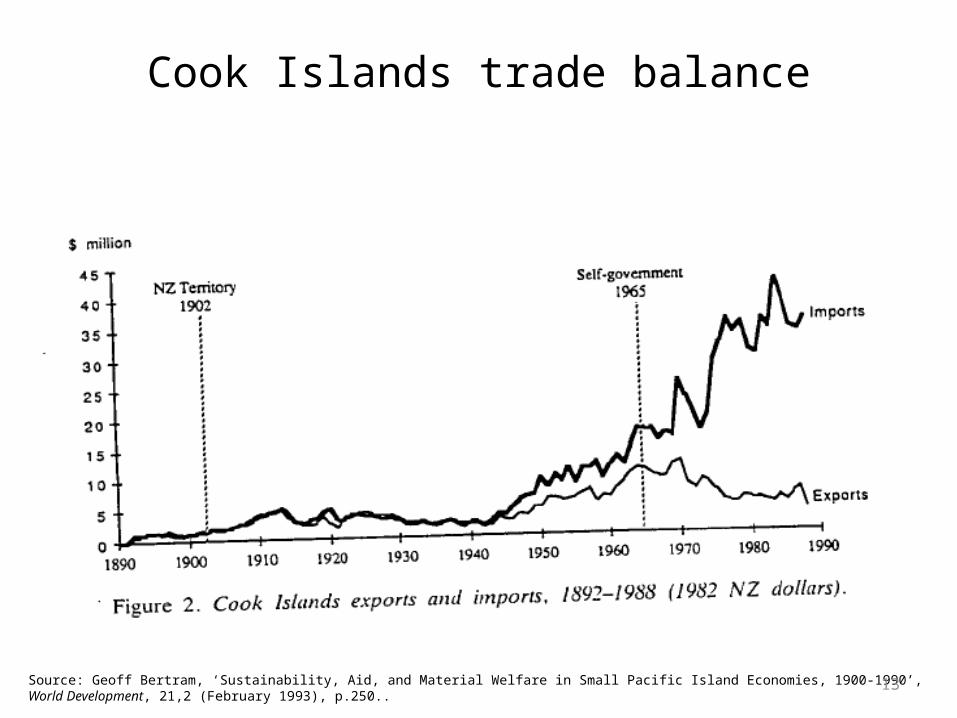
Cook Islands trade balance
Source: Geoff Bertram, ‘Sustainability, Aid, and Material Welfare in Small Pacific Island Economies, 1900-1990’, World Development, 21,2 (February 1993), p.250..
14
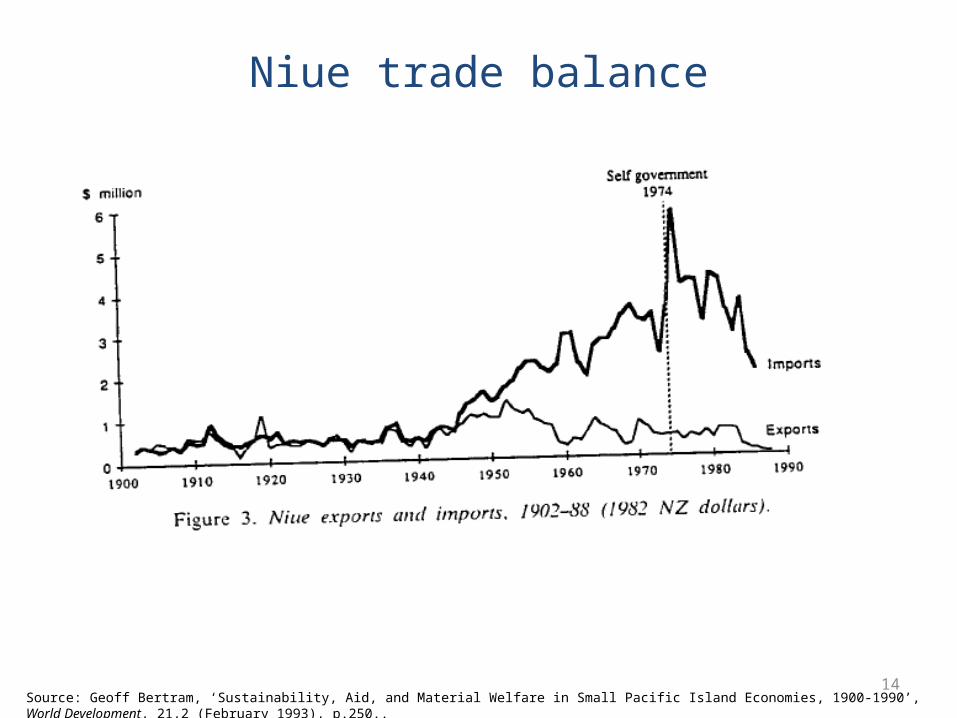
Niue trade balance
Source: Geoff Bertram, ‘Sustainability, Aid, and Material Welfare in Small Pacific Island Economies, 1900-1990’, World Development, 21,2 (February 1993), p.250..
15
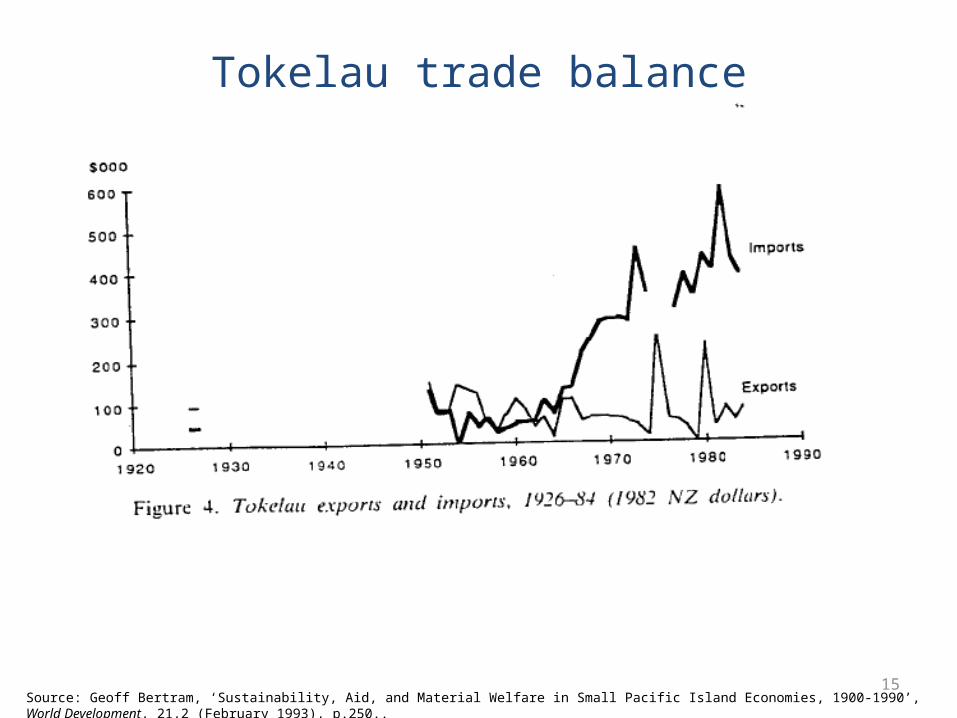
Tokelau trade balance
Source: Geoff Bertram, ‘Sustainability, Aid, and Material Welfare in Small Pacific Island Economies, 1900-1990’, World Development, 21,2 (February 1993), p.250..
16
Tuvalu trade balance
Source: Geoff Bertram, ‘Sustainability, Aid, and Material Welfare in Small Pacific Island Economies, 1900-1990’, World Development, 21,2 (February 1993), p.250..
17
Kiribati trade balance
Source: Geoff Bertram, ‘Sustainability, Aid, and Material Welfare in Small Pacific Island Economies, 1900-1990’, World Development, 21,2 (February 1993), p.250..
18
For us the question this raised was: how was the observed gap being funded
• Not by overseas borrowing – the Pacific has not been a debt-crisis-prone region (the Cook Islands 1988-1996 was the exception to prove the rule)
• Only in a few cases did services exports pick up the funding burden
• In the Pacific, a strong “commercial balance” signals either extreme poverty (PNG, Vanuatu) or special cases (Fiji, American Samoa)
19
How could the trade “jaws” be sustainable without borrowing to fill the gaps?
• Our answer in 1984 was MIRAB
• Two stock-flow relationships were the locomotives of these economies:
– MIR: Stock of overseas migrants => flow of remittances
– AB: Flow of aid => stock of public sector employees (“bureaucrats”)
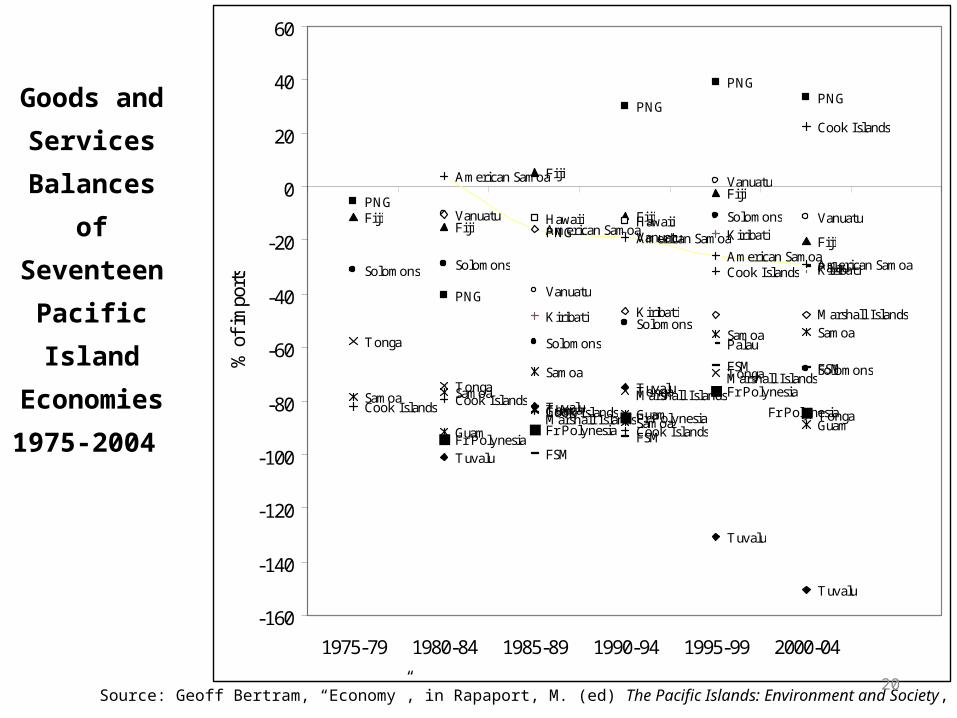
20
Goods and
Services
Balances of
Seventeen
Pacific Island
Economies
1975-2004
FijiFiji
Fiji
Fiji
Fiji
Fiji
PNG
PNG
PNG
PNG
PNGPNG
Solomons Solomons
Solomons
Solomons
Solomons
Solomons
Tonga
Tonga
TongaTonga
Tonga
TongaSamoa Samoa
Samoa
Samoa
Samoa Samoa
Vanuatu
Vanuatu
Vanuatu
Vanuatu
Vanuatu
Kiribati Kiribati
Kiribati
Kiribati
Marshall Islands
Marshall IslandsMarshall Islands
Marshall Islands
FSMFSM
FSM FSM
Tuvalu
Tuvalu
Tuvalu
Tuvalu
Tuvalu
Hawaii Hawaii
American Samoa
American SamoaAmerican Samoa
American SamoaAmerican Samoa
Fr PolynesiaFr Polynesia
Fr Polynesia
Fr Polynesia
Guam
Guam GuamGuam
Cook Islands Cook IslandsCook Islands
Cook Islands
Cook Islands
Cook Islands
Palau
Palau
Fr Polynesia
-160
-140
-120
-100
-80
-60
-40
-20
0
20
40
60
1975-79 1980-84 1985-89 1990-94 1995-99 2000-04
% o
f im
port
s
Source: Geoff Bertram, “Economy”, in Rapaport, M. (ed) The Pacific Islands: Environment and Society, 2nd ed 2011.
21
• Rule 1: don’t get hypnotised by the trade balance (this is the mistake most outside analysts instantly fall into).
• Commercial trade deficits are common and sustained, therefore (to date at least) sustainable.
• None of the countries in that diagram has run up unsustainable international debt – instead, they have sustained their import capacity by means other than conventional exports.
• But it’s true there is a funding constraint driving the market solutions we observe
22
There’s a solid number of MIRAB cases identified in the literature now
• Cook and Kirkpatrick (1998): FSM• Poirine (1998): French Polynesia, US Virgin Is,
Guadeloupe, Martinique, St Perre et Miquelon, Mayotte
• Bertram (1999): Samoa, Tonga, Easter Island, Palau, Marianas
• Royle (2001): St Helena, St Kitts, and the Marshall Islands
• McElroy & Morris (2002): Cape Verde, Comoros, Sao Tome & Principe
23
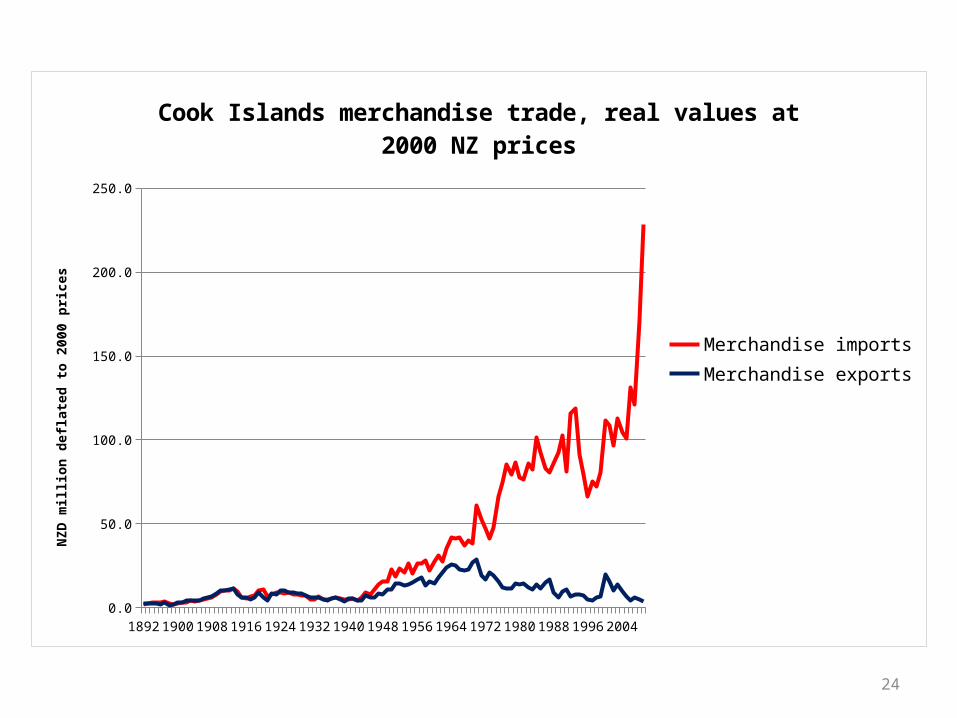
But MIRAB is on;y one of a rich menu of strategic options: sustainable, but optimal in only a few cases
• Two dramatic success stories of transition out of MIRAB status are the Cayman Islands and the Cook Islands
• Consider the Cook Islands case by extending my earlier jaws chart:
24
189218981904191019161922192819341940194619521958196419701976198219881994200020060.0
50.0
100.0
150.0
200.0
250.0
Cook Islands merchandise trade, real values at 2000 NZ prices
Merchandise importsMerchandise exports
NZD
mill
ion
defla
ted
to 2
000
price
s
25
19801984
19881992
19962000
20042008
0.0
50.0
100.0
150.0
200.0
250.0
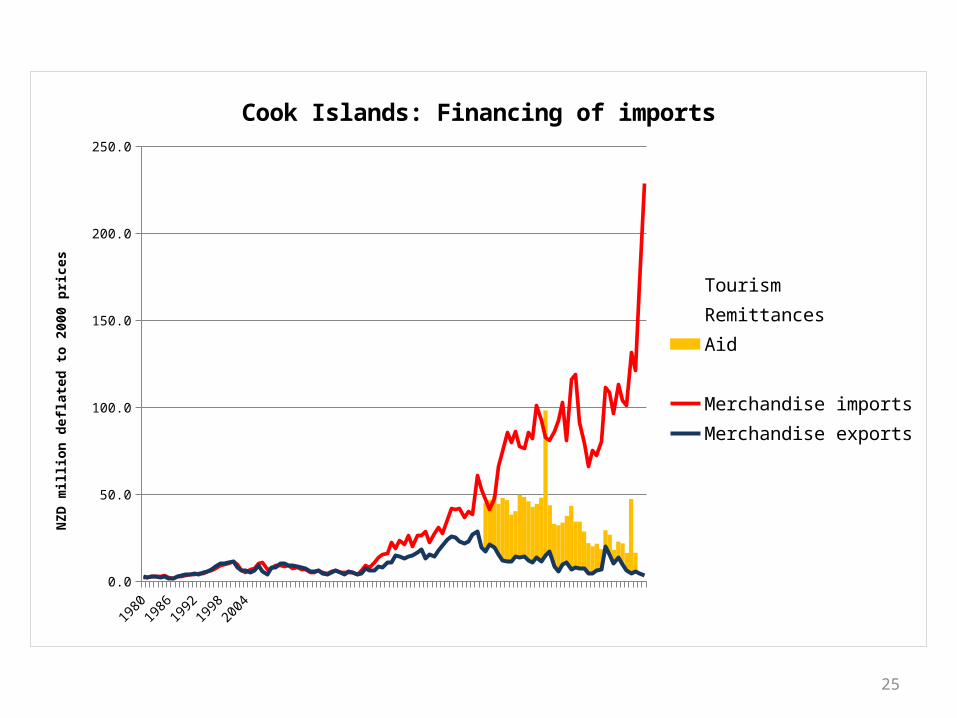
Cook Islands: Financing of imports
TourismRemittancesAid Merchandise importsMerchandise exports
NZD
mill
ion
defla
ted
to 2
000
price
s
26
19801984
19881992
19962000
20042008
0.0
50.0
100.0
150.0
200.0
250.0
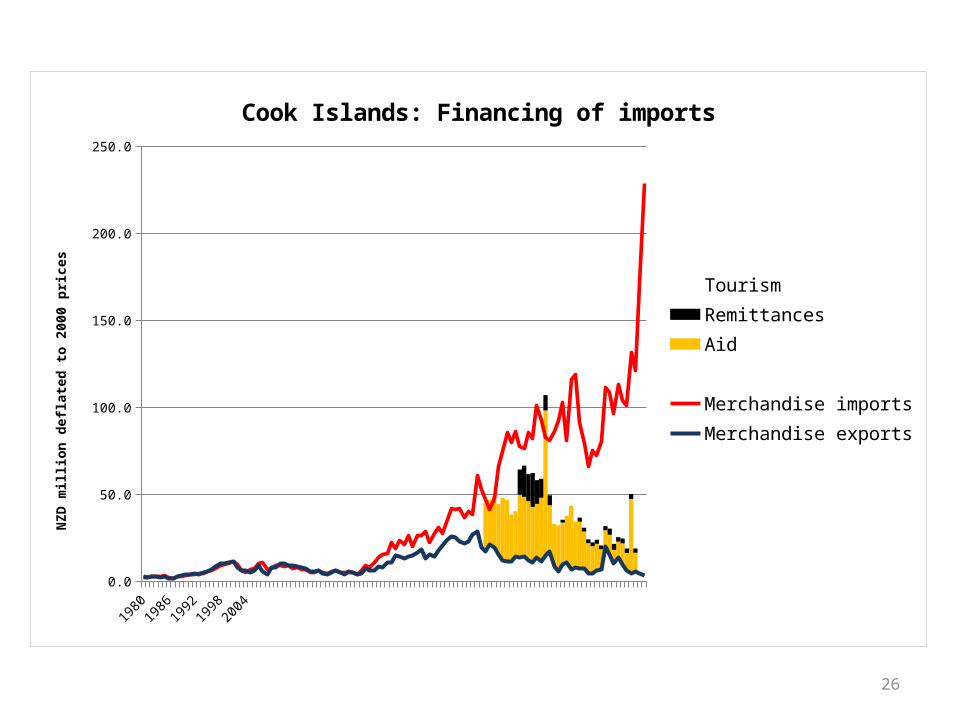
Cook Islands: Financing of imports
TourismRemittancesAid Merchandise importsMerchandise exports
NZD
mill
ion
defla
ted
to 2
000
price
s
27
19801984
19881992
19962000
20042008
0.0
50.0
100.0
150.0
200.0
250.0
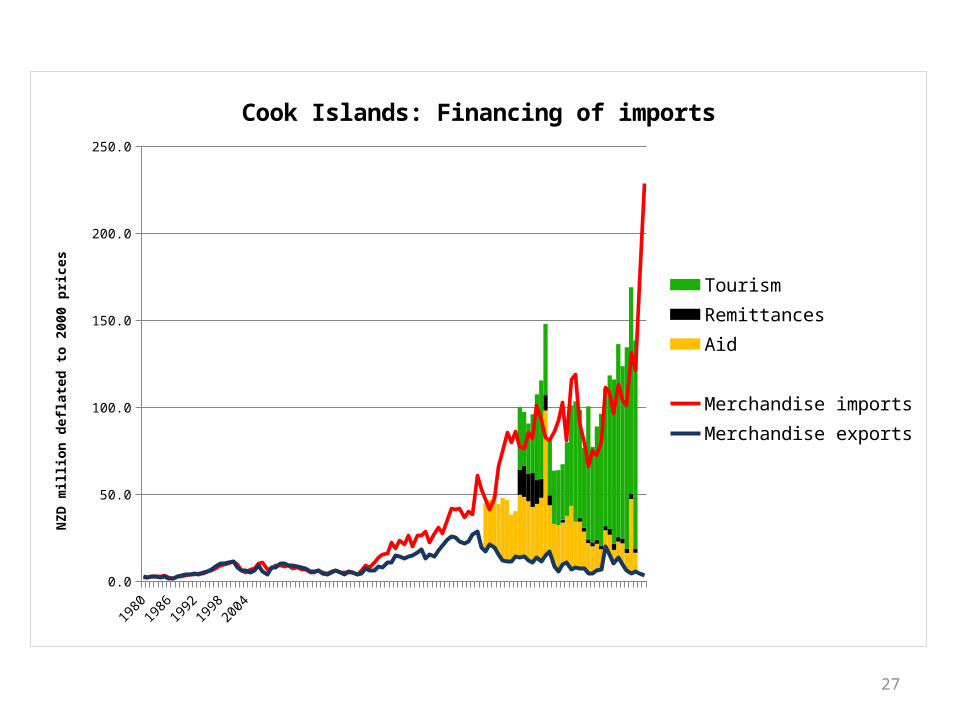
Cook Islands: Financing of imports
TourismRemittancesAid Merchandise importsMerchandise exports
NZD
mill
ion
defla
ted
to 2
000
price
s
28
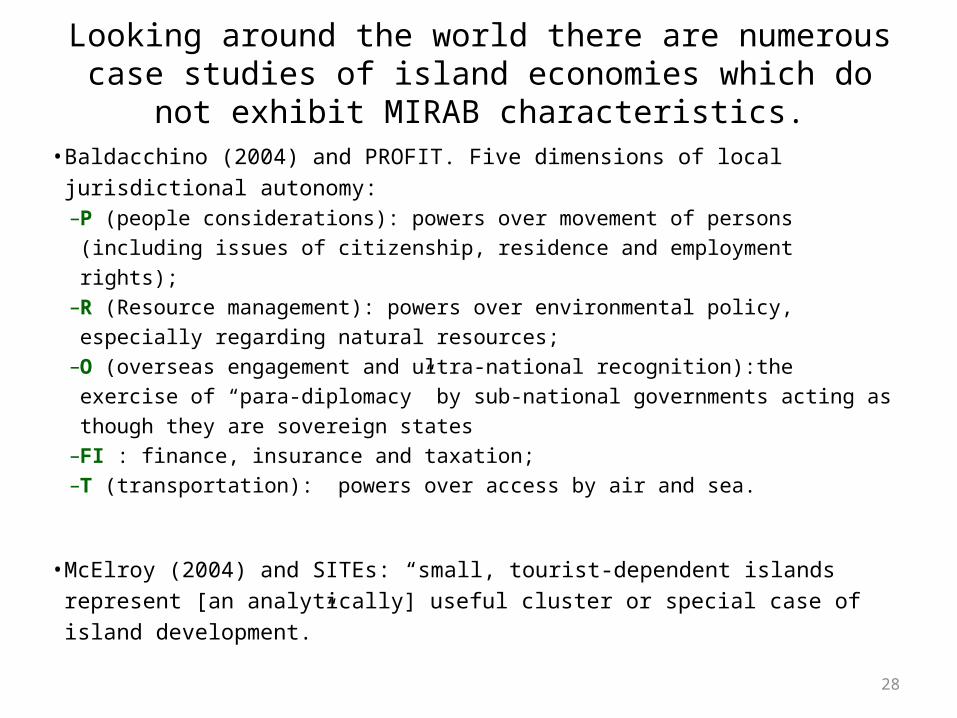
Looking around the world there are numerous case studies of island economies which do not exhibit MIRAB characteristics.
• Baldacchino (2004) and PROFIT. Five dimensions of local jurisdictional autonomy:– P (people considerations): powers over movement of persons (including
issues of citizenship, residence and employment rights);– R (Resource management): powers over environmental policy, especially
regarding natural resources;– O (overseas engagement and ultra-national recognition):the exercise of
“para-diplomacy” by sub-national governments acting as though they are sovereign states
– FI : finance, insurance and taxation;– T (transportation): powers over access by air and sea.
• McElroy (2004) and SITEs: “small, tourist-dependent islands represent [an analytically] useful cluster or special case of island development.”
29
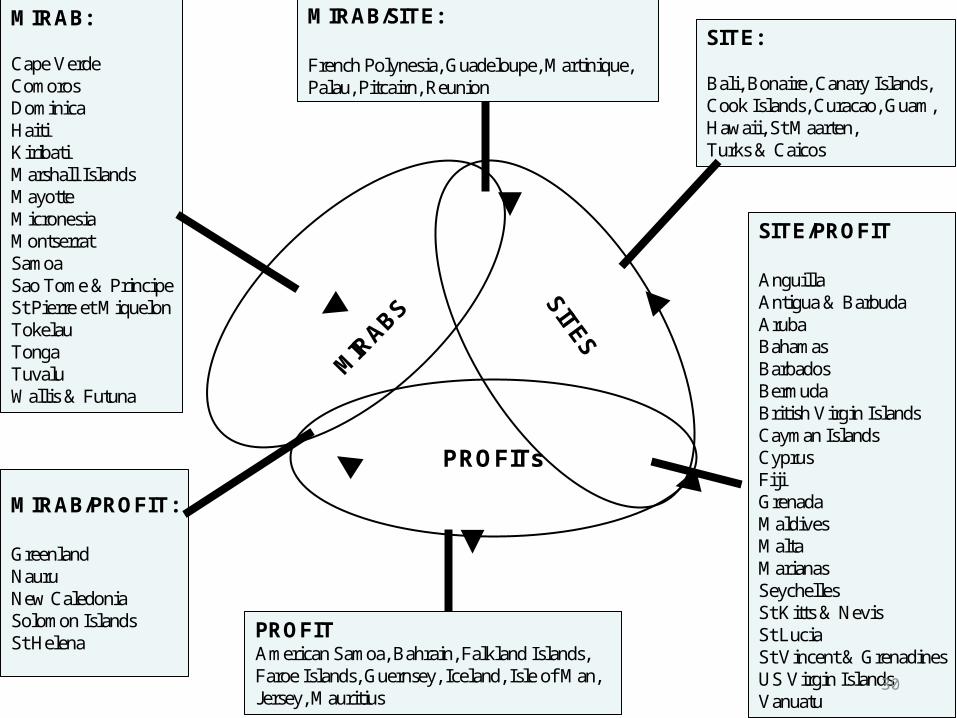
By 2009 Godfrey Baldacchino and I had the following map of the world’s islands in terms of how they paid their way*:
* From G. Baldacchino and G. Bertram, ‘The beak of the finch: insights into the economic development of small economies’, The Round Table, 98, 401 (April 2009), pp.141–160.
30
MIRAB:
Cape VerdeComorosDominicaHaitiKiribatiMarshall IslandsMayotteMicronesiaMontserratSamoaSao Tome & PrincipeSt Pierre et MiquelonTokelauTongaTuvaluWallis & Futuna
SITE:
Bali, Bonaire, Canary Islands,Cook Islands, Curacao, Guam,Hawaii, St Maarten, Turks & Caicos
PROFITAmerican Samoa, Bahrain, Falkland Islands, Faroe Islands, Guernsey, Iceland, Isle of Man, Jersey, Mauritius
PROFITs
MIRAB/SITE:
French Polynesia, Guadeloupe, Martinique,Palau, Pitcairn, Reunion
SITE/PROFIT
AnguillaAntigua & BarbudaArubaBahamasBarbadosBermudaBritish Virgin IslandsCayman IslandsCyprusFijiGrenadaMaldivesMaltaMarianasSeychellesSt Kitts & NevisSt LuciaSt Vincent & GrenadinesUS Virgin IslandsVanuatu
MIRAB/PROFIT:
GreenlandNauruNew CaledoniaSolomon IslandsSt Helena
MIR
ABSSITES
31
• What’s special about small-island speciation is that islands make evolutionary switches around the diagram
• Niches are partly exogenous and partly endogenous (created by strategic behaviour)
• Selection is partly by chance, but largely by collective response to incentives
32
Sustaining imports requires some source of funding, but not necessarily “trade balance” with exports ramped up to equal
imports.
• Balance-of-payments current account equilibrium and reasonable living standards can be sustained with very low commodity exports, as Tuvalu dramatically illustrates.
• Diagnosis requires that the funding flows be
identified, quantified, and viewed from a dynamic long-run perspective. A recent attempt at doing this is Bertram and Poirine (2007)
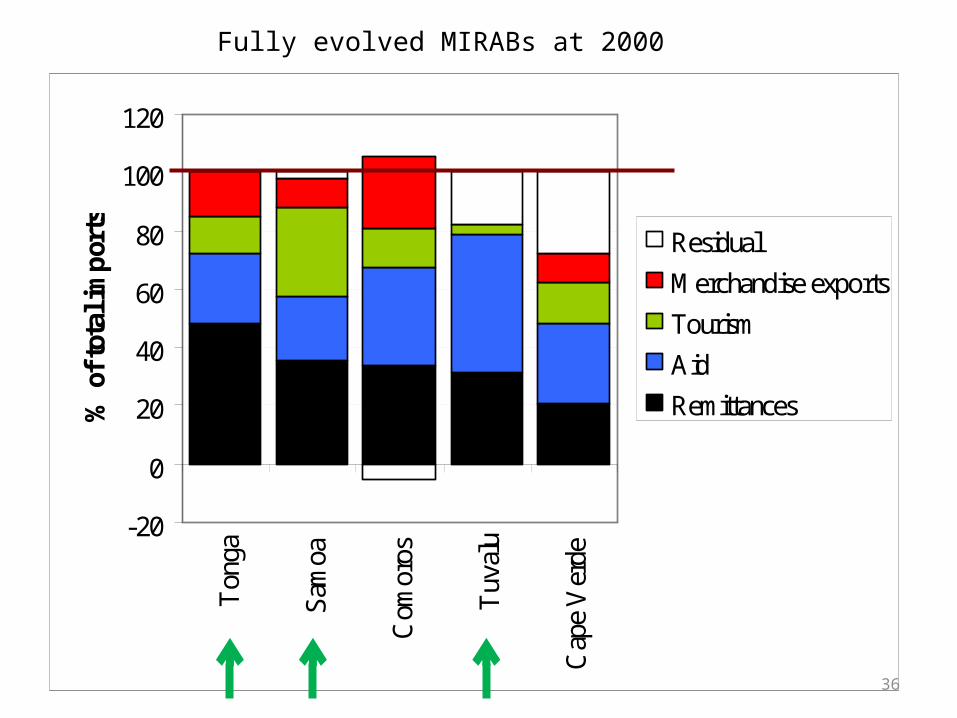
33
Bernard Poirine and I did a number-crunching exercise for 71 island economies to produce a more
detailed story*
Conclusion: there are many ways to play the game depending what hand has been dealt….
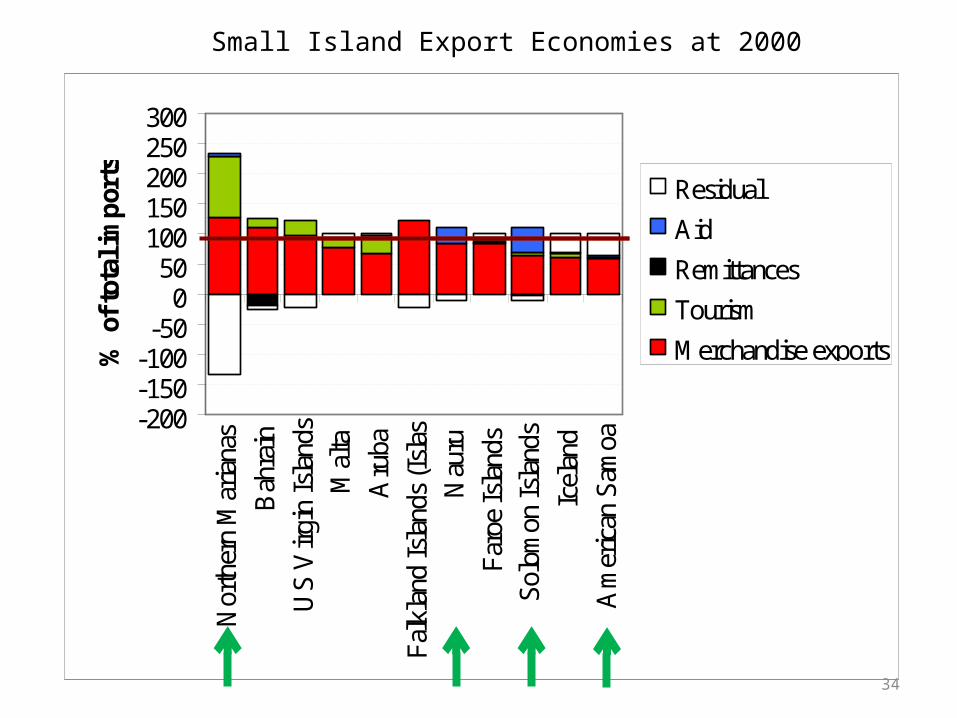
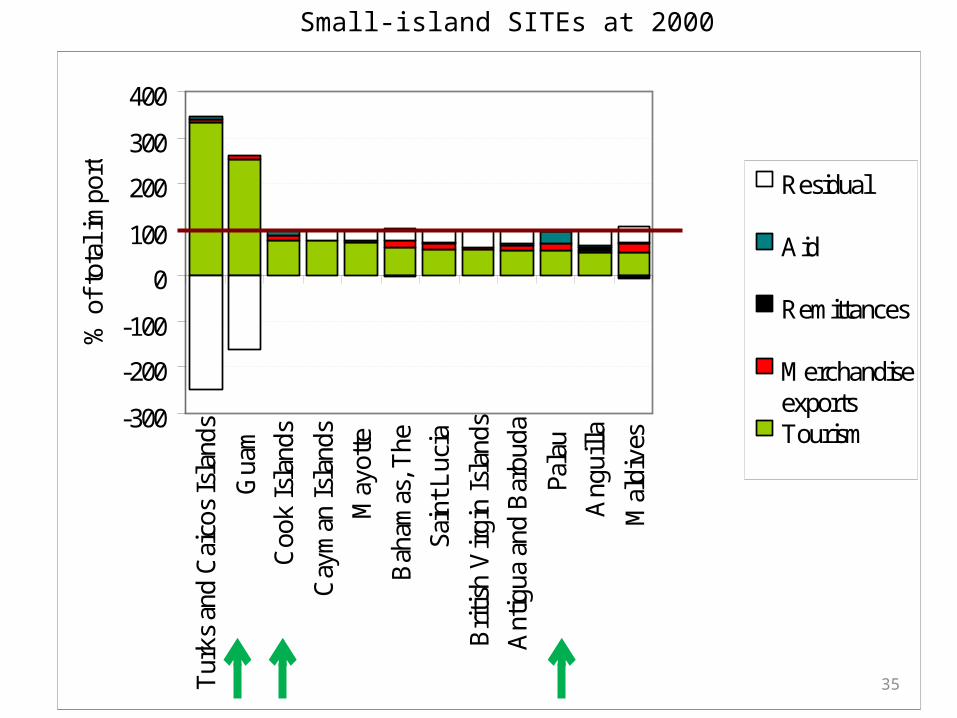
(arrows in each diagram identify Pacific economies)
‘Island Political Economy’, Chapter 10 in Baldacchino, G. (ed.) A World of Islands, Institute of Island Studies, University of Prince Edward Island, 2007, pp.325-377.
34
-200-150-100
-500
50100150200250300
Nor
ther
n M
aria
nas
Bah
rain
US
Vir
gin
Isla
nds
Mal
ta
Aru
ba
Fal
klan
d Is
land
s (I
slas
Nau
ru
Far
oe I
slan
dsS
olom
on I
slan
ds
Icel
and
Am
eric
an S
amoa
% o
f to
tal i
mp
orts
Residual
Aid
Remittances
Tourism
Merchandise exports
Small Island Export Economies at 2000
35
-300
-200
-100
0
100
200
300
400
Tur
ks a
nd C
aico
s Is
land
s
Gua
m
Coo
k Is
land
s
Cay
man
Isl
ands
May
otte
Bah
amas
, The
Sain
t Luc
ia
Bri
tish
Vir
gin
Isla
nds
Ant
igua
and
Bar
buda
Pala
u
Ang
uilla
Mal
dive
s
% o
f to
tal i
mpo
rts
Residual
Aid
Remittances
MerchandiseexportsTourism
Small-island SITEs at 2000
36
-20
0
20
40
60
80
100
120
Ton
ga
Sam
oa
Com
oros
Tuv
alu
Cap
e V
erde
% o
f to
tal i
mp
orts
Residual
Merchandise exports
Tourism
Aid
Remittances
Fully evolved MIRABs at 2000
37
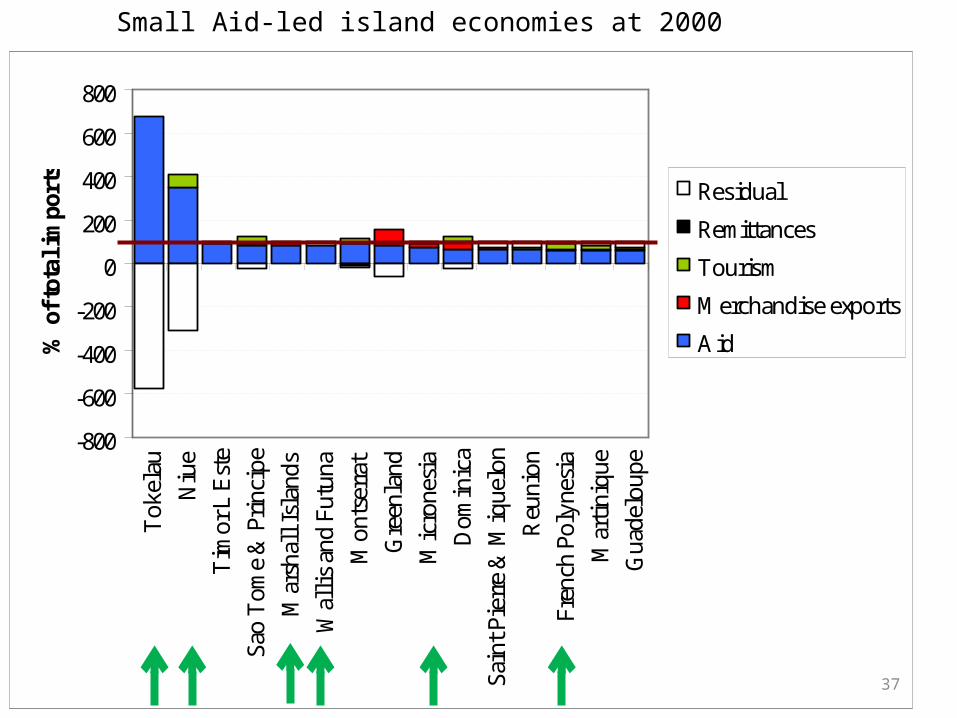
Small Aid-led island economies at 2000
-800
-600
-400
-200
0
200
400
600
800
Tok
elau
Niu
e
Tim
or L
'Est
e
Sao
Tom
e &
Pri
ncip
e
Mar
shal
l Isl
ands
Wal
lis
and
Futu
na
Mon
tser
rat
Gre
enla
nd
Mic
rone
sia
Dom
inic
a
Sain
t Pie
rre
& M
ique
lon
Reu
nion
Fren
ch P
olyn
esia
Mar
tini
que
Gua
delo
upe
% o
f tot
al im
port
s
Residual
Remittances
Tourism
Merchandise exports
Aid
38
-40
-20
0
20
40
60
80
100
120
140
Ber
mud
a
Kir
ibat
i
Sain
t Kit
ts a
ndN
evis Cyp
rus
Van
uatu
% o
f tot
al im
port
s
Remittances
Merchandise exports
Aid
Tourism
Residual
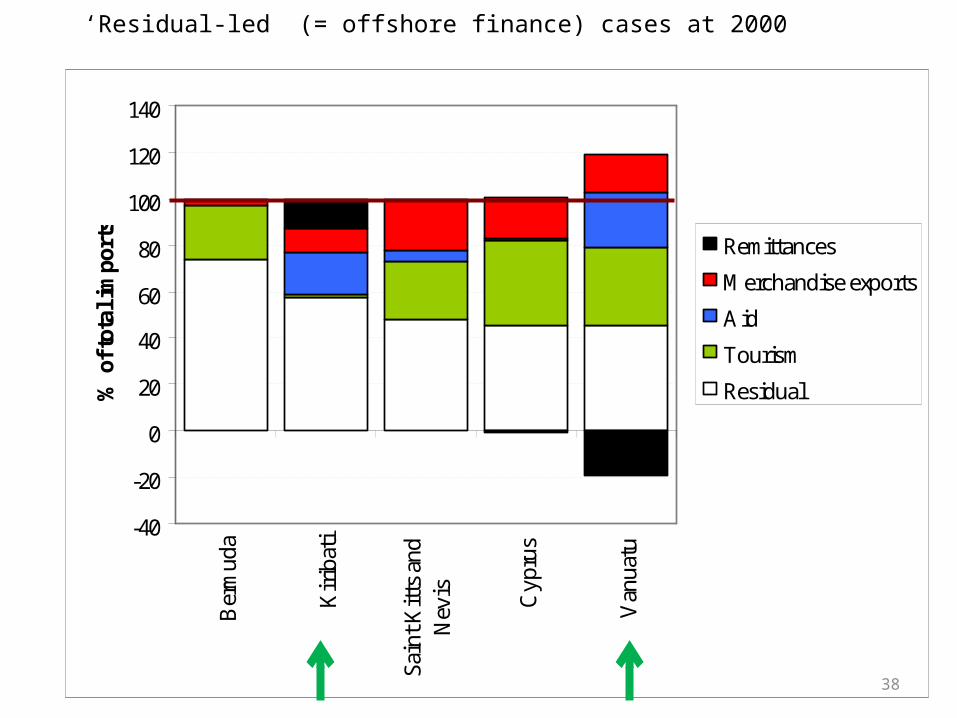
‘Residual-led” (= offshore finance) cases at 2000
39
BERCAY
BVI
CYPNTA
ANG
ANTSTKSTVBAH
VAN
HAW
GUM
TURBAR
NAU
TRI
BAH
PUEMLTUSVNZLARU
SINICE
GRN
NCA
FALFAR
MAR
FRP
SPM
REU
NIU
FSM
TOKMAY
RMI
GUA
CAN
STLPALCKI
GRE
MAL
CUB
JAMFIJ
MAUSEY
NMI
KIR
HAI
DOMSTP
TUV
TGA
WAL
SAM
COM
MON
MDGSOL
SRI
DMR
AMS
STH
0.00
0.20
0.40
0.60
0.80
1.00
1.20
1.40
1.60
1.80
2.00In
dex
of
inco
me
and
lif
e ex
pec
tan
cy
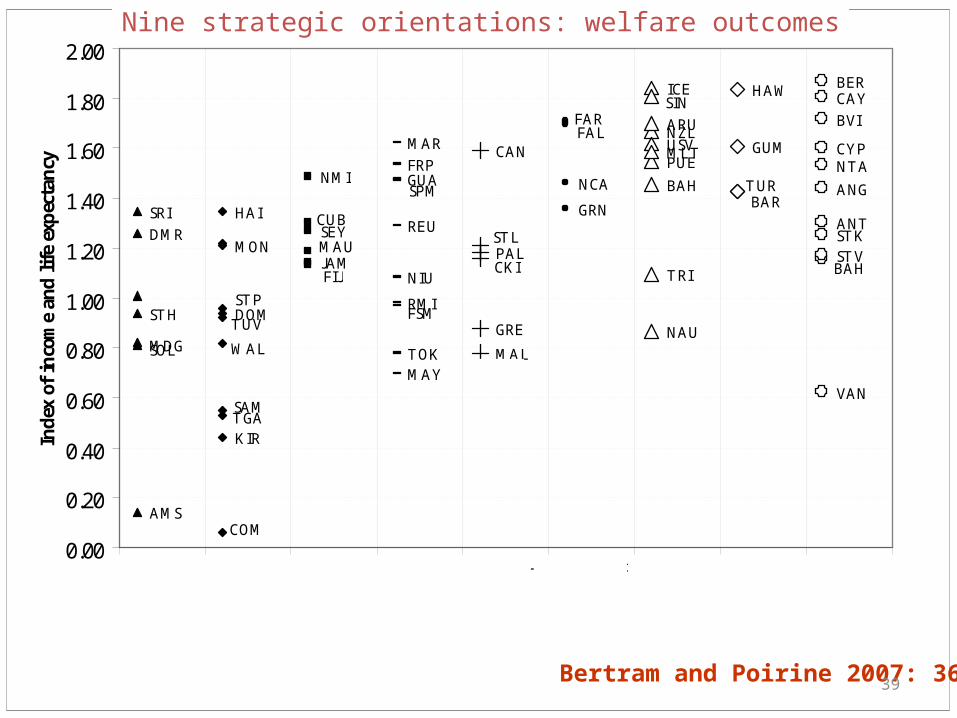
High-value
exports
Moderate-impact tourism
Offshore finance
plus tourism
High-impact tourism
Geostrategic rent with exports
Geostrategic aid
Tourism plus
exports
Primary exports with aid and/or
remittance support
Non-geostr-ategic
MIRABs
TUV
Bertram and Poirine 2007: 361
Nine strategic orientations: welfare outcomes
40
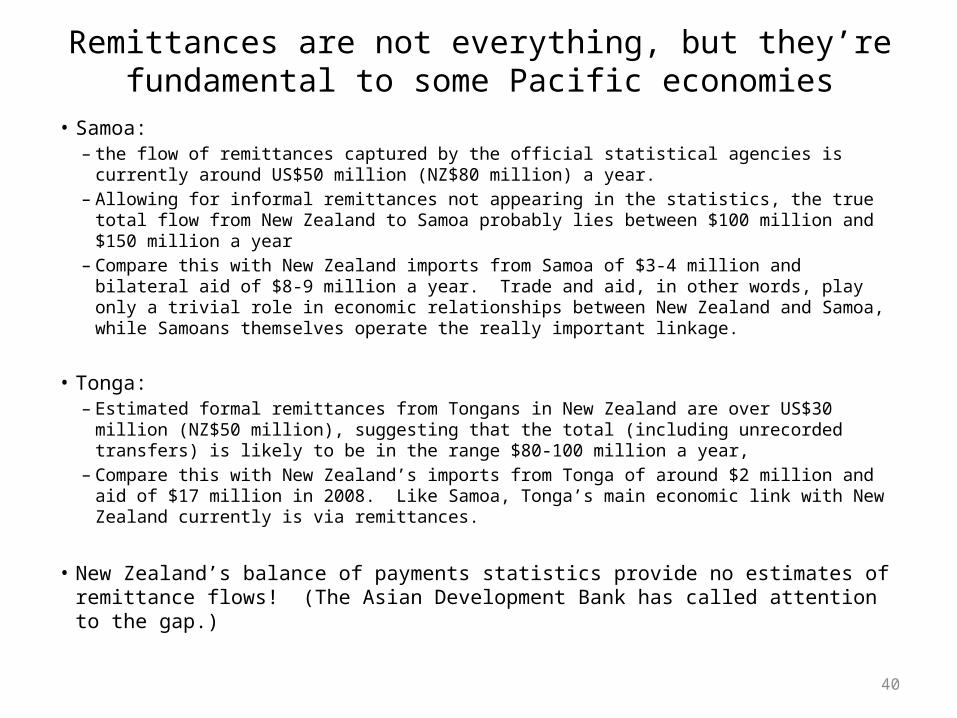
Remittances are not everything, but they’re fundamental to some Pacific economies
• Samoa: – the flow of remittances captured by the official statistical agencies is currently around US$50
million (NZ$80 million) a year. – Allowing for informal remittances not appearing in the statistics, the true total flow from New
Zealand to Samoa probably lies between $100 million and $150 million a year– Compare this with New Zealand imports from Samoa of $3-4 million and bilateral aid of $8-9
million a year. Trade and aid, in other words, play only a trivial role in economic relationships between New Zealand and Samoa, while Samoans themselves operate the really important linkage.
• Tonga: – Estimated formal remittances from Tongans in New Zealand are over US$30 million (NZ$50
million), suggesting that the total (including unrecorded transfers) is likely to be in the range $80-100 million a year,
– Compare this with New Zealand’s imports from Tonga of around $2 million and aid of $17 million in 2008. Like Samoa, Tonga’s main economic link with New Zealand currently is via remittances.
• New Zealand’s balance of payments statistics provide no estimates of remittance flows! (The Asian Development Bank has called attention to the gap.)
41
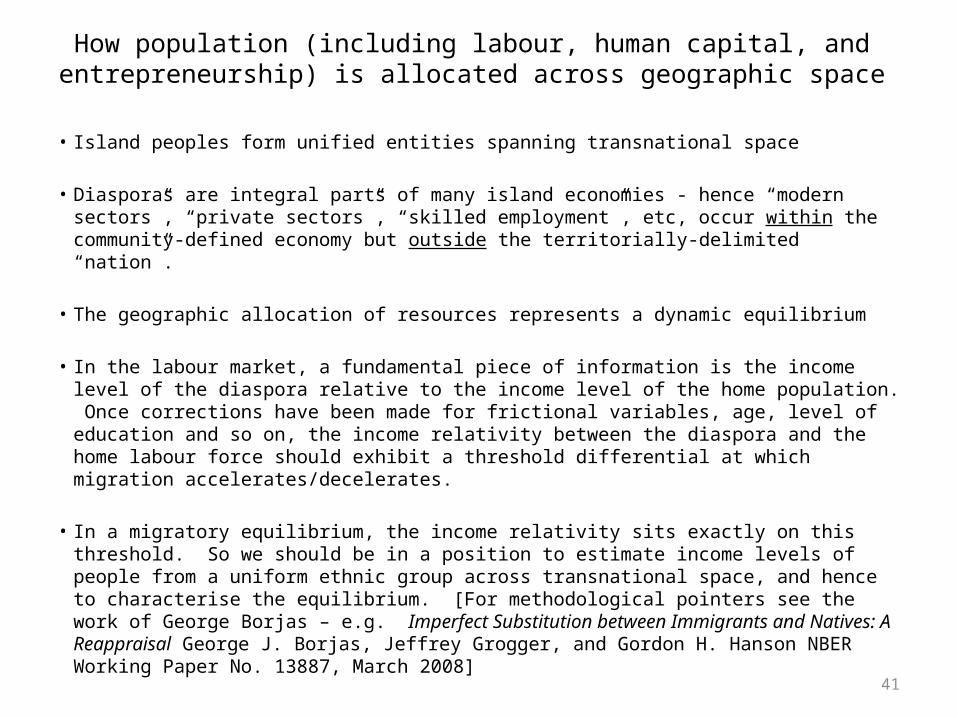
How population (including labour, human capital, and entrepreneurship) is allocated across geographic space
• Island peoples form unified entities spanning transnational space
• Diasporas are integral parts of many island economies - hence “modern sectors”, “private sectors”, “skilled employment”, etc, occur within the community-defined economy but outside the territorially-delimited “nation”.
• The geographic allocation of resources represents a dynamic equilibrium
• In the labour market, a fundamental piece of information is the income level of the diaspora relative to the income level of the home population. Once corrections have been made for frictional variables, age, level of education and so on, the income relativity between the diaspora and the home labour force should exhibit a threshold differential at which migration accelerates/decelerates.
• In a migratory equilibrium, the income relativity sits exactly on this threshold. So we should be in a position to estimate income levels of people from a uniform ethnic group across transnational space, and hence to characterise the equilibrium. [For methodological pointers see the work of George Borjas – e.g. Imperfect Substitution between Immigrants and Natives: A Reappraisal George J. Borjas, Jeffrey Grogger, and Gordon H. Hanson NBER Working Paper No. 13887, March 2008]
42
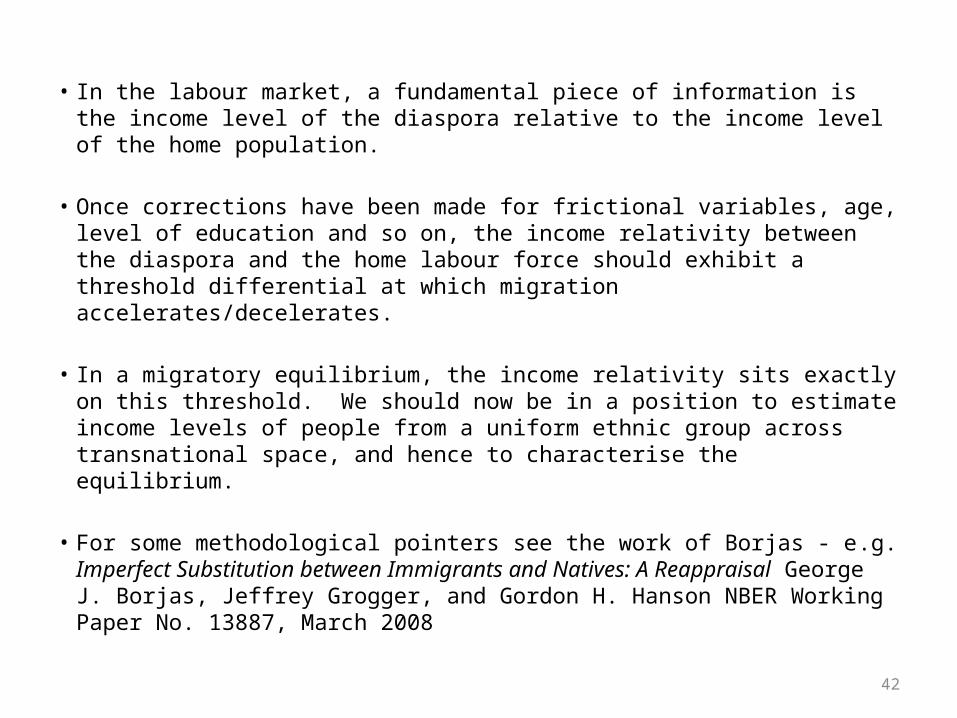
• In the labour market, a fundamental piece of information is the income level of the diaspora relative to the income level of the home population.
• Once corrections have been made for frictional variables, age, level of education and so on, the income relativity between the diaspora and the home labour force should exhibit a threshold differential at which migration accelerates/decelerates.
• In a migratory equilibrium, the income relativity sits exactly on this threshold. We should now be in a position to estimate income levels of people from a uniform ethnic group across transnational space, and hence to characterise the equilibrium.
• For some methodological pointers see the work of Borjas - e.g. Imperfect Substitution between Immigrants and Natives: A Reappraisal George J. Borjas, Jeffrey Grogger, and Gordon H. Hanson NBER Working Paper No. 13887, March 2008
43
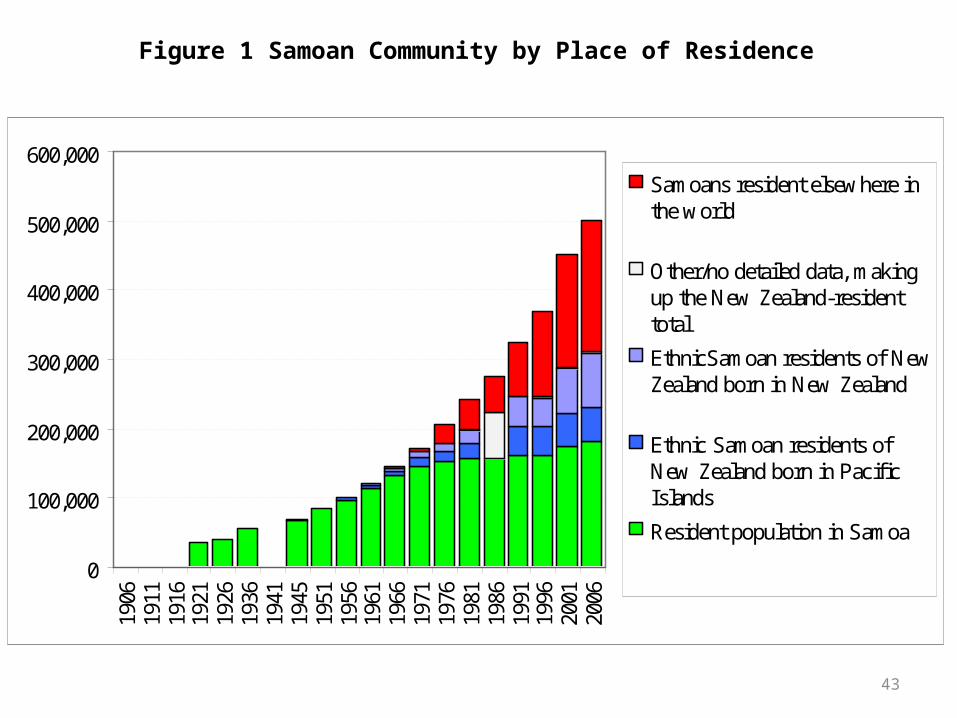
Figure 1 Samoan Community by Place of Residence
0
100,000
200,000
300,000
400,000
500,000
600,00019
0619
1119
1619
2119
2619
3619
4119
4519
5119
5619
6119
6619
7119
7619
8119
8619
9119
9620
0120
06
Samoans resident elsewhere inthe world
Other/no detailed data, makingup the New Zealand-residenttotal
EthnicSamoan residents of NewZealand born in New Zealand
Ethnic Samoan residents ofNew Zealand born in PacificIslands
Resident population in Samoa
44
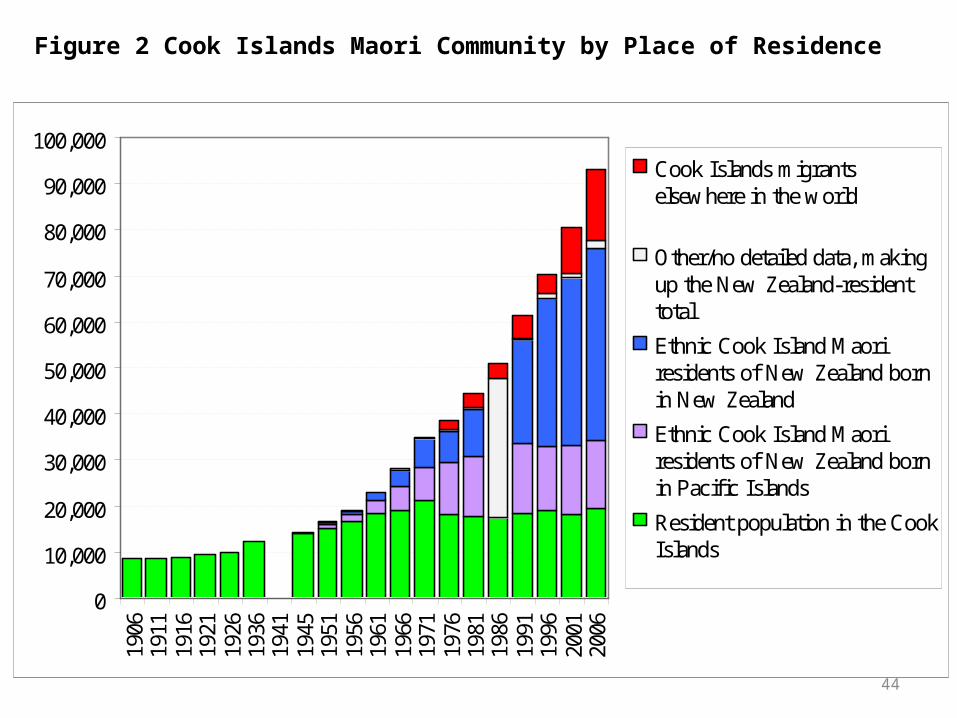
Figure 2 Cook Islands Maori Community by Place of Residence
0
10,000
20,000
30,000
40,000
50,000
60,000
70,000
80,000
90,000
100,00019
0619
1119
1619
2119
2619
3619
4119
4519
5119
5619
6119
6619
7119
7619
8119
8619
9119
9620
0120
06
Cook Islands migrantselsewhere in the world
Other/no detailed data, makingup the New Zealand-residenttotal
Ethnic Cook Island Maoriresidents of New Zealand bornin New Zealand
Ethnic Cook Island Maoriresidents of New Zealand bornin Pacific Islands
Resident population in the CookIslands
45
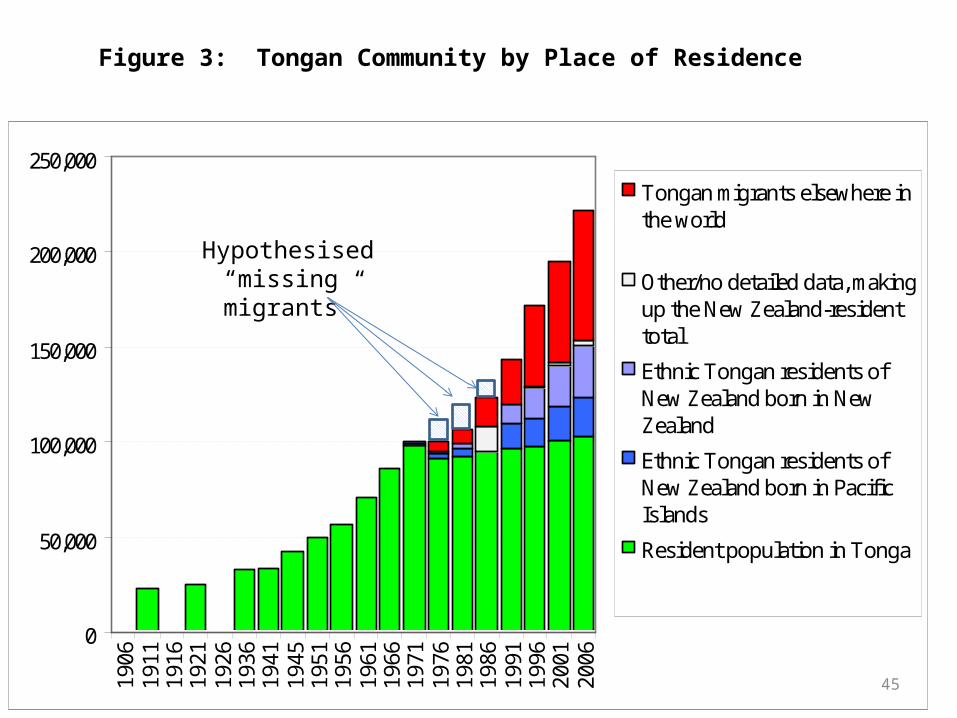
Figure 3: Tongan Community by Place of Residence
0
50,000
100,000
150,000
200,000
250,000
1906
1911
1916
1921
1926
1936
1941
1945
1951
1956
1961
1966
1971
1976
1981
1986
1991
1996
2001
2006
Tongan migrants elsewhere inthe world
Other/no detailed data, makingup the New Zealand-residenttotal
Ethnic Tongan residents ofNew Zealand born in NewZealand
Ethnic Tongan residents ofNew Zealand born in PacificIslands
Resident population in Tonga
Hypothesised “missing migrants”
46
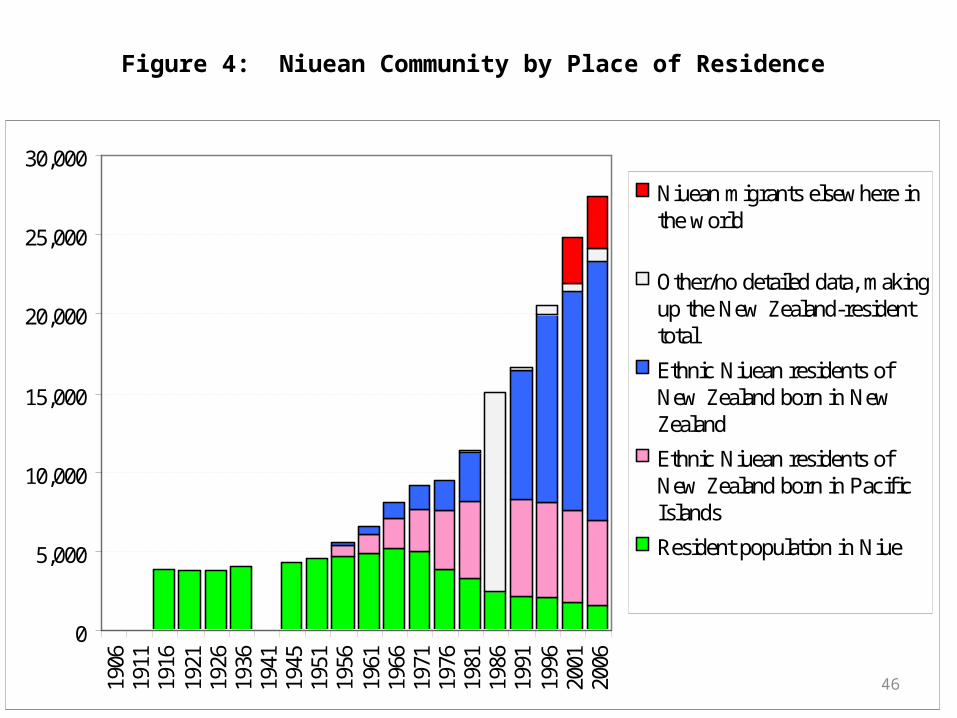
Figure 4: Niuean Community by Place of Residence
0
5,000
10,000
15,000
20,000
25,000
30,000
1906
1911
1916
1921
1926
1936
1941
1945
1951
1956
1961
1966
1971
1976
1981
1986
1991
1996
2001
2006
Niuean migrants elsewhere inthe world
Other/no detailed data, makingup the New Zealand-residenttotal
Ethnic Niuean residents ofNew Zealand born in NewZealand
Ethnic Niuean residents ofNew Zealand born in PacificIslands
Resident population in Niue
47
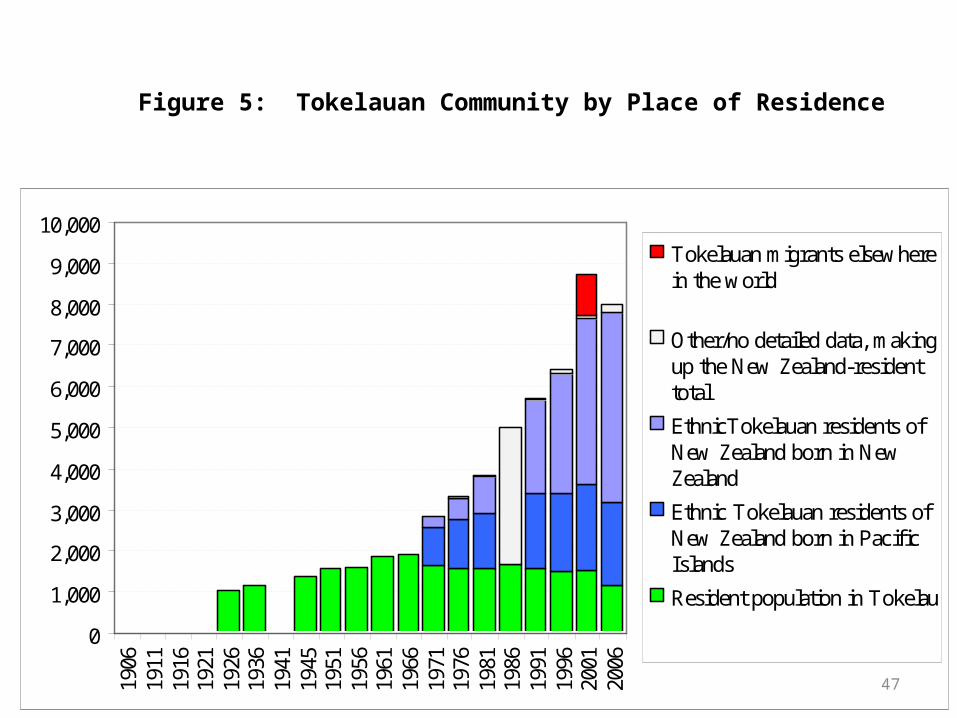
Figure 5: Tokelauan Community by Place of Residence
0
1,000
2,000
3,000
4,000
5,000
6,000
7,000
8,000
9,000
10,000
1906
1911
1916
1921
1926
1936
1941
1945
1951
1956
1961
1966
1971
1976
1981
1986
1991
1996
2001
2006
Tokelauan migrants elsewherein the world
Other/no detailed data, makingup the New Zealand-residenttotal
EthnicTokelauan residents ofNew Zealand born in NewZealand
Ethnic Tokelauan residents ofNew Zealand born in PacificIslands
Resident population in Tokelau
48
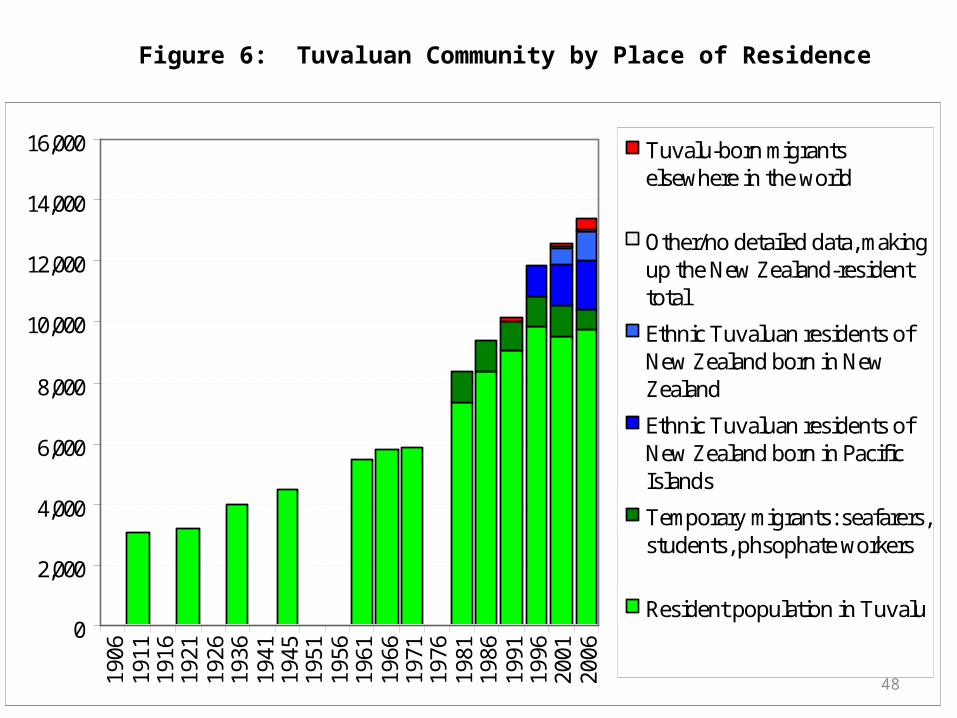
Figure 6: Tuvaluan Community by Place of Residence
0
2,000
4,000
6,000
8,000
10,000
12,000
14,000
16,00019
0619
1119
1619
2119
2619
3619
4119
4519
5119
5619
6119
6619
7119
7619
8119
8619
9119
9620
0120
06
Tuvalu-born migrantselsewhere in the world
Other/no detailed data, makingup the New Zealand-residenttotal
Ethnic Tuvaluan residents ofNew Zealand born in NewZealand
Ethnic Tuvaluan residents ofNew Zealand born in PacificIslands
Temporary migrants: seafarers,students, phsophate workers
Resident population in Tuvalu
49
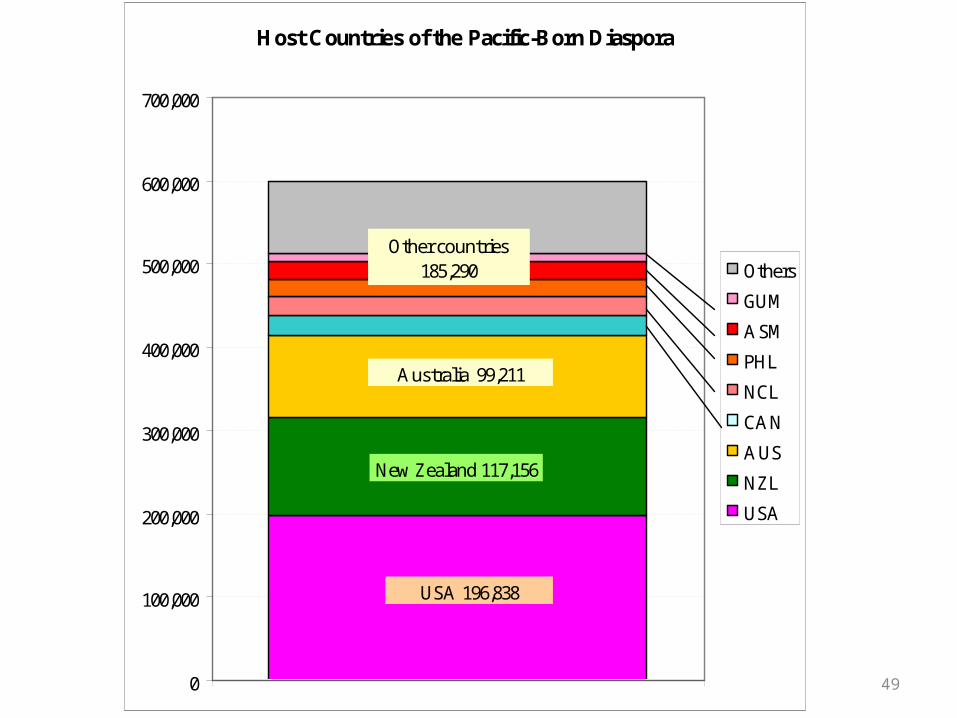
Host Countries of the Pacific-Born Diaspora
0
100,000
200,000
300,000
400,000
500,000
600,000
700,000
Others
GUM
ASM
PHL
NCL
CAN
AUS
NZL
USA
USA 196,838
Australia 99,211
Other countries185,290
New Zealand 117,156
50
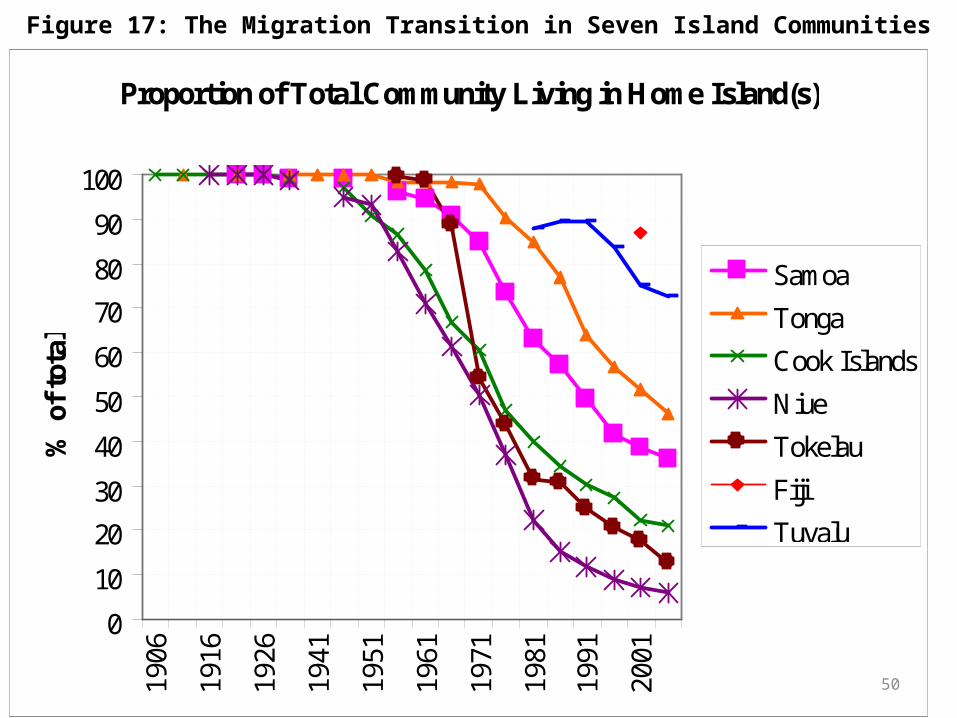
Figure 17: The Migration Transition in Seven Island Communities
Proportion of Total Community Living in Home Island(s)
0
10
20
30
40
50
60
70
80
90
10019
06
1916
1926
1941
1951
1961
1971
1981
1991
2001
% o
f to
tal
Samoa
Tonga
Cook Islands
Niue
Tokelau
Fiji
Tuvalu
51
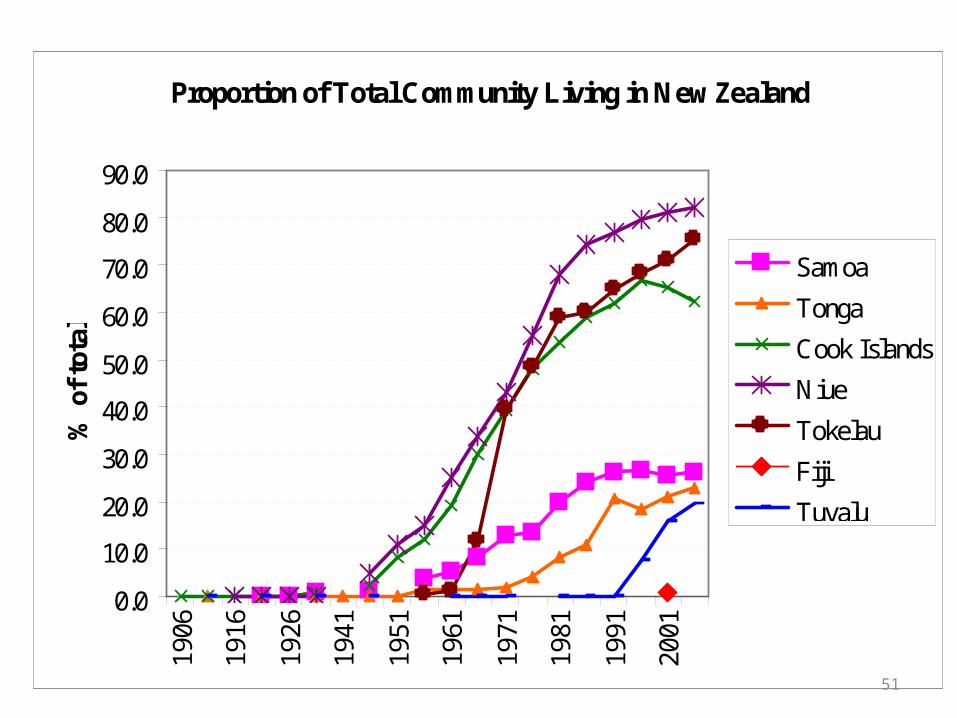
Proportion of Total Community Living in New Zealand
0.0
10.0
20.0
30.0
40.0
50.0
60.0
70.0
80.0
90.019
06
1916
1926
1941
1951
1961
1971
1981
1991
2001
% o
f to
tal
Samoa
Tonga
Cook Islands
Niue
Tokelau
Fiji
Tuvalu
52
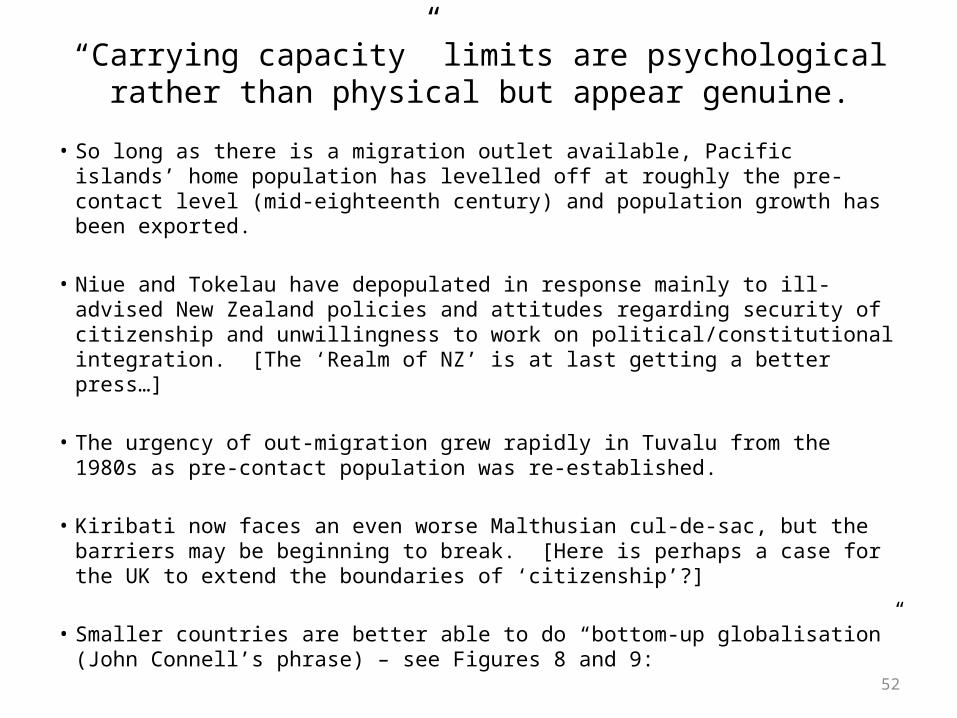
“Carrying capacity” limits are psychological rather than physical but appear genuine.
• So long as there is a migration outlet available, Pacific islands’ home population has levelled off at roughly the pre-contact level (mid-eighteenth century) and population growth has been exported.
• Niue and Tokelau have depopulated in response mainly to ill-advised New Zealand policies and attitudes regarding security of citizenship and unwillingness to work on political/constitutional integration. [The ‘Realm of NZ’ is at last getting a better press…]
• The urgency of out-migration grew rapidly in Tuvalu from the 1980s as pre-contact population was re-established.
• Kiribati now faces an even worse Malthusian cul-de-sac, but the barriers may be beginning to break. [Here is perhaps a case for the UK to extend the boundaries of ‘citizenship’?]
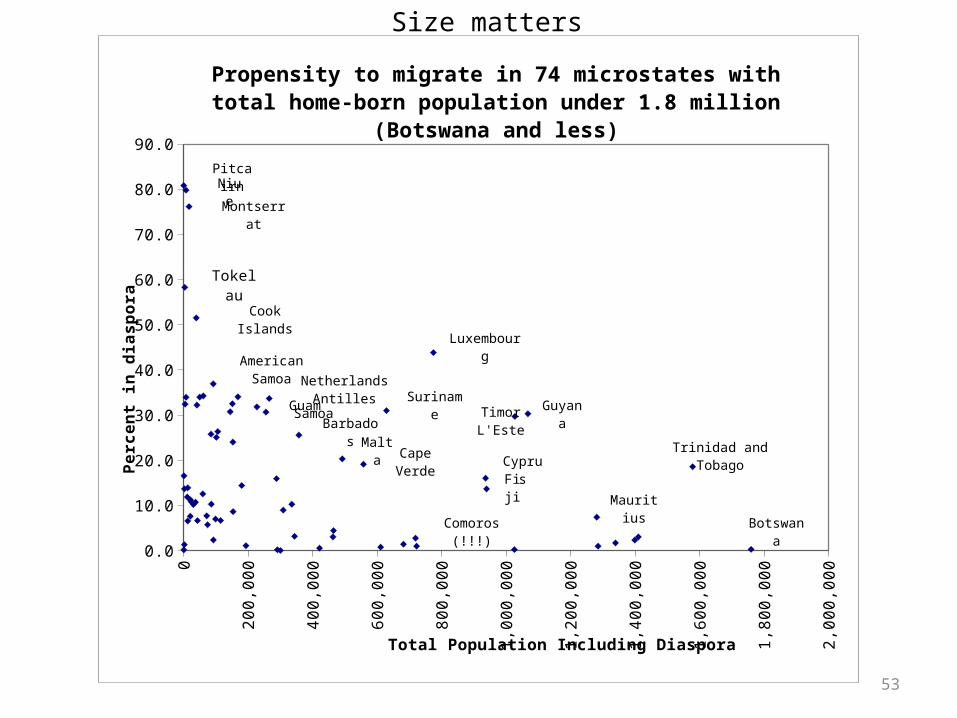
• Smaller countries are better able to do “bottom-up globalisation” (John Connell’s phrase) – see Figures 8 and 9:
53
0
200,
000
400,
000
600,
000
800,
000
1,00
0,00
0
1,20
0,00
0
1,40
0,00
0
1,60
0,00
0
1,80
0,00
0
2,00
0,00
0
0.0
10.0
20.0
30.0
40.0
50.0
60.0
70.0
80.0
90.0
Propensity to migrate in 74 microstates with total home-born population under 1.8 million (Botswana and less)
Total Population Including Diaspora
Per
cen
t in
dia
spor
a
Luxembourg
GuyanaTimor L'Este
Trinidad and Tobago
Montserrat
PitcairnNiue
Tokelau
Cook Islands
Suriname
Botswana
American Samoa
Netherlands Antilles
CyprusFiji
Cape VerdeMalta
Barbados
Mauritius
Comoros (!!!)
SamoaGuam
Size matters
54
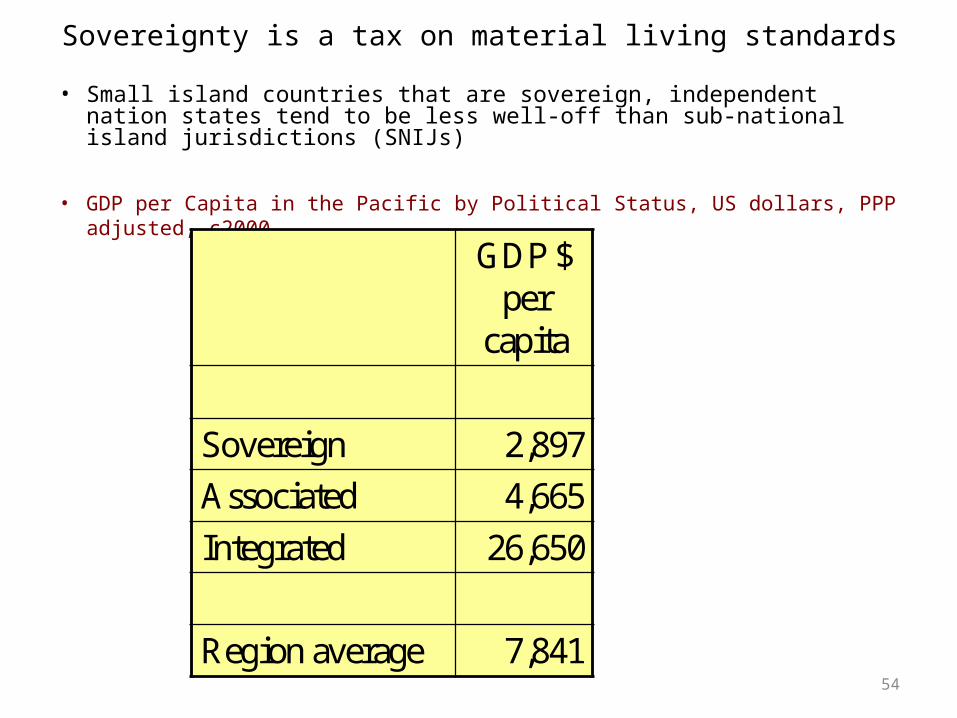
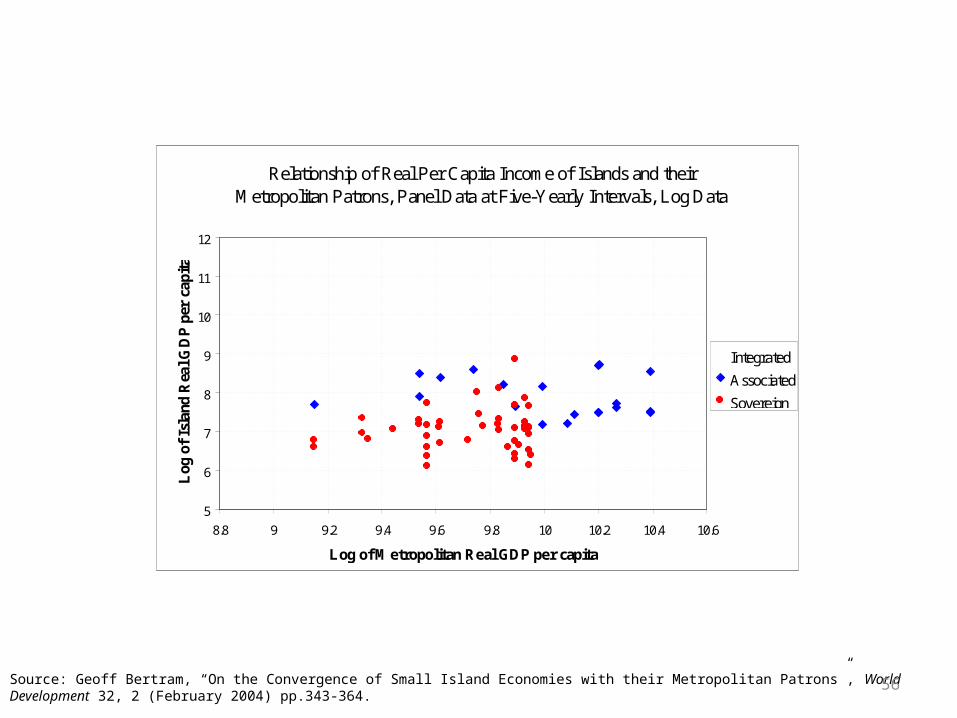
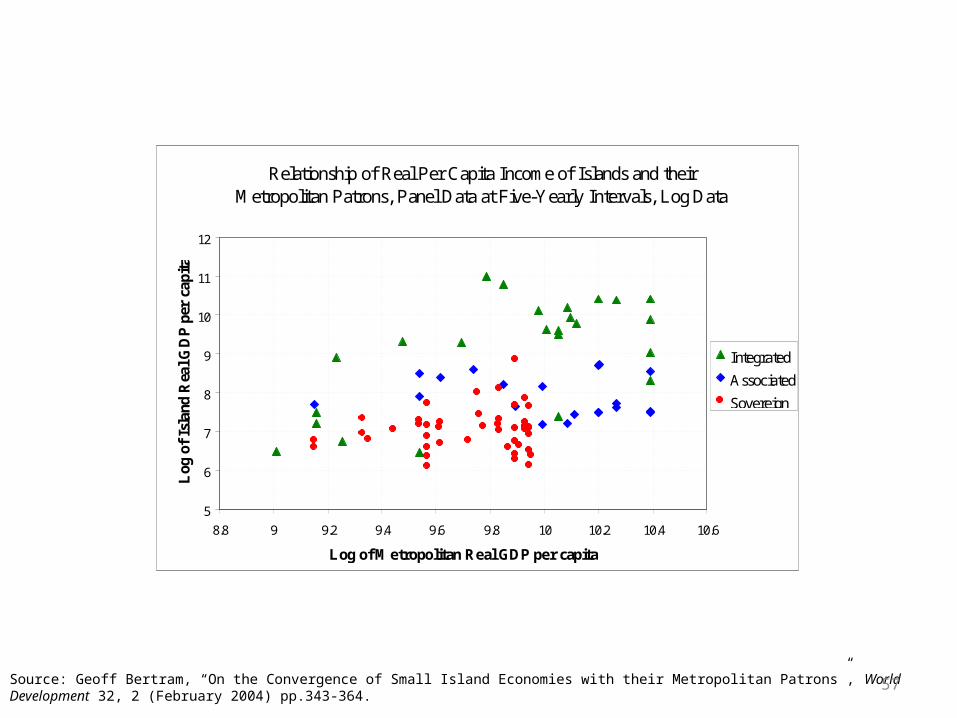
Sovereignty is a tax on material living standards• Small island countries that are sovereign, independent nation states
tend to be less well-off than sub-national island jurisdictions (SNIJs)
• GDP per Capita in the Pacific by Political Status, US dollars, PPP adjusted, c2000
GDP $ per
capita
Sovereign 2,897
Associated 4,665
Integrated 26,650
Region average 7,841
55
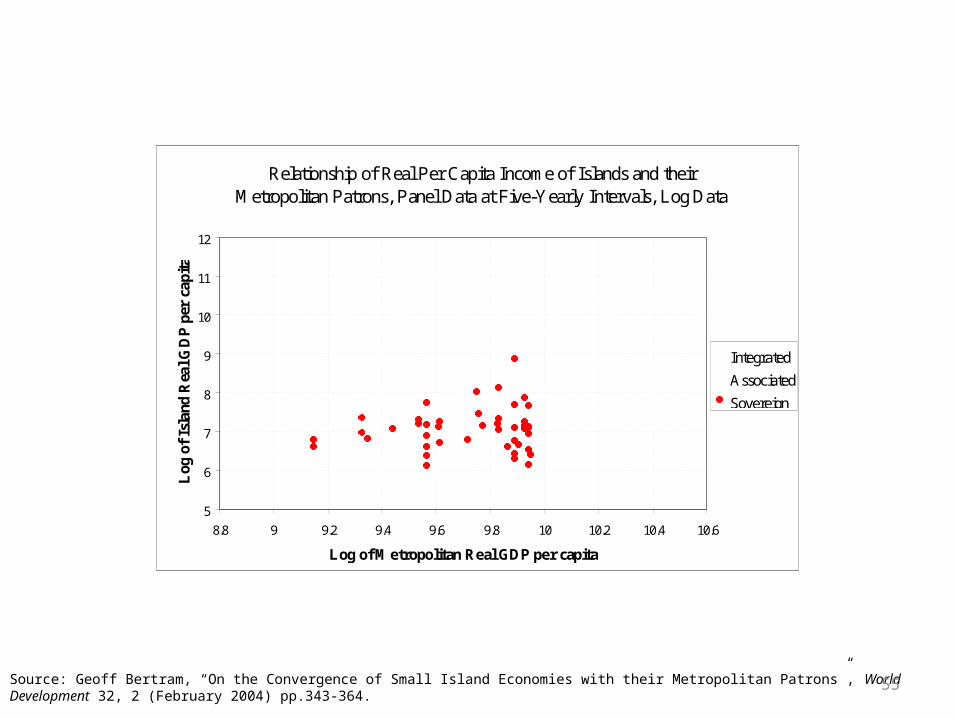
Relationship of Real Per Capita Income of Islands and their Metropolitan Patrons, Panel Data at Five-Yearly Intervals, Log Data
5
6
7
8
9
10
11
12
8.8 9 9.2 9.4 9.6 9.8 10 10.2 10.4 10.6
Log of Metropolitan Real GDP per capita
Log
of
Isla
nd R
eal G
DP
per
cap
ita
Integrated
Associated
Sovereign
Source: Geoff Bertram, “On the Convergence of Small Island Economies with their Metropolitan Patrons”, World Development 32, 2 (February 2004) pp.343-364.
56
Relationship of Real Per Capita Income of Islands and their Metropolitan Patrons, Panel Data at Five-Yearly Intervals, Log Data
5
6
7
8
9
10
11
12
8.8 9 9.2 9.4 9.6 9.8 10 10.2 10.4 10.6
Log of Metropolitan Real GDP per capita
Log
of
Isla
nd R
eal G
DP
per
cap
ita
Integrated
Associated
Sovereign
Source: Geoff Bertram, “On the Convergence of Small Island Economies with their Metropolitan Patrons”, World Development 32, 2 (February 2004) pp.343-364.
57
Relationship of Real Per Capita Income of Islands and their Metropolitan Patrons, Panel Data at Five-Yearly Intervals, Log Data
5
6
7
8
9
10
11
12
8.8 9 9.2 9.4 9.6 9.8 10 10.2 10.4 10.6
Log of Metropolitan Real GDP per capita
Log
of
Isla
nd R
eal G
DP
per
cap
ita
Integrated
Associated
Sovereign
Source: Geoff Bertram, “On the Convergence of Small Island Economies with their Metropolitan Patrons”, World Development 32, 2 (February 2004) pp.343-364.
58
Some recent academic work on sovereignty and development
• Geoff Bertram, “On the Convergence of Small Island Economies with their Metropolitan Patrons”, World Development 32, 2 (February 2004) pp.343-364.
• J.L. McElroy and K.B. Pearce, “The Advantages of Political Afiliation: Dependent and Independent Small-Island Profiles”, The Round Table 95(386): 529-539, September 2006.
• G. Baldacchino, Island Enclaves 2010; and G. Baldacchino & D. Milne, The Case for Non-sovereignty, Routledge 2009)
• Feyrer, J. & Sacerdote, B. (2009) ‘Colonialism and Modern Income: Islands as Natural Experiments’, Review of Economics and Statistics 91(2): 245-262, May.
59
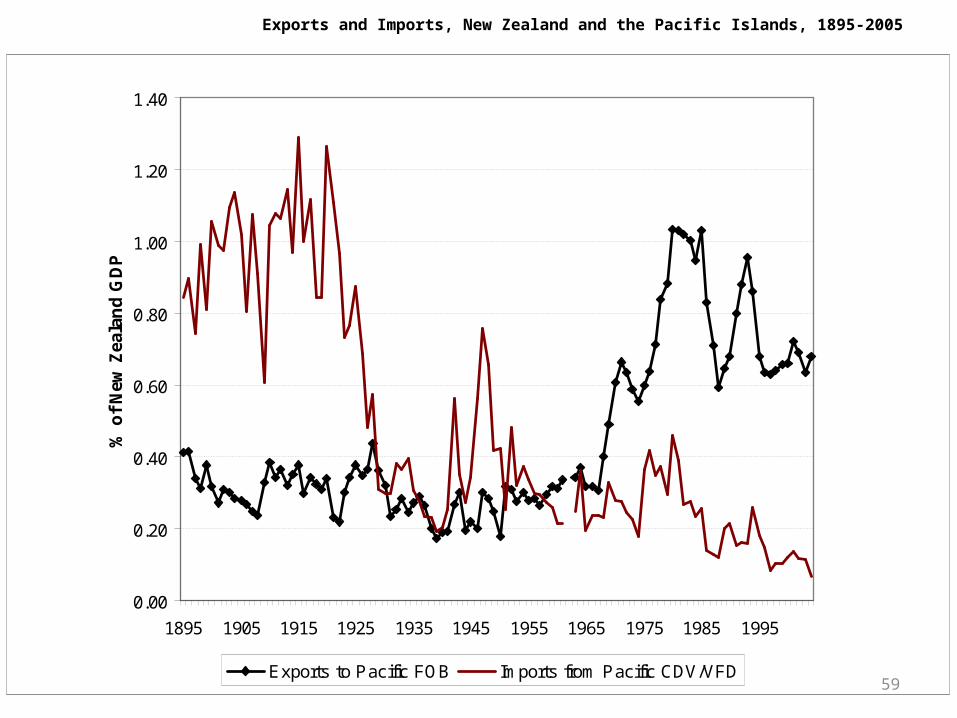
Exports and Imports, New Zealand and the Pacific Islands, 1895-2005
0.00
0.20
0.40
0.60
0.80
1.00
1.20
1.40
1895 1905 1915 1925 1935 1945 1955 1965 1975 1985 1995
% o
f N
ew Z
eala
nd
GD
P
Exports to Pacific FOB Imports from Pacific CDV/VFD
60
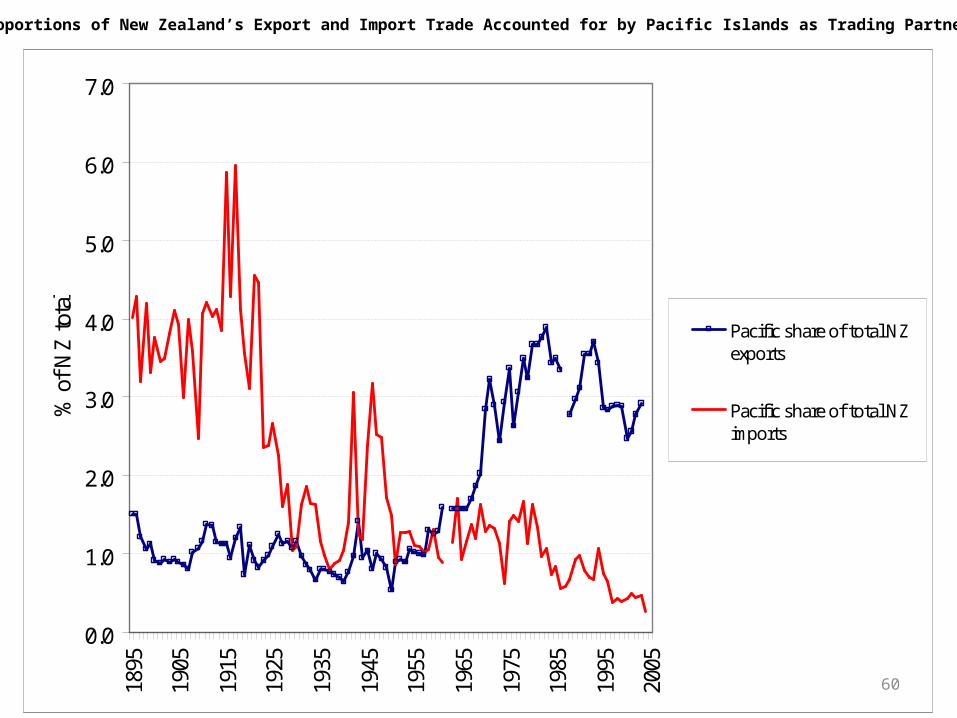
Proportions of New Zealand’s Export and Import Trade Accounted for by Pacific Islands as Trading Partners
0.0
1.0
2.0
3.0
4.0
5.0
6.0
7.0
1895
1905
1915
1925
1935
1945
1955
1965
1975
1985
1995
2005
% o
f N
Z to
tal
Pacific share of total NZexports
Pacific share of total NZimports
61
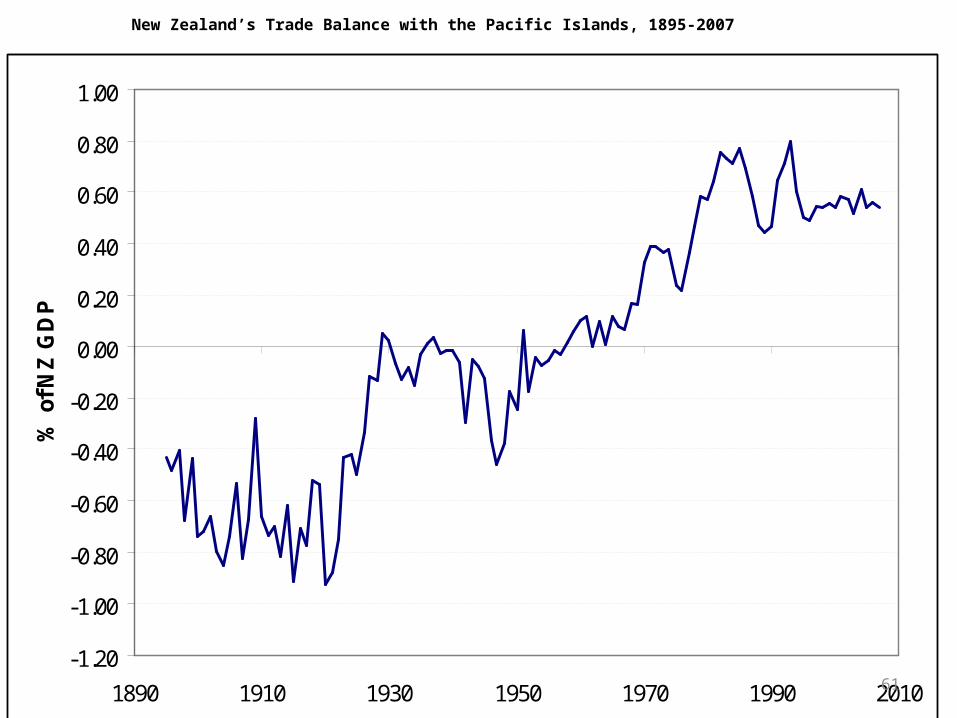
New Zealand’s Trade Balance with the Pacific Islands, 1895-2007
-1.20
-1.00
-0.80
-0.60
-0.40
-0.20
0.00
0.20
0.40
0.60
0.80
1.00
1890 1910 1930 1950 1970 1990 2010
% o
f N
Z G
DP
62
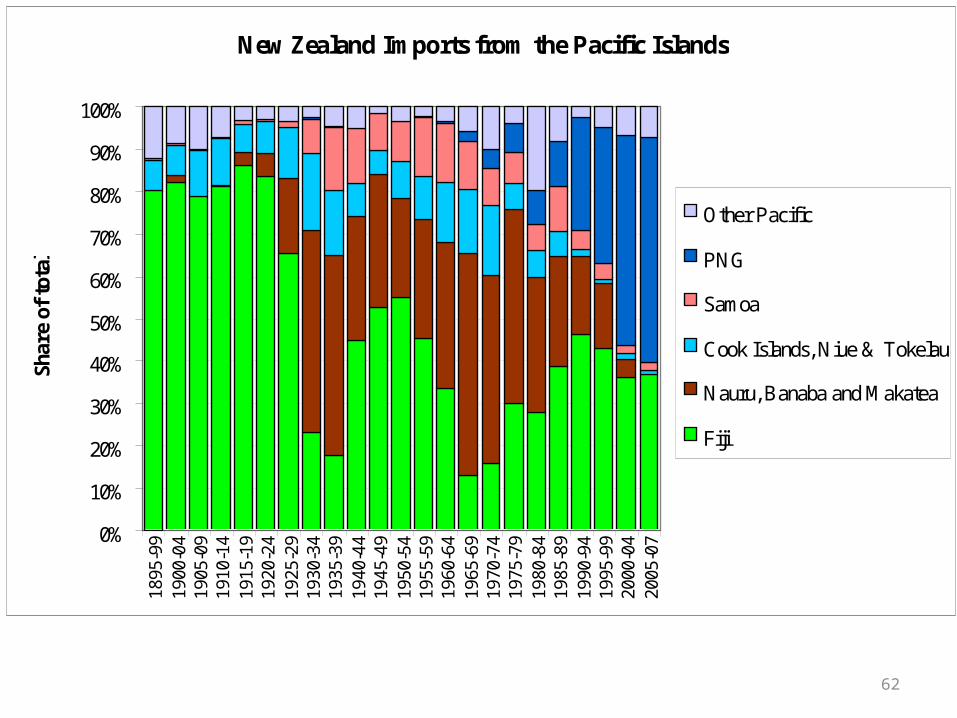
New Zealand Imports from the Pacific Islands
0%
10%
20%
30%
40%
50%
60%
70%
80%
90%
100%
1895
-99
1900
-04
1905
-09
1910
-14
1915
-19
1920
-24
1925
-29
1930
-34
1935
-39
1940
-44
1945
-49
1950
-54
1955
-59
1960
-64
1965
-69
1970
-74
1975
-79
1980
-84
1985
-89
1990
-94
1995
-99
2000
-04
2005
-07
Shar
e of
tot
al
Other Pacific
PNG
Samoa
Cook Islands, Niue & Tokelau
Nauru, Banaba and Makatea
Fiji
63
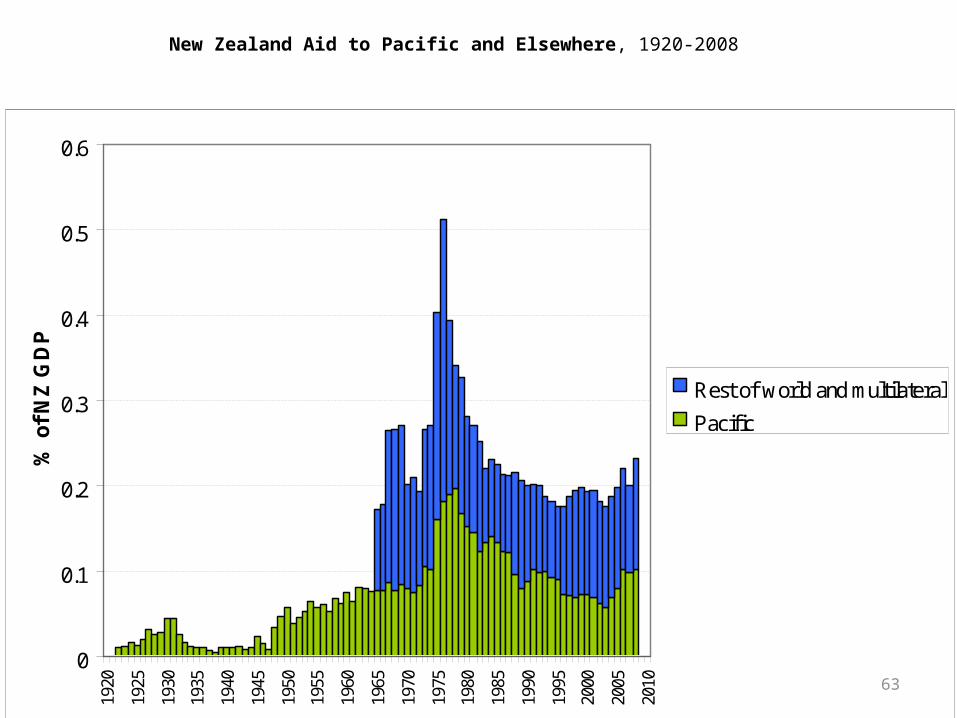
New Zealand Aid to Pacific and Elsewhere, 1920-2008
0
0.1
0.2
0.3
0.4
0.5
0.6
1920
1925
1930
1935
1940
1945
1950
1955
1960
1965
1970
1975
1980
1985
1990
1995
2000
2005
2010
% o
f N
Z G
DP
Rest of world and multilateral
Pacific
64
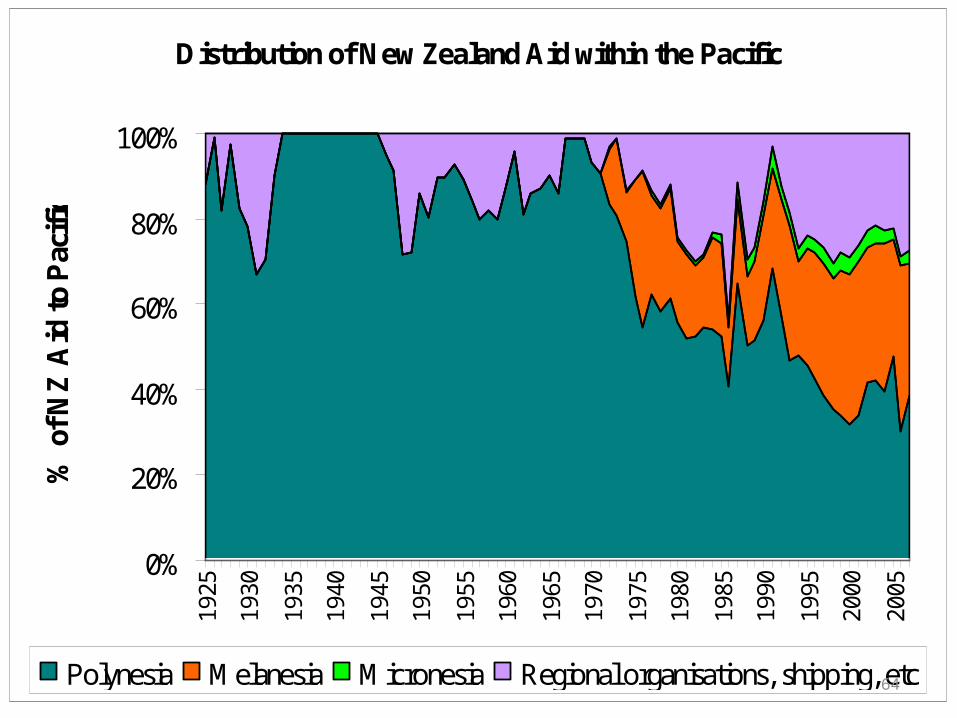
Distribution of New Zealand Aid within the Pacific
0%
20%
40%
60%
80%
100%
1925
1930
1935
1940
1945
1950
1955
1960
1965
1970
1975
1980
1985
1990
1995
2000
2005
% o
f N
Z A
id t
o P
acif
ic
Polynesia Melanesia Micronesia Regional organisations, shipping, etc
65
• Overall, from an islander perspective their historical relationships with New Zealand have been economically beneficial though marred by occasional tensions over palagi conceptions of political and economic development.
• Infrastructure and services were developed to a reasonably good standard under New Zealand rule, and have been sort-of sustained since by ongoing aid commitments.
• By opening its doors to island migrants from its territories in the 1950s and 1960s New Zealand gained a source of cheap labour while enabling islanders to access cash incomes at levels that could not have been secured at home, a genuine win-win outcome.
• By extending migration access over subsequent decades to a widening range of Pacific islanders – Tongans, Tuvaluans, and most recently Melanesians, New Zealand has cemented its role both as a good neighbour and as a development hub for the peoples of the region.
66
• The interpenetration of small-island economies with metropolitan national economies such as New Zealand means that conventional national-accounts statistics conceal rather than reveal the true developmental performance of the islander communities, dispersed as they are across several different national economies.
• Pacific islanders resident in New Zealand produce output which is simultaneously part of both New Zealand’s GDP and a key component of the collective income of their transnational ethnic groups. Pacific migrants pay income taxes and GST in New Zealand, and probably comprise 3 - 5% of the New Zealand tax base, an amount well in excess of the total value of aid and other grants from New Zealand to the islands.
• The modern sector of any Pacific island people with migration outlets will lie offshore, inhabited by the diaspora of entrepreneurs and wage-workers which controls a large share of the financial and human capital of the ethnic community as a whole.
67
• Remittances form a direct cashflow link between the diaspora and the home population, but other links are equally important for long-run growth – especially patterns of return migration, back-and-forth visiting, communication via media channels, and accumulation of financial assets in metropolitan banks and share registers.
• Migration-adjusted national income accounting is in its infancy and is a rich area for empirical macroeconomic research. National-accounts aggregates prepared for the home population in isolation not only ignore much of the actual (but offshore) modern sector; they also miss the degree of success in preserving non-material wealth in the form of culture and human capital while raising material welfare.
• Thus the time is ripe for a re-thinking of New Zealand’s policy stance towards the small islands of the region, based on acknowledgement that “sustainable development” need not mean either strong trading performance or large-scale industrial development in the islands, but can be secured by other forms of economic activity, many of which point towards an informal process of regional economic and social integration that transcends the narrow categories of national sovereignty and domestic product.