Embed Size (px)
Citation preview

Pacific Northwest Regional Economic Conference5/16/13
What Everybody Knows but Nobody Can Prove: Searching
for Evidence of the Skills Gap in Occupational Wage Data
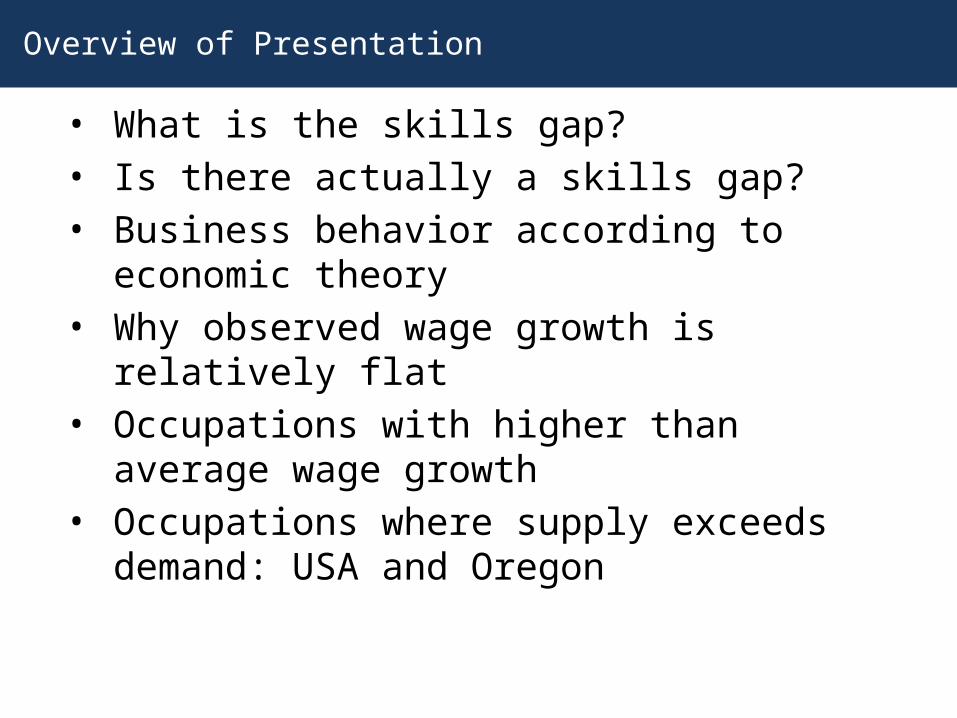
Overview of Presentation
• What is the skills gap?• Is there actually a skills gap?• Business behavior according to economic theory• Why observed wage growth is relatively flat• Occupations with higher than average wage growth• Occupations where supply exceeds demand: USA
and Oregon
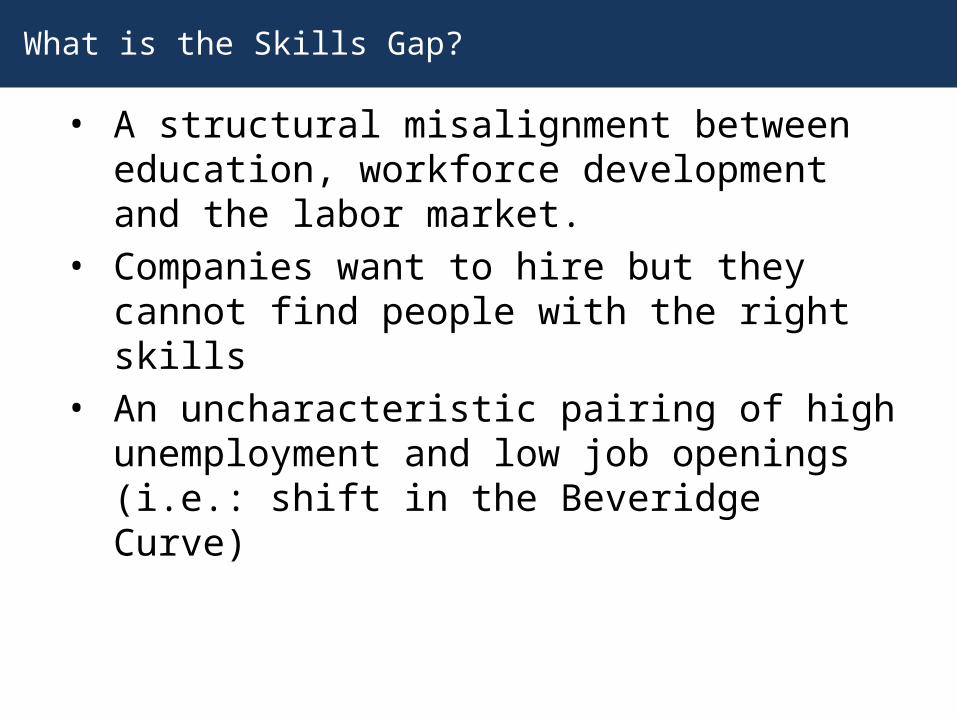
What is the Skills Gap?
• A structural misalignment between education, workforce development and the labor market.
• Companies want to hire but they cannot find people with the right skills
• An uncharacteristic pairing of high unemployment and low job openings (i.e.: shift in the Beveridge Curve)
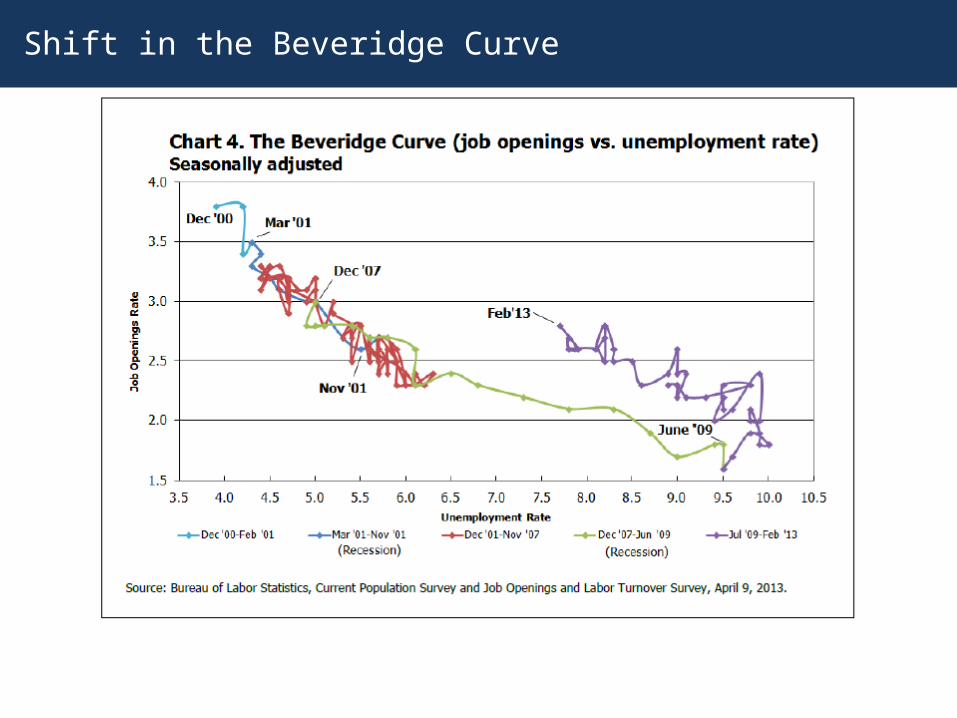
Shift in the Beveridge Curve
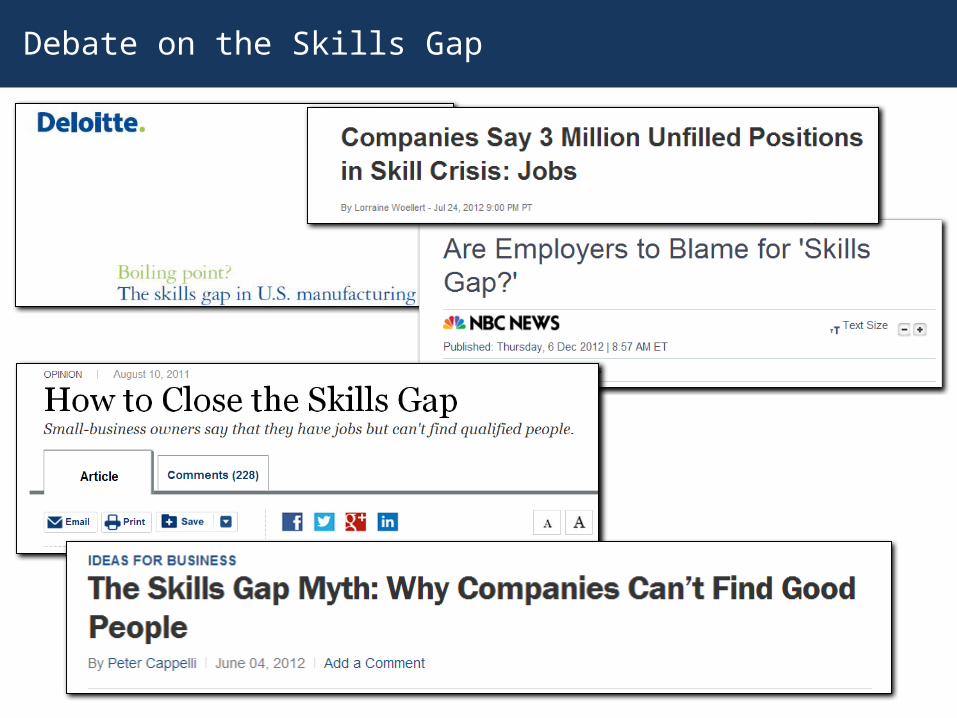
Debate on the Skills Gap
Is There Actually a Skills Gap?
• Other theories:• Shift in BC caused only by those unemployed for longer
durations (i.e.: >26 weeks) (Ghayad and Dickens, 2013)• Gap is exaggerated: macro factors have prevented hiring,
including weak demand, wage rigidity, uncertainty about future productivity and economic policy (Shimer 2012; Baker, Bloom and Davis, 2011)
• Companies are complaining and not acting (Peter Capelli, 2012)

Business Behavior According to Economic Theory
• Problem: Businesses can’t find workers at their offering wage
• Solution: Raise wages until you have enough of them
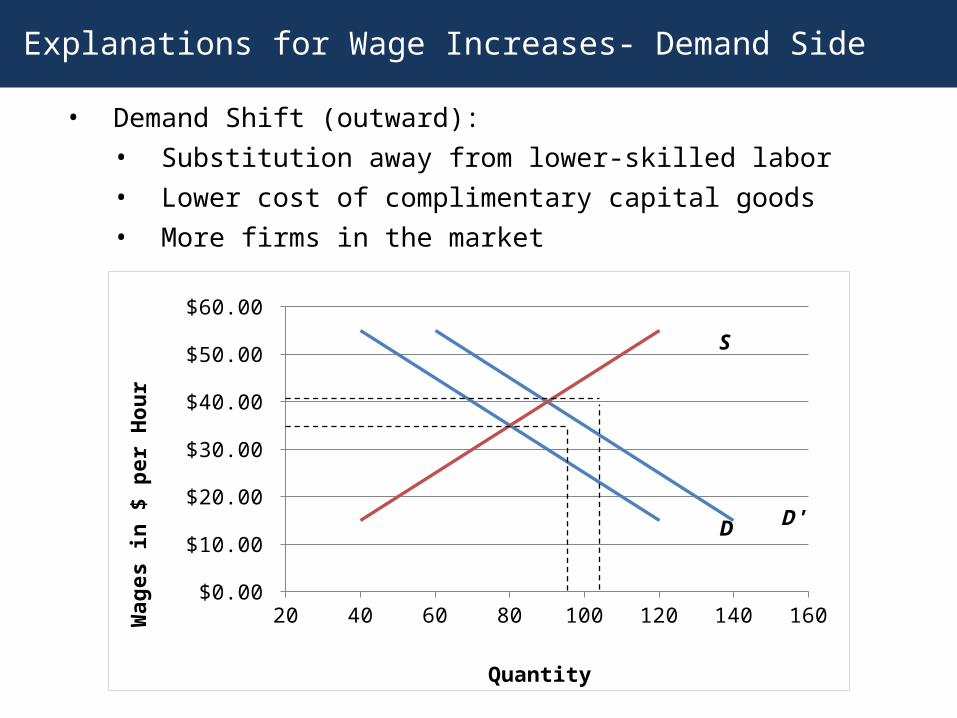
Explanations for Wage Increases- Demand Side
• Demand Shift (outward):• Substitution away from lower-skilled labor• Lower cost of complimentary capital goods• More firms in the market
20 40 60 80 100 120 140 160$0.00
$10.00
$20.00
$30.00
$40.00
$50.00
$60.00
Quantity
Wag
es in
$ p
er H
our
D'D
S
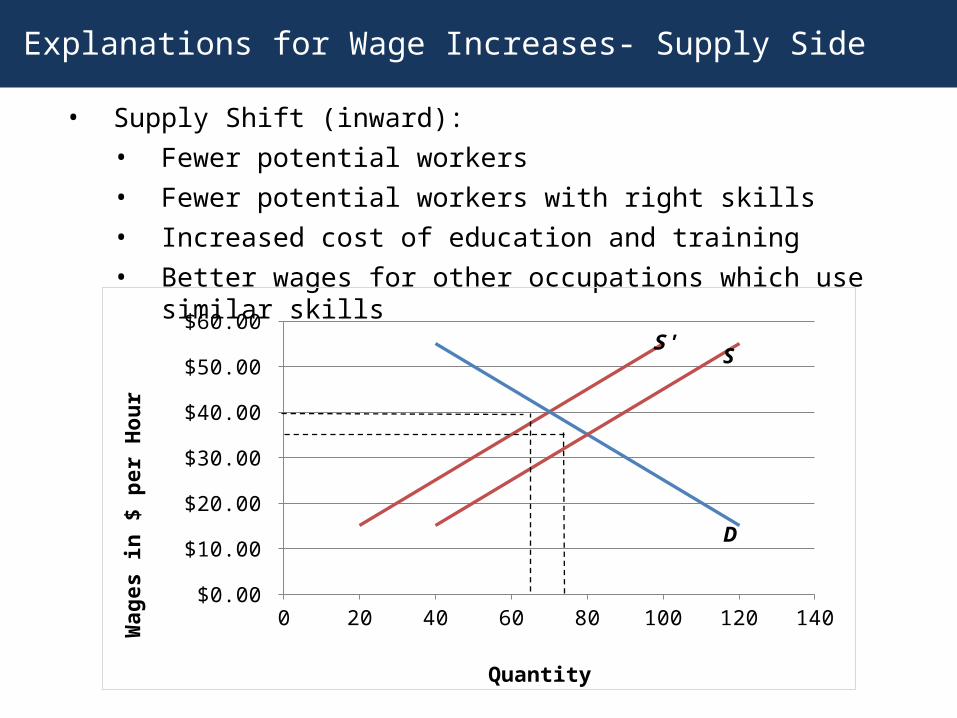
Explanations for Wage Increases- Supply Side
• Supply Shift (inward):• Fewer potential workers• Fewer potential workers with right skills• Increased cost of education and training• Better wages for other occupations which use similar skills
0 20 40 60 80 100 120 140$0.00
$10.00
$20.00
$30.00
$40.00
$50.00
$60.00
Quantity
Wag
es in
$ p
er H
our
S'
D
S
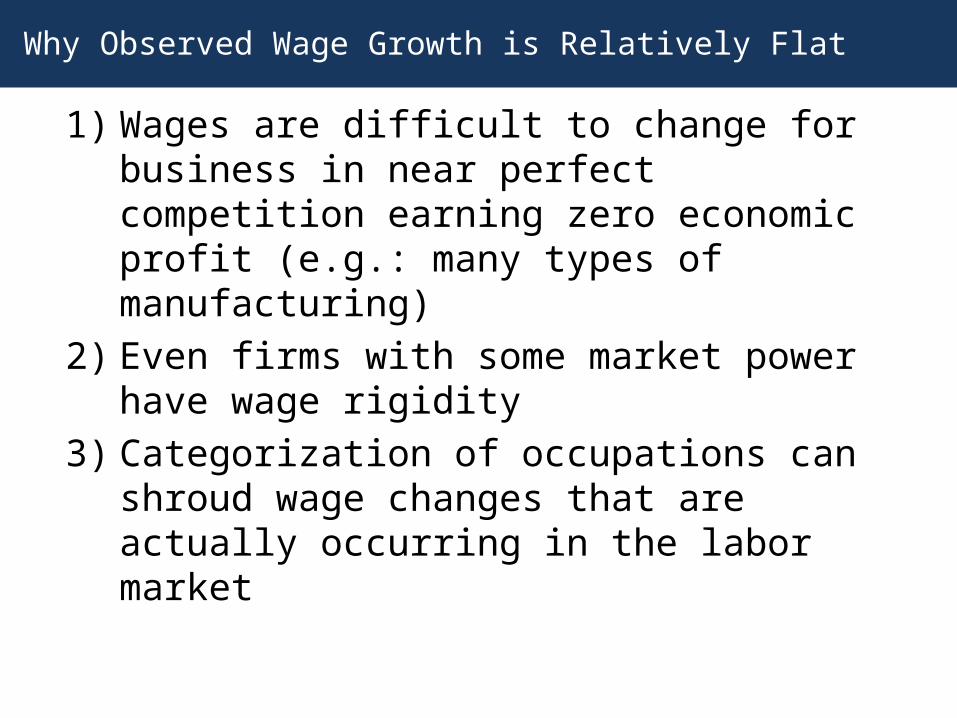
Why Observed Wage Growth is Relatively Flat
1) Wages are difficult to change for business in near perfect competition earning zero economic profit (e.g.: many types of manufacturing)
2) Even firms with some market power have wage rigidity
3) Categorization of occupations can shroud wage changes that are actually occurring in the labor market
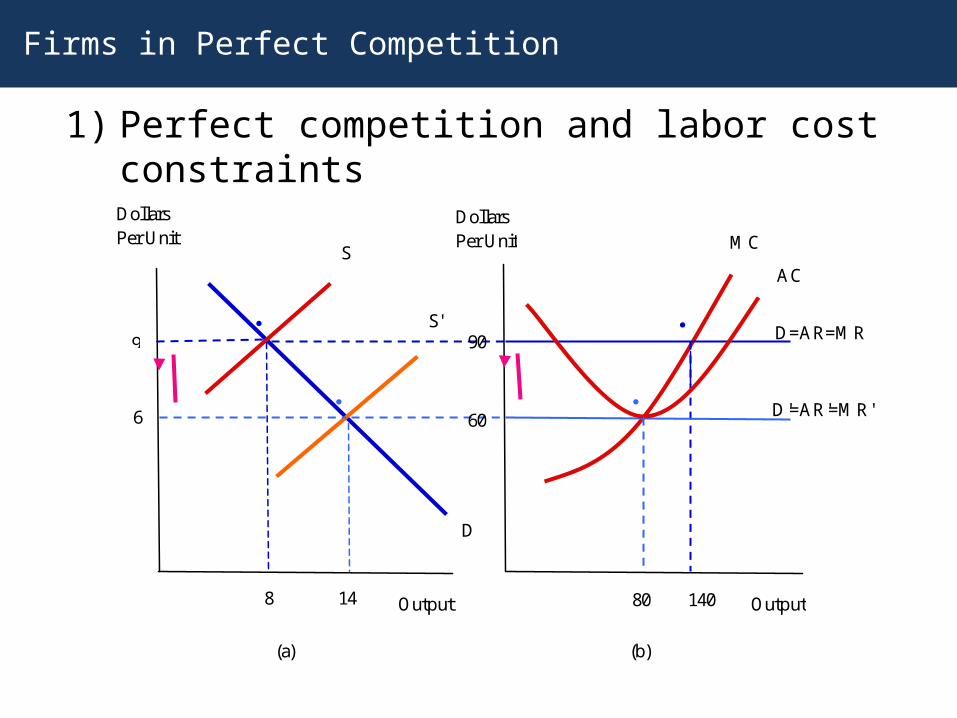
Firms in Perfect Competition
OutputOutput
Dollars Per Unit
Dollars Per Unit
9
6
8 14 80 140
(a) (b)
D
S
S'
MC
AC
D=AR=MR
60
90
D'=AR'=MR'
1) Perfect competition and labor cost constraints

Firms with Some Market Power
2) Firm structures lead to wage rigidity• Firms will aim to allocate resources to their highest use: • There is no slack in company budgets for instantaneously
changing wages when changes• Many budgetary commitments are long-term (leases, rentals,
interest payments)• If you move quicker than the rest of the labor market to
lower wages, you will loose some employees• Result: sticky wages• Within a firm, wages will change over time but will likely
occur through attrition and annual reviews
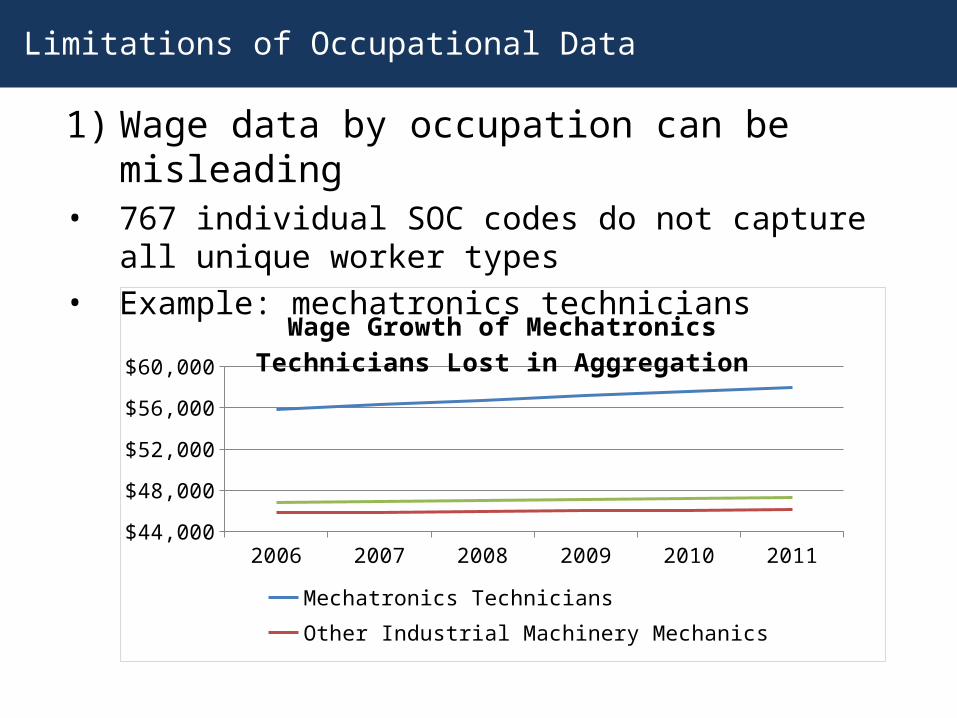
Limitations of Occupational Data
1) Wage data by occupation can be misleading• 767 individual SOC codes do not capture all unique worker
types• Example: mechatronics technicians
2006 2007 2008 2009 2010 2011$44,000
$48,000
$52,000
$56,000
$60,000
Wage Growth of Mechatronics Technicians Lost in Aggregation
Mechatronics Technicians Other Industrial Machinery Mechanics
Group Average
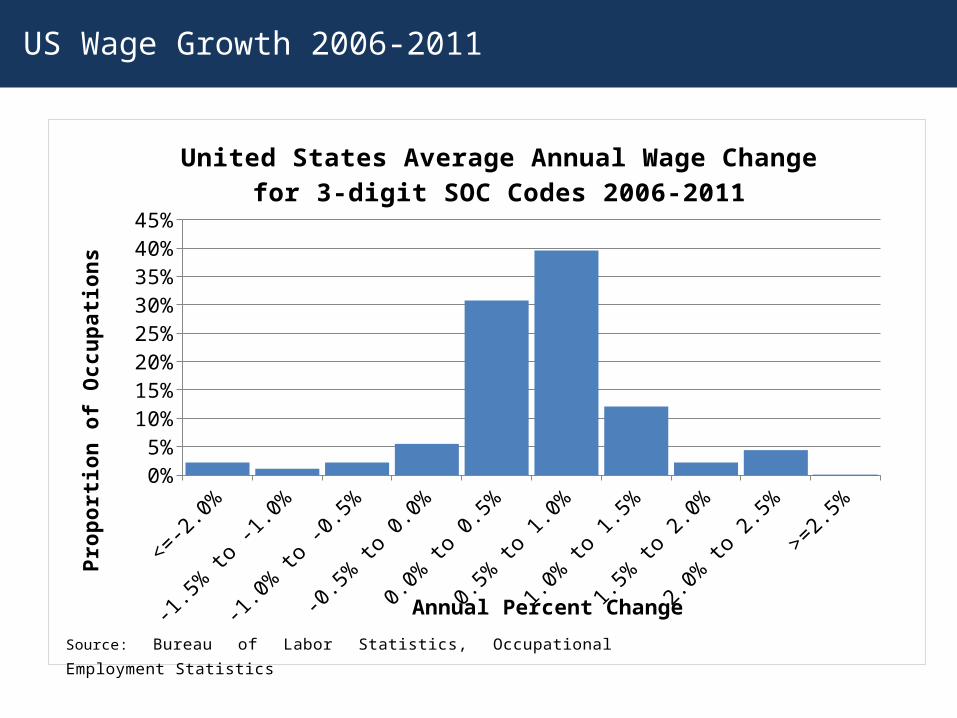
US Wage Growth 2006-2011
<=-2.0%
-1.5% to -1
.0%
-1.0% to -0
.5%
-0.5% to 0.0%
0.0% to 0.5%
0.5% to 1.0%
1.0% to 1.5%
1.5% to 2.0%
2.0% to 2.5%
>=2.5%
0%5%
10%15%20%25%30%35%40%45%
United States Average Annual Wage Change for 3-digit SOC Codes 2006-2011
Annual Percent Change
Prop
ortio
n of
Occ
upati
ons
Source: Bureau of Labor Statistics, Occupational Employment Statistics
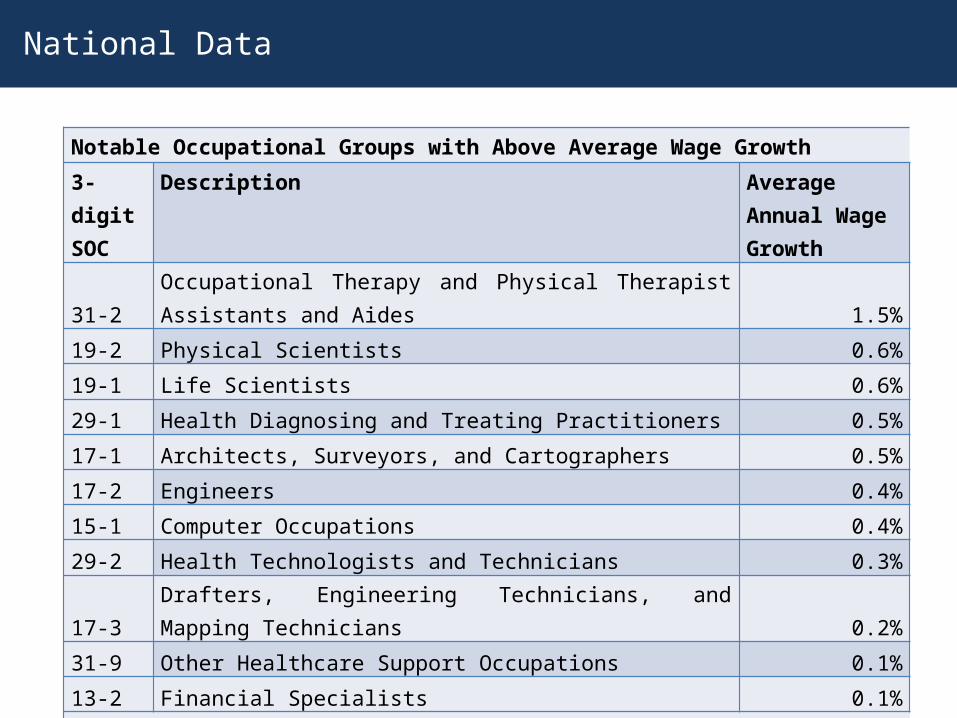
National Data
Notable Occupational Groups with Above Average Wage Growth
3-digit SOC
Description Average Annual Wage Growth
31-2 Occupational Therapy and Physical Therapist Assistants and Aides 1.5%
19-2 Physical Scientists 0.6%
19-1 Life Scientists 0.6%
29-1 Health Diagnosing and Treating Practitioners 0.5%
17-1 Architects, Surveyors, and Cartographers 0.5%
17-2 Engineers 0.4%
15-1 Computer Occupations 0.4%
29-2 Health Technologists and Technicians 0.3%
17-3 Drafters, Engineering Technicians, and Mapping Technicians 0.2%
31-9 Other Healthcare Support Occupations 0.1%
13-2 Financial Specialists 0.1%
Source: Bureau of Labor Statistics, Occupational Employment Statistics
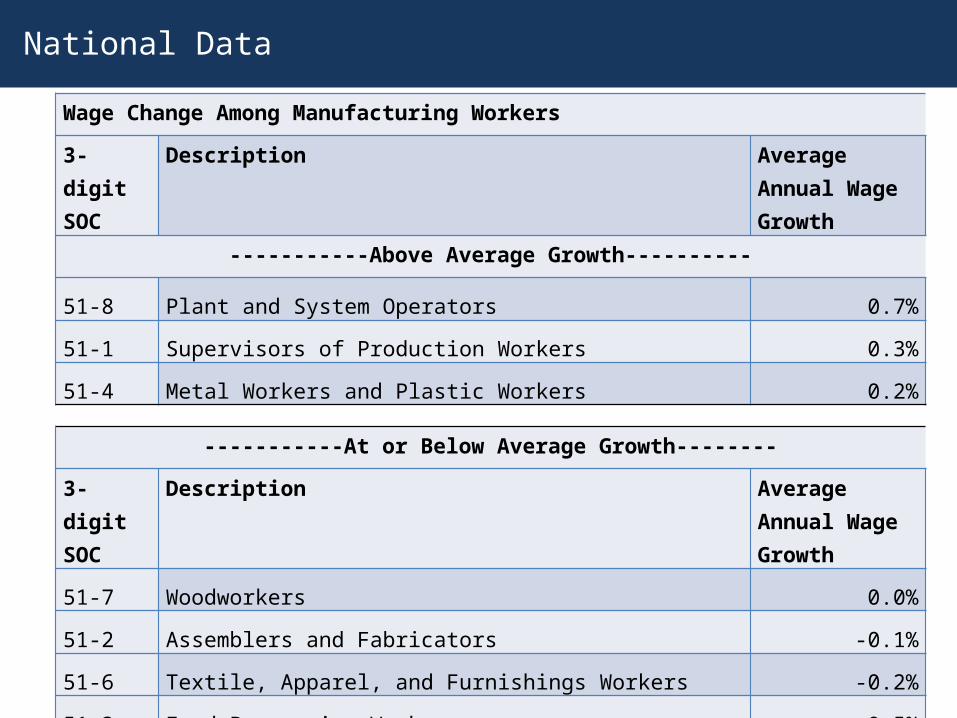
National Data
Wage Change Among Manufacturing Workers
3-digit SOC
Description Average Annual Wage Growth
-----------Above Average Growth----------
51-8 Plant and System Operators 0.7%
51-1 Supervisors of Production Workers 0.3%
51-4 Metal Workers and Plastic Workers 0.2%
-----------At or Below Average Growth--------
3-digit SOC
Description Average Annual Wage Growth
51-7 Woodworkers 0.0%
51-2 Assemblers and Fabricators -0.1%
51-6 Textile, Apparel, and Furnishings Workers -0.2%
51-3 Food Processing Workers -0.5%Source: Bureau of Labor Statistics, Occupational Employment Statistics
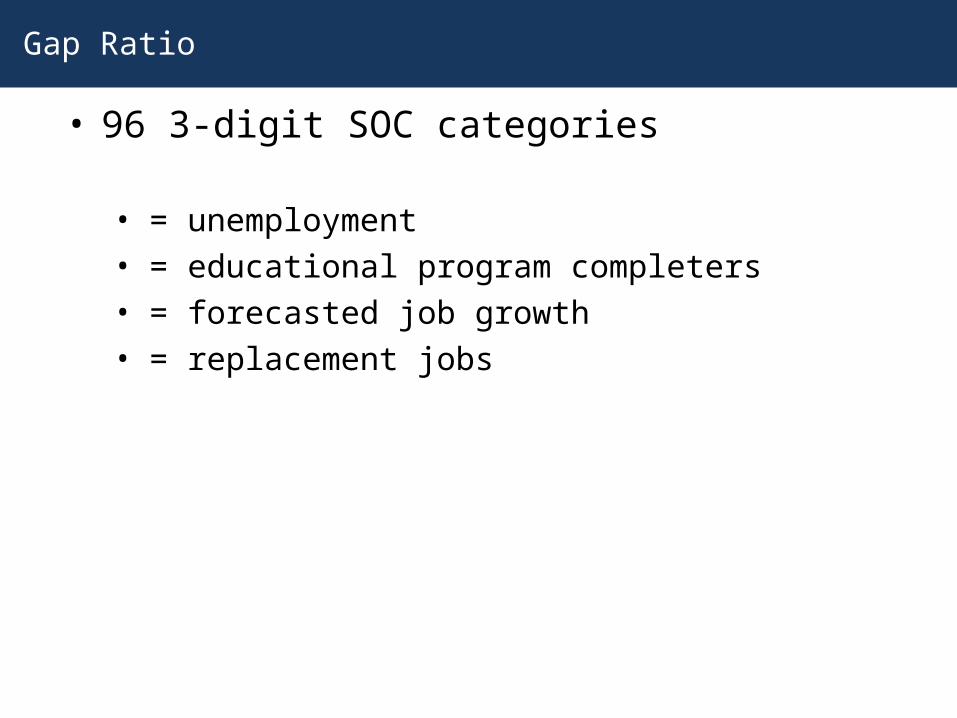
Gap Ratio
• 96 3-digit SOC categories
• = unemployment• = educational program completers• = forecasted job growth• = replacement jobs
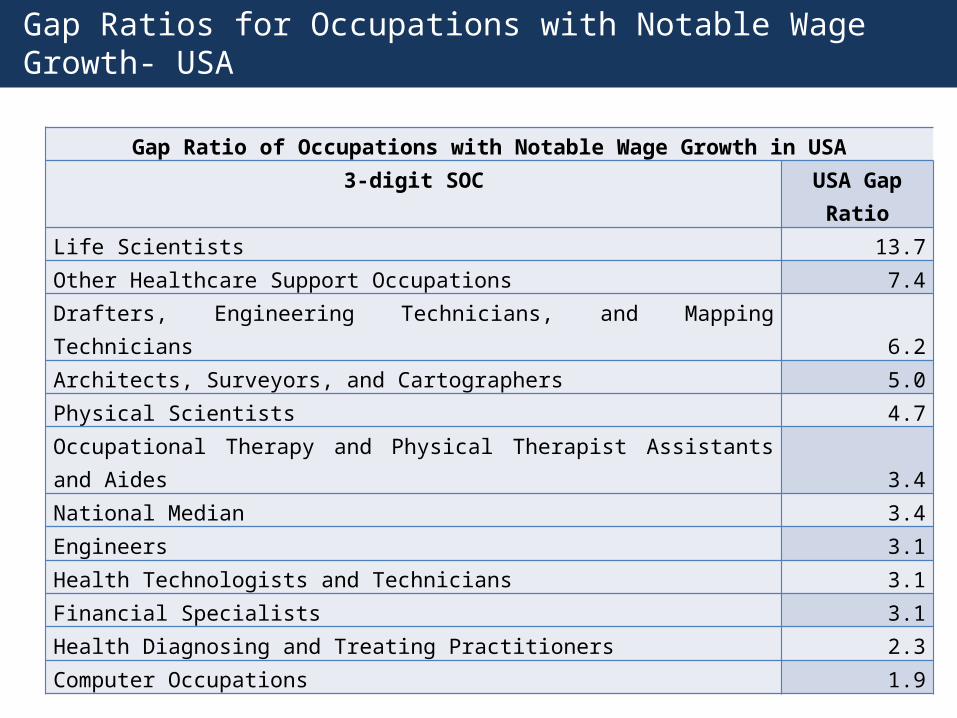
Gap Ratios for Occupations with Notable Wage Growth- USA
Gap Ratio of Occupations with Notable Wage Growth in USA3-digit SOC USA Gap Ratio
Life Scientists 13.7
Other Healthcare Support Occupations 7.4
Drafters, Engineering Technicians, and Mapping Technicians 6.2
Architects, Surveyors, and Cartographers 5.0
Physical Scientists 4.7
Occupational Therapy and Physical Therapist Assistants and Aides 3.4
National Median 3.4
Engineers 3.1
Health Technologists and Technicians 3.1
Financial Specialists 3.1
Health Diagnosing and Treating Practitioners 2.3
Computer Occupations 1.9
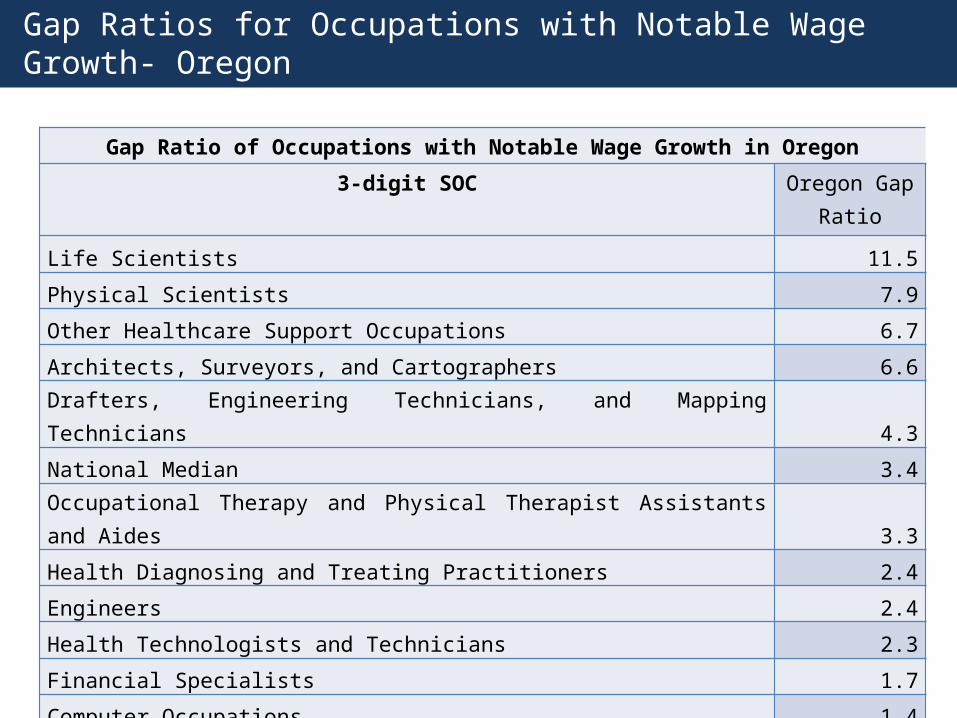
Gap Ratios for Occupations with Notable Wage Growth- Oregon
Gap Ratio of Occupations with Notable Wage Growth in Oregon
3-digit SOC Oregon Gap Ratio
Life Scientists 11.5
Physical Scientists 7.9
Other Healthcare Support Occupations 6.7
Architects, Surveyors, and Cartographers 6.6
Drafters, Engineering Technicians, and Mapping Technicians 4.3
National Median 3.4
Occupational Therapy and Physical Therapist Assistants and Aides 3.3
Health Diagnosing and Treating Practitioners 2.4
Engineers 2.4
Health Technologists and Technicians 2.3
Financial Specialists 1.7
Computer Occupations 1.4
Conclusion
• Minimal wage growth is not a sign that the is not a skills gap• Firms have trouble changing wages at speed that
changes• Wage changes are difficult to capture in some
cases• Some areas where and wages have increased:• healthcare occupations; • computer occupations; • financial specialists; • engineering occupations