Embed Size (px)
Citation preview
Pacific Region
ENSO UPDATE AND SEASONAL
OUTLOOK May 9 2016
PREPARED BY THE PEAC CENTER
Principal Scientist:
Dr. Rashed Chowdhury
Pacific Region Climate Officer:
LTJG Carl Noblitt
Tropical Cyclone Specialist:
Mark Lander
Graduate Assistant:
Alejandro Ludert

What Is El Niño A general description of its global impacts
2
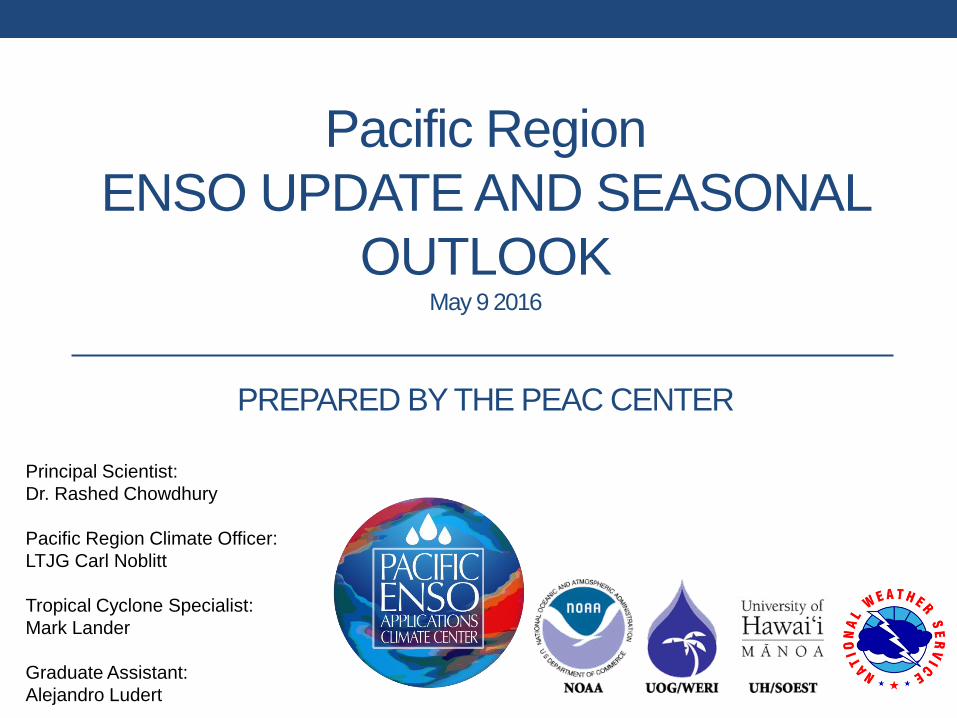
El Niño-Southern Oscillation (ENSO)
Figures from http://www.bom.gov.au/climate/enso/history/ln-2010-12/three-phases-of-ENSO.shtml
3
ENSO Neutral
Conditions
El Niño
Conditions La Niña
Conditions

El Niño in a nutshell El Niño Conditions:
•Warm sea surface temperatures to the east
and cold to the west
•Weakened trade winds, westerly winds over
east Pacific
•Rainfall over the Central and East Pacific
•Lower than normal sea levels over the
western Pacific
Figures from http://www.bom.gov.au/climate/enso/history/ln-2010-12/three-phases-of-ENSO.shtml
4
La Niña Conditions:
•Cooler than normal sea surface
temperatures to the east and warmer to the
west
•Stronger trade winds
•Enhanced rainfall over the Western Pacific
•Higher than normal sea levels over the
Western Pacific
-2.5
-2
-1.5
-1
-0.5
0
0.5
1
1.5
2
2.5
3
Ocean
ic N
iño
In
dex (
Deg
C)
Season
2015/16
1972/73/74
1982/83/84
1997/98/99
IRI Forecast April 212016
Developing Year Decaying Year
El Niño
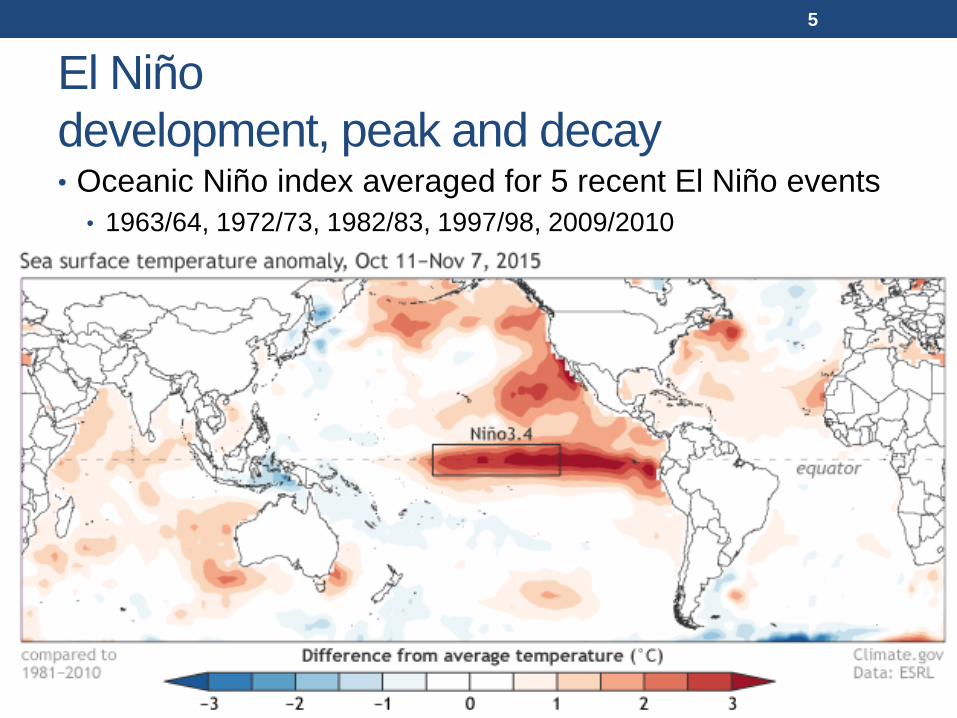
development, peak and decay • Oceanic Niño index averaged for 5 recent El Niño events
• 1963/64, 1972/73, 1982/83, 1997/98, 2009/2010
5

-2.5
-2
-1.5
-1
-0.5
0
0.5
1
1.5
2
2.5
3
Ocean
ic N
iño
In
dex (
Deg
C)
Season
2015/16
1972/73/74
1982/83/84
1997/98/99
IRI Forecast April 212016
Developing Year Decaying Year
El Niño
development, peak and decay • Oceanic Niño index averaged for 5 recent El Niño events
• 1963/64, 1972/73, 1982/83, 1997/98, 2009/2010
6

http://www.climate.gov/news-
features/department/8443/all
7
El Niño and
Rainfall
La Niña and
Rainfall

ENSO and Tropical Cyclones
El Niño shifts TC genesis
Eastward over the North
and South Western Pacific • Less TC activity
• Australia
• Philippines
• More TC activity • Tropical Pacific
• Hawaii
• American Samoa
From the Royal Netherlands Meteorological Institute
http://www.knmi.nl/research/global_climate/enso/effects/
8

GENERAL SYNOPSIS This section will give a quick overview of the
coming topics
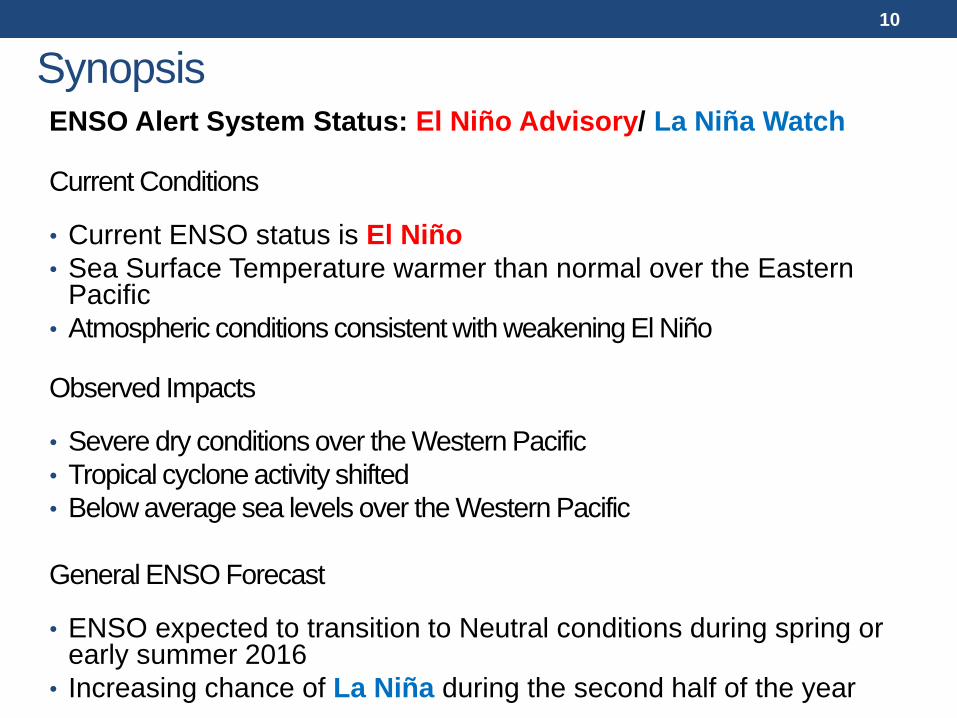
ENSO Alert System Status: El Niño Advisory/ La Niña Watch
Current Conditions • Current ENSO status is El Niño
• Sea Surface Temperature warmer than normal over the Eastern Pacific
• Atmospheric conditions consistent with weakening El Niño
Observed Impacts • Severe dry conditions over the Western Pacific
• Tropical cyclone activity shifted
• Below average sea levels over the Western Pacific
General ENSO Forecast • ENSO expected to transition to Neutral conditions during spring or
early summer 2016
• Increasing chance of La Niña during the second half of the year
Synopsis
10
Current Conditions General State of the Ocean and Atmosphere
11
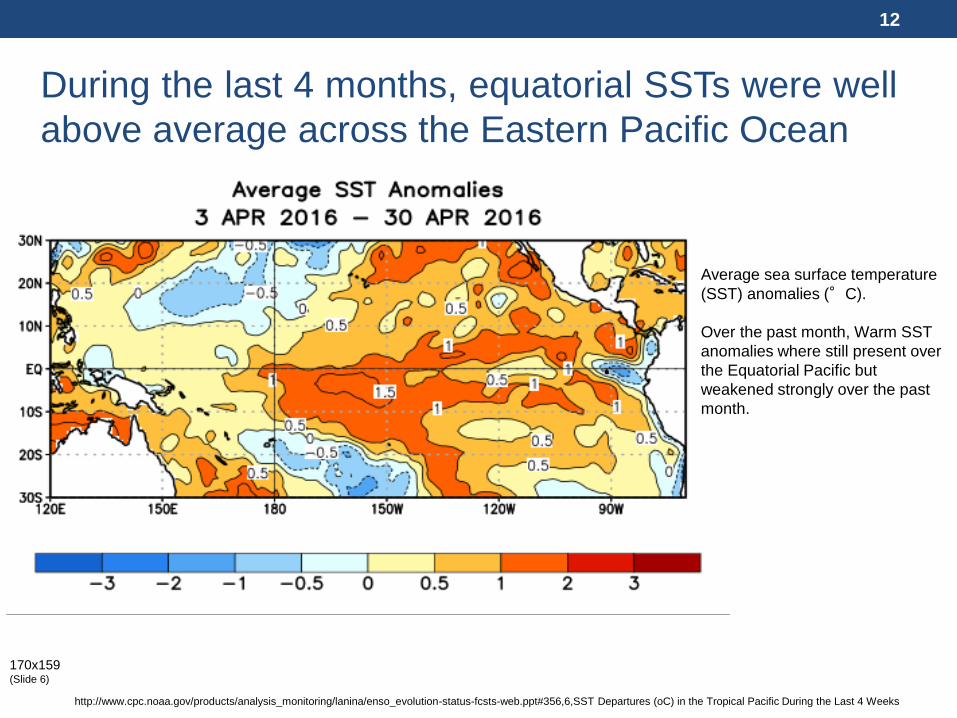
During the last 4 months, equatorial SSTs were well
above average across the Eastern Pacific Ocean
http://www.cpc.noaa.gov/products/analysis_monitoring/lanina/enso_evolution-status-fcsts-web.ppt#356,6,SST Departures (oC) in the Tropical Pacific During the Last 4 Weeks
170x159 (Slide 6)
Average sea surface temperature
(SST) anomalies (°C).
Over the past month, Warm SST
anomalies where still present over
the Equatorial Pacific but
weakened strongly over the past
month.
12
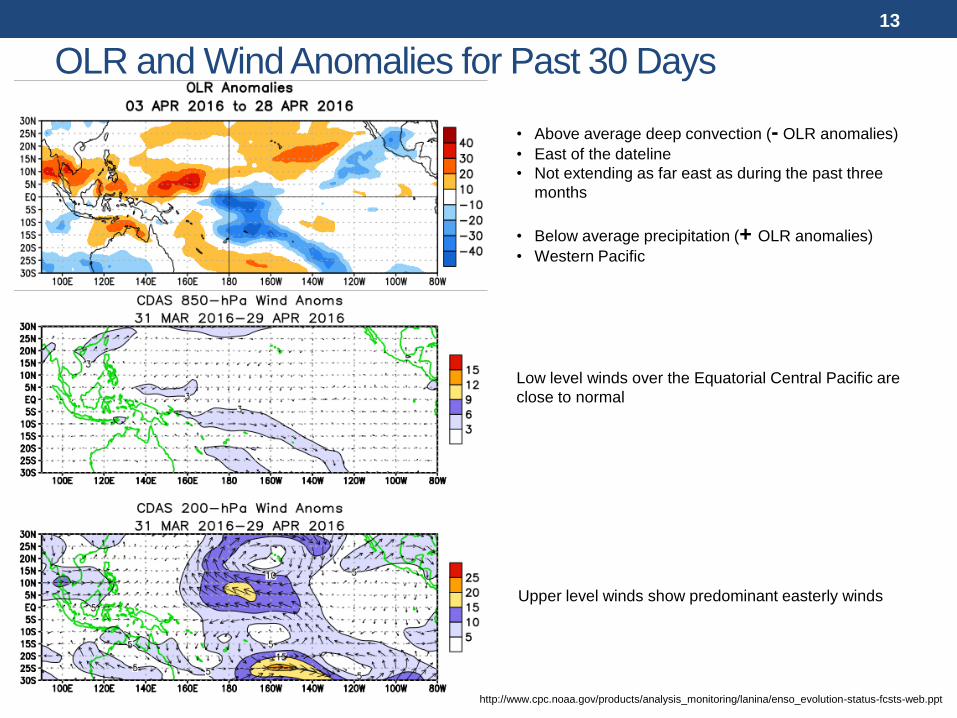
OLR and Wind Anomalies for Past 30 Days
http://www.cpc.noaa.gov/products/analysis_monitoring/lanina/enso_evolution-status-fcsts-web.ppt
• Above average deep convection (- OLR anomalies)
• East of the dateline
• Not extending as far east as during the past three
months
• Below average precipitation (+ OLR anomalies)
• Western Pacific
Low level winds over the Equatorial Central Pacific are
close to normal
Upper level winds show predominant easterly winds
13

SST DEPARTURES AND UPPER OCEAN (0 - 300m)
HEAT CONTENT ANOMOLY
http://www.cpc.noaa.gov/products/analysis_monitoring/lanina/enso_evolution-status-fcsts-web.ppt#356,6,SST
The latest weekly SST departures are:
Niño 4 0.9ºC
Niño 3.4 0.8ºC
Niño 3 0.4ºC
Niño 1+2 -0.3ºC
14

ENSO Alert System Status: El Niño Advisory/ La Niña Watch
Synopsis:
• Sea surface temperature anomalies were between 1.0°and 1.5°C across most of
the central and eastern equatorial Pacific Ocean during early April, having weakened
appreciably over the last month.
•The latest weekly values for all of the Niño indices dropped to below 1.5°C.
•The subsurface temperature anomaly in the central and eastern Pacific decreased
to negative values.
•Low-level westerly wind anomalies and upper-level easterly wind anomalies
weakened compared to February.
•The equatorial Southern Oscillation Index (SOI) remained negative but weakened,
while the traditional SOI was near zero.
•Enhanced convection continued over the central tropical Pacific but weakened east
of the Date Line, and was suppressed over northern Indonesia and the Philippines.
•Collectively, these anomalies reflect a weakening El Niño.
Issued by
CLIMATE PREDICTION CENTER/NCEP/NWS
and the International Research Institute for Climate and Society
Diagnostic Discussion: 14 April 2016 http://www.cpc.ncep.noaa.gov/products/analysis_monitoring/enso_advisory/ensodisc.doc
EL NIÑO/SOUTHERN OSCILLATION (ENSO) DIAGNOSTIC
DISCUSSION
15
Impacts Rainfall, Sea Level, Tropical Cyclones and
Societal Impacts
16

Rainfall impacts: Drought
17
From the Global Drought Information System (http://www.drought.gov/gdm/content/welcome)
• Global Precipitation Climatology Center GPCC satellite derived Standardized
Precipitation Index
• Represents the 12 month accumulated rainfall deficit
• Darker colors represent larger rainfall deficits
At the end of April 2016, El Nino continues to exert its influence with severe droughts across
the globe
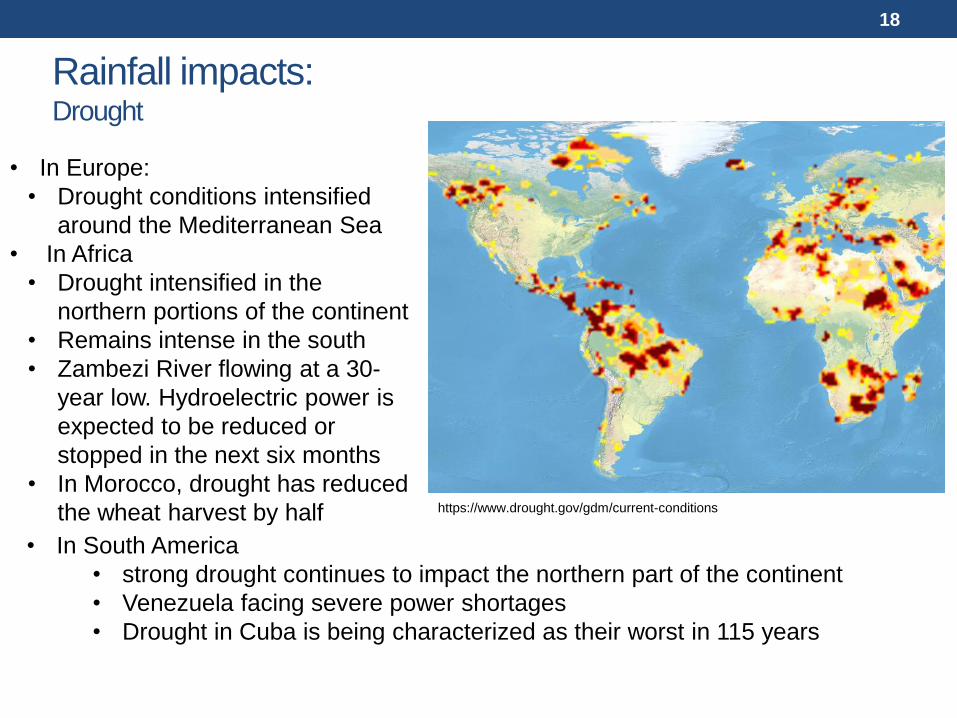
• In Europe:
• Drought conditions intensified
around the Mediterranean Sea
• In Africa
• Drought intensified in the
northern portions of the continent
• Remains intense in the south
• Zambezi River flowing at a 30-
year low. Hydroelectric power is
expected to be reduced or
stopped in the next six months
• In Morocco, drought has reduced
the wheat harvest by half
Rainfall impacts: Drought
18
https://www.drought.gov/gdm/current-conditions
• In South America
• strong drought continues to impact the northern part of the continent
• Venezuela facing severe power shortages
• Drought in Cuba is being characterized as their worst in 115 years

19
• In Asia • drought remains entrenched
across the Indian sub-
continent, around Mongolia,
and in the West.
• In Vietnam, the Mekong River
is at its lowest level since
1926.
• Reduced water supplies and
water-borne disease has led
to the death of 16 children in
the Thar district of Pakistan
• In Oceana • drought continues in
Southern Australia and
Papua New Guinea.
• Intensified over New Zealand
Rainfall impacts: Drought in Asia and the Pacific
https://www.drought.gov/gdm/current-conditions

Drought impacts to the USAPIs
• State of Emergency due to
drought declared for
• Republic of Palau
• Federated States of
Micronesia
• Federal and State levels
• Republic of the Marshall
Islands
• Water Rationing Implemented on
bigger islands
• Drinking water likely to become a
serious issues for smaller islands
• Damage to food crops likely for
smaller islands
• Lack of fresh water may lead to
deterioration in health.
20
Special acknowledgement to
Richard Heim NOAA/NCEI
Chip Guard NWS WFO Guam
WSO personnel throughout the USAPI

US Affiliated Pacific Islands PEAC Center Rainfall forecast performance
21
-1
-0.8
-0.6
-0.4
-0.2
0
0.2
0.4
0.6
0.8
1
-2.5
-2
-1.5
-1
-0.5
0
0.5
1
1.5
2
2.5
Aug-0
7
No
v-0
7
Feb
-08
Ma
y-0
8
Aug-0
8
No
v-0
8
Feb
-09
Ma
y-0
9
Aug-0
9
No
v-0
9
Feb
-10
Ma
y-1
0
Aug-1
0
No
v-1
0
Feb
-11
Ma
y-1
1
Aug-1
1
No
v-1
1
Feb
-12
Ma
y-1
2
Aug-1
2
No
v-1
2
Feb
-13
Ma
y-1
3
Aug-1
3
No
v-1
3
Feb
-14
Ma
y-1
4
Aug-1
4
No
v-1
4
Feb
-15
Ma
y-1
5
Aug-1
5
No
v-1
5
Fe
b-1
6
HS
S S
kill
Sco
re
Niñ
o 3
.4 a
no
maly
(C)
UKMO ECMWF Cons. Anog
NASA NCEP IRI
APCC PEAC CCA CONSEN
Final
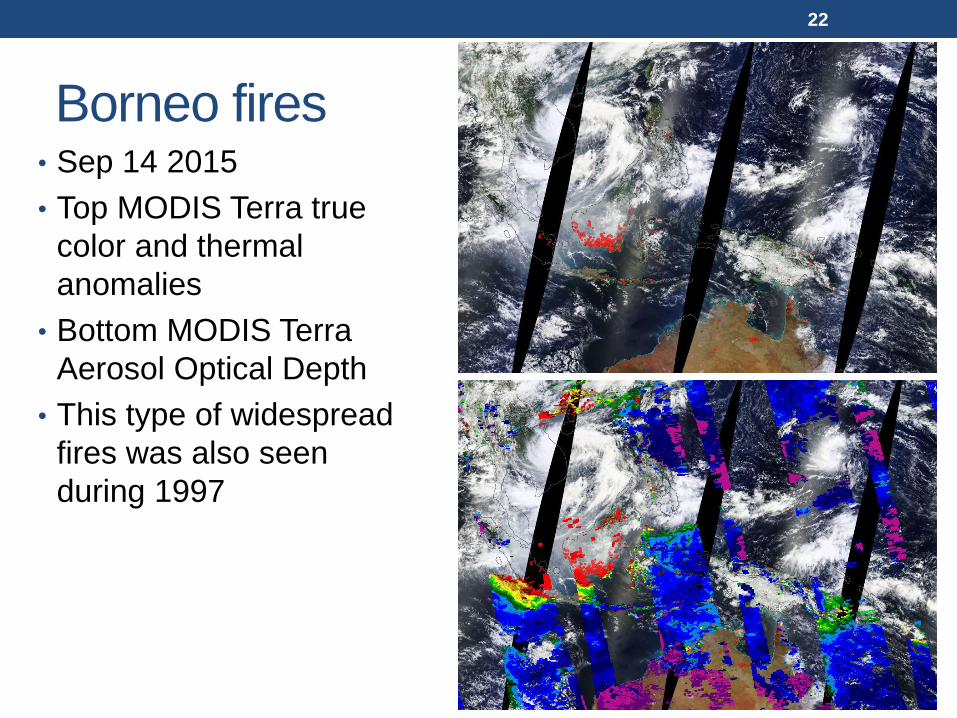
Borneo fires • Sep 14 2015
• Top MODIS Terra true
color and thermal
anomalies
• Bottom MODIS Terra
Aerosol Optical Depth
• This type of widespread
fires was also seen
during 1997
22
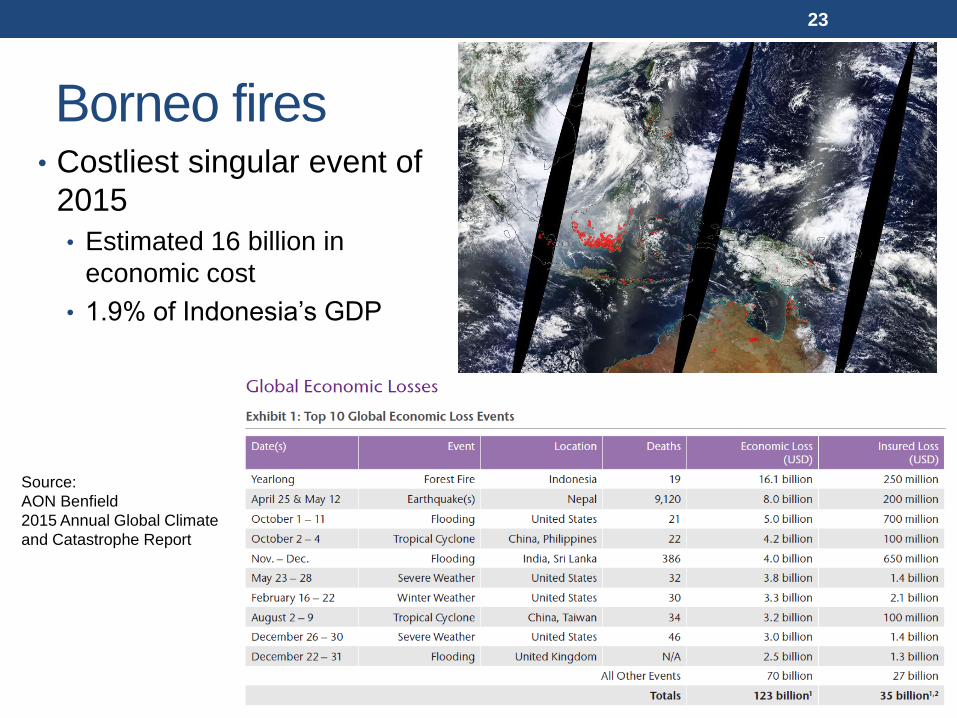
Borneo fires • Costliest singular event of
2015
• Estimated 16 billion in
economic cost
• 1.9% of Indonesia’s GDP
23
Source:
AON Benfield
2015 Annual Global Climate
and Catastrophe Report
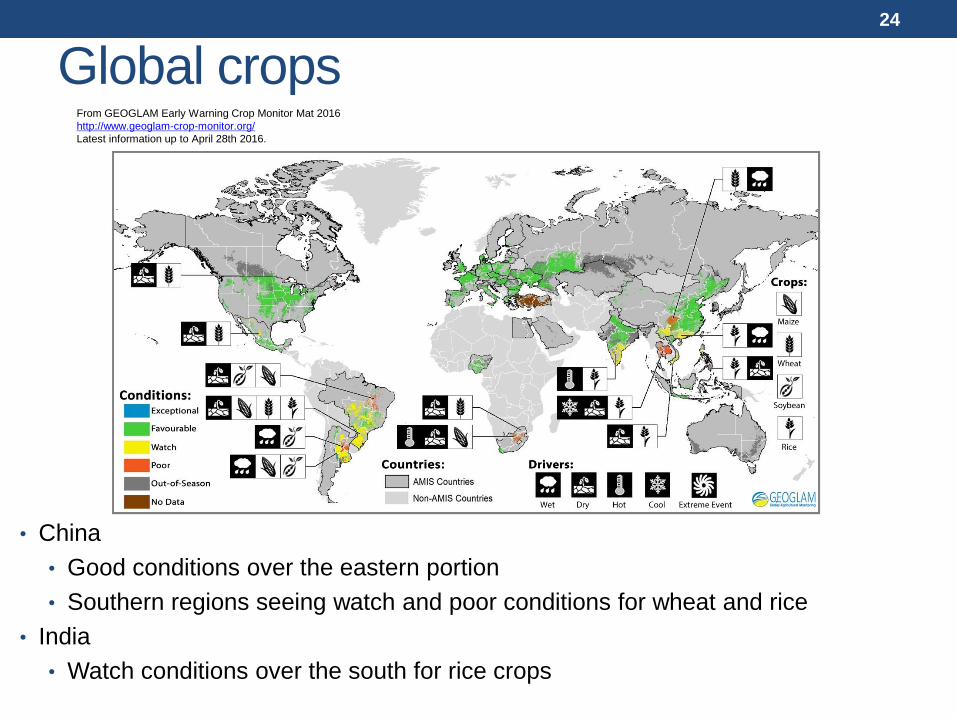
Global crops
• China
• Good conditions over the eastern portion
• Southern regions seeing watch and poor conditions for wheat and rice
• India
• Watch conditions over the south for rice crops
From GEOGLAM Early Warning Crop Monitor Mat 2016
http://www.geoglam-crop-monitor.org/
Latest information up to April 28th 2016.
24

Crops in Africa and South East Asia
• Africa
• Severe drought over the southern portion of the continent producing poor
conditions for most crops
• South East Asia
• Large portions of continental South East Asia and the Philippines seeing poor crop
conditions due to drought
From GEOGLAM Early Warning Crop Monitor Mat 2016
http://www.geoglam-crop-monitor.org/
Latest information up to April 28th 2016.
25
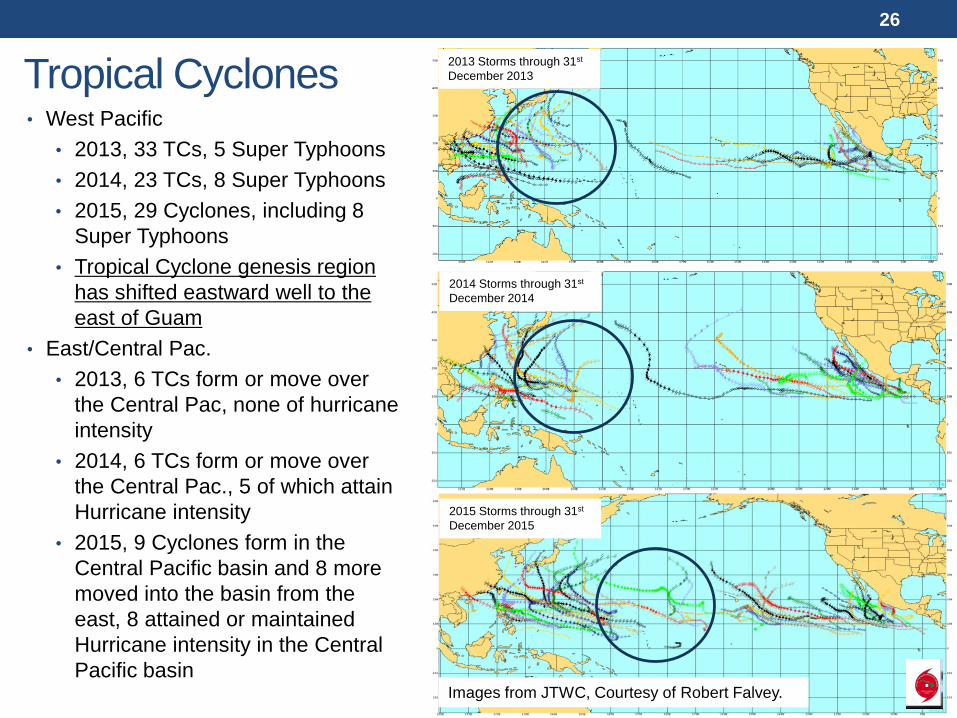
Tropical Cyclones • West Pacific
• 2013, 33 TCs, 5 Super Typhoons
• 2014, 23 TCs, 8 Super Typhoons
• 2015, 29 Cyclones, including 8
Super Typhoons
• Tropical Cyclone genesis region
has shifted eastward well to the
east of Guam
• East/Central Pac.
• 2013, 6 TCs form or move over
the Central Pac, none of hurricane
intensity
• 2014, 6 TCs form or move over
the Central Pac., 5 of which attain
Hurricane intensity
• 2015, 9 Cyclones form in the
Central Pacific basin and 8 more
moved into the basin from the
east, 8 attained or maintained
Hurricane intensity in the Central
Pacific basin
26
Images from JTWC, Courtesy of Robert Falvey.
2013 Storms through 31st
December 2013
2015 Storms through 31st
December 2015
2014 Storms through 31st
December 2014
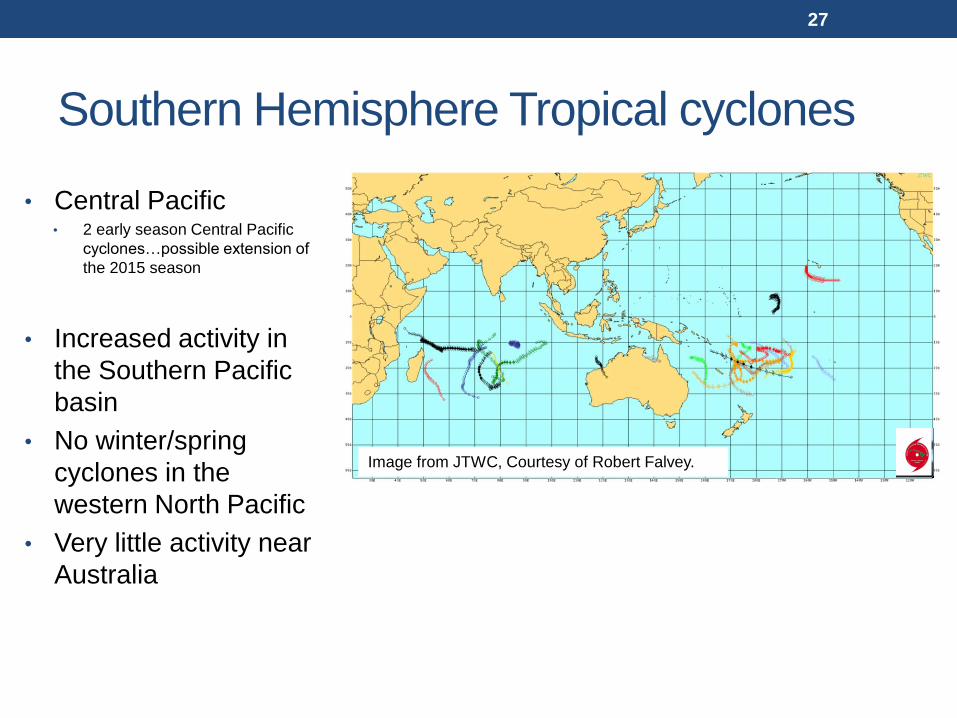
Southern Hemisphere Tropical cyclones
• Central Pacific • 2 early season Central Pacific
cyclones…possible extension of
the 2015 season
• Increased activity in
the Southern Pacific
basin
• No winter/spring
cyclones in the
western North Pacific
• Very little activity near
Australia
27
Image from JTWC, Courtesy of Robert Falvey.

Coral Bleaching Alert Areas
• The Central an Eastern Pacific show large areas of Level 2 alert (mortality likely)
• Indian Ocean under severe stress
• Alert level areas collocated with warmest SST anomalies
• Low sea levels may also be playing a role over the southwest Pacific
• Great Barrier Reef area which saw widespread bleaching in early 2016 may be
seeing some relief
28
From Coral Reef Watch
http://coralreefwatch.noaa.gov/satellite/baa.php
How ENSO affects global health
29
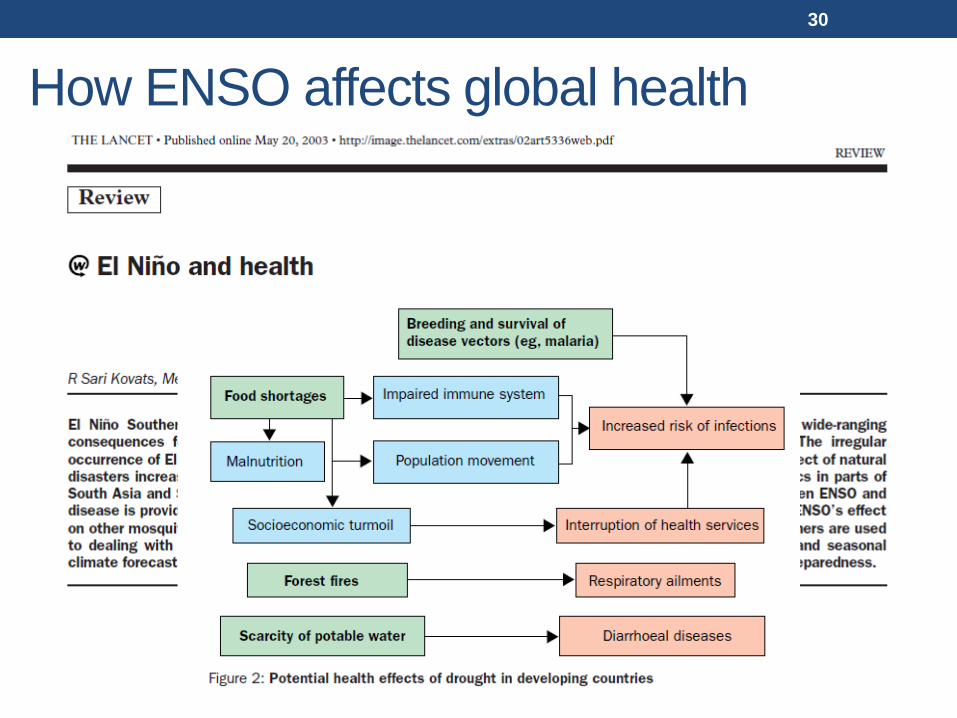
How ENSO affects global health
30
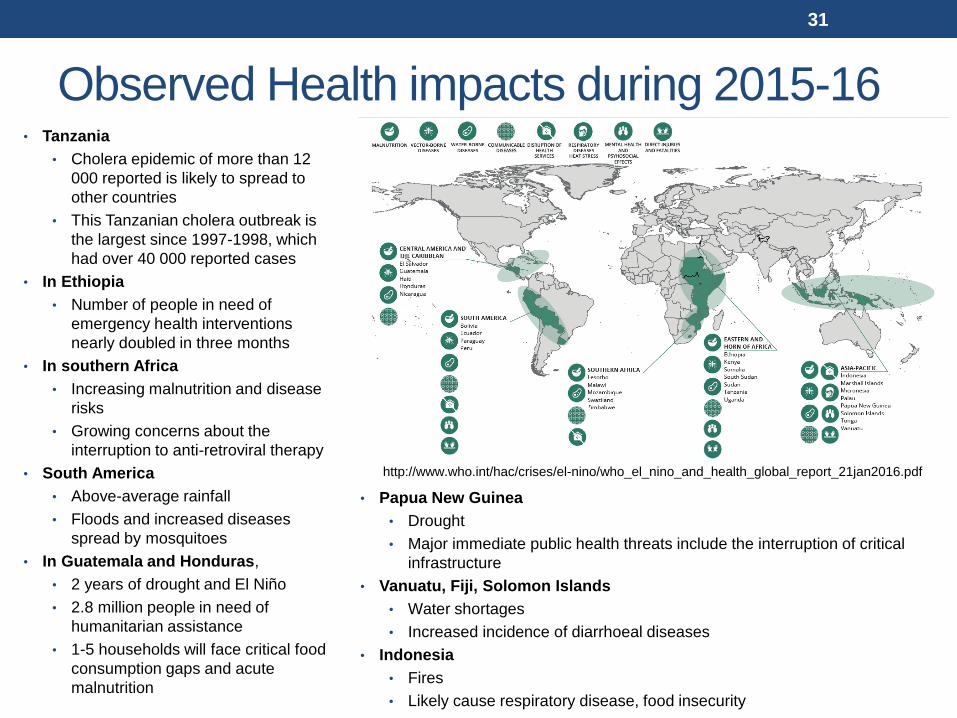
Observed Health impacts during 2015-16 • Tanzania
• Cholera epidemic of more than 12
000 reported is likely to spread to
other countries
• This Tanzanian cholera outbreak is
the largest since 1997-1998, which
had over 40 000 reported cases
• In Ethiopia
• Number of people in need of
emergency health interventions
nearly doubled in three months
• In southern Africa
• Increasing malnutrition and disease
risks
• Growing concerns about the
interruption to anti-retroviral therapy
• South America
• Above-average rainfall
• Floods and increased diseases
spread by mosquitoes
• In Guatemala and Honduras,
• 2 years of drought and El Niño
• 2.8 million people in need of
humanitarian assistance
• 1-5 households will face critical food
consumption gaps and acute
malnutrition
• Papua New Guinea
• Drought
• Major immediate public health threats include the interruption of critical
infrastructure
• Vanuatu, Fiji, Solomon Islands
• Water shortages
• Increased incidence of diarrhoeal diseases
• Indonesia
• Fires
• Likely cause respiratory disease, food insecurity
31
http://www.who.int/hac/crises/el-nino/who_el_nino_and_health_global_report_21jan2016.pdf

32
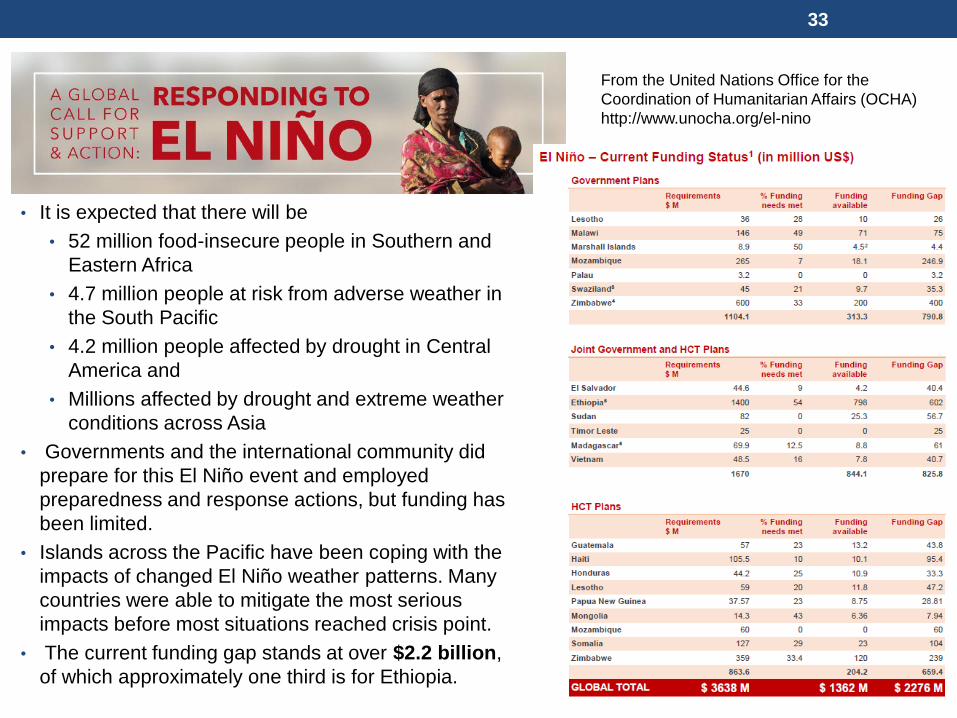
• It is expected that there will be
• 52 million food-insecure people in Southern and
Eastern Africa
• 4.7 million people at risk from adverse weather in
the South Pacific
• 4.2 million people affected by drought in Central
America and
• Millions affected by drought and extreme weather
conditions across Asia
• Governments and the international community did
prepare for this El Niño event and employed
preparedness and response actions, but funding has
been limited.
• Islands across the Pacific have been coping with the
impacts of changed El Niño weather patterns. Many
countries were able to mitigate the most serious
impacts before most situations reached crisis point.
• The current funding gap stands at over $2.2 billion,
of which approximately one third is for Ethiopia.
33
From the United Nations Office for the
Coordination of Humanitarian Affairs (OCHA)
http://www.unocha.org/el-nino
Forecast ENSO forecasts
Rainfall, Sea level, Tropical Cyclones and
Coral Bleaching
34

CPC/IRI ENSO Forecast
http://iri.columbia.edu/our-expertise/climate/forecasts/enso/current/
35
CPC/IRI EL NIÑO/SOUTHERN OSCILLATION
(ENSO) DIAGNOSTIC DISCUSSION
Expected Conditions
• Strong El Niño to continue weakening, and return to
neutral by late spring or early summer 2016
• 60% possibility for La Niña development by fall
Climate Prediction Center
National Centers for Environmental Prediction
NOAA/National Weather Service
College Park, MD 20740
Season La Niña Neutral El Niño
AMJ 2016 ~0% 24% 76%
MJJ 2016 5% 76% 19%
JJA 2016 31% 61% 8%
JAS 2016 47% 47% 6%
ASO 2016 52% 40% 8%
SON 2016 55% 35% 10%
OND 2016 59% 31% 10%
NDJ 2016 60% 30% 10%
DJF 2016 59% 32% 9%
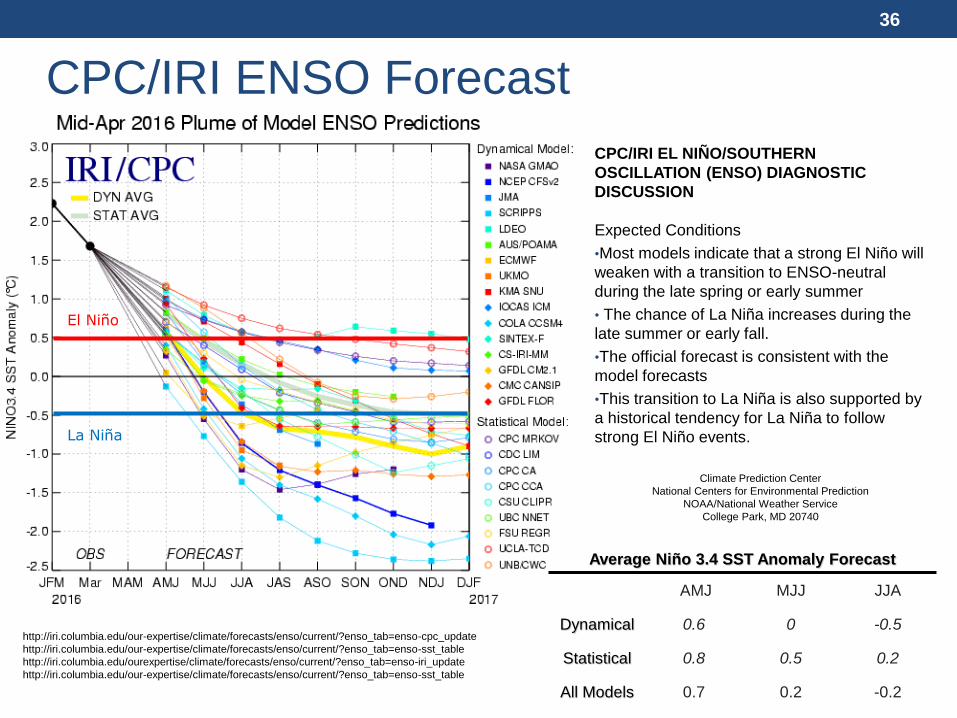
CPC/IRI EL NIÑO/SOUTHERN
OSCILLATION (ENSO) DIAGNOSTIC
DISCUSSION
Expected Conditions
•Most models indicate that a strong El Niño will
weaken with a transition to ENSO-neutral
during the late spring or early summer
• The chance of La Niña increases during the
late summer or early fall.
•The official forecast is consistent with the
model forecasts
•This transition to La Niña is also supported by
a historical tendency for La Niña to follow
strong El Niño events.
Climate Prediction Center
National Centers for Environmental Prediction
NOAA/National Weather Service
College Park, MD 20740
CPC/IRI ENSO Forecast
http://iri.columbia.edu/our-expertise/climate/forecasts/enso/current/?enso_tab=enso-cpc_update
http://iri.columbia.edu/our-expertise/climate/forecasts/enso/current/?enso_tab=enso-sst_table
http://iri.columbia.edu/ourexpertise/climate/forecasts/enso/current/?enso_tab=enso-iri_update
http://iri.columbia.edu/our-expertise/climate/forecasts/enso/current/?enso_tab=enso-sst_table
El Niño
La Niña
36
Average Niño 3.4 SST Anomaly Forecast
AMJ MJJ JJA
Dynamical 0.6 0 -0.5
Statistical 0.8 0.5 0.2
All Models 0.7 0.2 -0.2

Tropical SST Forecasts (May 2016-Oct 2016)
• This particular model ensemble
• Produces a reasonable La Niña “horse shoe” spatial pattern
• Develops La Niña conditions by July 2016
• Ensemble predictions for NINO3.4 index are around -0.8C (moderate La
Niña)
37
From: http://www.apcc21.org/ser/outlook.do?lang=en

Tropical Rainfall Forecasts (May 2016-Oct 2016)
• May-July
• Current dry conditions over the Western Pacific start to extend east past the dateline
• Dry conditions subsist over South America
• Strong wet conditions over the Indian Ocean
• August-October
• Wet conditions over the Indian Ocean intensify
• Dry conditions over the equatorial tropical Pacific extend to far along equator
• Dry conditions over South America persist
38
From: http://www.apcc21.org/ser/outlook.do?lang=en
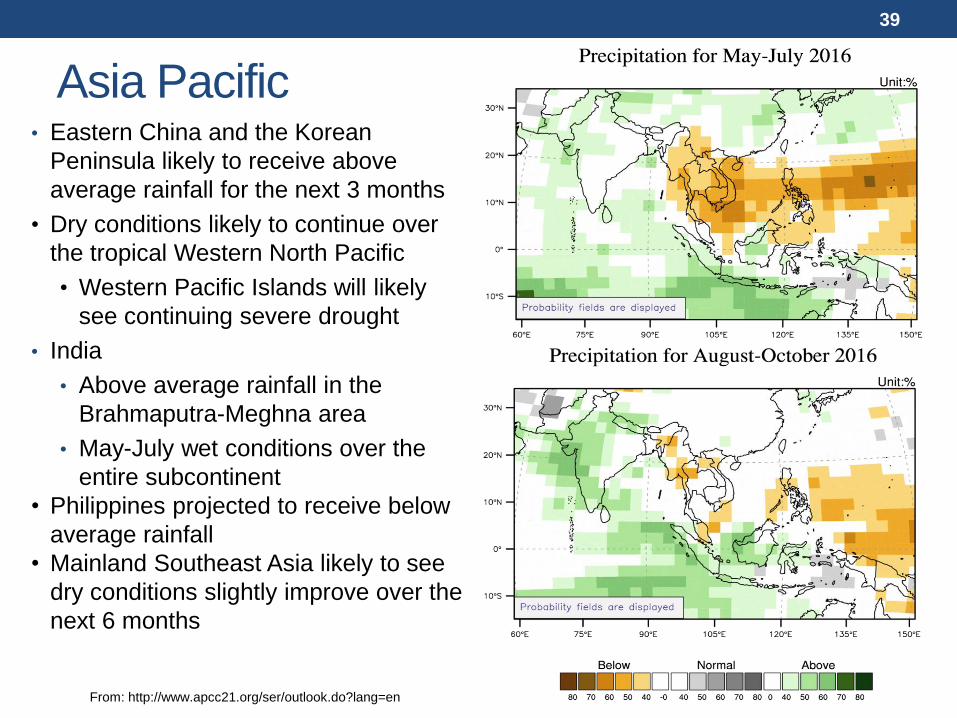
Asia Pacific • Eastern China and the Korean
Peninsula likely to receive above
average rainfall for the next 3 months
• Dry conditions likely to continue over
the tropical Western North Pacific
• Western Pacific Islands will likely
see continuing severe drought
• India
• Above average rainfall in the
Brahmaputra-Meghna area
• May-July wet conditions over the
entire subcontinent
• Philippines projected to receive below
average rainfall
• Mainland Southeast Asia likely to see
dry conditions slightly improve over the
next 6 months
39
From: http://www.apcc21.org/ser/outlook.do?lang=en
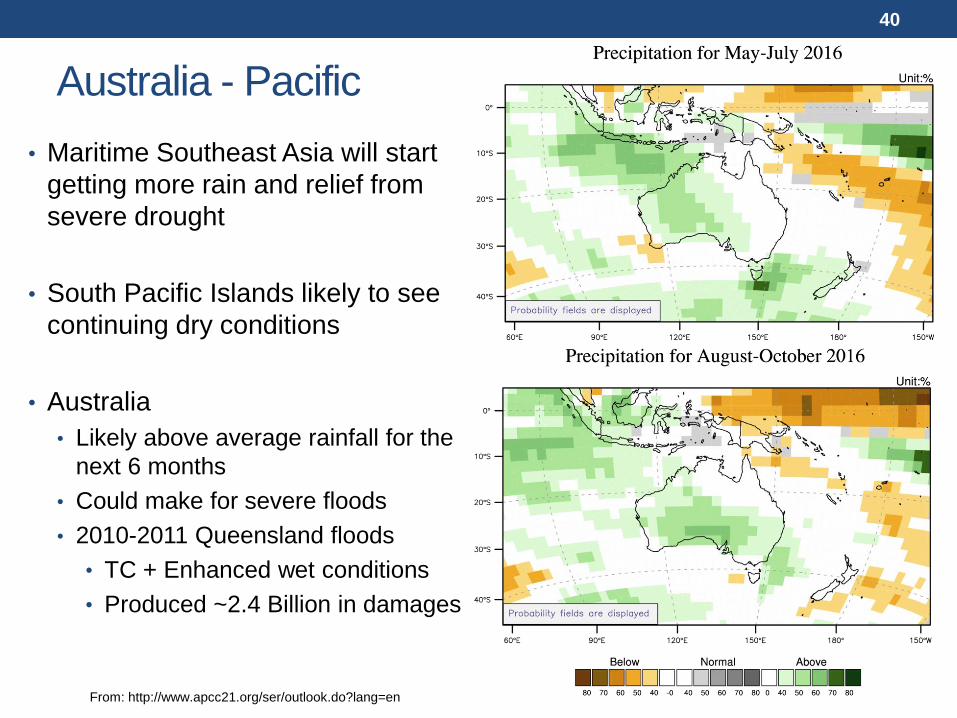
Australia - Pacific
• Maritime Southeast Asia will start
getting more rain and relief from
severe drought
• South Pacific Islands likely to see
continuing dry conditions
• Australia
• Likely above average rainfall for the
next 6 months
• Could make for severe floods
• 2010-2011 Queensland floods
• TC + Enhanced wet conditions
• Produced ~2.4 Billion in damages
40
From: http://www.apcc21.org/ser/outlook.do?lang=en
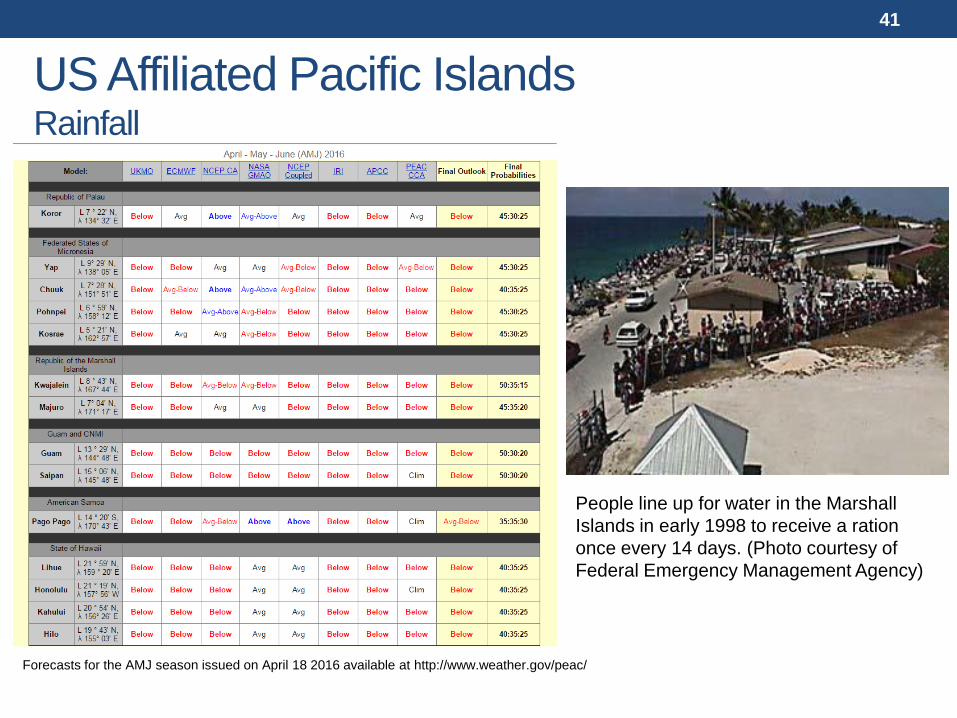
US Affiliated Pacific Islands Rainfall
Forecasts for the AMJ season issued on April 18 2016 available at http://www.weather.gov/peac/
41
People line up for water in the Marshall
Islands in early 1998 to receive a ration
once every 14 days. (Photo courtesy of
Federal Emergency Management Agency)
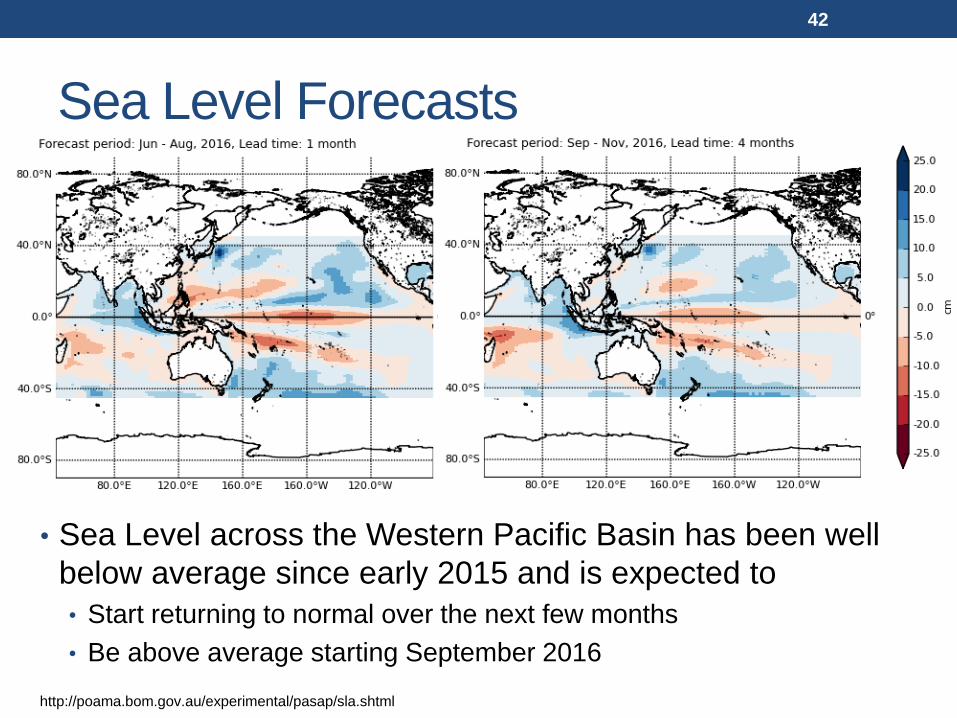
Sea Level Forecasts
• Sea Level across the Western Pacific Basin has been well
below average since early 2015 and is expected to
• Start returning to normal over the next few months
• Be above average starting September 2016
http://poama.bom.gov.au/experimental/pasap/sla.shtml
42

US Affiliated Pacific Islands Sea level forecast
43
Forecasts for the MAM season issued on March 12 available at http://www.weather.gov/peac/
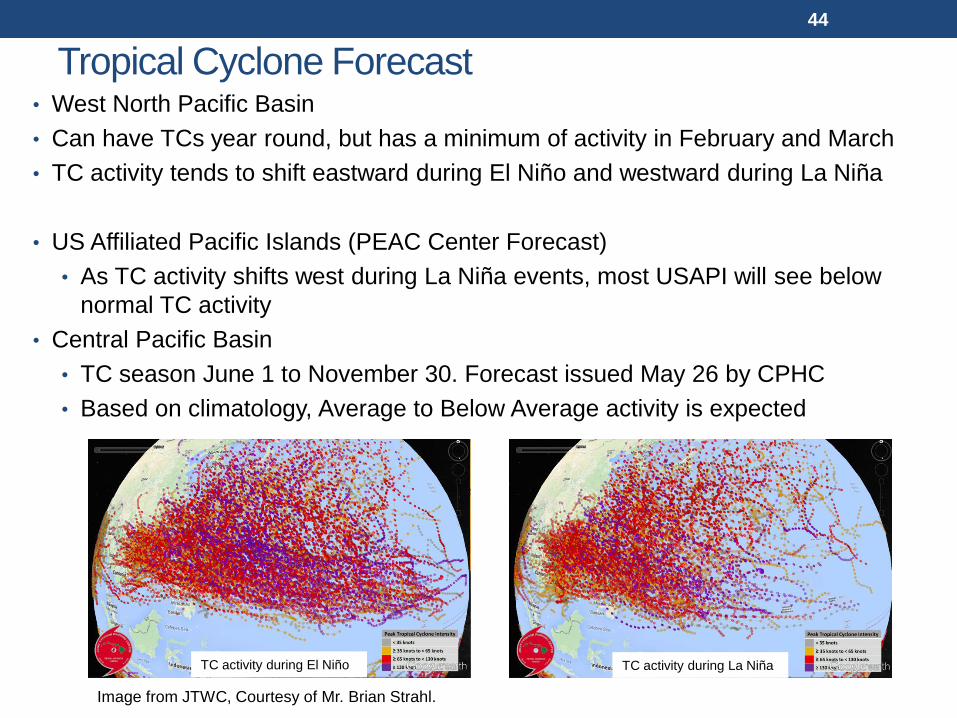
Tropical Cyclone Forecast • West North Pacific Basin
• Can have TCs year round, but has a minimum of activity in February and March
• TC activity tends to shift eastward during El Niño and westward during La Niña
• US Affiliated Pacific Islands (PEAC Center Forecast)
• As TC activity shifts west during La Niña events, most USAPI will see below
normal TC activity
• Central Pacific Basin
• TC season June 1 to November 30. Forecast issued May 26 by CPHC
• Based on climatology, Average to Below Average activity is expected
44
TC activity during El Niño TC activity during La Niña
Image from JTWC, Courtesy of Mr. Brian Strahl.

Tropical Cyclone Forecast • American Samoa TC season just ended (November to April)
• PEAC Center forecasts are for an average to below average 2016-2017 season
• Australia (Australian BOM Forecast)
• Below Average Cyclone season, Nov 1, 2015 – Apr 30, 2016
• Based on the BOM 2010-2011 forecast
• Australian region likely to get above average TC activity during the 2016-
2017 season
45
TC activity during El Niño TC activity during La Niña
Image from JTWC, Courtesy of Mr. Brian Strahl.

Tropical Cyclone Forecast
• South China Sea (City University of Hong Kong)
• Forecast issued in April and July for June1 to November 30
• Based on the forecasts for 2007/2008 & 2010/2011 La Niña suggest TC
activity shifted westward
• Likely to see greater number of landfalling storms
• Indian Ocean
• Enhanced activity in the Bay of Bengal during La Niña
46
TC activity during El Niño TC activity during La Niña
Image from JTWC, Courtesy of Mr. Brian Strahl.
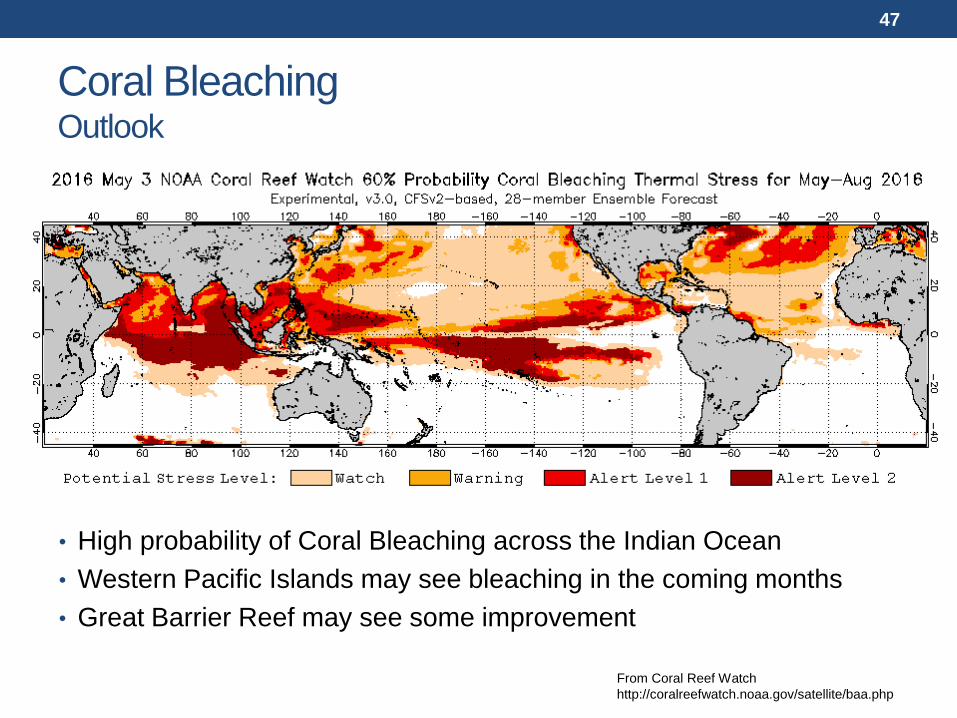
Coral Bleaching Outlook
• High probability of Coral Bleaching across the Indian Ocean
• Western Pacific Islands may see bleaching in the coming months
• Great Barrier Reef may see some improvement
From Coral Reef Watch
http://coralreefwatch.noaa.gov/satellite/baa.php
47
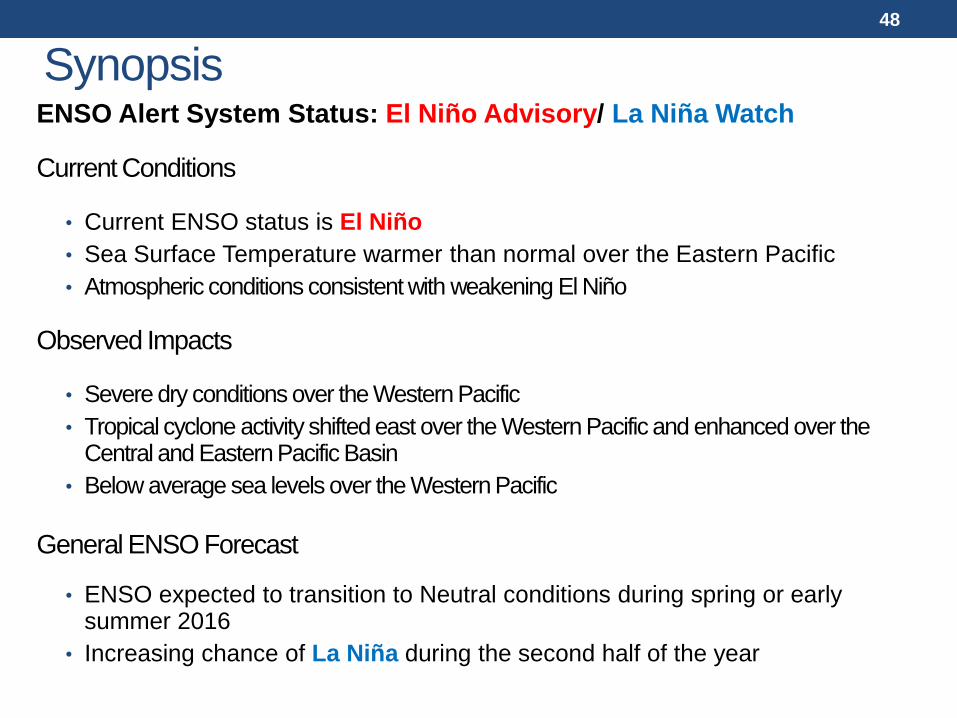
ENSO Alert System Status: El Niño Advisory/ La Niña Watch
Current Conditions
• Current ENSO status is El Niño
• Sea Surface Temperature warmer than normal over the Eastern Pacific
• Atmospheric conditions consistent with weakening El Niño
Observed Impacts
• Severe dry conditions over the Western Pacific
• Tropical cyclone activity shifted east over the Western Pacific and enhanced over the Central and Eastern Pacific Basin
• Below average sea levels over the Western Pacific
General ENSO Forecast
• ENSO expected to transition to Neutral conditions during spring or early summer 2016
• Increasing chance of La Niña during the second half of the year
Synopsis 48
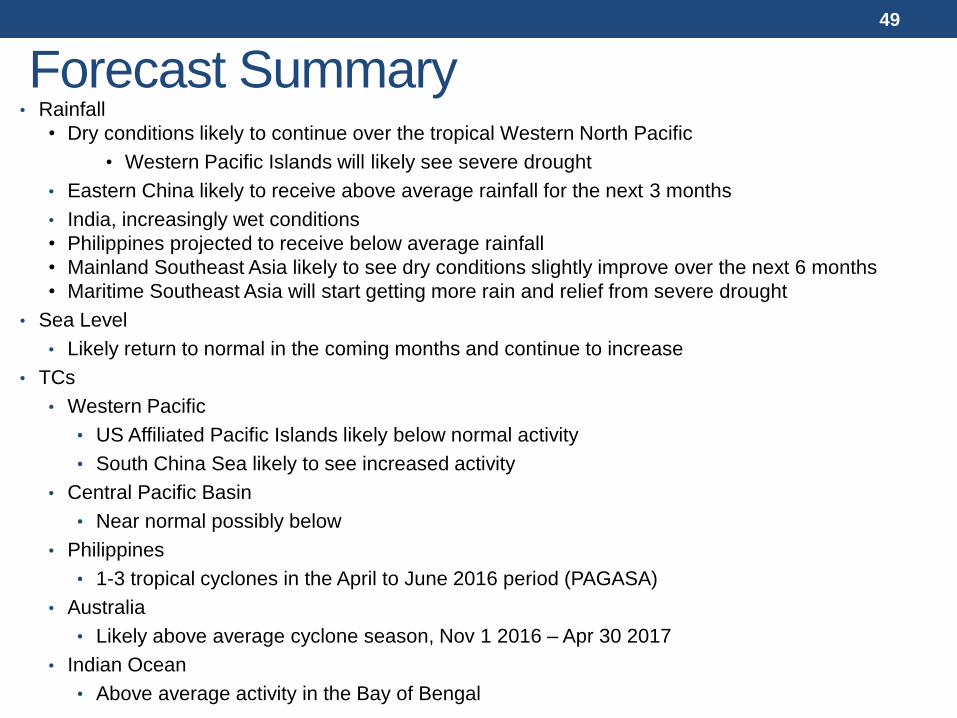
Forecast Summary • Rainfall
• Dry conditions likely to continue over the tropical Western North Pacific
• Western Pacific Islands will likely see severe drought
• Eastern China likely to receive above average rainfall for the next 3 months
• India, increasingly wet conditions
• Philippines projected to receive below average rainfall
• Mainland Southeast Asia likely to see dry conditions slightly improve over the next 6 months
• Maritime Southeast Asia will start getting more rain and relief from severe drought
• Sea Level
• Likely return to normal in the coming months and continue to increase
• TCs
• Western Pacific
• US Affiliated Pacific Islands likely below normal activity
• South China Sea likely to see increased activity
• Central Pacific Basin
• Near normal possibly below
• Philippines
• 1-3 tropical cyclones in the April to June 2016 period (PAGASA)
• Australia
• Likely above average cyclone season, Nov 1 2016 – Apr 30 2017
• Indian Ocean
• Above average activity in the Bay of Bengal
49
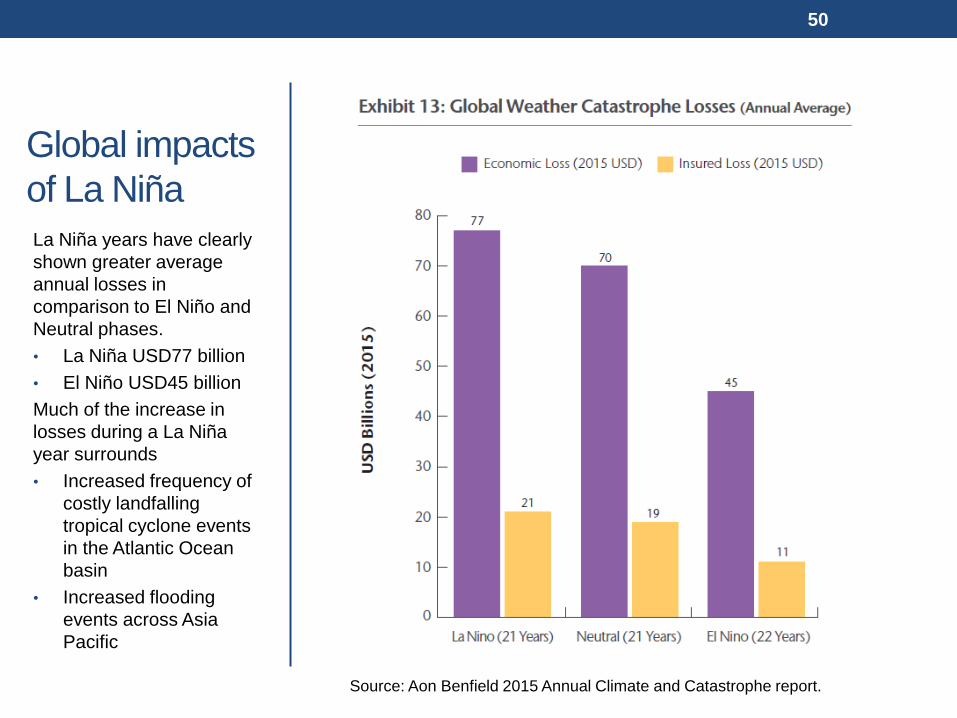
Global impacts
of La Niña
La Niña years have clearly
shown greater average
annual losses in
comparison to El Niño and
Neutral phases.
• La Niña USD77 billion
• El Niño USD45 billion
Much of the increase in
losses during a La Niña
year surrounds
• Increased frequency of
costly landfalling
tropical cyclone events
in the Atlantic Ocean
basin
• Increased flooding
events across Asia
Pacific
50
Source: Aon Benfield 2015 Annual Climate and Catastrophe report.
La Niña can linger on…
• While El Niño conditions rarely persist more than one year
La Niña conditions can persist many years
• 1953/1954 El Niño followed by La Niña conditions from AMJ1954
trough AMJ 1956
• 1969/1970 El Niño followed by La Niña conditions from JJA1970
trough DJF 1972
• 1972/1973 El Niño followed by La Niña conditions from MJJ1973
trough FMA 1976
• 1997/1998 El Niño followed by La Niña conditions from JJA1998
trough FMA 2001
• This makes it so that La Niña type impacts can be present
for many years.
51
The PEAC Center
The Pacific ENSO Applications Climate
Center
Photo courtesy of
Lt. Charlene Felkley