Embed Size (px)
Citation preview
Package ‘surveyeditor’June 3, 2015
Type Package
Title Generate a Survey that can be Completed by Survey Respondents
Version 1.0
Date 2015-05-14
Author Char Leung
Maintainer Char Leung <[email protected]>
Description Help generate slides for surveys or experiments.The resulted slides allow the subject to respond with the use of the mouse (usual keyboard input isreplaced with clicking on a virtual keyboard on the slide). Subjects' responses are saved to the user-specified location in the form of R-readable text file. To allow flexibility, each function inthis package generates a particular type of slides thus general R function writing skills arerequired to compile these edited slides.
License GPL (>= 2)
NeedsCompilation no
Repository CRAN
Date/Publication 2015-06-03 19:03:49
R topics documented:
surveyeditor-package . . . . . . . . . . . . . . . . . . . . . . . . . . . . . . . . . . . . 2cover . . . . . . . . . . . . . . . . . . . . . . . . . . . . . . . . . . . . . . . . . . . . . 4identity . . . . . . . . . . . . . . . . . . . . . . . . . . . . . . . . . . . . . . . . . . . 6read.write . . . . . . . . . . . . . . . . . . . . . . . . . . . . . . . . . . . . . . . . . . 8slide . . . . . . . . . . . . . . . . . . . . . . . . . . . . . . . . . . . . . . . . . . . . . 10
Index 23
1
2 surveyeditor-package
surveyeditor-package Generate a Survey that can be Completed by Survey Respondents
Description
Help generate slides for surveys or experiments. The resulted slides allow the subject to respondwith the use of the mouse (usual keyboard input is replaced with clicking on a virtual keyboard onthe slide). Subjects’ responses are saved to the user- specified location in the form of R-readabletext file. To allow flexibility, each function in this package generates a particular type of slides thusgeneral R function writing skills are required to compile these edited slides.
Details
The DESCRIPTION file:
Package: surveyeditorType: PackageTitle: Generate a Survey that can be Completed by Survey RespondentsVersion: 1.0Date: 2015-05-14Author: Char LeungMaintainer: Char Leung <[email protected]>Description: Help generate slides for surveys or experiments. The resulted slides allow the subject to respond with the use of the mouse (usual keyboard input is replaced with clicking on a virtual keyboard on the slide). Subjects’ responses are saved to the user- specified location in the form of R-readable text file. To allow flexibility, each function in this package generates a particular type of slides thus general R function writing skills are required to compile these edited slides.License: GPL (>=2)
Index of help topics:
cover Cover pageidentity Subject id configurationread.write Dynamic survey data storage functionslide Survey/questionnaire slidessurveyeditor-package Generate a Survey that can be Completed by
Survey Respondents
This package aims to serve as an editor for generating slides for surveys or experiments. The re-sulted slides allow the subject to respond with the use of the mouse (usual keyboard input is replacedwith clicking on a virtual keyboard on the slide). Subjects’ responses are saved to the user- speci-fied location in the form of R-readable text file. To allow flexibility, each function in this packagegenerates a particular type of slides thus general R function writing skills are required to compilethese edited slides.Main features include:
• Edit texts in each slide as well as their font size and colour.
• Insert tables and plots (point, line and histogram).
surveyeditor-package 3
• Allow time-restricted display (only for slides not requiring responses).
• Different types of responding such as numerical input, multiple choices (can have more thanone selections), Likert scale type questions, number line drawing type question (eg, used inKanayet & Opfer 2009 and Siegler & Opfer 2003) and Gabor-Granger method (Gabor &Granger 1966, 1979).
• Automatically save responses to a file to a user-specified location in the form of R-readabletext file.
There are in general 4 functions in this package:cover : serves as the front or back cover page of the survey. For example, you may wish to have agreeting slide before the survey begins.identity : serves as gathering the id of the subject. Automatic id generation is also allowed.read.write : serves as saving the responses to a nominated file.slide : generates slides to be displayed to the subjects as well as allowing the subjects to respondto designated questions. This is the main function in this package.
The editor of the survey should write a function (a compiler) to compile different functions intoa meaningful survey. A recommended format is shown below,compiler<-function(){coveridentityslideslide...read.writecover}The first cover serves as the front page then the identity of the subject is configured in identity.slide is the main part of the survey that display information and allow the subject to respond. Re-sponses are then saved to the nominated file through the read.write function. The survey ends inthe second cover informing the subject the completion.More specifically, the below is an example,sample.survey<-function(){link<-"C:"repeat {cover(type="front")id<-identity(link=link, ...)Q1<-slide(id=id, ...)Q2<-slide(id=id, ...)...read.write(rbind(Q1,Q2,...),link=link)cover(type="back")} }The repeat is used to let the next subject take the survey and the response will be incorporated intothe user-specified location.
Notes: Here is some recommendations for the best performance.
4 cover
• The graphic device should be adjusted to full-screen size or some texts may appear out-side the box.
• It is a good idea to inform the subjects (preferably by stating in a slide titled "Instruc-tions") that all responses of the previous slides cannot be altered and that clicking thegreen button in any slide will proceed to the next slide allowing no further alteration tothe response. In fact this is the reason only certain buttons are green.
Author(s)
Char LeungMaintainer: Char Leung <[email protected]>
References
Gabor, G & Granger, CWJ (1966) "Price as an indicator of Quality: Report on an Enquiry", Eco-nomica, 33(129), pp.43-70.Gabor, G & Granger, CWJ (1979) "The Attitude of the Consumer to Prices", Management Deci-sion, 17(8), pp.619-634.Kanayet, F & Opfer, J (2009) "Why Children’s Number-line Estimates Follow Fechner’s Law",Cognitive Science Conference Proceedings 2009, pp.1936-41.Siegler, RS & Opfer, JE (2003) "The Development of Numerical Estimation: Evidence for MultipleRepresentations of Numerical Quantity", Psychological Science, 14(3), May 2003, pp.237-243.
cover Cover page
Description
Front and back cover page of the survey.
Usage
cover(type = c("front", "back"), content, col, size, loc, time = NULL)
Arguments
type To indicate if the cover is a front of a back cover page. If back page, time mustbe set. See Details for other differences.
content Texts to be displayed in the slide. It can be a vector c( ) containing multipleitems.
col The colour of content hence its length must be the same as that of content.
size The font size of content hence its length must be the same as that of content.
loc The vertical location of content. Must be a number within the interval [0,100].Its length must be the same as that of content.
time The time (in seconds) that the slide is displayed for. Works only type="back".See Details.
cover 5
Details
If it is a front cover page (i.e. type="front") a green button is shown in the bottom of the slideto allow proceeding to the next slide. The reason that time only works for type="back" is thatthe back cover page closes in a few seconds so the entire survey program starts again for the nextsubject if the command repeat{} is used. For example,repeat{cover(type="front",...)identity(...)slide(...)slide(...)...read.write(...)cover(type="back",time=10,...)}
Value
A slide is displayed on the graphic device and no output in the console.
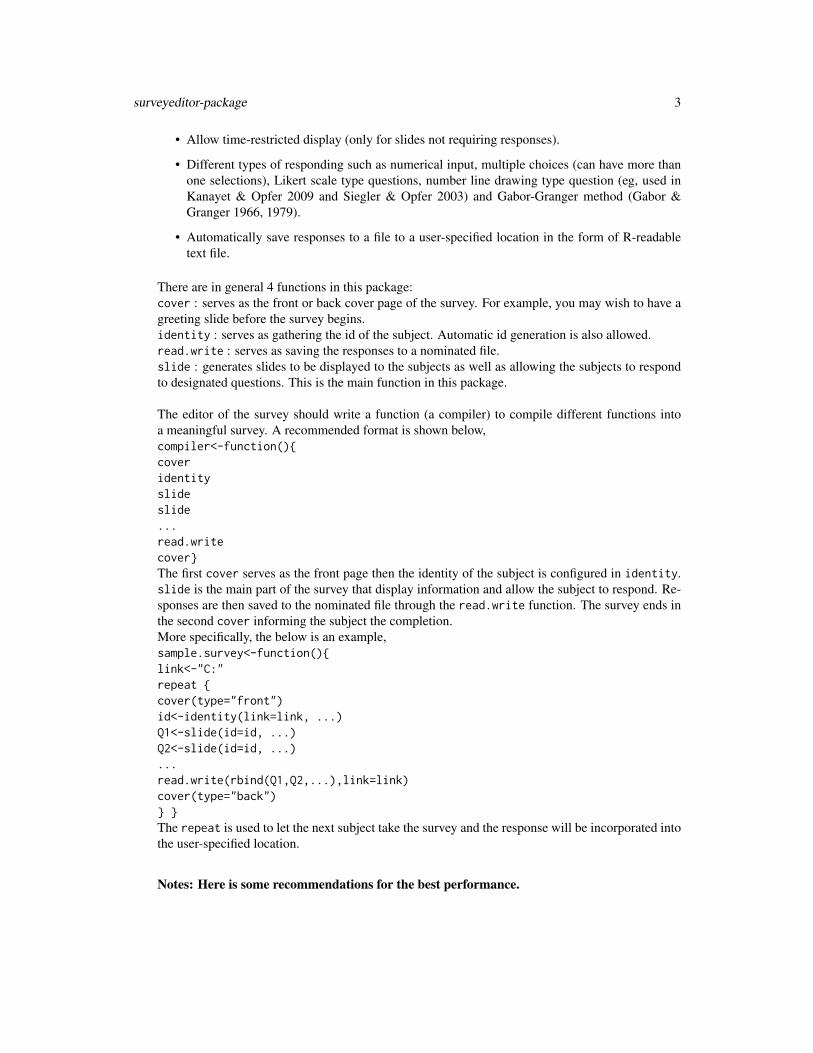
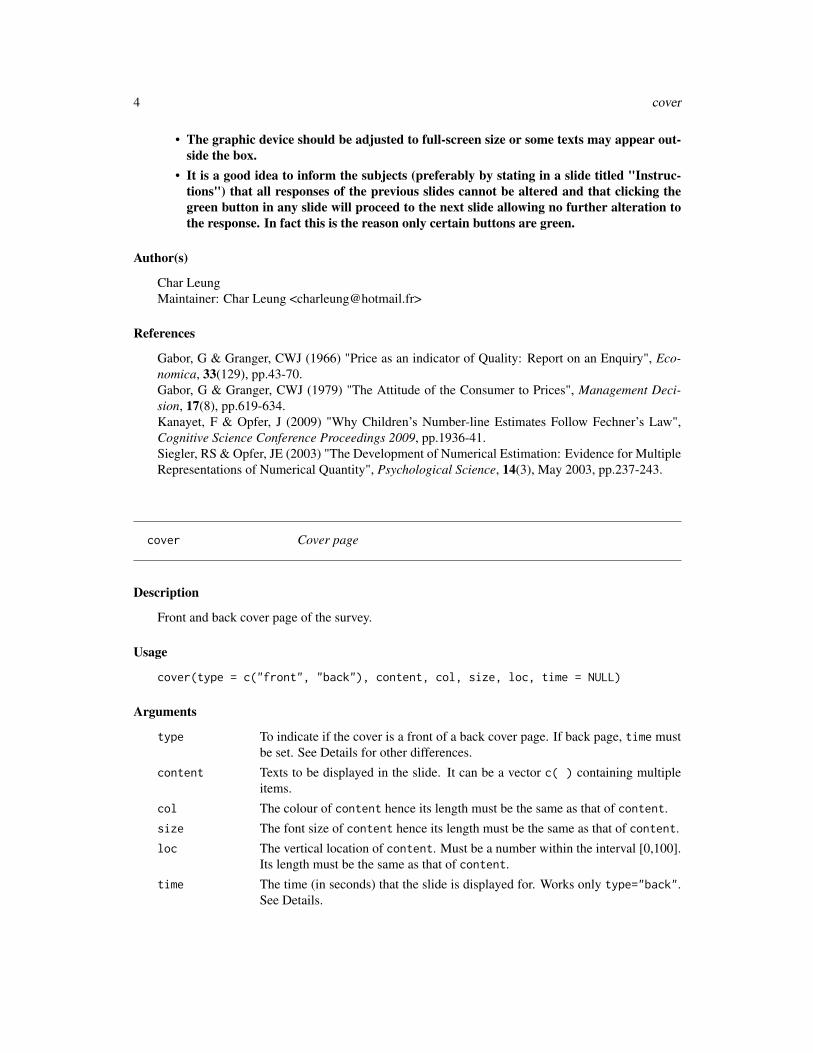
Returning graphics of Examples
6 identity
Author(s)
Char Leung
See Also
identity,read.write,slide
Examples
## Not run: cover(type="front",content=c("Inflation expectation experiment","Please waitfor further instructions"),col=c("blue","black"),size=c(2.5,1.5),loc=c(60,30))## End(Not run)## Not run: cover(type="back",content="This is the end of the survey\nThank you for yourparticipation",col="black",size=2,loc=70,time=3)## End(Not run)
identity Subject id configuration
Description
To configure the identity of the subject assuming that there is more than one subject in the survey.This is done by two methods: (1) manual configuration generates a slide to ask the subject for an id.The question asking the subject must be edited and (2) automatic configuration requires the editorto insert a file location where a file is read and the previous id is sought. Then current id is thesought previous id "+1". This means that the resulted id is a set of natural number. This option isbest used when the real identity of the subject is not to be disclosed.
identity 7
Usage
identity(type = c("manual", "auto"), ask = NULL, link = NULL)
Arguments
type Either "manual" or "auto" to indicate manual or automatic configuration.
ask The question asking for the id to be displayed in the slide if type="manual". Astring thus must be quoted. The question will be allocated at the top left handcorner. Font size and colour are fixed at 2 and "black".
link The location of the file that will be sought for the previous id if type="auto".A string thus must be quoted.
Details
If type="auto", there are three possible the outcomes in seeking the file link.(1) The file link exists and it has column names ID, Question.number, type, Condition.Likertand Response (this is the universal format of the responses returned by slide). In this case, theprevious id is successfully sought and the automatically generated id is the previous id "+1".(2) The file link does not exist. In this case, the file link is generated with the column names ID,Question.number, type, Condition.Likert and Response. The automatically generated id is madeto 1.(3) The file link exists but this not have column names link is generated with the column namesID, Question.number, type, Condition.Likert and Response. This is usually the case where thefile name is already in use. Either the file name of the existing file or link should be altered.
Value
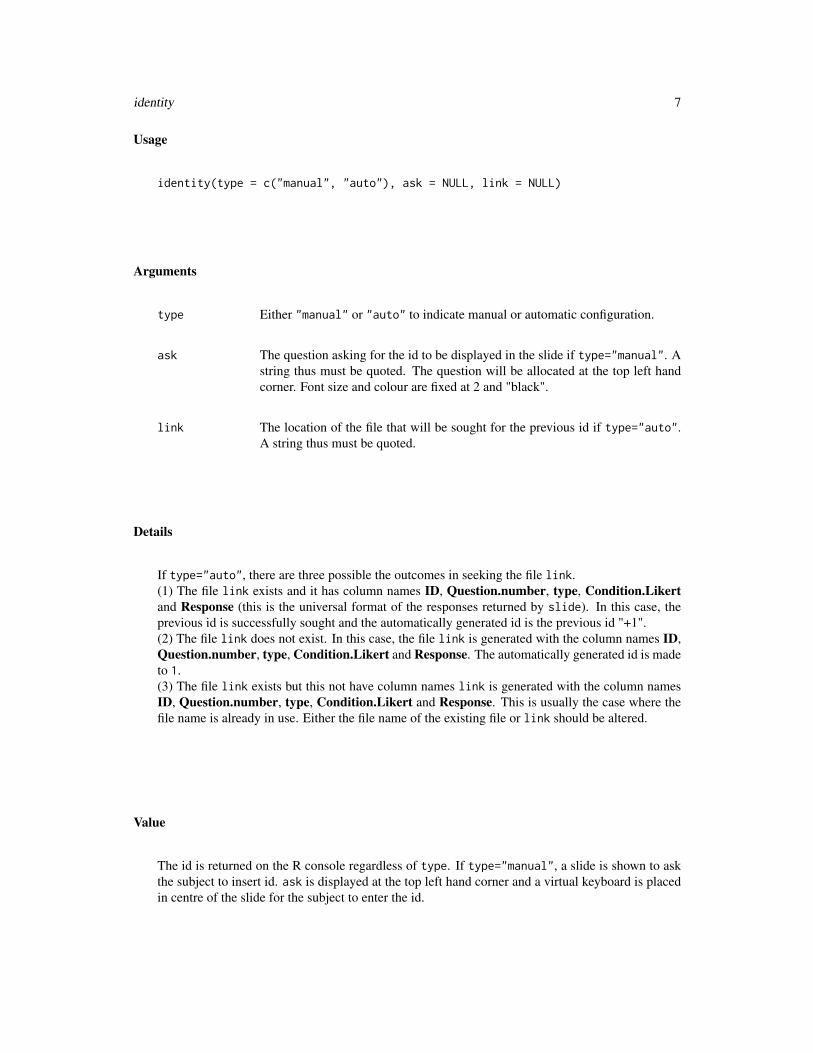
The id is returned on the R console regardless of type. If type="manual", a slide is shown to askthe subject to insert id. ask is displayed at the top left hand corner and a virtual keyboard is placedin centre of the slide for the subject to enter the id.
8 read.write
Returning graphics of examples
Author(s)
Char Leung
See Also
slide
Examples
## Not run: identity(type="manual",ask="Please insert your student ID by clicking on the belowvirtual keyboard")## End(Not run)## Not run: identity(type="auto",link="R:/survey.txt")
read.write Dynamic survey data storage function
Description
This function saves matrix-type responses to a nominated file. If the nominated file already existsand the responses of previous subjects are in the file, current matrix-type bundled responses will beincorporated into this file.Note: one should bundle multiple responses (i.e. responses from multiple slide) by using therbind function.
read.write 9
Usage
read.write(rbind.result, link)
Arguments
rbind.result Bundled responses formed by using rbind to bind the responses from slide. Asseen in slide, slide returns a 5-column matrix with column names ID, Ques-tion.number, type, Condition.Likert and Response. Therefore, responsesfrom multiple slide must be compiled with the use of rbind.
link The location of the file that rbind.result will be incorporated into.
Details
There are three possible the outcomes in seeking the file, link.(1) The file link exists and it has column names ID, Question.number, type, Condition.Likertand Response (the universal format of the responses returned by slide). In this case, rbind.resultis incorporated into link.(2) The file link does not exist. In this case, the file link is generated with the column names ID,Question.number, type, Condition.Likert and Response and rbind.result is incorporated intolink.(3) The file link exists but this not have column names ID, Question.number, type, Condi-tion.Likert and Response. This is usually the case where the file name in link is already inuse. Either the file name of the existing file in the directory link or the link in this function shouldbe altered to avoid confusion.
Value
Nothing is shown in the R console or the graphic device. Yet the file link will be altered (asrbind.result is incorporated) or will be created.
Author(s)
Char Leung
See Also
slide
Examples
## Not run: link<-"R:/test.txt"## Not run: id<-identity("auto",link=link)## Not run: Q1<-slide(id=id,type=7,title="Question 1",content="Would you take the milk ifit costs $",h=0,v=80,size=2,col="black",initial=3,increment=1,order="descending",box.level=70)## End(Not run)## Not run: Q2<-slide(id=id,type=5,title="Question 2",content=c("The market price is $","(0 refers to 'Strongly disagree' ... 5 refers to 'Strongly agree')"),h=c(0,0),v=c(80,70),size=c(2,1.5),col=c("black","orange"),cond=seq(10,12,0.5),scale=seq(0,5,0.5),box.level=50)
10 slide
## End(Not run)## Not run: read.write(rbind(Q1,Q2),link=link) #rbind is used to form a bundledmatrix-type responses## End(Not run)
slide Survey/questionnaire slides
Description
This function generates slides for displaying information (including questions to be asked) and forthe subjects to insert answers. 7 types of slides are available (the argument type specifies this; seeArguments below).
For type=1 or 2, the slide is solely for display purpose (e.g. showing the instructions of the surveyor background information) and responses from the subject are not needed.
For other values of type, a 5-column matrix is returned. The column names are ID, Question.number,type, Condition.Likert and Response. Also see Values below. The number of rows is determinedby the number of responses gathered by the slide. For example, for type=2 only one reponse isallowed to be given by the subject therefore there will be a 1x5 matrix returned.
The below table (in a few partitions) shows the number of allowed responses for different val-ues of type,
type= Slide type Allowed responses—– ——————————————– ——————————————————1 Time-restricted display 02 Time-unrestricted display 03 Numerical response display 14 Multiple choice response display Freely set and up to the number of
available choices (n.select)5 Sequential Likert-scale response display The number of conditions
given (the length of cond)6 "Number line marking" response display Freely set (n.select)7 Gabor-Granger method display 1
Usage
slide(id, type, title, content, h, v, size, col, time = NULL, interval = c(-Inf, Inf),isinteger = F, choices = NULL, layout = NULL, n.select = NULL, box.level = NULL,cond = NULL, scale = NULL, grid = NULL, range = NULL, unit = NULL, initial = NULL,increment = NULL, order = c("ascending", "descending"), Extra = NULL, Line.draw = NULL)
slide 11
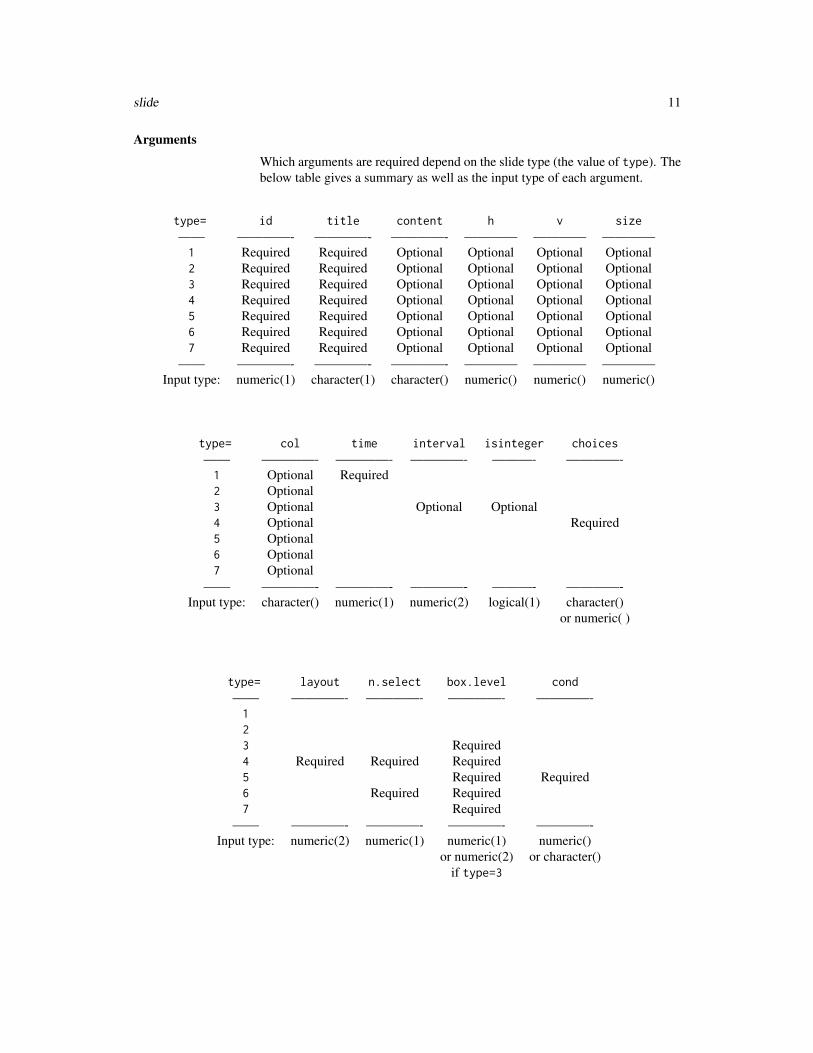
Arguments
Which arguments are required depend on the slide type (the value of type). Thebelow table gives a summary as well as the input type of each argument.
type= id title content h v size—— ————- ————- ————- ———— ———— ————1 Required Required Optional Optional Optional Optional2 Required Required Optional Optional Optional Optional3 Required Required Optional Optional Optional Optional4 Required Required Optional Optional Optional Optional5 Required Required Optional Optional Optional Optional6 Required Required Optional Optional Optional Optional7 Required Required Optional Optional Optional Optional
—— ————- ————- ————- ———— ———— ————Input type: numeric(1) character(1) character() numeric() numeric() numeric()
type= col time interval isinteger choices—— ————- ————- ————- ———- ————-1 Optional Required2 Optional3 Optional Optional Optional4 Optional Required5 Optional6 Optional7 Optional
—— ————- ————- ————- ———- ————-Input type: character() numeric(1) numeric(2) logical(1) character()
or numeric( )
type= layout n.select box.level cond—— ————- ————- ————- ————-123 Required4 Required Required Required5 Required Required6 Required Required7 Required
—— ————- ————- ————- ————-Input type: numeric(2) numeric(1) numeric(1) numeric()
or numeric(2) or character()if type=3
12 slide
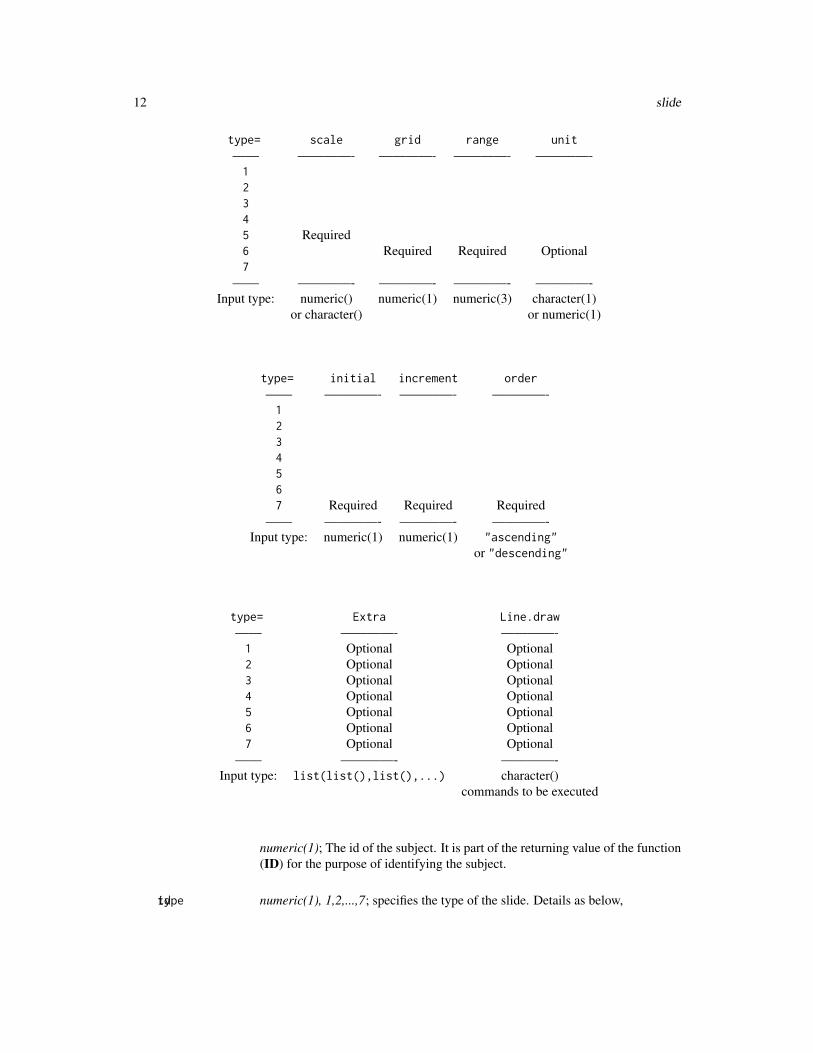
type= scale grid range unit—— ————- ————- ————- ————-12345 Required6 Required Required Optional7
—— ————- ————- ————- ————-Input type: numeric() numeric(1) numeric(3) character(1)
or character() or numeric(1)
type= initial increment order—— ————- ————- ————-1234567 Required Required Required
—— ————- ————- ————-Input type: numeric(1) numeric(1) "ascending"
or "descending"
type= Extra Line.draw—— ————- ————-1 Optional Optional2 Optional Optional3 Optional Optional4 Optional Optional5 Optional Optional6 Optional Optional7 Optional Optional
—— ————- ————-Input type: list(list(),list(),...) character()
commands to be executed
numeric(1); The id of the subject. It is part of the returning value of the function(ID) for the purpose of identifying the subject.
idtype numeric(1), 1,2,...,7; specifies the type of the slide. Details as below,
slide 13
1. Time restricted display that does not allow the subject to enter any answer(that is, for display information only) and that information is displayed fora limited amount of time controlled by time.
2. Time unrestricted display that does not allow the subject to enter any answer(like type=1) but the information is display until the subject click on thegreen button located in the bottom of the slide to proceed to the next slide.
3. Numerical response display that allows the subject to give a numerical an-swer by clicking on the virtual keyboard. The location of the virtual key-board is controlled by box.level.
4. Multipe choice response display that allows that subject to choose one ormore selections from the given ones. Choices are controlled by choiceswhile the number of selection is controlled by n.select. Also see layout.
5. Sequential Likert-scale response display that allows the subject to chooseone of the Likert items. It is sequential in the sense that cond may containmultiple items where the similar questions are repeated asked but with dif-ferent conditions (cond).For example: "The price is 10", "The price is 20", "The price is 30" areasked. Here cond=seq(10,30,10). The Likert items are controlled byscale.
6. "Number line marking" response display allows the subject to give a per-ceptual numerical response (or multiple response) by clicking on the num-berline (Kanayet & Opfer 2009, Siegler & Opfer 2003). The subject canonly see a mark (or marks if multiple) on the number line, not the numberit represents. range controls the length and the tick marks of the numberline and grid controls the number ofminor lines drawn between any two tick marks.
7. Gabor-Granger method (Gabor & Granger 1966, 1979) display that askssequential questions in regarding to the acceptance of prices in an ascendingor descending order. The order is controlled by order. initial controlsthe first value to be asked and subsequent valuewill increase or decrease by increment. Subjects can choose either "Yes"or "No" and the procedure ceases when "No" is answered.
title character(1); the title to be displayed on the top of the slide. Should be madeas short as possible since it will appear in one of the returning values Ques-tion.number. In fact, it is recommended to use titles like "Question 1" and"Demopgrahics 1" etc.
content character(); texts to be displayed in the slide. It can be a vector c( ) containingmultiple items. Each item must be quoted. Note: for type=5 or 7 the firstcomponent becomes the question that cond is attached to. cond is placedafter content.
h numeric(), [0,100];the horizontal location of content hence its length must bethe same as that of content. Must be in the interval [0,100].
v numeric(), [0,100];the vertical location of content hence its length must be thesame as that of content. Must be in the interval [0,100].
14 slide
size numeric(); the font size of content hence its length must be the same as that ofcontent.
col character(); the colour of content hence its length must be the same as that ofcontent.
time (only applies to type=1); numeric(1) the amount of time (in seconds) that theslide is displayed.
interval (only applies to type=3); numeric(2) the permitted interval the numerical re-sponse can fall within.
isinteger (only applies to type=3); logical(1) TRUE if the numerical response is onlyallowed to be an integer.
choices (only applies to type=4); character() or numeric() the choices the subject canchoose from.
layout (only applies to type=4); numeric(2) the layout (number of rows and columnsrespectively) of the choices.
n.select (only applies to type=4,6); numeric(1) the number of choices can be selectedif type=4 or the number of selection can be made if type=6.
box.level (only applies to type=3,4,5,6,7); numeric(2), [0,100] if type=3 defines thevertical location of the top of the first box of the choices.numeric(1), [0,100] if type=4,5,6,7 defines the horizontal and vertical loca-tion of the virtual keyboard. Must be between 0 & 100.
cond (only applies to type=5); character() or numeric() a vector of conditions askedin the sequential Likert-scale question. Example: if content=c("The priceis","Please choose one of the following")and cond=seq(5,15,5) then three slides will display each of the followings:"The price is 5", "The price is 10" and "The price is 15" plus "Please choose oneof the following" in each of these slides. Note: the first component of contentbecomes the question that cond isattached to. cond is placed after content.
scale (only applies to type=5); character() or numeric() a set of Likert items thesubject can choose from.
grid (only applies to type=6); numeric(1) the number of minor grids lines to bedrawn in between any two tick marks in range.
range (only applies to type=6); numeric(3) a set of numbers to be displayed as tickson the number line. The maximum and the minimum become the two ends ofthe number line.
unit (only applies to type=6); character(1) or numeric(1) to be displayed as the unit(such as "$", "%", etc.) of the figures on the number line. This is placed rightunderneath the number line.
initial (only applies to type=7); numeric(1) the starting value serves as the conditionattached to the first sequential question in Gabor-Granger method. Subsequentconditions will decrease (if order="descending") or increase (if order="ascending")with the increment of increment.
increment (only applies to type=7); numeric(1) the amount that the condition increases ordecreases by (see initial above).
slide 15
order (only applies to type=7); "ascending" or "descending" It defines increasingor decreasing conditions attached to the sequential question.
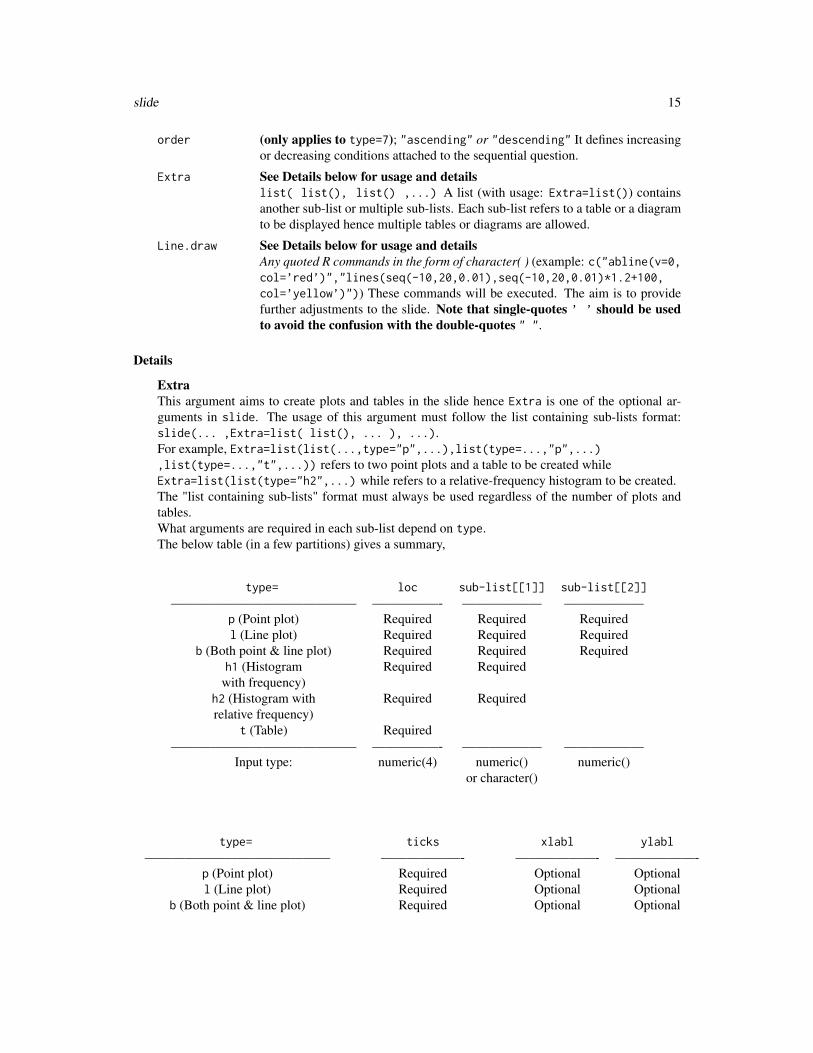
Extra See Details below for usage and detailslist( list(), list() ,...) A list (with usage: Extra=list()) containsanother sub-list or multiple sub-lists. Each sub-list refers to a table or a diagramto be displayed hence multiple tables or diagrams are allowed.
Line.draw See Details below for usage and detailsAny quoted R commands in the form of character( ) (example: c("abline(v=0,col=’red’)","lines(seq(-10,20,0.01),seq(-10,20,0.01)*1.2+100,col=’yellow’)")) These commands will be executed. The aim is to providefurther adjustments to the slide. Note that single-quotes ’ ’ should be usedto avoid the confusion with the double-quotes " ".
Details
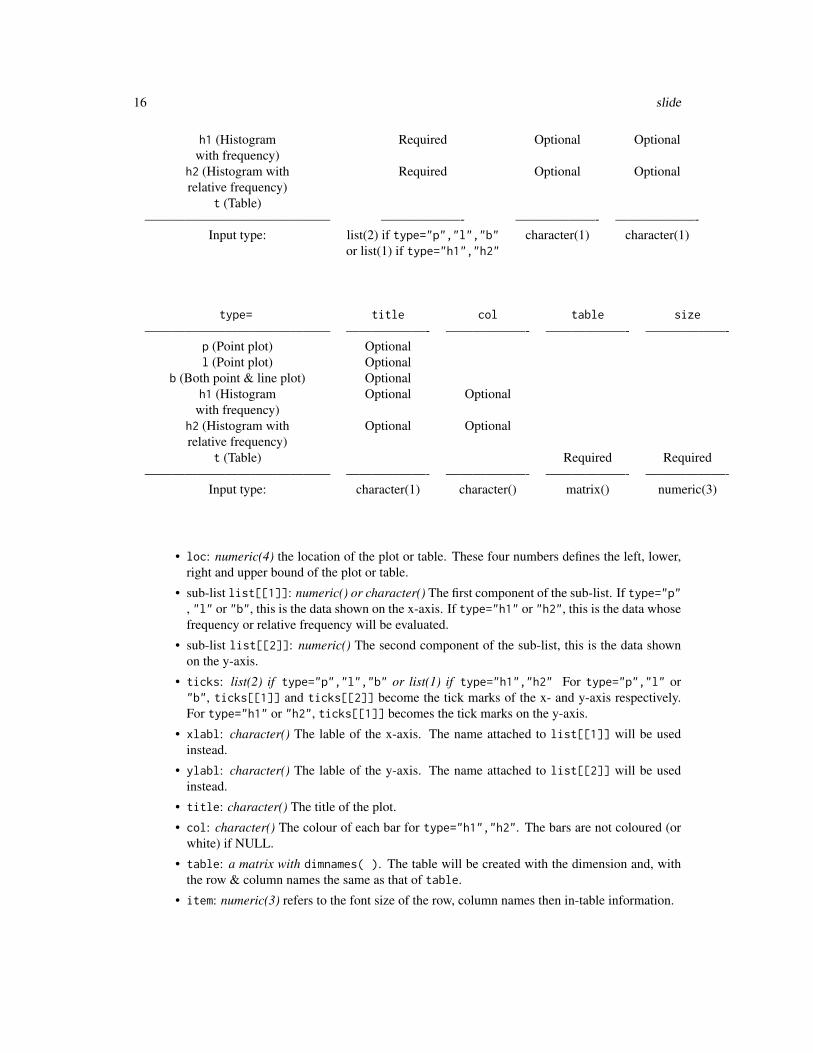
ExtraThis argument aims to create plots and tables in the slide hence Extra is one of the optional ar-guments in slide. The usage of this argument must follow the list containing sub-lists format:slide(... ,Extra=list( list(), ... ), ...).For example, Extra=list(list(...,type="p",...),list(type=...,"p",...),list(type=...,"t",...)) refers to two point plots and a table to be created whileExtra=list(list(type="h2",...) while refers to a relative-frequency histogram to be created.The "list containing sub-lists" format must always be used regardless of the number of plots andtables.What arguments are required in each sub-list depend on type.The below table (in a few partitions) gives a summary,
type= loc sub-list[[1]] sub-list[[2]]—————————————— —————- —————— ——————
p (Point plot) Required Required Requiredl (Line plot) Required Required Required
b (Both point & line plot) Required Required Requiredh1 (Histogram Required Required
with frequency)h2 (Histogram with Required Requiredrelative frequency)
t (Table) Required—————————————— —————- —————— ——————
Input type: numeric(4) numeric() numeric()or character()
type= ticks xlabl ylabl—————————————— ——————- ——————- ——————-
p (Point plot) Required Optional Optionall (Line plot) Required Optional Optional
b (Both point & line plot) Required Optional Optional
16 slide
h1 (Histogram Required Optional Optionalwith frequency)
h2 (Histogram with Required Optional Optionalrelative frequency)
t (Table)—————————————— ——————- ——————- ——————-
Input type: list(2) if type="p","l","b" character(1) character(1)or list(1) if type="h1","h2"
type= title col table size—————————————— ——————- ——————- ——————- ——————-
p (Point plot) Optionall (Point plot) Optional
b (Both point & line plot) Optionalh1 (Histogram Optional Optional
with frequency)h2 (Histogram with Optional Optionalrelative frequency)
t (Table) Required Required—————————————— ——————- ——————- ——————- ——————-
Input type: character(1) character() matrix() numeric(3)
• loc: numeric(4) the location of the plot or table. These four numbers defines the left, lower,right and upper bound of the plot or table.
• sub-list list[[1]]: numeric() or character() The first component of the sub-list. If type="p", "l" or "b", this is the data shown on the x-axis. If type="h1" or "h2", this is the data whosefrequency or relative frequency will be evaluated.
• sub-list list[[2]]: numeric() The second component of the sub-list, this is the data shownon the y-axis.
• ticks: list(2) if type="p","l","b" or list(1) if type="h1","h2" For type="p","l" or"b", ticks[[1]] and ticks[[2]] become the tick marks of the x- and y-axis respectively.For type="h1" or "h2", ticks[[1]] becomes the tick marks on the y-axis.
• xlabl: character() The lable of the x-axis. The name attached to list[[1]] will be usedinstead.
• ylabl: character() The lable of the y-axis. The name attached to list[[2]] will be usedinstead.
• title: character() The title of the plot.
• col: character() The colour of each bar for type="h1","h2". The bars are not coloured (orwhite) if NULL.
• table: a matrix with dimnames( ). The table will be created with the dimension and, withthe row & column names the same as that of table.
• item: numeric(3) refers to the font size of the row, column names then in-table information.
slide 17
Line.drawA single or a set of double quoted R commands. Any texts in between the quotes will be executed.A vector c( ) is used for multiple commands.Since the double quotes are reserved in this case, single quotes should be used in the commandsinstead. For example, Line.draw="abline(v=0,col=\bold{’}red\bold{’})"instead of Line.draw="abline(v=0,col=\bold{"}red\bold{"})".
Value
A 5-column matrix is returned in the R console. The column names are ID, Question.number,type, Condition.Likert and Response.
• ID shows id.
• Question.number is title but without spaces.
• type is type, the slide type (a integer between 1 and 7).
• Condition.Likert is the cond in the sequential Likert-scale question, shown as NA if type isnot 7.
• Response is the response given by the subject. Therefore, the number of rows may varydepending on number of the response. The returning values of each slide type is describedbelow,
1. No values returned.
2. No values returned.
3. The numerical response given by the subject by clicking the virtual keyboard upon therestrictions of interval and isinteger.
4. A number representing the choice selected (i.e. "1" refers to the first choice being se-lected, "2" to the second, ...). The number of rows then depends on how many choicesthe subject is allowed to select as controlled by n.select.
5. The exact choice (one of the items in scale) the subject selects. That is, if scale is ofcharacter() so is the response. The number of rows depends on the number of conditionsbeing asked (i.e. length of cond). Also see Condition.Likert above for another returningvalue.
6. A number that the mark (or marks if multiple selections allowed) represents on the num-ber line. The number of rows then depends on how many selections (i.e. marks) thesubject is allowed to make as controlled by n.select.
7. The number (the price in the Gabor & Granger 1966 1979) asked in the sequential ques-tion in which the subject answers "No".
18 slide
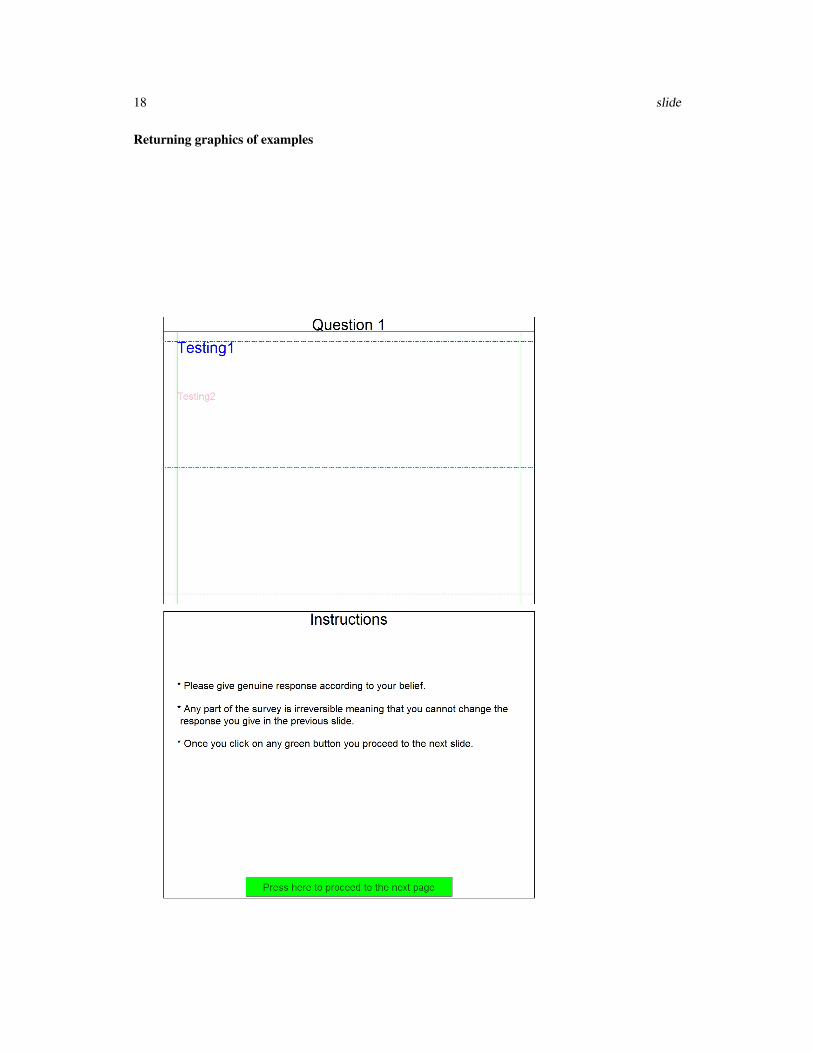
Returning graphics of examples
slide 19
20 slide
slide 21
Author(s)
Char Leung
References
Gabor, G & Granger, CWJ (1966) "Price as an indicator of Quality: Report on an Enquiry", Eco-nomica, 33(129), pp.43-70.Gabor, G & Granger, CWJ (1979) "The Attitude of the Consumer to Prices", Management Deci-sion, 17(8), pp.619-634.Kanayet, F & Opfer, J (2009) "Why Children’s Number-line Estimates Follow Fechner’s Law",Cognitive Science Conference Proceedings 2009, pp.1936-41.Siegler, RS & Opfer, JE (2003) "The Development of Numerical Estimation: Evidence for MultipleRepresentations of Numerical Quantity", Psychological Science, 14(3), May 2003, pp.237-243.
See Also
cover,identity,read.write
Examples
## Not run: slide(id=1234,type=1,title="Question 1",content=c("Testing1","Testing2"),h=c(0,0),v=c(100,80),size=c(3,2),col=c("blue","pink"),time=4,Line.draw=c("abline(h=seq(0,100,50),col='red',lty=4)","abline(v=seq(0,100,100),col='green')"))## End(Not run)## Not run: slide(id=1234,type=2,title="Instructions",content=c("* Please givegenuine response according to your belief.","* Any part of the survey isirreversible meaning that you cannot change the\n response you give in the previous
22 slide
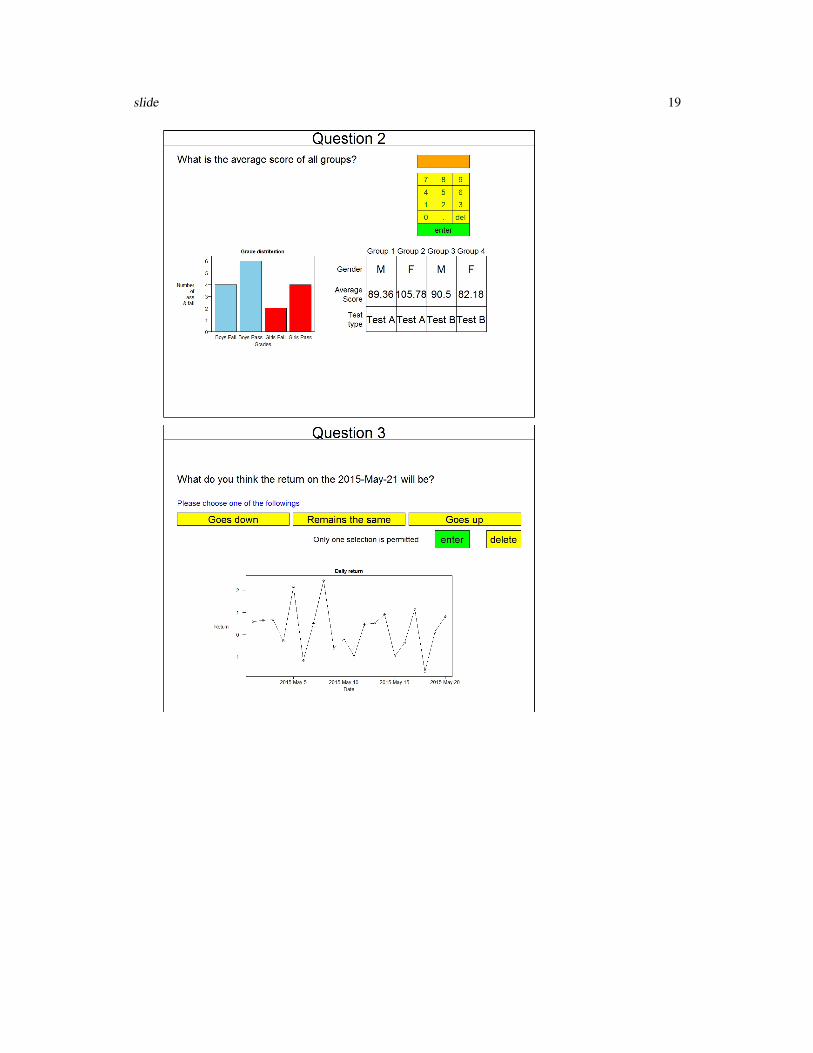
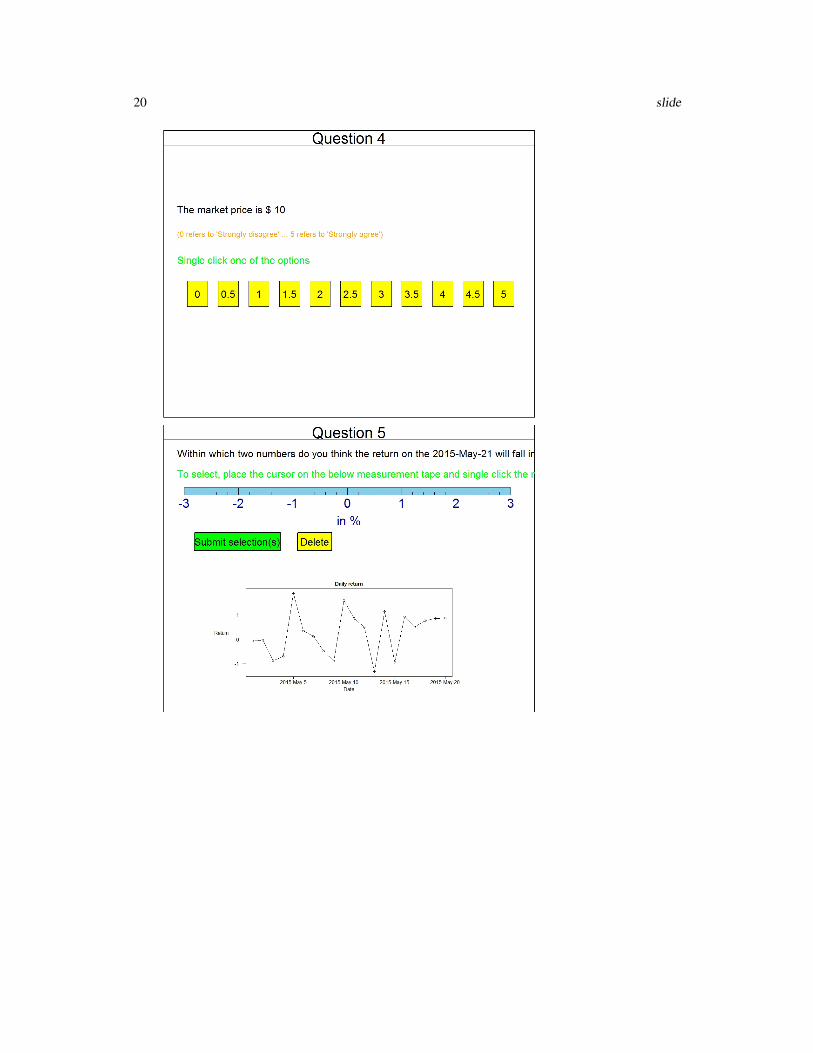
slide.","* Once you click on any green button you proceed to the next slide."),h=c(0,0,0),v=c(80,70,55),size=c(2,2,2),col=c("black","black","black"))## End(Not run)## Not run: slide(id=1234,type=3,title="Question 2",content="What is the averagescore of all groups?",h=0,v=100,size=2,col="black",box.level=c(70,100),Extra=list(list(date=c(rep("Boys-Pass",6),rep("Girls-Pass",4),rep("Boys-Fail",4),rep("Girls-Fail",2)),type="h1",loc=c(10,30,40,60),ticks=list(seq(0,6,1)),xlabl="Grades",ylabl="Number\nof\nass\n& fail",title="Grade distribution",col=c(rep("skyblue",2),rep("red",2))),list(Table=matrix(c(rep(c("M","F"),2),round(rnorm(4,100,10),2),rep("Test A",2),rep("Test B",2)),ncol=4,byrow=T,dimnames=list(c("Gender","Average\nScore","Test\ntype"),paste("Group",1:4))),size=c(1.5,1.5,2),type="t",loc=c(55,30,90,60))))## End(Not run)## Not run: slide(id=123,type=4,title="Question 3",content=c("What do you thinkthe return on the 2015-May-21 will be?","Please choose one of the followings"),h=c(0,0),v=c(90,80),size=c(2,1.5),col=c("black","blue"),choices=c("Goes down","Remains the same","Goes up"),layout=c(1,3),box.level=75,n.select=1,Extra=list(list(Date=paste("2015-May-",1:20,sep=""),return=rnorm(20),type="b",loc=c(20,10,80,50),ticks=list(c(seq(0,20,5)),c(seq(-2,3,1))),ylabl="Return",title="Daily return")))## End(Not run)## Not run: slide(id=123,type=5,title="Question 4",content=c("The market price is$","(0 refers to 'Strongly disagree' ... 5 refers to 'Strongly agree')"),h=c(0,0),v=c(80,70),size=c(2,1.5),col=c("black","orange"),cond=seq(10,12,0.5),scale=seq(0,5,0.5),box.level=50)## End(Not run)## Not run: slide(id=123,type=6,title="Question 5",content="Within which two numbersdo you think the return on the 2015-May-21 will fall into?",h=0,v=100,size=2,
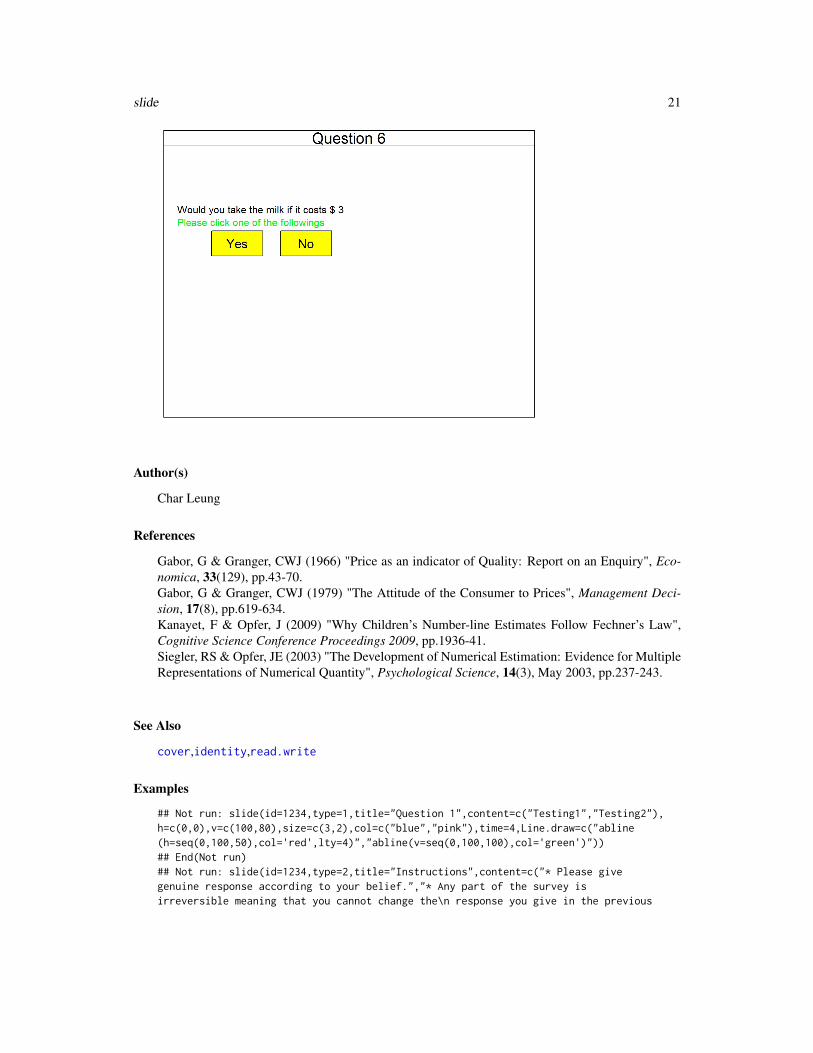
col="black",range=seq(-3,3,1),grid=5,unit="%",box.level=85,n.select=2,Extra=list(list(Date=paste("2015-May-",1:20,sep=""),return=rnorm(20),type="b",loc=c(20,10,80,45),ticks=list(c(seq(0,20,5)),c(seq(-2,3,1))),ylabl="Return",title="Daily return")))## End(Not run)## Not run: slide(id=123,type=7,title="Question 6",content="Would you take the milkif it costs $",h=0,v=80,size=2,col="black",initial=3,increment=1,order="descending",box.level=70)## End(Not run)
Index
cover, 4, 21
identity, 6, 6, 21
read.write, 6, 8, 21
slide, 6, 8, 9, 10surveyeditor (surveyeditor-package), 2surveyeditor-package, 2
23