Embed Size (px)
Citation preview
PI-TB-US-V4
PACKAGE INSERT
For In Vitro Diagnostic Use Only
This package insert covers use of: T-SPOT.TB 8 (Multi-use 8-Well Strip Plate Format. Catalogue number: TB.300)
T-SPOT.TB 50 (1200 test Multi-use version. Catalogue number: TB.50)
Caution: Federal (USA) law restricts this device to sale by or
on the order of a licensed health care professional
T-SPOT.TB Package Insert PI-TB-US-V4 Page 2 of 36
INDEX
1. INTENDED USE ............................................................................................................ 3
2. SUMMARY & EXPLANATION ...................................................................................... 3 Principle of Test ................................................................................................... 4
3. REAGENTS & STORAGE ............................................................................................ 5 Materials Provided ............................................................................................... 5 Storage & Stability ............................................................................................... 5 Equipment and Materials Required but Not Provided ....................................... 6
4. WARNINGS & PRECAUTIONS .................................................................................... 6
5. SPECIMEN COLLECTION & HANDLING .................................................................... 7
6. INSTRUCTIONS FOR USE ........................................................................................... 8 Reagent Preparation ............................................................................................ 9 Cell Counting and Dilution .................................................................................. 9 Plate Set Up and Incubation .............................................................................. 10 Spot Development and Counting ...................................................................... 11 Quality Control ................................................................................................... 12 Results Interpretation and Assay Criteria ........................................................ 12
7. LIMITATIONS ............................................................................................................. 15
8. EXPECTED VALUES .................................................................................................. 16
9. PERFORMANCE CHARACTERISTICS ...................................................................... 17 Assay Performance Characteristics ................................................................. 17 Summary of Clinical Data .................................................................................. 18 Summary of Performance ................................................................................. 26
10. TROUBLESHOOTING .............................................................................................. 34
11. ABBREVIATIONS & GLOSSARY OF SYMBOLS .................................................... 34
12. REFERENCES .......................................................................................................... 35
13. CONTACT INFORMATION ....................................................................................... 36

T-SPOT.TB Package Insert PI-TB-US-V4 Page 3 of 36
1. INTENDED USE
The T-SPOT®.
TB test is an in vitro diagnostic test for the detection of effector T cells that respond to stimulation by
Mycobacterium tuberculosis antigens ESAT-6 and CFP-10 by capturing interferon gamma (IFN-) in the vicinity of T cells in human whole blood collected in sodium citrate or sodium or lithium heparin. It is intended for use as an aid in the diagnosis of M. tuberculosis infection.
The T-SPOT.TB test is an indirect test for M. tuberculosis infection (including disease) and is intended for use in conjunction with risk assessment, radiography and other medical and diagnostic evaluations.
2. SUMMARY & EXPLANATION
It is estimated that 15 million Americans are infected with M. tuberculosis1. Each person carrying latent TB infection
(LTBI) has approximately a 10% chance of progression to active TB disease1. This risk is elevated among certain
groups, including those who have been recently infected and those who have clinical conditions that are associated with an increased risk for progression of LTBI to active TB.
Historically, TB infection screening was performed with the Tuberculin Skin Test (TST). The recommended
technique for administering the TST in the US is the Mantoux method2. The Mantoux skin test involves the
intracutaneous injection of tuberculin (also called Purified Protein Derivative – or PPD) into the volar surface of the forearm. TST results are read 48-72 hours after administration; this interval being required for the development of a Delayed-Type Hypersensitivity (DTH) reaction. The extent of induration at the site of injection is measured and recorded in mm. Three different cutoffs for the TST are used to increase its specificity; based on the characteristics of the patient being tested.
In addition to the TST, there are ELISA-based assays for detecting IFN-gamma secretion from lymphocytes stimulated with TB-specific antigens
3. This method uses a principle similar to that of the T-SPOT.TB test, by
measuring the amount of IFN-gamma in blood using the ELISA technique.
The T-SPOT.TB test is an in vitro diagnostic test based on an enzyme-linked immunospot (ELISPOT) method. The test enumerates effector T cells responding to stimulation with a combination of peptides simulating ESAT-6 and CFP10 antigens. ESAT-6 and CFP10 are absent from all BCG strains and from most non-tuberculous mycobacteria with the exception of M. kansasii, M. szulgai and M. marinum
4-6. In contrast, individuals infected with M. tuberculosis
complex organisms (M. tuberculosis, M. bovis, M. africanum, M. microti, M. canetti) usually have T cells in their blood which recognize these and other mycobacterial antigens.
The T-SPOT.TB test can be used in screening of risk groups for TB infection. In addition, the T-SPOT.TB test can be used as a diagnostic aid when evaluating patients suspected of having active TB disease.
The T-SPOT.TB test has been tested in some patient groups indicated for screening for TB infection according to current ATS/CDC Guidance
2: such as, human immunodeficiency virus (HIV) positive persons, recent contacts of TB
case patients, residents and employees of high-risk congregate settings, chronic renal failure, children younger than 4 yr of age or infants, children, and adolescents exposed to adults at high-risk and immunosuppressed patients
Refer to the most recent CDC guidance (http://www.cdc.gov/nchstp/tb) for detailed recommendations about diagnosing TB infection (including disease) and selecting persons for testing.
T-SPOT.TB Package Insert PI-TB-US-V4 Page 4 of 36
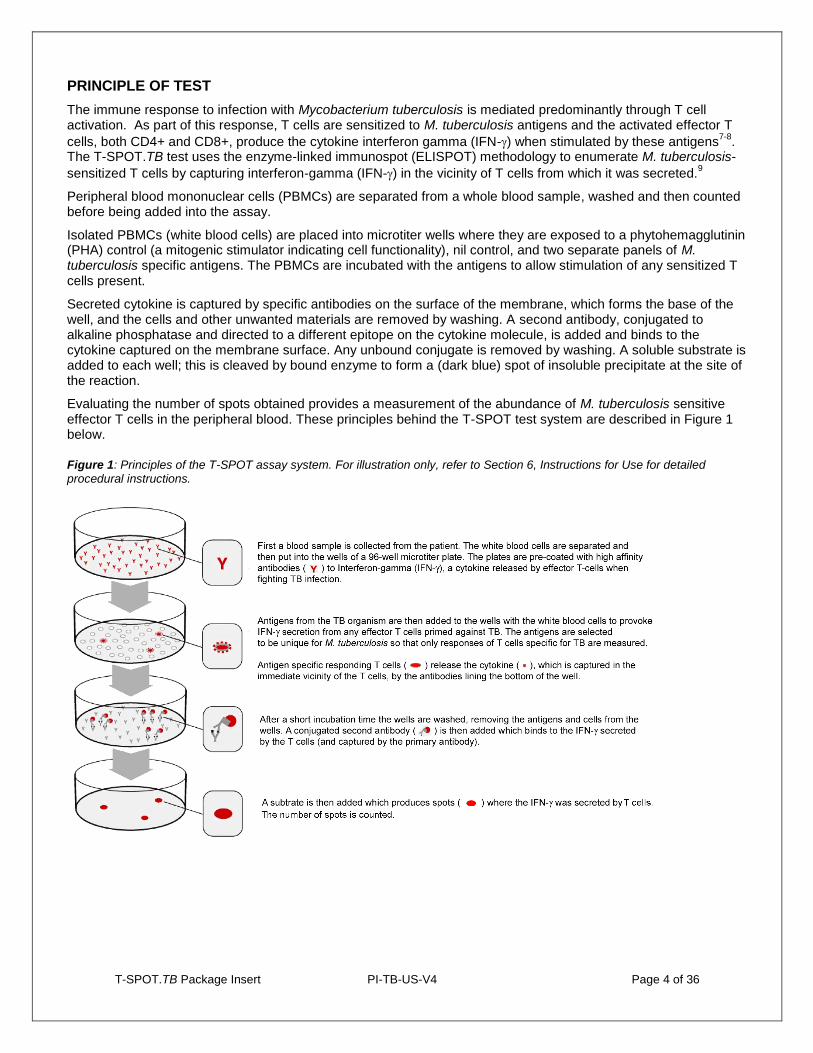
PRINCIPLE OF TEST
The immune response to infection with Mycobacterium tuberculosis is mediated predominantly through T cell activation. As part of this response, T cells are sensitized to M. tuberculosis antigens and the activated effector T
cells, both CD4+ and CD8+, produce the cytokine interferon gamma (IFN-) when stimulated by these antigens7-8
. The T-SPOT.TB test uses the enzyme-linked immunospot (ELISPOT) methodology to enumerate M. tuberculosis-
sensitized T cells by capturing interferon-gamma (IFN-) in the vicinity of T cells from which it was secreted.9
Peripheral blood mononuclear cells (PBMCs) are separated from a whole blood sample, washed and then counted before being added into the assay.
Isolated PBMCs (white blood cells) are placed into microtiter wells where they are exposed to a phytohemagglutinin (PHA) control (a mitogenic stimulator indicating cell functionality), nil control, and two separate panels of M. tuberculosis specific antigens. The PBMCs are incubated with the antigens to allow stimulation of any sensitized T cells present.
Secreted cytokine is captured by specific antibodies on the surface of the membrane, which forms the base of the well, and the cells and other unwanted materials are removed by washing. A second antibody, conjugated to alkaline phosphatase and directed to a different epitope on the cytokine molecule, is added and binds to the cytokine captured on the membrane surface. Any unbound conjugate is removed by washing. A soluble substrate is added to each well; this is cleaved by bound enzyme to form a (dark blue) spot of insoluble precipitate at the site of the reaction.
Evaluating the number of spots obtained provides a measurement of the abundance of M. tuberculosis sensitive effector T cells in the peripheral blood. These principles behind the T-SPOT test system are described in Figure 1 below.
Figure 1: Principles of the T-SPOT assay system. For illustration only, refer to Section 6, Instructions for Use for detailed procedural instructions.
T-SPOT.TB Package Insert PI-TB-US-V4 Page 5 of 36
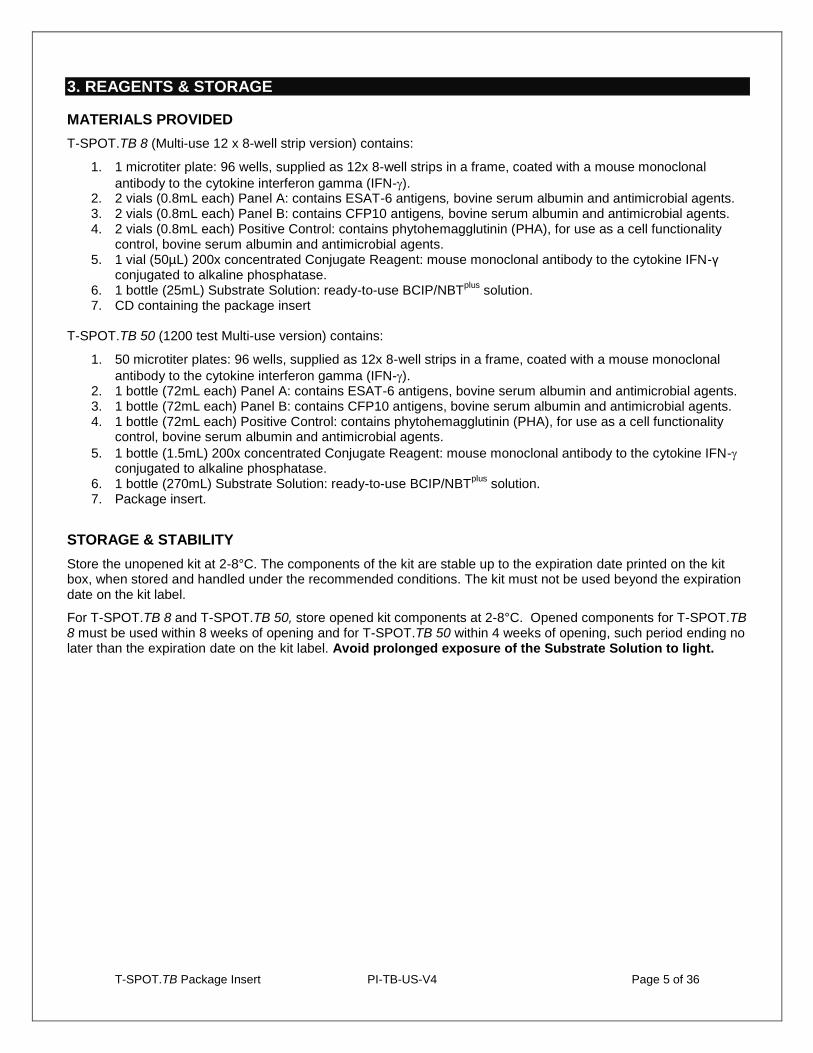
3. REAGENTS & STORAGE
MATERIALS PROVIDED
T-SPOT.TB 8 (Multi-use 12 x 8-well strip version) contains:
1. 1 microtiter plate: 96 wells, supplied as 12x 8-well strips in a frame, coated with a mouse monoclonal
antibody to the cytokine interferon gamma (IFN-). 2. 2 vials (0.8mL each) Panel A: contains ESAT-6 antigens, bovine serum albumin and antimicrobial agents. 3. 2 vials (0.8mL each) Panel B: contains CFP10 antigens, bovine serum albumin and antimicrobial agents. 4. 2 vials (0.8mL each) Positive Control: contains phytohemagglutinin (PHA), for use as a cell functionality
control, bovine serum albumin and antimicrobial agents. 5. 1 vial (50µL) 200x concentrated Conjugate Reagent: mouse monoclonal antibody to the cytokine IFN-γ
conjugated to alkaline phosphatase. 6. 1 bottle (25mL) Substrate Solution: ready-to-use BCIP/NBT
plus solution.
7. CD containing the package insert
T-SPOT.TB 50 (1200 test Multi-use version) contains:
1. 50 microtiter plates: 96 wells, supplied as 12x 8-well strips in a frame, coated with a mouse monoclonal
antibody to the cytokine interferon gamma (IFN-). 2. 1 bottle (72mL each) Panel A: contains ESAT-6 antigens, bovine serum albumin and antimicrobial agents. 3. 1 bottle (72mL each) Panel B: contains CFP10 antigens, bovine serum albumin and antimicrobial agents. 4. 1 bottle (72mL each) Positive Control: contains phytohemagglutinin (PHA), for use as a cell functionality
control, bovine serum albumin and antimicrobial agents.
5. 1 bottle (1.5mL) 200x concentrated Conjugate Reagent: mouse monoclonal antibody to the cytokine IFN- conjugated to alkaline phosphatase.
6. 1 bottle (270mL) Substrate Solution: ready-to-use BCIP/NBTplus
solution. 7. Package insert.
STORAGE & STABILITY
Store the unopened kit at 2-8°C. The components of the kit are stable up to the expiration date printed on the kit box, when stored and handled under the recommended conditions. The kit must not be used beyond the expiration date on the kit label.
For T-SPOT.TB 8 and T-SPOT.TB 50, store opened kit components at 2-8°C. Opened components for T-SPOT.TB 8 must be used within 8 weeks of opening and for T-SPOT.TB 50 within 4 weeks of opening, such period ending no later than the expiration date on the kit label. Avoid prolonged exposure of the Substrate Solution to light.

T-SPOT.TB Package Insert PI-TB-US-V4 Page 6 of 36
EQUIPMENT AND MATERIALS REQUIRED BUT NOT PROVIDED
1. 8-well strip plate frame (available from Oxford Immunotec). 2. BLII cabinet (recommended). 3. Blood collection tubes, such as Vacutainer
® CPT™ or heparinized tubes (Note: CPT tubes are available
from Oxford Immunotec). 4. T-Cell Xtend
® reagent - Whole blood samples stored at room temperature (18 - 25ºC) between 0 and 32
hours post venipuncture, can be processed with the use of T-Cell Xtend reagent. 5. Ficoll (if not using CPT tubes). 6. A centrifuge for preparation of PBMCs (capable of at least 1800 RCF (g) and able to maintain the samples
at room temperature (18-25°C)) if using density centrifugation methods to separate the PBMCs. 7. Equipment and reagents to enable counting of PBMCs; either manually using Trypan Blue (or other
appropriate stain) and a hemocytometer on a microscope or automatically using a suitable hematology analyzer.
8. A humidified incubator capable of 37 ± 1°C with a 5% CO2 supply. 9. An automatic microtiter plate washer or an 8 channel or stepper pipette to manually wash plates. 10. Adjustable pipettes to cover a range of volumes from 1-1000µl (such as four Gilson pipettes capable of
delivering volumes of 1-10µL, 2-20µL, 20-200µL and 100-1000µL) and sterile pipette tips. 11. Sterile PBS solution: such as GIBCOTM 1x D-PBS (Invitrogen; catalogue number 14040-133). 12. Distilled or deionized water. 13. A means of visualizing the wells, or capturing a digital image of the well, such as a stereomicroscope,
magnifying glass or plate imager to allow counting of spots. 14. Sterile cell culture medium such as GIBCO
AIM-VTM
(Invitrogen; catalogue number 31035-025 research grade). (Note: AIM-V media is available from Oxford Immunotec). The use of this serum free medium for the incubation step is strongly recommended. RPMI 1640 (Invitrogen; catalogue number 11875-093) may be used in the initial sample preparation steps only. It is recommended that cell culture media are stored in appropriate aliquots and excess material is discarded after use. Cell culture media should be pre-warmed to 37°C before use with the T-SPOT.TB test. To avoid problems with contaminated media, it can be helpful to dispense bottles of AIM-V or RPMI 1640 into smaller aliquots.
4. WARNINGS & PRECAUTIONS
For in vitro diagnostic use only
Operators should be trained in the assay procedure and be sure they understand the instructions for use before performing the assay.
Read the assay instructions carefully before use. Deviations from the instructions for use in this package insert may yield erroneous results.
Care should be taken when handling material of human origin. All blood samples should be considered potentially infectious. Handling of blood samples and assay components, their use, storage and disposal should be in accordance with procedures defined in appropriate national, state or local biohazard and safety guidelines or regulations.
Care should be taken when working with chemicals. All chemicals should be considered potentially hazardous. A material safety data sheet for the kit is available from Oxford Immunotec.
Discard unused reagents and biological samples in accordance with Local, State and Federal regulations.
The correct number of cells must be added to each well. Failure to do so may lead to an incorrect interpretation of the result.
Do not mix components from different kit lots.
Observe aseptic technique to avoid contaminating the reagents, assay wells, cell suspensions and cell culture media.
Variation to the stated pipetting and washing techniques, incubation times and/or temperatures may influence the actual results obtained and should be avoided
Blood should be collected and processed as soon as possible.
Store and transport blood samples to the laboratory at room temperature (18-25°C). Do not refrigerate or freeze whole blood samples.
Failure to adhere to the recommended incubation times and temperatures may lead to an incorrect interpretation of the results.
Indentations in the membrane caused by pipette or well washer tips may develop as artifacts in the wells which could confuse spot counting.
T-SPOT.TB Package Insert PI-TB-US-V4 Page 7 of 36
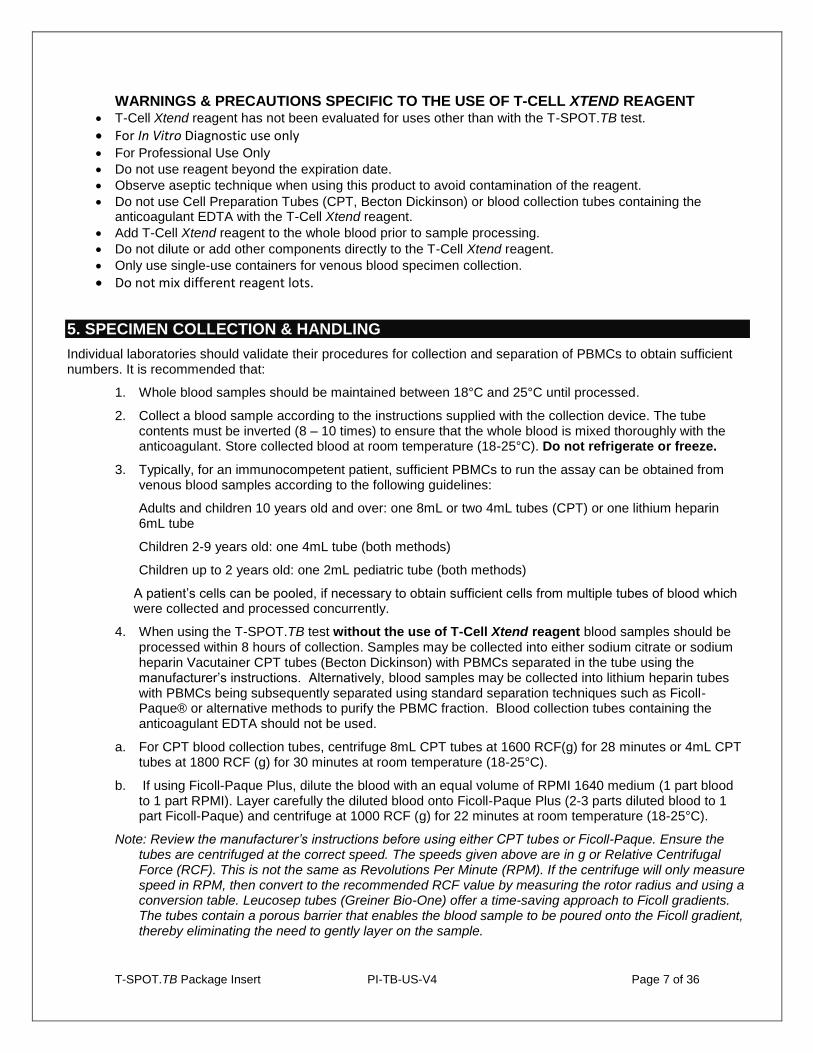
WARNINGS & PRECAUTIONS SPECIFIC TO THE USE OF T-CELL XTEND REAGENT T-Cell Xtend reagent has not been evaluated for uses other than with the T-SPOT.TB test.
For In Vitro Diagnostic use only For Professional Use Only
Do not use reagent beyond the expiration date.
Observe aseptic technique when using this product to avoid contamination of the reagent.
Do not use Cell Preparation Tubes (CPT, Becton Dickinson) or blood collection tubes containing the anticoagulant EDTA with the T-Cell Xtend reagent.
Add T-Cell Xtend reagent to the whole blood prior to sample processing.
Do not dilute or add other components directly to the T-Cell Xtend reagent.
Only use single-use containers for venous blood specimen collection.
Do not mix different reagent lots.
5. SPECIMEN COLLECTION & HANDLING
Individual laboratories should validate their procedures for collection and separation of PBMCs to obtain sufficient numbers. It is recommended that:
1. Whole blood samples should be maintained between 18°C and 25°C until processed.
2. Collect a blood sample according to the instructions supplied with the collection device. The tube contents must be inverted (8 – 10 times) to ensure that the whole blood is mixed thoroughly with the anticoagulant. Store collected blood at room temperature (18-25°C). Do not refrigerate or freeze.
3. Typically, for an immunocompetent patient, sufficient PBMCs to run the assay can be obtained from venous blood samples according to the following guidelines:
Adults and children 10 years old and over: one 8mL or two 4mL tubes (CPT) or one lithium heparin 6mL tube
Children 2-9 years old: one 4mL tube (both methods)
Children up to 2 years old: one 2mL pediatric tube (both methods)
A patient’s cells can be pooled, if necessary to obtain sufficient cells from multiple tubes of blood which were collected and processed concurrently.
4. When using the T-SPOT.TB test without the use of T-Cell Xtend reagent blood samples should be processed within 8 hours of collection. Samples may be collected into either sodium citrate or sodium heparin Vacutainer CPT tubes (Becton Dickinson) with PBMCs separated in the tube using the manufacturer’s instructions. Alternatively, blood samples may be collected into lithium heparin tubes with PBMCs being subsequently separated using standard separation techniques such as Ficoll-Paque® or alternative methods to purify the PBMC fraction. Blood collection tubes containing the anticoagulant EDTA should not be used.
a. For CPT blood collection tubes, centrifuge 8mL CPT tubes at 1600 RCF(g) for 28 minutes or 4mL CPT tubes at 1800 RCF (g) for 30 minutes at room temperature (18-25°C).
b. If using Ficoll-Paque Plus, dilute the blood with an equal volume of RPMI 1640 medium (1 part blood to 1 part RPMI). Layer carefully the diluted blood onto Ficoll-Paque Plus (2-3 parts diluted blood to 1 part Ficoll-Paque) and centrifuge at 1000 RCF (g) for 22 minutes at room temperature (18-25°C).
Note: Review the manufacturer’s instructions before using either CPT tubes or Ficoll-Paque. Ensure the tubes are centrifuged at the correct speed. The speeds given above are in g or Relative Centrifugal Force (RCF). This is not the same as Revolutions Per Minute (RPM). If the centrifuge will only measure speed in RPM, then convert to the recommended RCF value by measuring the rotor radius and using a conversion table. Leucosep tubes (Greiner Bio-One) offer a time-saving approach to Ficoll gradients. The tubes contain a porous barrier that enables the blood sample to be poured onto the Ficoll gradient, thereby eliminating the need to gently layer on the sample.
T-SPOT.TB Package Insert PI-TB-US-V4 Page 8 of 36
5. When using the T-SPOT.TB test with T-Cell Xtend reagent blood samples should be collected into lithium heparin tubes. Vacutainer CPT tubes and blood collection tubes containing the anticoagulant EDTA should not be used. The T-Cell Xtend reagent should be added prior to PBMC separation using standard separation techniques. Whole blood samples should be stored at room temperature (18-25ºC) between 0 and 32 hours post venipuncture with the use of T-Cell Xtend reagent.
If the T-Cell Xtend reagent is to be used, immediately before cell separation remove the cap from the
blood collection tube and add 25L of the T-Cell Xtend reagent solution per mL of blood sample.
Replace the cap and invert blood collection tube gently 8 to 10 times to mix. Incubate for 20 ± 5
minutes at room temperature (18-25°C) and then proceed to isolate the PBMC layer using Ficoll density gradient centrifugation as presented in sections 4b, and 6 - 9. See the T-Cell Xtend reagent package insert for further details.
6. Collect the white, cloudy band of PBMCs using a pipette and transfer to a 15mL conical centrifuge tube. Bring the volume to 10mL with cell culture medium. Cell culture media for the washing steps should be pre-warmed to 37°C before contact with PBMCs.
Circulating factors in whole blood samples are known to interfere with whole blood interferon gamma tests, e.g., rheumatoid factor, heterophilic antibodies, and pre-existing amounts of interferon gamma. The separation and washing of the PBMCs enables removal of these potentially interfering substances prior to performing the assay.
Note: After centrifugation, PBMCs should be extracted using a large bore (e.g. 1mL) pipette tip, by immersing the pipette tip into the PBMC layer. This cloudy layer should be carefully aspirated and transferred to a sterile conical tube for the wash steps. Ensure that all of the cloudy PBMC layer is collected. It is better to take more of the plasma layer than to leave any of the PBMCs in the blood collection tube. However, if using CPTs avoid transferring any of the separation gel, which can block the tip. If this happens transfer the cells already in the tip into a centrifuge tube and then use a new tip to transfer the remaining PBMCs. A variety of media can be used for washing the cells during these steps 3-5; both AIM-V and RPMI 1640 have been used successfully and are recommended.
7. Centrifuge at 600 RCF (g) for 7 minutes. Pour off the supernatant and resuspend the pellet in 1mL medium.
8. Bring the volume to 10mL with fresh medium and centrifuge at 350 RCF (g) for 7 minutes.
9. Pour off the supernatant and resuspend the pellet in 0.7mL cell culture medium. The serum-free medium AIM- V has been used successfully and is strongly recommended
Note: Steps 2-7 should be performed in a BLII cabinet to protect the user and prevent contamination of samples.
6. INSTRUCTIONS FOR USE
A full T-SPOT.TB test plate will process 24 patient samples. The performance of the assay is typically carried out on the afternoon of one day and the morning of the following day, to allow the 16-20hr incubation step to take place overnight. If this timing is used, then on the afternoon of day 1 the blood samples are processed to prepare the PBMCs for the assay and the assay is initiated by adding the PBMCs and antigens to the assay plate and placing the plate into the incubator. On day 2, the plate is removed from the incubator and the development steps are performed and the plate is read. The time to process a full plate is approximately 3 hours of elapsed time (actual hands-on labor time will be less due to the centrifugation steps) on day 1 and 30 minutes of labor time (not including the 1 hour incubation of the secondary antibody and time for plate drying) on day 2. The procedure for conducting the test is summarized in Figure 2 and further described below:
T-SPOT.TB Package Insert PI-TB-US-V4 Page 9 of 36
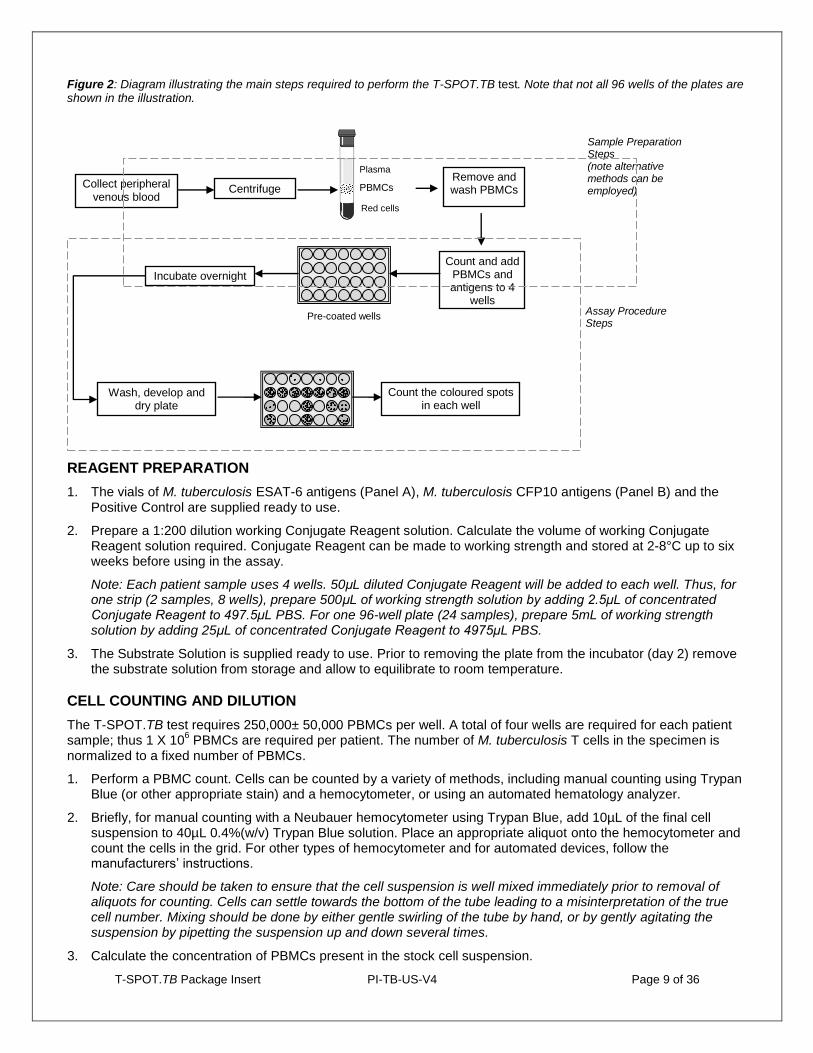
Figure 2: Diagram illustrating the main steps required to perform the T-SPOT.TB test. Note that not all 96 wells of the plates are shown in the illustration.
REAGENT PREPARATION
1. The vials of M. tuberculosis ESAT-6 antigens (Panel A), M. tuberculosis CFP10 antigens (Panel B) and the Positive Control are supplied ready to use.
2. Prepare a 1:200 dilution working Conjugate Reagent solution. Calculate the volume of working Conjugate Reagent solution required. Conjugate Reagent can be made to working strength and stored at 2-8°C up to six weeks before using in the assay.
Note: Each patient sample uses 4 wells. 50μL diluted Conjugate Reagent will be added to each well. Thus, for one strip (2 samples, 8 wells), prepare 500μL of working strength solution by adding 2.5μL of concentrated Conjugate Reagent to 497.5μL PBS. For one 96-well plate (24 samples), prepare 5mL of working strength solution by adding 25μL of concentrated Conjugate Reagent to 4975μL PBS.
3. The Substrate Solution is supplied ready to use. Prior to removing the plate from the incubator (day 2) remove the substrate solution from storage and allow to equilibrate to room temperature.
CELL COUNTING AND DILUTION
The T-SPOT.TB test requires 250,000± 50,000 PBMCs per well. A total of four wells are required for each patient sample; thus 1 X 10
6 PBMCs are required per patient. The number of M. tuberculosis T cells in the specimen is
normalized to a fixed number of PBMCs.
1. Perform a PBMC count. Cells can be counted by a variety of methods, including manual counting using Trypan Blue (or other appropriate stain) and a hemocytometer, or using an automated hematology analyzer.
2. Briefly, for manual counting with a Neubauer hemocytometer using Trypan Blue, add 10µL of the final cell suspension to 40µL 0.4%(w/v) Trypan Blue solution. Place an appropriate aliquot onto the hemocytometer and count the cells in the grid. For other types of hemocytometer and for automated devices, follow the manufacturers’ instructions.
Note: Care should be taken to ensure that the cell suspension is well mixed immediately prior to removal of aliquots for counting. Cells can settle towards the bottom of the tube leading to a misinterpretation of the true cell number. Mixing should be done by either gentle swirling of the tube by hand, or by gently agitating the suspension by pipetting the suspension up and down several times.
3. Calculate the concentration of PBMCs present in the stock cell suspension.
Plasma
PBMCs
Red cells
Collect peripheral venous blood
Centrifuge Remove and wash PBMCs
Count and add PBMCs and antigens to 4
wells
Pre-coated wells
Incubate overnight
Wash, develop and dry plate
Count the coloured spots in each well
Sample Preparation Steps (note alternative methods can be employed)
Assay Procedure Steps
T-SPOT.TB Package Insert PI-TB-US-V4 Page 10 of 36
Note: Ensure the calculation is correct for the cell counting system used as the use of either insufficient or excess cells may lead to an incorrect interpretation of the result.
4. Prepare 500µL of the final cell suspension at a concentration of 2.5x10⁵ cells/100µL (giving 1.25 X10
6 PBMCs
in total).
Note: Ensure cells are thoroughly mixed, by gently agitating the suspension by pipetting the suspension up and down several times, before removing an aliquot for dilution. PBMC numbers between 200,000 and 300,000 per well have been shown to give consistent T-SPOT.TB test results.
PLATE SET UP AND INCUBATION
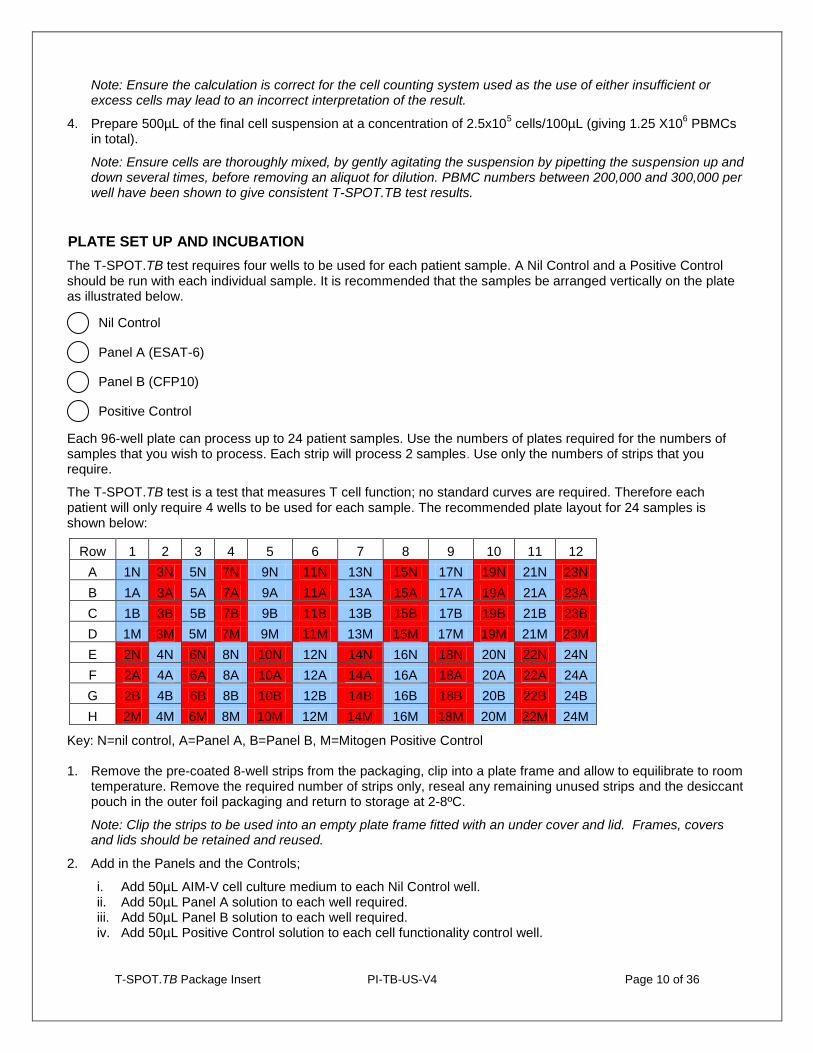
The T-SPOT.TB test requires four wells to be used for each patient sample. A Nil Control and a Positive Control should be run with each individual sample. It is recommended that the samples be arranged vertically on the plate as illustrated below.
Each 96-well plate can process up to 24 patient samples. Use the numbers of plates required for the numbers of samples that you wish to process. Each strip will process 2 samples. Use only the numbers of strips that you require.
The T-SPOT.TB test is a test that measures T cell function; no standard curves are required. Therefore each patient will only require 4 wells to be used for each sample. The recommended plate layout for 24 samples is shown below:
Row 1 2 3 4 5 6 7 8 9 10 11 12
A 1N 3N 5N 7N 9N 11N 13N 15N 17N 19N 21N 23N
B 1A 3A 5A 7A 9A 11A 13A 15A 17A 19A 21A 23A
C 1B 3B 5B 7B 9B 11B 13B 15B 17B 19B 21B 23B
D 1M 3M 5M 7M 9M 11M 13M 15M 17M 19M 21M 23M
E 2N 4N 6N 8N 10N 12N 14N 16N 18N 20N 22N 24N
F 2A 4A 6A 8A 10A 12A 14A 16A 18A 20A 22A 24A
G 2B 4B 6B 8B 10B 12B 14B 16B 18B 20B 22B 24B
H 2M 4M 6M 8M 10M 12M 14M 16M 18M 20M 22M 24M
Key: N=nil control, A=Panel A, B=Panel B, M=Mitogen Positive Control
1. Remove the pre-coated 8-well strips from the packaging, clip into a plate frame and allow to equilibrate to room temperature. Remove the required number of strips only, reseal any remaining unused strips and the desiccant pouch in the outer foil packaging and return to storage at 2-8ºC.
Note: Clip the strips to be used into an empty plate frame fitted with an under cover and lid. Frames, covers and lids should be retained and reused.
2. Add in the Panels and the Controls;
i. Add 50µL AIM-V cell culture medium to each Nil Control well. ii. Add 50µL Panel A solution to each well required. iii. Add 50µL Panel B solution to each well required. iv. Add 50µL Positive Control solution to each cell functionality control well.
Nil Control
Panel A (ESAT-6)
Panel B (CFP10)
Positive Control
T-SPOT.TB Package Insert PI-TB-US-V4 Page 11 of 36
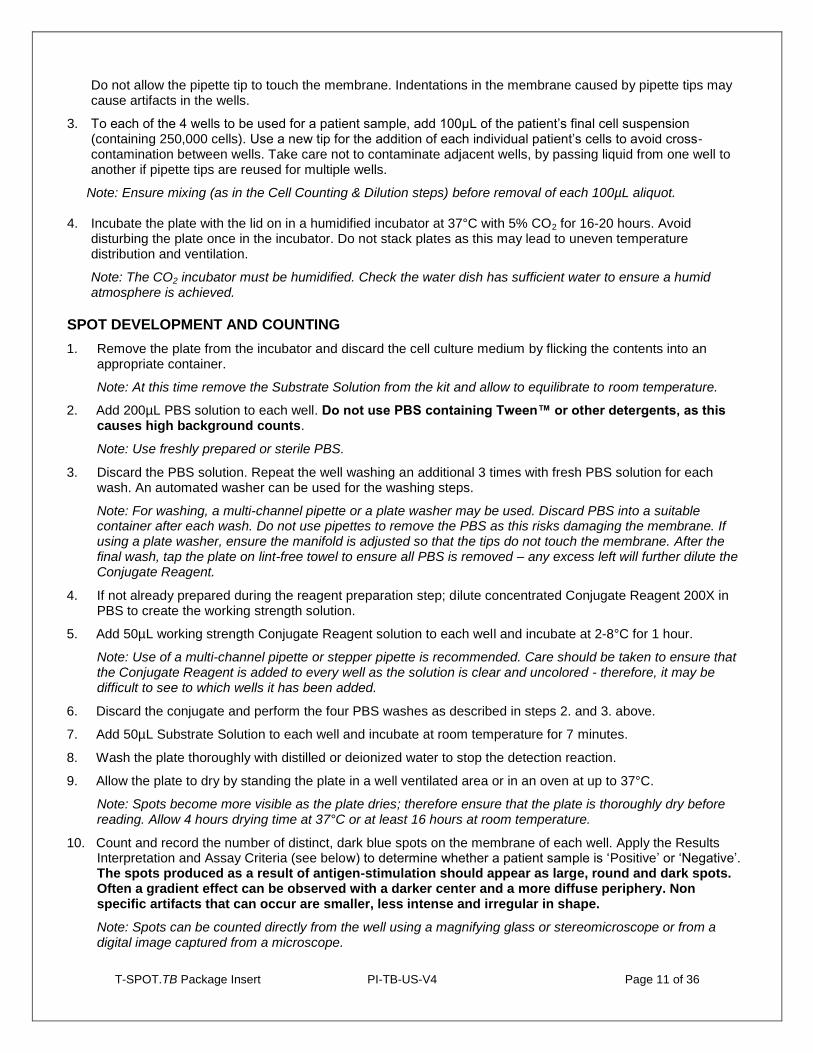
Do not allow the pipette tip to touch the membrane. Indentations in the membrane caused by pipette tips may cause artifacts in the wells.
3. To each of the 4 wells to be used for a patient sample, add 100µL of the patient’s final cell suspension (containing 250,000 cells). Use a new tip for the addition of each individual patient’s cells to avoid cross-contamination between wells. Take care not to contaminate adjacent wells, by passing liquid from one well to another if pipette tips are reused for multiple wells.
Note: Ensure mixing (as in the Cell Counting & Dilution steps) before removal of each 100µL aliquot.
4. Incubate the plate with the lid on in a humidified incubator at 37°C with 5% CO2 for 16-20 hours. Avoid disturbing the plate once in the incubator. Do not stack plates as this may lead to uneven temperature distribution and ventilation.
Note: The CO2 incubator must be humidified. Check the water dish has sufficient water to ensure a humid atmosphere is achieved.
SPOT DEVELOPMENT AND COUNTING
1. Remove the plate from the incubator and discard the cell culture medium by flicking the contents into an appropriate container.
Note: At this time remove the Substrate Solution from the kit and allow to equilibrate to room temperature.
2. Add 200µL PBS solution to each well. Do not use PBS containing Tween™ or other detergents, as this causes high background counts.
Note: Use freshly prepared or sterile PBS.
3. Discard the PBS solution. Repeat the well washing an additional 3 times with fresh PBS solution for each wash. An automated washer can be used for the washing steps.
Note: For washing, a multi-channel pipette or a plate washer may be used. Discard PBS into a suitable container after each wash. Do not use pipettes to remove the PBS as this risks damaging the membrane. If using a plate washer, ensure the manifold is adjusted so that the tips do not touch the membrane. After the final wash, tap the plate on lint-free towel to ensure all PBS is removed – any excess left will further dilute the Conjugate Reagent.
4. If not already prepared during the reagent preparation step; dilute concentrated Conjugate Reagent 200X in PBS to create the working strength solution.
5. Add 50µL working strength Conjugate Reagent solution to each well and incubate at 2-8°C for 1 hour.
Note: Use of a multi-channel pipette or stepper pipette is recommended. Care should be taken to ensure that the Conjugate Reagent is added to every well as the solution is clear and uncolored - therefore, it may be difficult to see to which wells it has been added.
6. Discard the conjugate and perform the four PBS washes as described in steps 2. and 3. above.
7. Add 50µL Substrate Solution to each well and incubate at room temperature for 7 minutes.
8. Wash the plate thoroughly with distilled or deionized water to stop the detection reaction.
9. Allow the plate to dry by standing the plate in a well ventilated area or in an oven at up to 37°C.
Note: Spots become more visible as the plate dries; therefore ensure that the plate is thoroughly dry before reading. Allow 4 hours drying time at 37°C or at least 16 hours at room temperature.
10. Count and record the number of distinct, dark blue spots on the membrane of each well. Apply the Results Interpretation and Assay Criteria (see below) to determine whether a patient sample is ‘Positive’ or ‘Negative’. The spots produced as a result of antigen-stimulation should appear as large, round and dark spots. Often a gradient effect can be observed with a darker center and a more diffuse periphery. Non specific artifacts that can occur are smaller, less intense and irregular in shape.
Note: Spots can be counted directly from the well using a magnifying glass or stereomicroscope or from a digital image captured from a microscope.
T-SPOT.TB Package Insert PI-TB-US-V4 Page 12 of 36
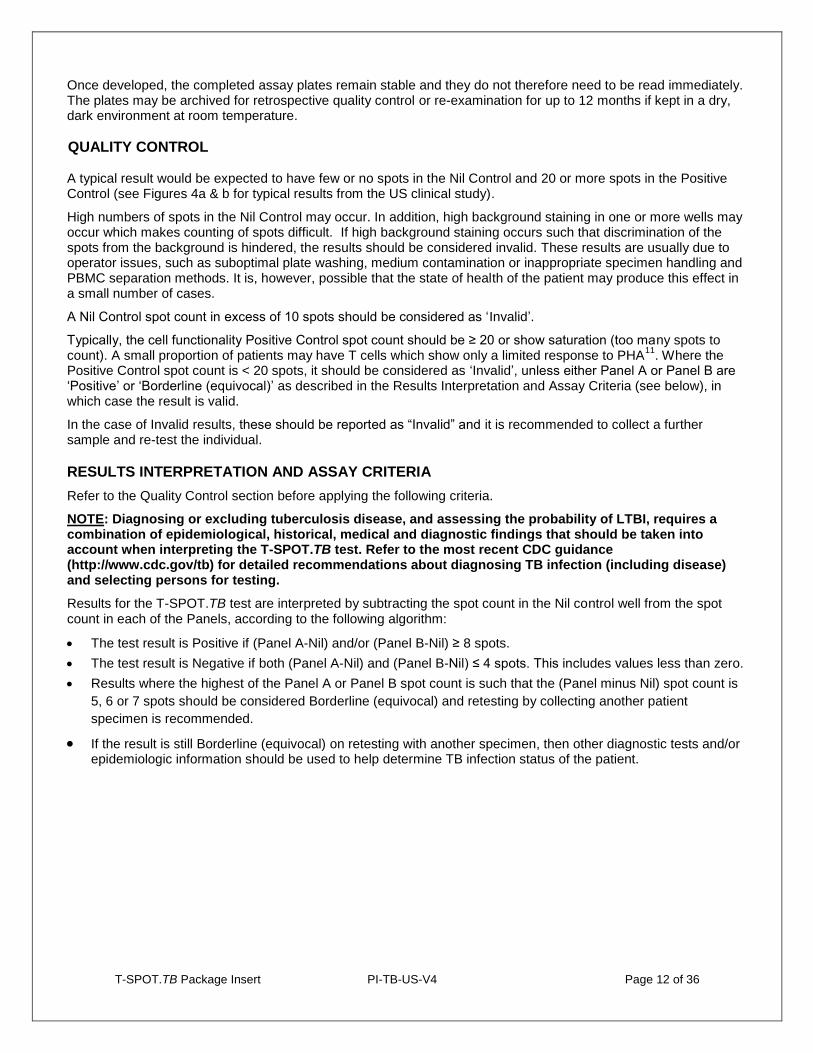
Once developed, the completed assay plates remain stable and they do not therefore need to be read immediately. The plates may be archived for retrospective quality control or re-examination for up to 12 months if kept in a dry, dark environment at room temperature.
QUALITY CONTROL A typical result would be expected to have few or no spots in the Nil Control and 20 or more spots in the Positive Control (see Figures 4a & b for typical results from the US clinical study).
High numbers of spots in the Nil Control may occur. In addition, high background staining in one or more wells may occur which makes counting of spots difficult. If high background staining occurs such that discrimination of the spots from the background is hindered, the results should be considered invalid. These results are usually due to operator issues, such as suboptimal plate washing, medium contamination or inappropriate specimen handling and PBMC separation methods. It is, however, possible that the state of health of the patient may produce this effect in a small number of cases.
A Nil Control spot count in excess of 10 spots should be considered as ‘Invalid’.
Typically, the cell functionality Positive Control spot count should be ≥ 20 or show saturation (too many spots to count). A small proportion of patients may have T cells which show only a limited response to PHA
11. Where the
Positive Control spot count is < 20 spots, it should be considered as ‘Invalid’, unless either Panel A or Panel B are ‘Positive’ or ‘Borderline (equivocal)’ as described in the Results Interpretation and Assay Criteria (see below), in which case the result is valid.
In the case of Invalid results, these should be reported as “Invalid” and it is recommended to collect a further sample and re-test the individual.
RESULTS INTERPRETATION AND ASSAY CRITERIA
Refer to the Quality Control section before applying the following criteria.
NOTE: Diagnosing or excluding tuberculosis disease, and assessing the probability of LTBI, requires a combination of epidemiological, historical, medical and diagnostic findings that should be taken into account when interpreting the T-SPOT.TB test. Refer to the most recent CDC guidance (http://www.cdc.gov/tb) for detailed recommendations about diagnosing TB infection (including disease) and selecting persons for testing.
Results for the T-SPOT.TB test are interpreted by subtracting the spot count in the Nil control well from the spot count in each of the Panels, according to the following algorithm:
The test result is Positive if (Panel A-Nil) and/or (Panel B-Nil) ≥ 8 spots.
The test result is Negative if both (Panel A-Nil) and (Panel B-Nil) ≤ 4 spots. This includes values less than zero.
Results where the highest of the Panel A or Panel B spot count is such that the (Panel minus Nil) spot count is
5, 6 or 7 spots should be considered Borderline (equivocal) and retesting by collecting another patient
specimen is recommended.
If the result is still Borderline (equivocal) on retesting with another specimen, then other diagnostic tests and/or epidemiologic information should be used to help determine TB infection status of the patient.
T-SPOT.TB Package Insert PI-TB-US-V4 Page 13 of 36
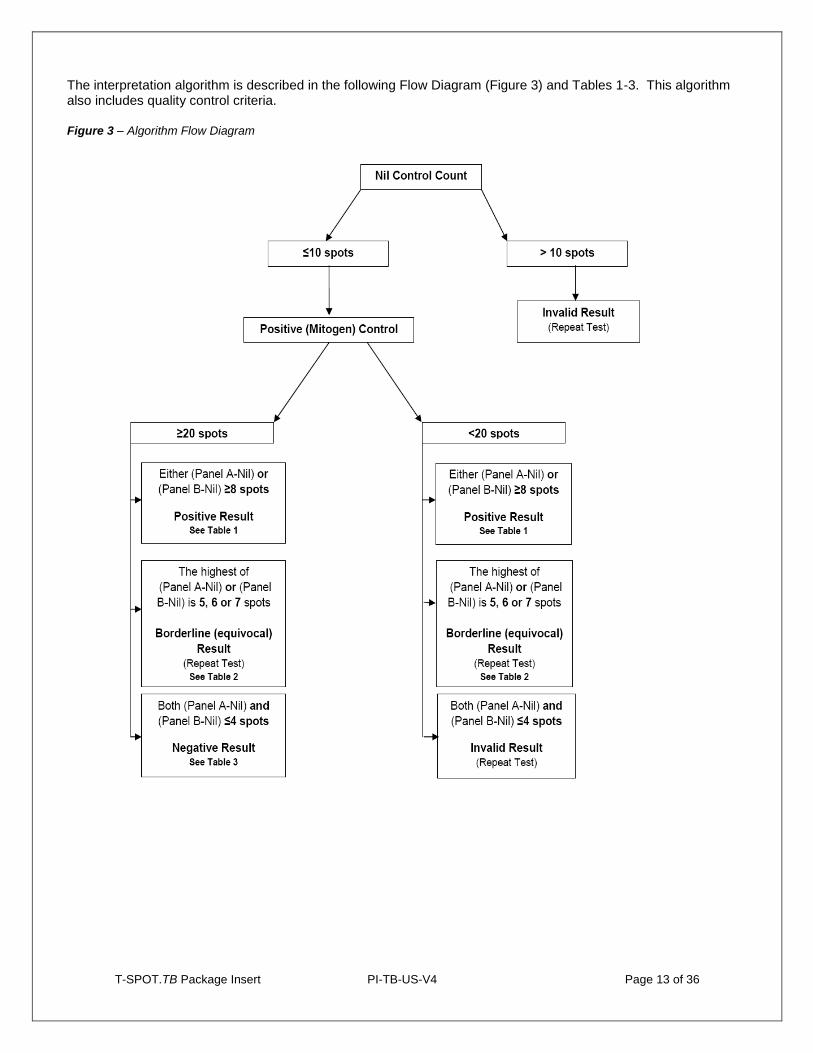
The interpretation algorithm is described in the following Flow Diagram (Figure 3) and Tables 1-3. This algorithm also includes quality control criteria.
Figure 3 – Algorithm Flow Diagram
T-SPOT.TB Package Insert PI-TB-US-V4 Page 14 of 36
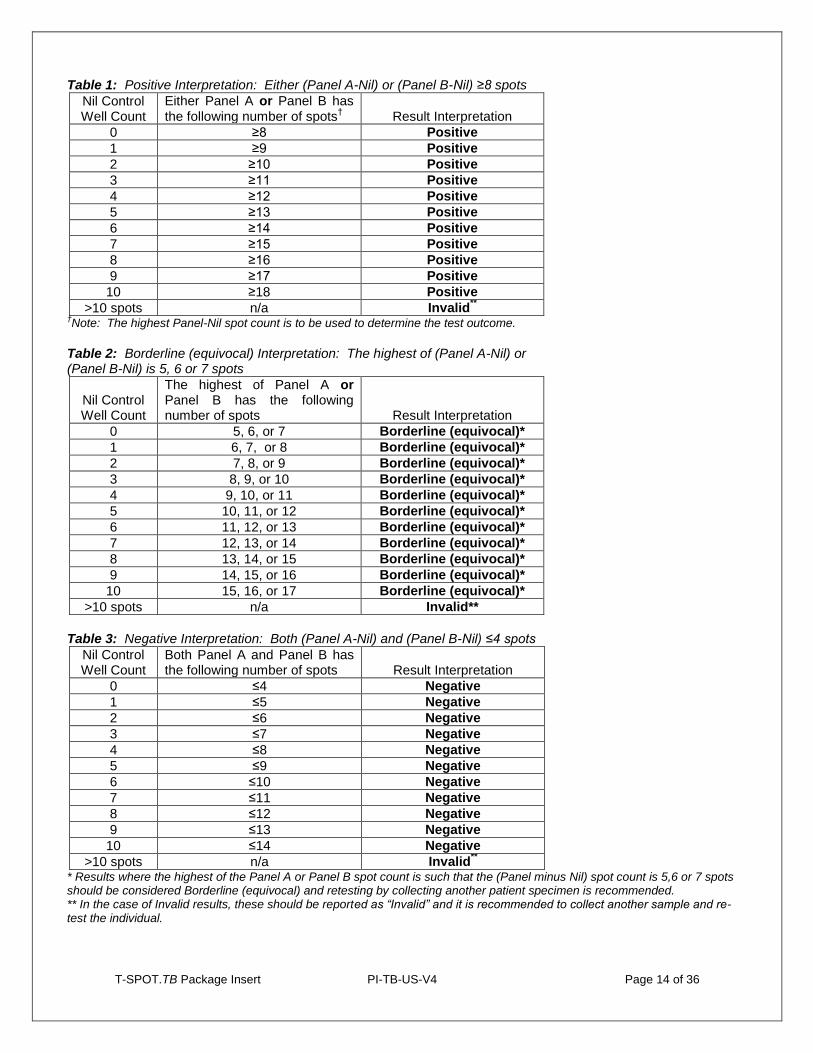
Table 1: Positive Interpretation: Either (Panel A-Nil) or (Panel B-Nil) ≥8 spots
Nil Control Well Count
Either Panel A or Panel B has the following number of spots
†
Result Interpretation
0 ≥8 Positive
1 ≥9 Positive
2 ≥10 Positive
3 ≥11 Positive
4 ≥12 Positive
5 ≥13 Positive
6 ≥14 Positive
7 ≥15 Positive
8 ≥16 Positive
9 ≥17 Positive
10 ≥18 Positive
>10 spots n/a Invalid**
†Note: The highest Panel-Nil spot count is to be used to determine the test outcome.
Table 2: Borderline (equivocal) Interpretation: The highest of (Panel A-Nil) or (Panel B-Nil) is 5, 6 or 7 spots
Nil Control Well Count
The highest of Panel A or Panel B has the following number of spots
Result Interpretation
0 5, 6, or 7 Borderline (equivocal)*
1 6, 7, or 8 Borderline (equivocal)*
2 7, 8, or 9 Borderline (equivocal)*
3 8, 9, or 10 Borderline (equivocal)*
4 9, 10, or 11 Borderline (equivocal)*
5 10, 11, or 12 Borderline (equivocal)*
6 11, 12, or 13 Borderline (equivocal)*
7 12, 13, or 14 Borderline (equivocal)*
8 13, 14, or 15 Borderline (equivocal)*
9 14, 15, or 16 Borderline (equivocal)*
10 15, 16, or 17 Borderline (equivocal)*
>10 spots n/a Invalid**
Table 3: Negative Interpretation: Both (Panel A-Nil) and (Panel B-Nil) ≤4 spots
Nil Control Well Count
Both Panel A and Panel B has the following number of spots
Result Interpretation
0 ≤4 Negative
1 ≤5 Negative
2 ≤6 Negative
3 ≤7 Negative
4 ≤8 Negative
5 ≤9 Negative
6 ≤10 Negative
7 ≤11 Negative
8 ≤12 Negative
9 ≤13 Negative
10 ≤14 Negative
>10 spots n/a Invalid**
* Results where the highest of the Panel A or Panel B spot count is such that the (Panel minus Nil) spot count is 5,6 or 7 spots should be considered Borderline (equivocal) and retesting by collecting another patient specimen is recommended. ** In the case of Invalid results, these should be reported as “Invalid” and it is recommended to collect another sample and re-test the individual.
T-SPOT.TB Package Insert PI-TB-US-V4 Page 15 of 36
7. LIMITATIONS
Deviations from the instructions for use in this package insert may yield erroneous results.
Incorrect performance of the assay may cause false positive or false negative responses.
A false negative result can be caused by incorrect blood sample collection or improper handling of the
specimen, affecting lymphocyte function.
The performance of T-SPOT.TB test, with or without the use of the T-Cell Xtend reagent, has not been
adequately evaluated with specimens from individuals younger than age 17 years, in pregnant women, and in
patients with hemophilia.
A false positive result was obtained for the T-SPOT.TB test when tested in subjects with M. xenopi, M.
kansasii and M. gordonae. While ESAT-6 and CFP10 antigens are absent from BCG strains of M. bovis and
from most environmental mycobacteria, it is possible that a positive T-SPOT.TB test result may be due to
infection with M. kansasii, M. szulgai, M. gordonae or M. marinum4. Alternative tests would be required if these
infections are suspected.
Results from T-SPOT.TB testing must be used in conjunction with each individual’s epidemiological history,
current medical status and results of other diagnostic evaluations.
A negative test result does not exclude the possibility of exposure to, or infection with, M. tuberculosis.
Patients with recent exposure to TB infected individuals exhibiting a negative T-SPOT.TB test result should be
considered for retesting within 6 weeks or if other relevant clinical symptoms indicate possible infection.
A positive test result does not rule in active TB disease; other tests should be performed to confirm the
diagnosis of active TB disease such as sputum smear and culture, PCR and chest radiography.
T-SPOT.TB test has not been evaluated in subjects who have received > 1 month of anti-TB therapy.
Refrigerated and frozen samples are not recommended for use with T-SPOT.TB test.
LIMITATIONS SPECIFIC TO THE USE OF T-CELL XTEND REAGENT
1. T-Cell Xtend reagent has not been evaluated for uses other than with the T-SPOT.TB test. 2. Do not allow blood samples to be exposed to temperatures above 25ºC as this may result in increased
background and other test anomalies.. 3. Do not refrigerate or freeze whole blood samples. Store and transport blood samples to the laboratory
between 18-25˚C. 4. Any deviation from recommended procedures for pipetting, washing techniques, incubation times and/or
temperatures may influence test results.
T-SPOT.TB Package Insert PI-TB-US-V4 Page 16 of 36
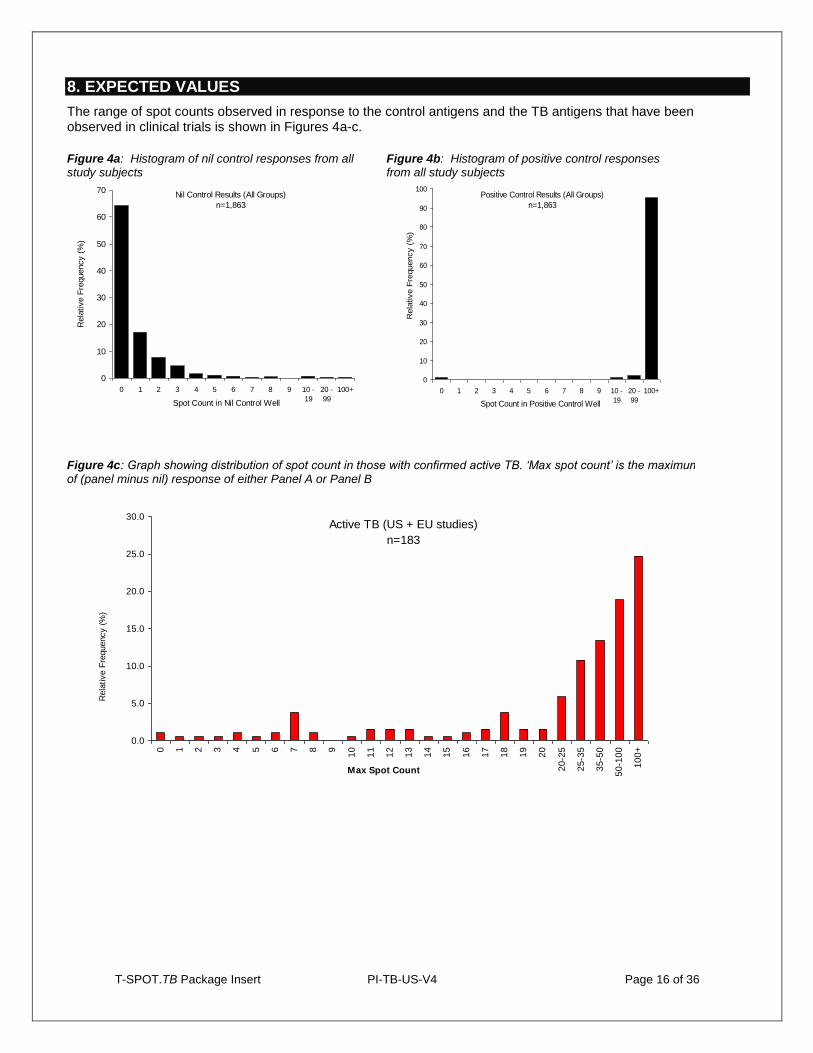
8. EXPECTED VALUES
The range of spot counts observed in response to the control antigens and the TB antigens that have been observed in clinical trials is shown in Figures 4a-c.
Figure 4a: Histogram of nil control responses from all study subjects
Figure 4b: Histogram of positive control responses from all study subjects
Figure 4c: Graph showing distribution of spot count in those with confirmed active TB. ‘Max spot count’ is the maximum (panel minus nil) response of (panel minus nil) response of either Panel A or Panel B
Nil Control Results (All Groups)
n=1,863
0
10
20
30
40
50
60
70
0 1 2 3 4 5 6 7 8 9 10 -
19
20 -
99
100+
Spot Count in Nil Control Well
Rela
tive F
requency (
%)
_
Positive Control Results (All Groups)
n=1,863
0
10
20
30
40
50
60
70
80
90
100
0 1 2 3 4 5 6 7 8 9 10 -
19
20 -
99
100+
Spot Count in Positive Control WellR
ela
tive F
requency (
%)
Active TB (US + EU studies)
n=183
0.0
5.0
10.0
15.0
20.0
25.0
30.0
0 1 2 3 4 5 6 7 8 9
10
11
12
13
14
15
16
17
18
19
20
20
-25
25
-35
35
-50
50
-10
0
10
0+
Max Spot Count
Rela
tive F
requency (
%)
T-SPOT.TB Package Insert PI-TB-US-V4 Page 17 of 36
9. PERFORMANCE CHARACTERISTICS
ASSAY PERFORMANCE CHARACTERISTICS
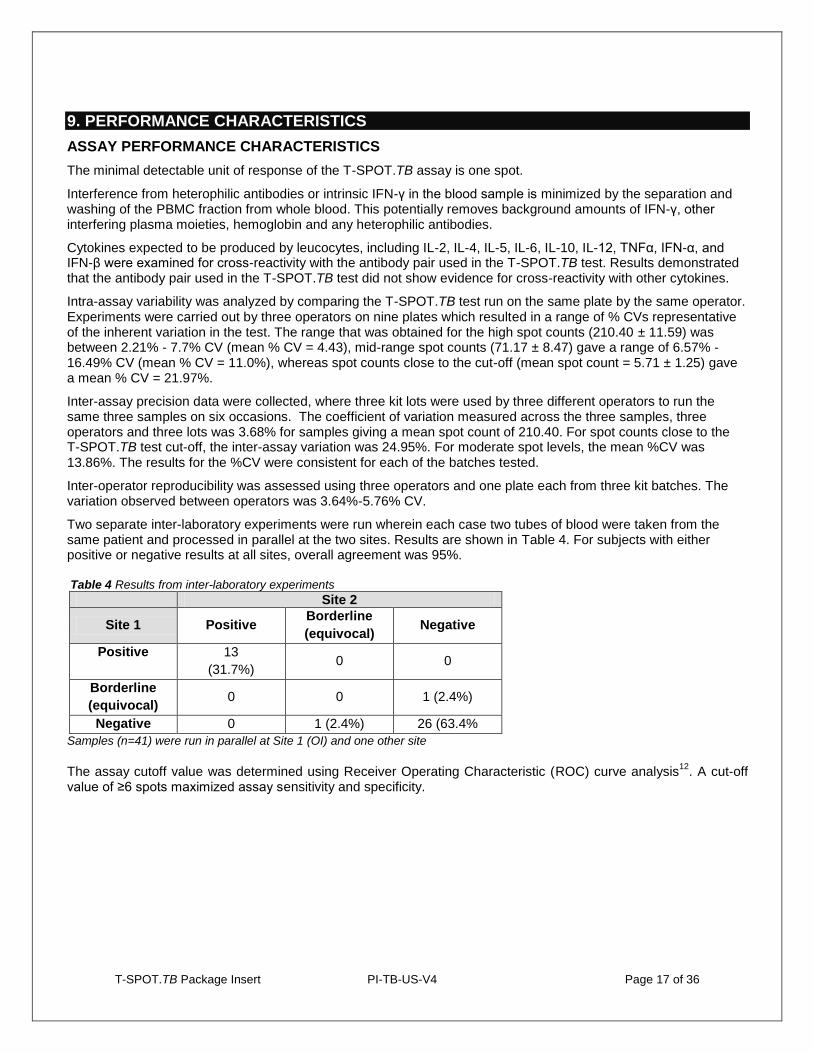
The minimal detectable unit of response of the T-SPOT.TB assay is one spot.
Interference from heterophilic antibodies or intrinsic IFN-γ in the blood sample is minimized by the separation and washing of the PBMC fraction from whole blood. This potentially removes background amounts of IFN-γ, other interfering plasma moieties, hemoglobin and any heterophilic antibodies.
Cytokines expected to be produced by leucocytes, including IL-2, IL-4, IL-5, IL-6, IL-10, IL-12, TNFα, IFN-α, and IFN-β were examined for cross-reactivity with the antibody pair used in the T-SPOT.TB test. Results demonstrated that the antibody pair used in the T-SPOT.TB test did not show evidence for cross-reactivity with other cytokines.
Intra-assay variability was analyzed by comparing the T-SPOT.TB test run on the same plate by the same operator. Experiments were carried out by three operators on nine plates which resulted in a range of % CVs representative of the inherent variation in the test. The range that was obtained for the high spot counts (210.40 ± 11.59) was between 2.21% - 7.7% CV (mean % CV = 4.43), mid-range spot counts (71.17 ± 8.47) gave a range of 6.57% - 16.49% CV (mean % CV = 11.0%), whereas spot counts close to the cut-off (mean spot count = 5.71 ± 1.25) gave a mean % CV = 21.97%.
Inter-assay precision data were collected, where three kit lots were used by three different operators to run the same three samples on six occasions. The coefficient of variation measured across the three samples, three operators and three lots was 3.68% for samples giving a mean spot count of 210.40. For spot counts close to the T-SPOT.TB test cut-off, the inter-assay variation was 24.95%. For moderate spot levels, the mean %CV was 13.86%. The results for the %CV were consistent for each of the batches tested.
Inter-operator reproducibility was assessed using three operators and one plate each from three kit batches. The variation observed between operators was 3.64%-5.76% CV.
Two separate inter-laboratory experiments were run wherein each case two tubes of blood were taken from the same patient and processed in parallel at the two sites. Results are shown in Table 4. For subjects with either positive or negative results at all sites, overall agreement was 95%. Table 4 Results from inter-laboratory experiments
Site 2
Site 1 Positive Borderline
(equivocal) Negative
Positive 13
(31.7%) 0 0
Borderline
(equivocal) 0 0 1 (2.4%)
Negative 0 1 (2.4%) 26 (63.4%
Samples (n=41) were run in parallel at Site 1 (OI) and one other site
The assay cutoff value was determined using Receiver Operating Characteristic (ROC) curve analysis12
. A cut-off value of ≥6 spots maximized assay sensitivity and specificity.
T-SPOT.TB Package Insert PI-TB-US-V4 Page 18 of 36
SUMMARY OF CLINICAL DATA TO SUPPORT INITIAL T-SPOT.TB TEST APPROVAL
A pivotal clinical study was designed to establish the clinical performance of the T-SPOT.TB test in both culture confirmed active TB disease and in potentially latent TB infection in populations stratified by risk of exposure to M. tuberculosis. A total of 2355 subjects were enrolled in the pivotal study; using 11 study sites as detailed in Table 5. Of the 2355 enrolled subjects, 492 samples did not meet the study criteria, leaving 1863 subjects available for analysis.
The 492 samples were excluded for the following reasons: 14 no informed consent/possible coercion, 11 excluded by site, 13 duplicate enrollments, 59 no blood sample collected, 115 insufficient sample collected to run T-SPOT.TB assay, 66 laboratory deviations in performing the T-SPOT.TB test, 18 no risk group assigned (incomplete data ) and 196 without a TST result (121 recorded as no TST administered or no result provided, 67 with no record of the TST or missing medical records, 6 with a TST result from greater than a year prior to the study and no current result, 1 non-return for the reading of the TST result, 1 TST given post enrollment).
The study population as a whole was intended to include subjects from all major risk groups indicated for screening for TB infection according to guidelines from the CDC
2. The performance of T-SPOT.TB was assessed in
populations where the TST may likely give false-positive results (e.g. patients exposed to non-tuberculous mycobacteria and those who have previously received the BCG vaccination)
13. In addition, the performance of the
T-SPOT.TB test was assessed in populations where the TST may likely give false-negative results (e.g., patients of very young or old age and patients with various types of immunosuppression) and who may be at elevated risk of progression of latent TB infection to active TB disease
2,14-17. All TST results were scored using 5, 10 or 15mm
cutoffs according to CDC/ATS guidance1.
Subjects from the pivotal study were classified into five main groups for analysis. The allocation of all patients from the pivotal study is detailed in Figure 5.
Group 1 – Active TB (n=105)
The sensitivity of the T-SPOT.TB test was estimated from subjects where it was known that active, culture confirmed TB infection was present. Only subjects with positive culture confirmed results were included in this group. It was not a requirement for this group to have a TST result. 69 subjects were from Brazil, and 36 remaining subjects were from three Texas sites. In addition, results from studies in Germany (n=34), Italy (n=22) and the UK (n=28) were included into this Group for sensitivity calculations only. Thus, the sensitivity calculations were based on a combined group of 189 subjects, of which 6 T-SPOT.TB test results were invalid, leaving 183 samples for analysis. Results are presented in Table 7.
Group 2 – Low Risk Controls (n=311)
The specificity of the T-SPOT.TB test was estimated from subjects that were presumed as much as possible to have a lower probability of TB infection. “Low risk” subjects were selected on the basis of the absence of clinical, epidemiological and diagnostic risk factors for TB infection. A negative TST result was a requirement for this group.
Although common risk factors for TB infection were assessed in these subjects, a complete epidemiological background on each participant could not be obtained and, as such, this group may have contained subjects who had a genuine TB or NTM infection. This group was used to estimate specificity of the T-SPOT.TB test.
Factors used to determine a low risk of TB infection, based on patient self report, was the absence of any of the following factors:
More than 3 months spent living in a TB endemic country (TB prevalence > 40/100,000)
Occupational history of work in a high risk setting, e.g., TB laboratory, health care worker
Time spent in a high risk environment, e.g., jail, nursing home or homeless shelter
Known contact with TB Index case
IV Drug use
Heavy alcohol use
Known Non-tuberculous (NTM) infection
T-SPOT.TB Package Insert PI-TB-US-V4 Page 19 of 36
HIV infection or other immunosuppressive conditions
History of having had TB or taken TB medication
Radiological or microbiological test results consistent with TB infection
Positive TST result
Of the 311 results, 5 had invalid T-SPOT.TB test results leaving 306 results for analysis. Results are presented in Table 8.
Group 3 – LTBI Suspects (n=1403)
This group, the largest in the study, included candidates for routine screening for LTBI infection according to the prevailing CDC guidelines for screening of risk groups. This group contained a broad mix of subjects screened for TB infection at varying degrees of risk of exposure (for example: recent contacts of known source cases, prison inmates) and risk of progression (for example: those with HIV infection, young children, the elderly, those with immunosuppressive conditions). This group was used to demonstrate the number of positive T-SPOT.TB test results relative to TST results in these populations.
Of the 1403 results, 55 had invalid T-SPOT.TB results leaving 1348 results for analysis. Results are presented in Table 10.
Group 4 – NTM (n=19)
This group contained a small group of subjects with known Non-Tuberculosis Mycobacterial (NTM) infections. [Note that these are also sometimes called Mycobacteria Other Than Tuberculosis (MOTT) or Atypical mycobacteria]. The group includes subjects with recently diagnosed (within previous 12 months) NTM infection, or those who were diagnosed more than 12 months previously but listed by the enrolling physician as having an active ongoing infection. TST was not a requirement, but was sometimes included in their normal clinical care. This group was used to demonstrate the estimated cross reactivity of the T-SPOT.TB test in NTM infection. Of the 19 results, 1 was invalid by the T-SPOT.TB test, leaving 18 results available for analysis. Results are presented in Table 11.
Group 5 – Unconfirmed Active TB (n=25)
Among those subjects recruited with active TB; 25 subjects were diagnosed clinically without culture-confirmation. TST was not consistently performed. Of the 25 results, 1 was invalid by the T-SPOT.TB test leaving 24 results for analysis. Results are presented on page 26.
T-SPOT.TB Package Insert PI-TB-US-V4 Page 20 of 36
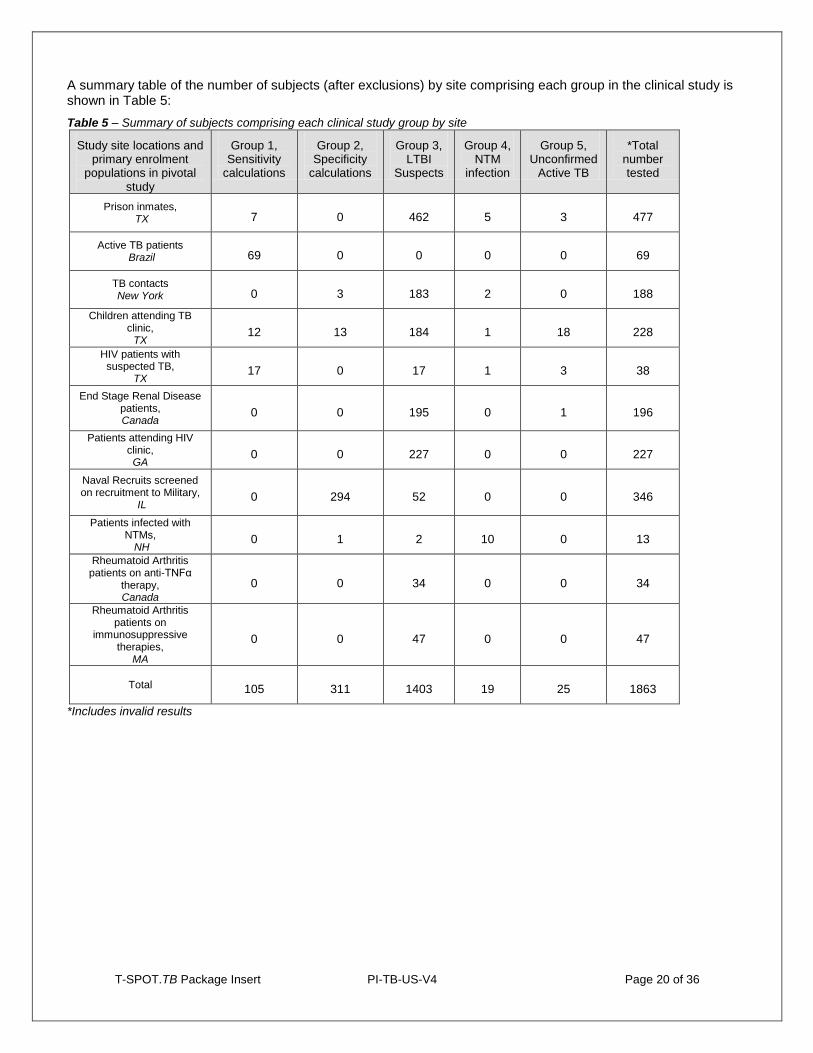
A summary table of the number of subjects (after exclusions) by site comprising each group in the clinical study is shown in Table 5:
Table 5 – Summary of subjects comprising each clinical study group by site
Study site locations and primary enrolment
populations in pivotal study
Group 1, Sensitivity
calculations
Group 2, Specificity
calculations
Group 3, LTBI
Suspects
Group 4, NTM
infection
Group 5, Unconfirmed
Active TB
*Total number tested
Prison inmates, TX 7 0 462 5 3 477
Active TB patients Brazil 69 0 0 0 0 69
TB contacts New York 0 3 183 2 0 188
Children attending TB clinic,
TX 12 13 184 1 18 228
HIV patients with suspected TB,
TX 17 0 17 1 3 38
End Stage Renal Disease patients, Canada
0 0 195 0 1 196
Patients attending HIV clinic, GA
0 0 227 0 0 227
Naval Recruits screened on recruitment to Military,
IL 0 294 52 0 0 346
Patients infected with NTMs,
NH 0 1 2 10 0 13
Rheumatoid Arthritis patients on anti-TNFα
therapy, Canada
0 0 34 0 0 34
Rheumatoid Arthritis patients on
immunosuppressive therapies,
MA
0 0 47 0 0 47
Total 105 311 1403 19 25 1863
*Includes invalid results
T-SPOT.TB Package Insert PI-TB-US-V4 Page 21 of 36
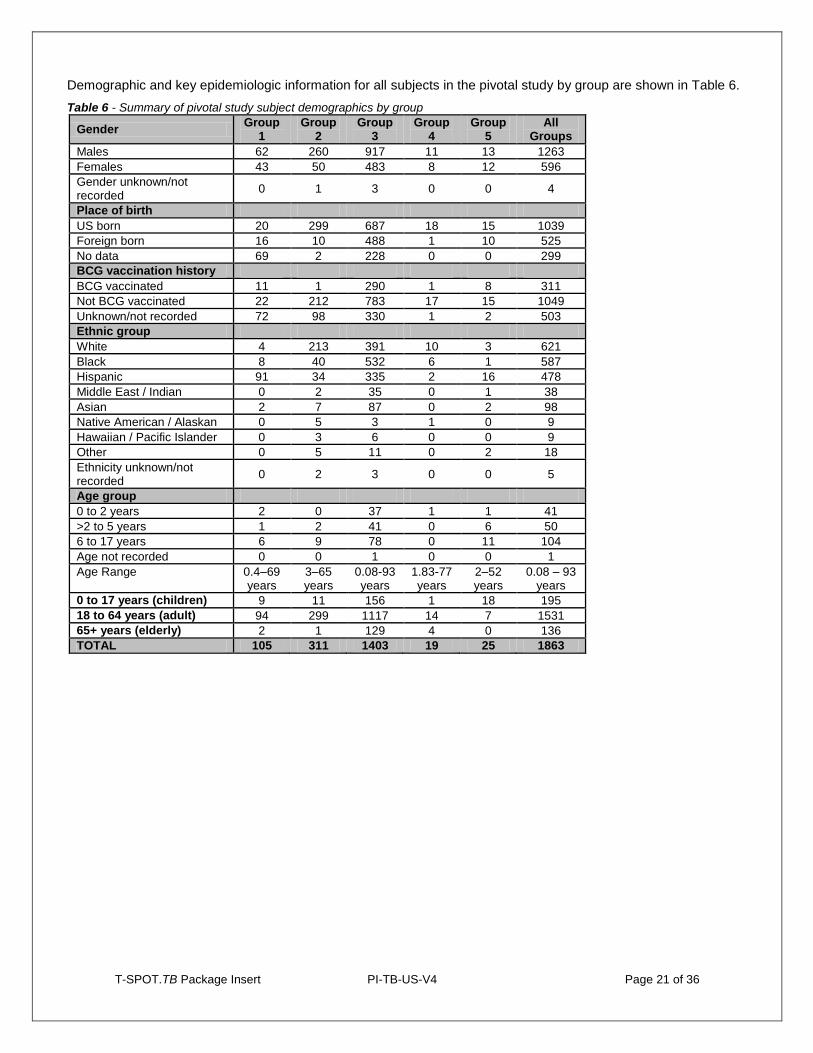
Demographic and key epidemiologic information for all subjects in the pivotal study by group are shown in Table 6.
Table 6 - Summary of pivotal study subject demographics by group
Gender Group
1 Group
2 Group
3 Group
4 Group
5 All
Groups
Males 62 260 917 11 13 1263
Females 43 50 483 8 12 596
Gender unknown/not recorded
0 1 3 0 0 4
Place of birth
US born 20 299 687 18 15 1039
Foreign born 16 10 488 1 10 525
No data 69 2 228 0 0 299
BCG vaccination history
BCG vaccinated 11 1 290 1 8 311
Not BCG vaccinated 22 212 783 17 15 1049
Unknown/not recorded 72 98 330 1 2 503
Ethnic group
White 4 213 391 10 3 621
Black 8 40 532 6 1 587
Hispanic 91 34 335 2 16 478
Middle East / Indian 0 2 35 0 1 38
Asian 2 7 87 0 2 98
Native American / Alaskan 0 5 3 1 0 9
Hawaiian / Pacific Islander 0 3 6 0 0 9
Other 0 5 11 0 2 18
Ethnicity unknown/not recorded
0 2 3 0 0 5
Age group
0 to 2 years 2 0 37 1 1 41
>2 to 5 years 1 2 41 0 6 50
6 to 17 years 6 9 78 0 11 104
Age not recorded 0 0 1 0 0 1
Age Range 0.4–69 years
3–65 years
0.08-93 years
1.83-77 years
2–52 years
0.08 – 93 years
0 to 17 years (children) 9 11 156 1 18 195
18 to 64 years (adult) 94 299 1117 14 7 1531
65+ years (elderly) 2 1 129 4 0 136
TOTAL 105 311 1403 19 25 1863
T-SPOT.TB Package Insert PI-TB-US-V4 Page 22 of 36
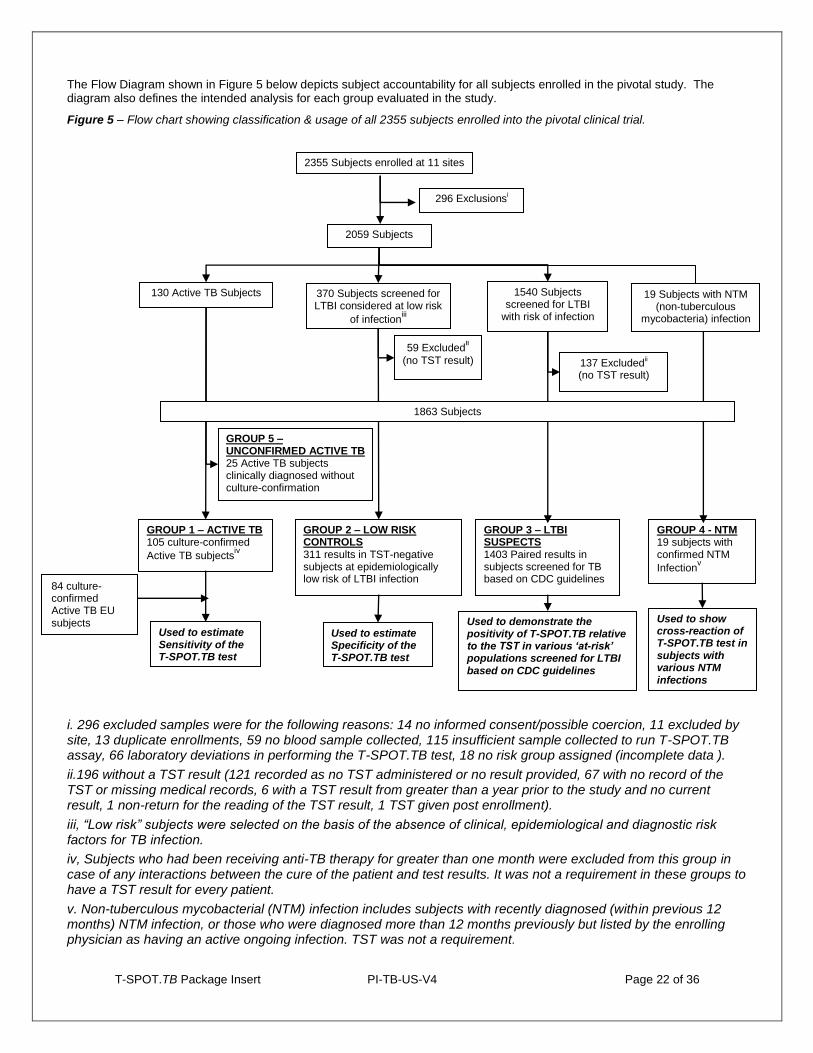
The Flow Diagram shown in Figure 5 below depicts subject accountability for all subjects enrolled in the pivotal study. The diagram also defines the intended analysis for each group evaluated in the study.
Figure 5 – Flow chart showing classification & usage of all 2355 subjects enrolled into the pivotal clinical trial.
i. 296 excluded samples were for the following reasons: 14 no informed consent/possible coercion, 11 excluded by site, 13 duplicate enrollments, 59 no blood sample collected, 115 insufficient sample collected to run T-SPOT.TB assay, 66 laboratory deviations in performing the T-SPOT.TB test, 18 no risk group assigned (incomplete data ).
ii.196 without a TST result (121 recorded as no TST administered or no result provided, 67 with no record of the TST or missing medical records, 6 with a TST result from greater than a year prior to the study and no current result, 1 non-return for the reading of the TST result, 1 TST given post enrollment).
iii, “Low risk” subjects were selected on the basis of the absence of clinical, epidemiological and diagnostic risk factors for TB infection.
iv, Subjects who had been receiving anti-TB therapy for greater than one month were excluded from this group in case of any interactions between the cure of the patient and test results. It was not a requirement in these groups to have a TST result for every patient.
v. Non-tuberculous mycobacterial (NTM) infection includes subjects with recently diagnosed (within previous 12 months) NTM infection, or those who were diagnosed more than 12 months previously but listed by the enrolling physician as having an active ongoing infection. TST was not a requirement.
84 culture-confirmed Active TB EU subjects
2355 Subjects enrolled at 11 sites
296 Exclusionsi
2059 Subjects
130 Active TB Subjects 1540 Subjects screened for LTBI
with risk of infection
370 Subjects screened for LTBI considered at low risk
of infectioniii
GROUP 5 – UNCONFIRMED ACTIVE TB 25 Active TB subjects clinically diagnosed without culture-confirmation
137 Excludedii
(no TST result)
59 Excludedii
(no TST result)
GROUP 1 – ACTIVE TB 105 culture-confirmed
Active TB subjectsiv
GROUP 3 – LTBI SUSPECTS 1403 Paired results in subjects screened for TB based on CDC guidelines
GROUP 2 – LOW RISK CONTROLS 311 results in TST-negative subjects at epidemiologically low risk of LTBI infection
Used to estimate Sensitivity of the T-SPOT.TB test
Used to estimate Specificity of the T-SPOT.TB test
Used to demonstrate the positivity of T-SPOT.TB relative to the TST in various ‘at-risk’ populations screened for LTBI based on CDC guidelines
GROUP 4 - NTM 19 subjects with confirmed NTM
Infectionv
Used to show cross-reaction of T-SPOT.TB test in subjects with various NTM infections
19 Subjects with NTM (non-tuberculous
mycobacteria) infection
1863 Subjects
T-SPOT.TB Package Insert PI-TB-US-V4 Page 23 of 36
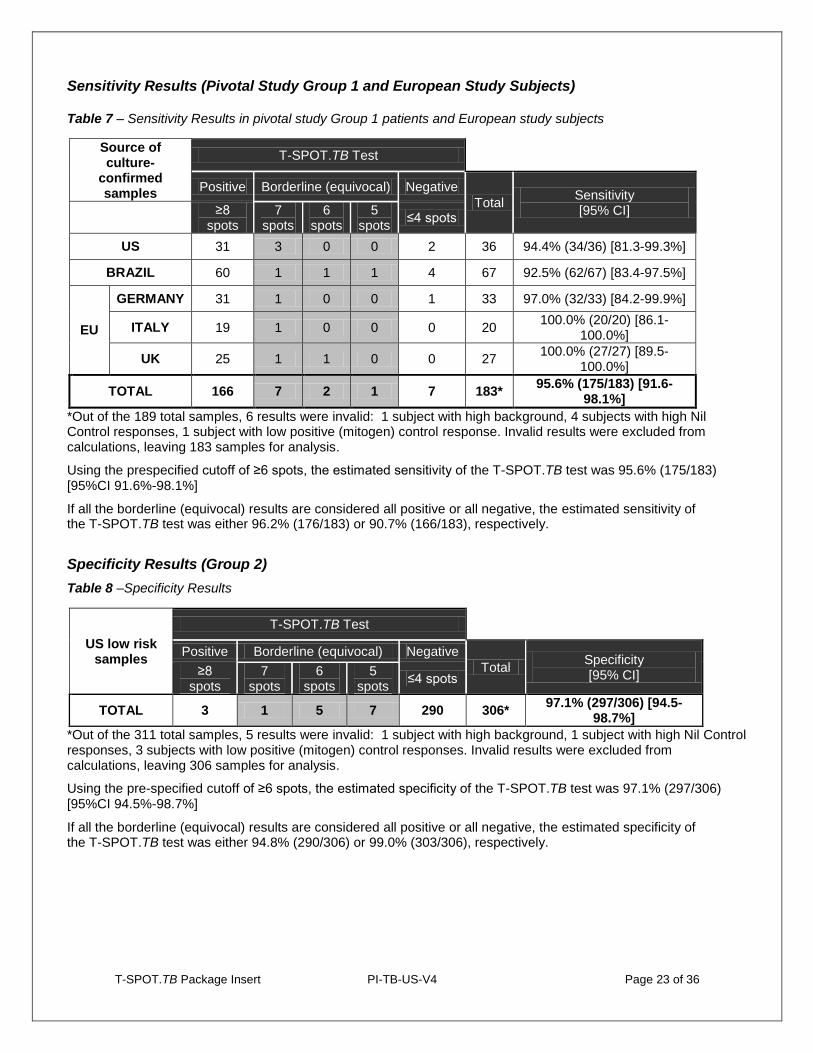
Sensitivity Results (Pivotal Study Group 1 and European Study Subjects)
Table 7 – Sensitivity Results in pivotal study Group 1 patients and European study subjects
Source of culture-
confirmed samples
T-SPOT.TB Test
Positive Borderline (equivocal) Negative
Total Sensitivity [95% CI]
≥8
spots 7
spots 6
spots 5
spots ≤4 spots
US 31 3 0 0 2 36 94.4% (34/36) [81.3-99.3%]
BRAZIL 60 1 1 1 4 67 92.5% (62/67) [83.4-97.5%]
EU
GERMANY 31 1 0 0 1 33 97.0% (32/33) [84.2-99.9%]
ITALY 19 1 0 0 0 20 100.0% (20/20) [86.1-
100.0%]
UK 25 1 1 0 0 27 100.0% (27/27) [89.5-
100.0%]
TOTAL 166 7 2 1 7 183* 95.6% (175/183) [91.6-
98.1%]
*Out of the 189 total samples, 6 results were invalid: 1 subject with high background, 4 subjects with high Nil Control responses, 1 subject with low positive (mitogen) control response. Invalid results were excluded from calculations, leaving 183 samples for analysis.
Using the prespecified cutoff of ≥6 spots, the estimated sensitivity of the T-SPOT.TB test was 95.6% (175/183) [95%CI 91.6%-98.1%]
If all the borderline (equivocal) results are considered all positive or all negative, the estimated sensitivity of the T-SPOT.TB test was either 96.2% (176/183) or 90.7% (166/183), respectively.
Specificity Results (Group 2)
Table 8 –Specificity Results
US low risk samples
T-SPOT.TB Test
Positive Borderline (equivocal) Negative
Total Specificity [95% CI] ≥8
spots 7
spots 6
spots 5
spots ≤4 spots
TOTAL 3 1 5 7 290 306* 97.1% (297/306) [94.5-
98.7%]
*Out of the 311 total samples, 5 results were invalid: 1 subject with high background, 1 subject with high Nil Control responses, 3 subjects with low positive (mitogen) control responses. Invalid results were excluded from calculations, leaving 306 samples for analysis.
Using the pre-specified cutoff of ≥6 spots, the estimated specificity of the T-SPOT.TB test was 97.1% (297/306) [95%CI 94.5%-98.7%]
If all the borderline (equivocal) results are considered all positive or all negative, the estimated specificity of the T-SPOT.TB test was either 94.8% (290/306) or 99.0% (303/306), respectively.
T-SPOT.TB Package Insert PI-TB-US-V4 Page 24 of 36
Results in Subjects in ATS/CDC Risk Groups (Group 3)
There were 1403 subjects allocated to Group 3 who had a total of 1889 ATS/CDC risk factors. A number of BCG vaccinated and foreign-born individuals were included, which is consistent with the epidemiology of TB in the US
18.
A wide age range of subjects were also included.
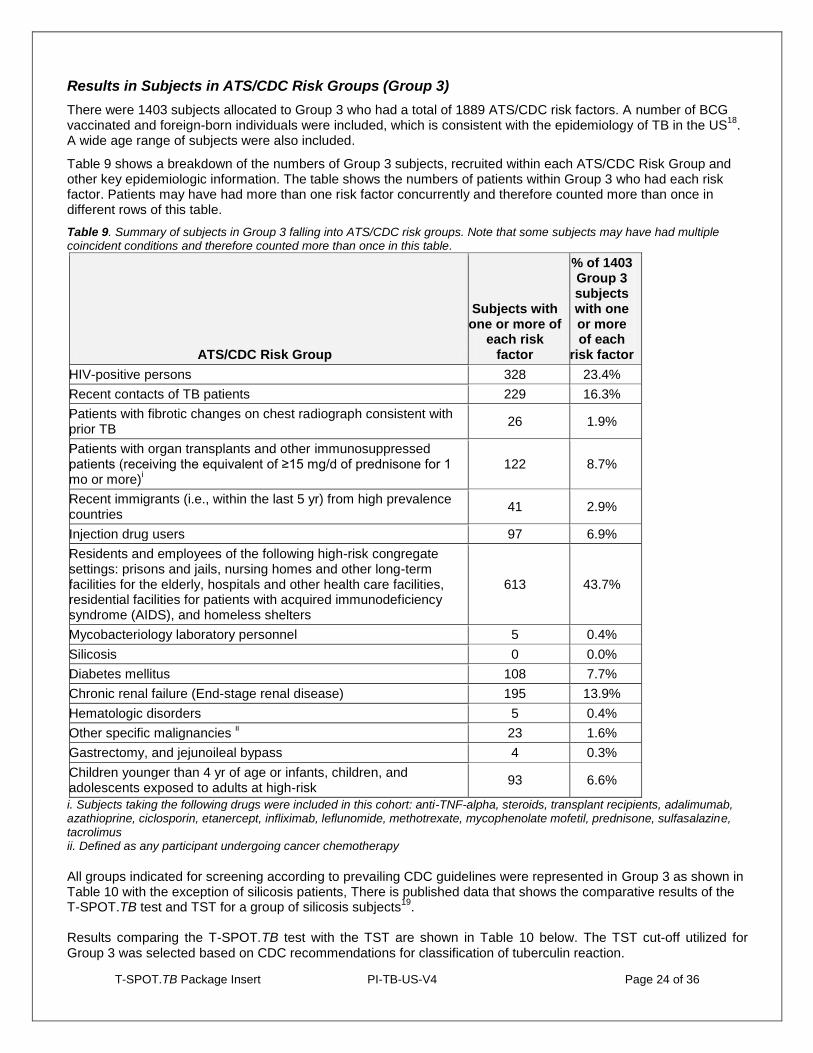
Table 9 shows a breakdown of the numbers of Group 3 subjects, recruited within each ATS/CDC Risk Group and other key epidemiologic information. The table shows the numbers of patients within Group 3 who had each risk factor. Patients may have had more than one risk factor concurrently and therefore counted more than once in different rows of this table.
Table 9. Summary of subjects in Group 3 falling into ATS/CDC risk groups. Note that some subjects may have had multiple coincident conditions and therefore counted more than once in this table.
ATS/CDC Risk Group
Subjects with one or more of
each risk factor
% of 1403 Group 3 subjects with one or more of each
risk factor
HIV-positive persons 328 23.4%
Recent contacts of TB patients 229 16.3%
Patients with fibrotic changes on chest radiograph consistent with prior TB
26 1.9%
Patients with organ transplants and other immunosuppressed patients (receiving the equivalent of ≥15 mg/d of prednisone for 1 mo or more)
i 122 8.7%
Recent immigrants (i.e., within the last 5 yr) from high prevalence countries
41 2.9%
Injection drug users 97 6.9%
Residents and employees of the following high-risk congregate settings: prisons and jails, nursing homes and other long-term facilities for the elderly, hospitals and other health care facilities, residential facilities for patients with acquired immunodeficiency syndrome (AIDS), and homeless shelters
613 43.7%
Mycobacteriology laboratory personnel 5 0.4%
Silicosis 0 0.0%
Diabetes mellitus 108 7.7%
Chronic renal failure (End-stage renal disease) 195 13.9%
Hematologic disorders 5 0.4%
Other specific malignancies ii 23 1.6%
Gastrectomy, and jejunoileal bypass 4 0.3%
Children younger than 4 yr of age or infants, children, and adolescents exposed to adults at high-risk
93 6.6%
i. Subjects taking the following drugs were included in this cohort: anti-TNF-alpha, steroids, transplant recipients, adalimumab, azathioprine, ciclosporin, etanercept, infliximab, leflunomide, methotrexate, mycophenolate mofetil, prednisone, sulfasalazine, tacrolimus ii. Defined as any participant undergoing cancer chemotherapy
All groups indicated for screening according to prevailing CDC guidelines were represented in Group 3 as shown in Table 10 with the exception of silicosis patients, There is published data that shows the comparative results of the T-SPOT.TB test and TST for a group of silicosis subjects
19.
Results comparing the T-SPOT.TB test with the TST are shown in Table 10 below. The TST cut-off utilized for Group 3 was selected based on CDC recommendations for classification of tuberculin reaction.
T-SPOT.TB Package Insert PI-TB-US-V4 Page 25 of 36
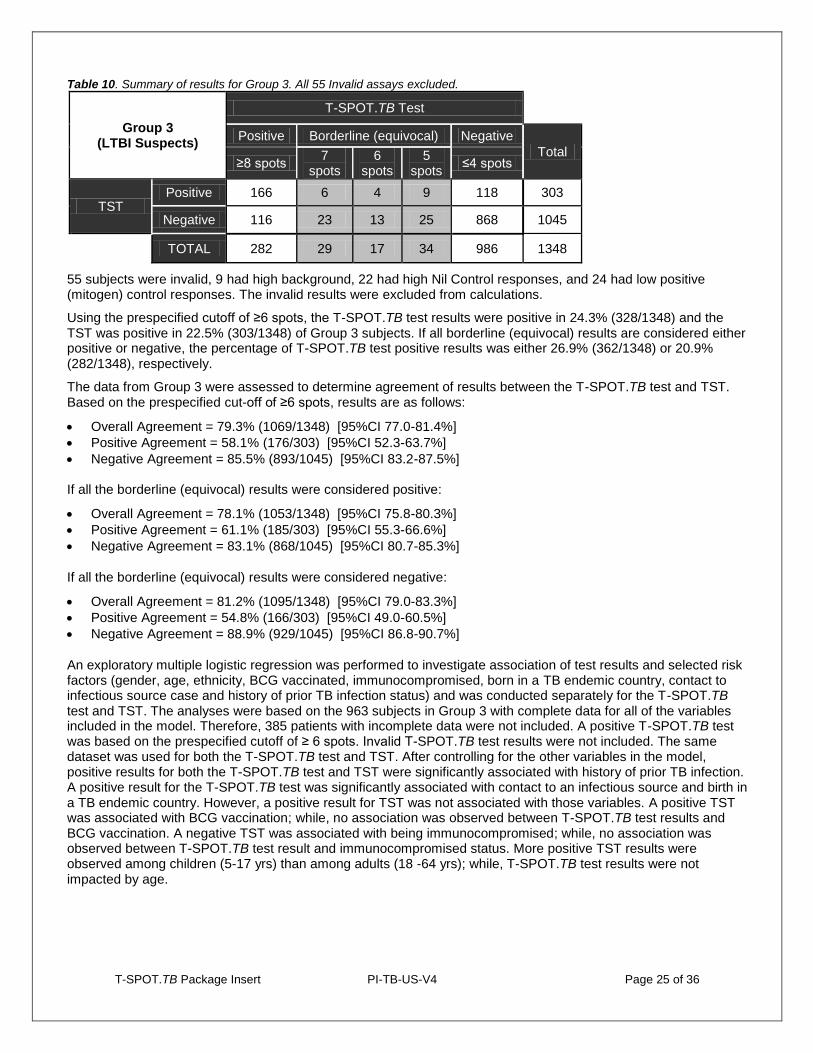
Table 10. Summary of results for Group 3. All 55 Invalid assays excluded.
Group 3 (LTBI Suspects)
T-SPOT.TB Test
Positive Borderline (equivocal) Negative
Total ≥8 spots
7 spots
6 spots
5 spots
≤4 spots
TST Positive 166 6 4 9 118 303
Negative 116 23 13 25 868 1045
TOTAL 282 29 17 34 986 1348
55 subjects were invalid, 9 had high background, 22 had high Nil Control responses, and 24 had low positive (mitogen) control responses. The invalid results were excluded from calculations.
Using the prespecified cutoff of ≥6 spots, the T-SPOT.TB test results were positive in 24.3% (328/1348) and the TST was positive in 22.5% (303/1348) of Group 3 subjects. If all borderline (equivocal) results are considered either positive or negative, the percentage of T-SPOT.TB test positive results was either 26.9% (362/1348) or 20.9% (282/1348), respectively.
The data from Group 3 were assessed to determine agreement of results between the T-SPOT.TB test and TST. Based on the prespecified cut-off of ≥6 spots, results are as follows:
Overall Agreement = 79.3% (1069/1348) [95%CI 77.0-81.4%]
Positive Agreement = 58.1% (176/303) [95%CI 52.3-63.7%]
Negative Agreement = 85.5% (893/1045) [95%CI 83.2-87.5%] If all the borderline (equivocal) results were considered positive:
Overall Agreement = 78.1% (1053/1348) [95%CI 75.8-80.3%]
Positive Agreement = 61.1% (185/303) [95%CI 55.3-66.6%]
Negative Agreement = 83.1% (868/1045) [95%CI 80.7-85.3%]
If all the borderline (equivocal) results were considered negative:
Overall Agreement = 81.2% (1095/1348) [95%CI 79.0-83.3%]
Positive Agreement = 54.8% (166/303) [95%CI 49.0-60.5%]
Negative Agreement = 88.9% (929/1045) [95%CI 86.8-90.7%]
An exploratory multiple logistic regression was performed to investigate association of test results and selected risk factors (gender, age, ethnicity, BCG vaccinated, immunocompromised, born in a TB endemic country, contact to infectious source case and history of prior TB infection status) and was conducted separately for the T-SPOT.TB test and TST. The analyses were based on the 963 subjects in Group 3 with complete data for all of the variables included in the model. Therefore, 385 patients with incomplete data were not included. A positive T-SPOT.TB test was based on the prespecified cutoff of ≥ 6 spots. Invalid T-SPOT.TB test results were not included. The same dataset was used for both the T-SPOT.TB test and TST. After controlling for the other variables in the model, positive results for both the T-SPOT.TB test and TST were significantly associated with history of prior TB infection. A positive result for the T-SPOT.TB test was significantly associated with contact to an infectious source and birth in a TB endemic country. However, a positive result for TST was not associated with those variables. A positive TST was associated with BCG vaccination; while, no association was observed between T-SPOT.TB test results and BCG vaccination. A negative TST was associated with being immunocompromised; while, no association was observed between T-SPOT.TB test result and immunocompromised status. More positive TST results were observed among children (5-17 yrs) than among adults (18 -64 yrs); while, T-SPOT.TB test results were not impacted by age.
T-SPOT.TB Package Insert PI-TB-US-V4 Page 26 of 36
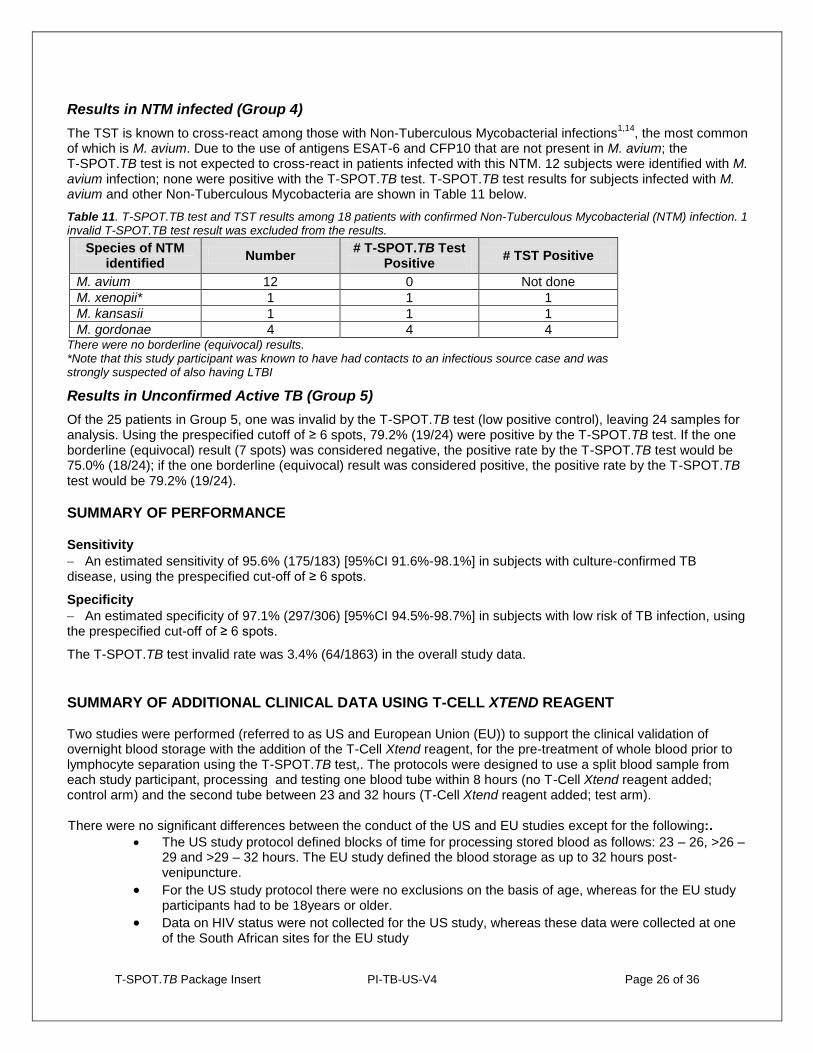
Results in NTM infected (Group 4)
The TST is known to cross-react among those with Non-Tuberculous Mycobacterial infections1,14
, the most common of which is M. avium. Due to the use of antigens ESAT-6 and CFP10 that are not present in M. avium; the T-SPOT.TB test is not expected to cross-react in patients infected with this NTM. 12 subjects were identified with M. avium infection; none were positive with the T-SPOT.TB test. T-SPOT.TB test results for subjects infected with M. avium and other Non-Tuberculous Mycobacteria are shown in Table 11 below.
Table 11. T-SPOT.TB test and TST results among 18 patients with confirmed Non-Tuberculous Mycobacterial (NTM) infection. 1 invalid T-SPOT.TB test result was excluded from the results.
Species of NTM identified
Number # T-SPOT.TB Test
Positive # TST Positive
M. avium 12 0 Not done
M. xenopii* 1 1 1
M. kansasii 1 1 1
M. gordonae 4 4 4 There were no borderline (equivocal) results. *Note that this study participant was known to have had contacts to an infectious source case and was strongly suspected of also having LTBI
Results in Unconfirmed Active TB (Group 5)
Of the 25 patients in Group 5, one was invalid by the T-SPOT.TB test (low positive control), leaving 24 samples for analysis. Using the prespecified cutoff of ≥ 6 spots, 79.2% (19/24) were positive by the T-SPOT.TB test. If the one borderline (equivocal) result (7 spots) was considered negative, the positive rate by the T-SPOT.TB test would be 75.0% (18/24); if the one borderline (equivocal) result was considered positive, the positive rate by the T-SPOT.TB test would be 79.2% (19/24).
SUMMARY OF PERFORMANCE
Sensitivity
An estimated sensitivity of 95.6% (175/183) [95%CI 91.6%-98.1%] in subjects with culture-confirmed TB disease, using the prespecified cut-off of ≥ 6 spots.
Specificity
An estimated specificity of 97.1% (297/306) [95%CI 94.5%-98.7%] in subjects with low risk of TB infection, using the prespecified cut-off of ≥ 6 spots.
The T-SPOT.TB test invalid rate was 3.4% (64/1863) in the overall study data.
SUMMARY OF ADDITIONAL CLINICAL DATA USING T-CELL XTEND REAGENT Two studies were performed (referred to as US and European Union (EU)) to support the clinical validation of overnight blood storage with the addition of the T-Cell Xtend reagent, for the pre-treatment of whole blood prior to lymphocyte separation using the T-SPOT.TB test,. The protocols were designed to use a split blood sample from each study participant, processing and testing one blood tube within 8 hours (no T-Cell Xtend reagent added; control arm) and the second tube between 23 and 32 hours (T-Cell Xtend reagent added; test arm). There were no significant differences between the conduct of the US and EU studies except for the following:.
The US study protocol defined blocks of time for processing stored blood as follows: 23 – 26, >26 – 29 and >29 – 32 hours. The EU study defined the blood storage as up to 32 hours post-venipuncture.
For the US study protocol there were no exclusions on the basis of age, whereas for the EU study participants had to be 18years or older.
Data on HIV status were not collected for the US study, whereas these data were collected at one of the South African sites for the EU study
T-SPOT.TB Package Insert PI-TB-US-V4 Page 27 of 36
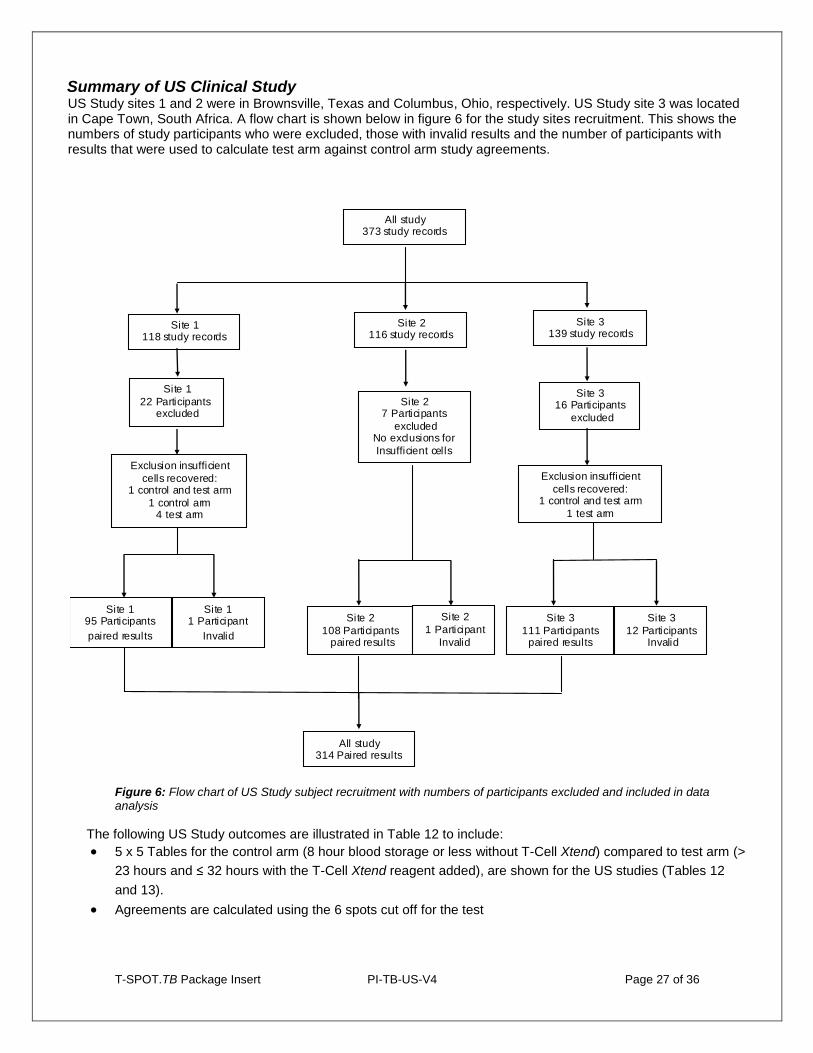
Summary of US Clinical Study US Study sites 1 and 2 were in Brownsville, Texas and Columbus, Ohio, respectively. US Study site 3 was located in Cape Town, South Africa. A flow chart is shown below in figure 6 for the study sites recruitment. This shows the numbers of study participants who were excluded, those with invalid results and the number of participants with results that were used to calculate test arm against control arm study agreements.
All study 373 study records
Site 1
22 Participants excluded
Site 2 116 study records
Site 3 139 study records
Site 2 7 Participants
excluded No exclusions for
Insufficient cells
Site 1 118 study records
Site 3 16 Participants
excluded
Site 3
12 Participants Invalid
Site 3
111 Participants paired results
Site 2
108 Participants paired results
Site 2
1 Participant
Invalid
Site 1 95 Participants
paired results
Site 1 1 Participant
Invalid
All study 314 Paired results
Exclusion insufficient
cells recovered: 1 control and test arm
1 test arm
Exclusion insufficient
cells recovered: 1 control and test arm
1 control arm 4 test arm
Figure 6: Flow chart of US Study subject recruitment with numbers of participants excluded and included in data analysis
The following US Study outcomes are illustrated in Table 12 to include:
5 x 5 Tables for the control arm (8 hour blood storage or less without T-Cell Xtend) compared to test arm (>
23 hours and ≤ 32 hours with the T-Cell Xtend reagent added), are shown for the US studies (Tables 12
and 13).
Agreements are calculated using the 6 spots cut off for the test
T-SPOT.TB Package Insert PI-TB-US-V4 Page 28 of 36
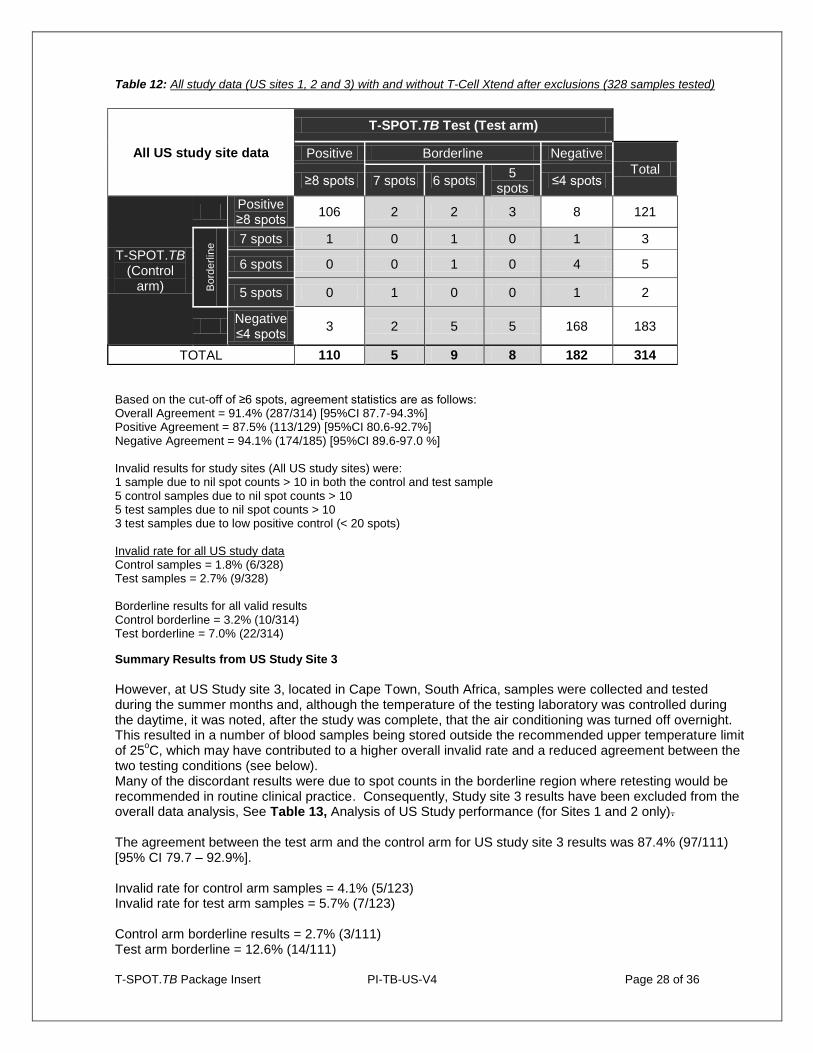
Table 12: All study data (US sites 1, 2 and 3) with and without T-Cell Xtend after exclusions (328 samples tested)
Based on the cut-off of ≥6 spots, agreement statistics are as follows: Overall Agreement = 91.4% (287/314) [95%CI 87.7-94.3%] Positive Agreement = 87.5% (113/129) [95%CI 80.6-92.7%] Negative Agreement = 94.1% (174/185) [95%CI 89.6-97.0 %] Invalid results for study sites (All US study sites) were: 1 sample due to nil spot counts > 10 in both the control and test sample 5 control samples due to nil spot counts > 10 5 test samples due to nil spot counts > 10 3 test samples due to low positive control (< 20 spots) Invalid rate for all US study data Control samples = 1.8% (6/328) Test samples = 2.7% (9/328) Borderline results for all valid results Control borderline = 3.2% (10/314) Test borderline = 7.0% (22/314)
Summary Results from US Study Site 3
However, at US Study site 3, located in Cape Town, South Africa, samples were collected and tested during the summer months and, although the temperature of the testing laboratory was controlled during the daytime, it was noted, after the study was complete, that the air conditioning was turned off overnight. This resulted in a number of blood samples being stored outside the recommended upper temperature limit of 25
oC, which may have contributed to a higher overall invalid rate and a reduced agreement between the
two testing conditions (see below). Many of the discordant results were due to spot counts in the borderline region where retesting would be recommended in routine clinical practice. Consequently, Study site 3 results have been excluded from the overall data analysis, See Table 13, Analysis of US Study performance (for Sites 1 and 2 only). The agreement between the test arm and the control arm for US study site 3 results was 87.4% (97/111) [95% CI 79.7 – 92.9%]. Invalid rate for control arm samples = 4.1% (5/123) Invalid rate for test arm samples = 5.7% (7/123) Control arm borderline results = 2.7% (3/111) Test arm borderline = 12.6% (14/111)
All US study site data
T-SPOT.TB Test (Test arm)
Positive Borderline Negative
Total ≥8 spots 7 spots 6 spots
5 spots
≤4 spots
T-SPOT.TB (Control
arm)
Positive ≥8 spots
106 2 2 3 8 121 B
ord
erlin
e 7 spots 1 0 1 0 1 3
6 spots 0 0 1 0 4 5
5 spots 0 1 0 0 1 2
Negative ≤4 spots
3 2 5 5 168 183
TOTAL 110 5 9 8 182 314
T-SPOT.TB Package Insert PI-TB-US-V4 Page 29 of 36
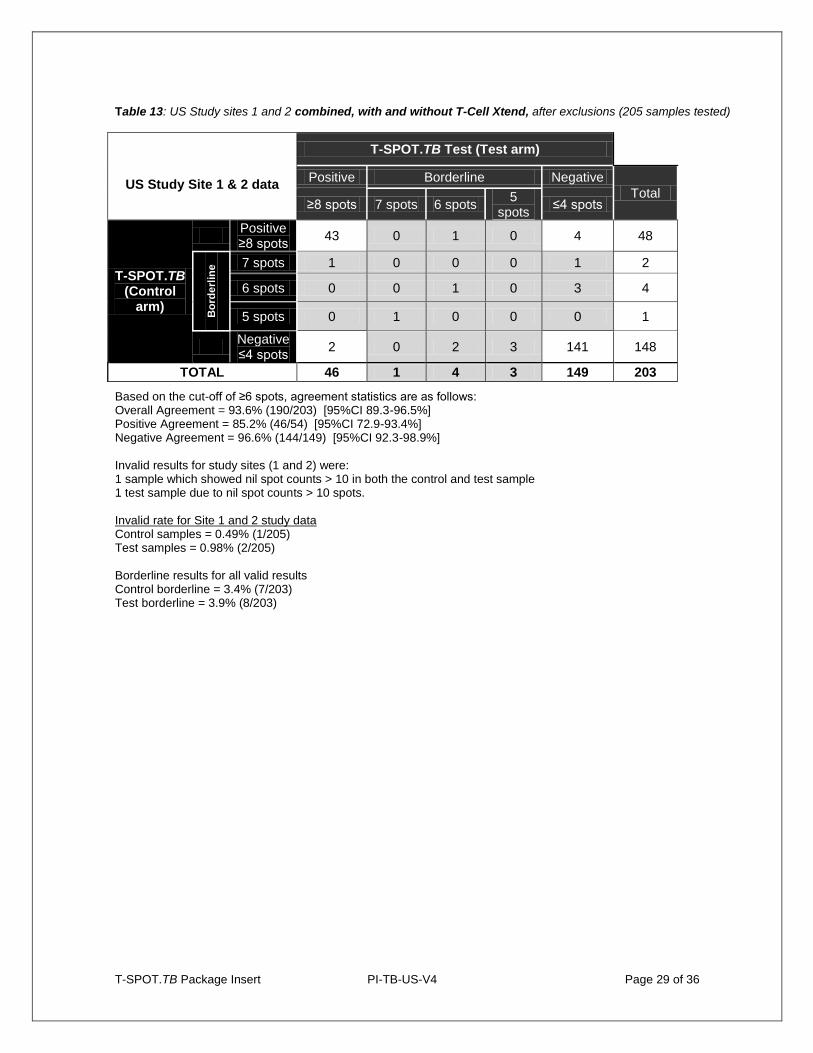
Table 13: US Study sites 1 and 2 combined, with and without T-Cell Xtend, after exclusions (205 samples tested)
Based on the cut-off of ≥6 spots, agreement statistics are as follows: Overall Agreement = 93.6% (190/203) [95%CI 89.3-96.5%] Positive Agreement = 85.2% (46/54) [95%CI 72.9-93.4%] Negative Agreement = 96.6% (144/149) [95%CI 92.3-98.9%] Invalid results for study sites (1 and 2) were: 1 sample which showed nil spot counts > 10 in both the control and test sample 1 test sample due to nil spot counts > 10 spots. Invalid rate for Site 1 and 2 study data Control samples = 0.49% (1/205) Test samples = 0.98% (2/205) Borderline results for all valid results Control borderline = 3.4% (7/203) Test borderline = 3.9% (8/203)
US Study Site 1 & 2 data
T-SPOT.TB Test (Test arm)
Positive Borderline Negative
Total ≥8 spots 7 spots 6 spots
5 spots
≤4 spots
T-SPOT.TB (Control
arm)
Positive ≥8 spots
43 0 1 0 4 48
Bo
rde
rlin
e 7 spots 1 0 0 0 1 2
6 spots 0 0 1 0 3 4
5 spots 0 1 0 0 0 1
Negative ≤4 spots
2 0 2 3 141 148
TOTAL 46 1 4 3 149 203
T-SPOT.TB Package Insert PI-TB-US-V4 Page 30 of 36
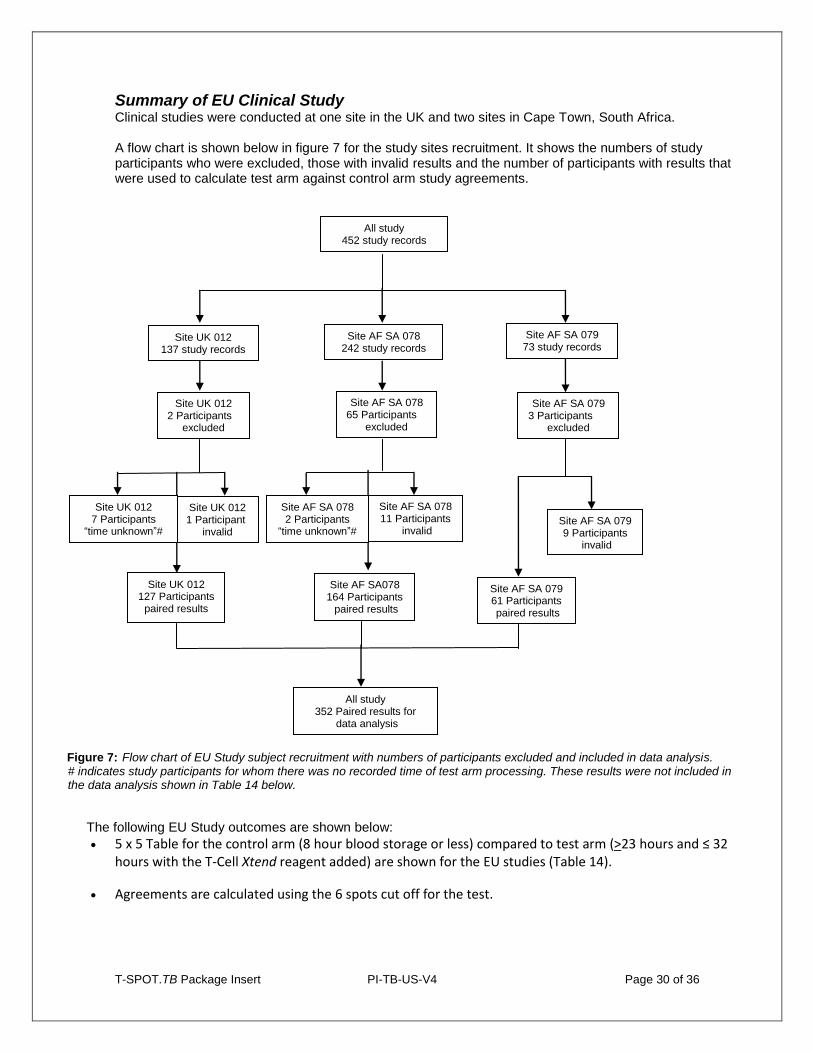
Summary of EU Clinical Study Clinical studies were conducted at one site in the UK and two sites in Cape Town, South Africa. A flow chart is shown below in figure 7 for the study sites recruitment. It shows the numbers of study participants who were excluded, those with invalid results and the number of participants with results that were used to calculate test arm against control arm study agreements.
Figure 7: Flow chart of EU Study subject recruitment with numbers of participants excluded and included in data analysis. # indicates study participants for whom there was no recorded time of test arm processing. These results were not included in the data analysis shown in Table 14 below.
The following EU Study outcomes are shown below:
5 x 5 Table for the control arm (8 hour blood storage or less) compared to test arm (>23 hours and ≤ 32 hours with the T-Cell Xtend reagent added) are shown for the EU studies (Table 14).
Agreements are calculated using the 6 spots cut off for the test.
All study
452 study records
All study 352 Paired results for
data analysis
Site UK 012 137 study records
Site AF SA 078 242 study records
Site AF SA 079 73 study records
Site UK 012 2 Participants
excluded
Site AF SA 078 65 Participants
excluded
Site AF SA 079 3 Participants
excluded
Site UK 012 127 Participants
paired results
Site AF SA078 164 Participants paired results
Site AF SA 079 61 Participants paired results
Site UK 012 1 Participant
invalid
Site AF SA 078 11 Participants
invalid
Site AF SA 079 9 Participants
invalid
Site UK 012 7 Participants
“time unknown”#
Site AF SA 078 2 Participants
“time unknown”#
T-SPOT.TB Package Insert PI-TB-US-V4 Page 31 of 36
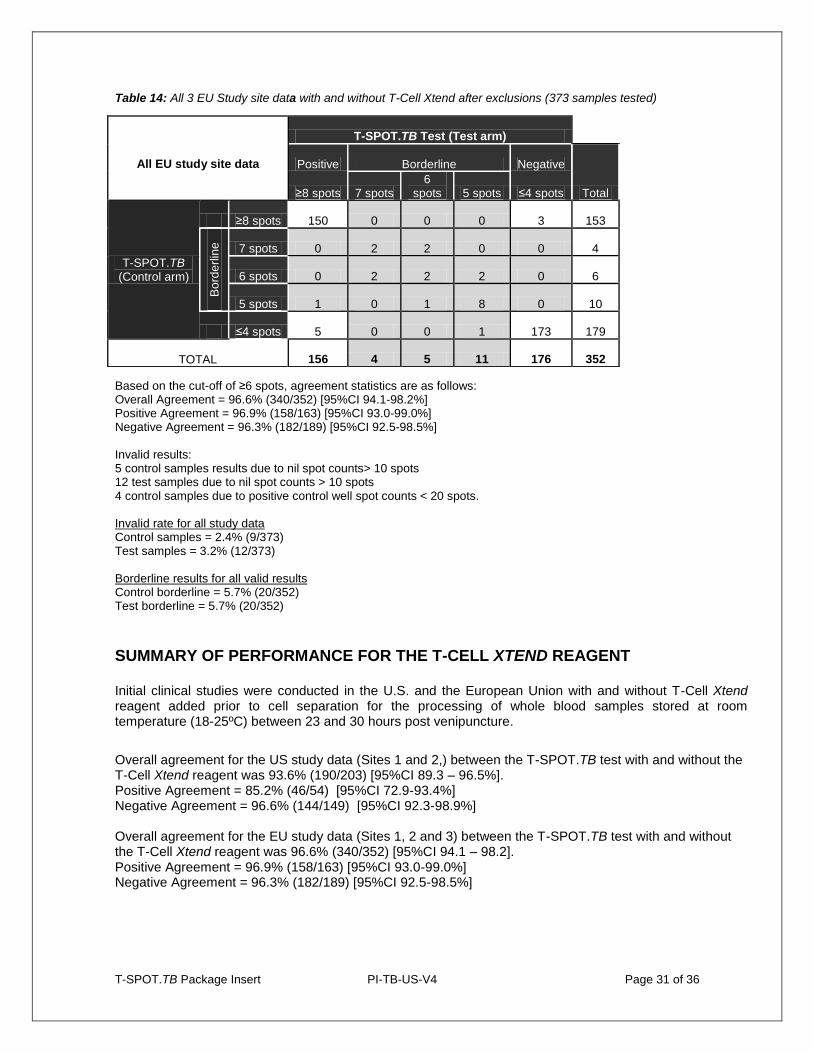
Table 14: All 3 EU Study site data with and without T-Cell Xtend after exclusions (373 samples tested)
Based on the cut-off of ≥6 spots, agreement statistics are as follows: Overall Agreement = 96.6% (340/352) [95%CI 94.1-98.2%] Positive Agreement = 96.9% (158/163) [95%CI 93.0-99.0%] Negative Agreement = 96.3% (182/189) [95%CI 92.5-98.5%] Invalid results: 5 control samples results due to nil spot counts> 10 spots 12 test samples due to nil spot counts > 10 spots 4 control samples due to positive control well spot counts < 20 spots. Invalid rate for all study data Control samples = 2.4% (9/373) Test samples = 3.2% (12/373) Borderline results for all valid results Control borderline = 5.7% (20/352) Test borderline = 5.7% (20/352)
SUMMARY OF PERFORMANCE FOR THE T-CELL XTEND REAGENT Initial clinical studies were conducted in the U.S. and the European Union with and without T-Cell Xtend reagent added prior to cell separation for the processing of whole blood samples stored at room temperature (18-25ºC) between 23 and 30 hours post venipuncture.
Overall agreement for the US study data (Sites 1 and 2,) between the T-SPOT.TB test with and without the T-Cell Xtend reagent was 93.6% (190/203) [95%CI 89.3 – 96.5%]. Positive Agreement = 85.2% (46/54) [95%CI 72.9-93.4%] Negative Agreement = 96.6% (144/149) [95%CI 92.3-98.9%] Overall agreement for the EU study data (Sites 1, 2 and 3) between the T-SPOT.TB test with and without the T-Cell Xtend reagent was 96.6% (340/352) [95%CI 94.1 – 98.2]. Positive Agreement = 96.9% (158/163) [95%CI 93.0-99.0%] Negative Agreement = 96.3% (182/189) [95%CI 92.5-98.5%]
T-SPOT.TB Test (Test arm)
All EU study site data Positive Borderline Negative
Total ≥8 spots 7 spots 6
spots 5 spots ≤4 spots
T-SPOT.TB (Control arm)
≥8 spots 150 0 0 0 3 153 B
ord
erlin
e
7 spots 0 2 2 0 0 4
6 spots 0 2 2 2 0 6
5 spots 1 0 1 8 0 10
≤4 spots 5 0 0 1 173 179
TOTAL 156 4 5 11 176 352
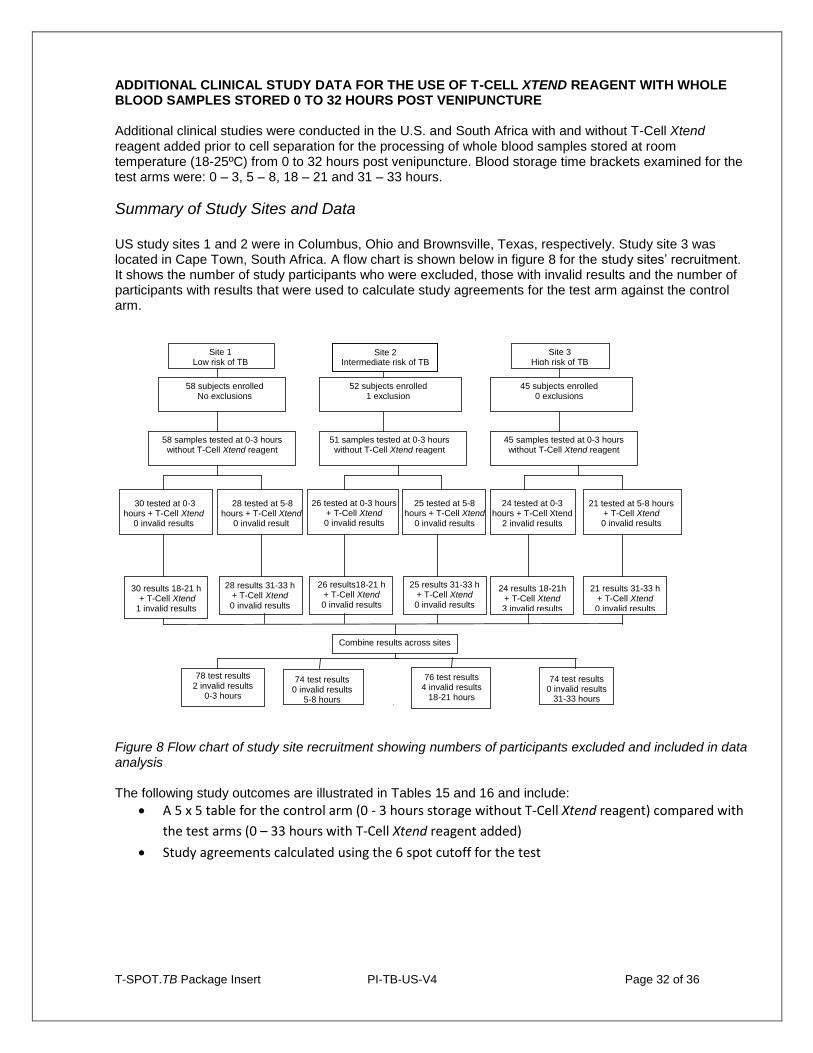
T-SPOT.TB Package Insert PI-TB-US-V4 Page 32 of 36
ADDITIONAL CLINICAL STUDY DATA FOR THE USE OF T-CELL XTEND REAGENT WITH WHOLE BLOOD SAMPLES STORED 0 TO 32 HOURS POST VENIPUNCTURE Additional clinical studies were conducted in the U.S. and South Africa with and without T-Cell Xtend reagent added prior to cell separation for the processing of whole blood samples stored at room temperature (18-25ºC) from 0 to 32 hours post venipuncture. Blood storage time brackets examined for the test arms were: 0 – 3, 5 – 8, 18 – 21 and 31 – 33 hours.
Summary of Study Sites and Data US study sites 1 and 2 were in Columbus, Ohio and Brownsville, Texas, respectively. Study site 3 was located in Cape Town, South Africa. A flow chart is shown below in figure 8 for the study sites’ recruitment. It shows the number of study participants who were excluded, those with invalid results and the number of participants with results that were used to calculate study agreements for the test arm against the control arm.
Figure 8 Flow chart of study site recruitment showing numbers of participants excluded and included in data analysis The following study outcomes are illustrated in Tables 15 and 16 and include:
A 5 x 5 table for the control arm (0 - 3 hours storage without T-Cell Xtend reagent) compared with
the test arms (0 – 33 hours with T-Cell Xtend reagent added)
Study agreements calculated using the 6 spot cutoff for the test
Site 1 Low risk of TB
Site 2 Intermediate risk of TB
Site 3 High risk of TB
58 subjects enrolled No exclusions
52 subjects enrolled 1 exclusion
45 subjects enrolled 0 exclusions
78 test results 2 invalid results
0-3 hours
58 samples tested at 0-3 hours without T-Cell Xtend reagent
51 samples tested at 0-3 hours without T-Cell Xtend reagent
45 samples tested at 0-3 hours without T-Cell Xtend reagent
30 tested at 0-3 hours + T-Cell Xtend
0 invalid results
26 tested at 0-3 hours + T-Cell Xtend 0 invalid results
24 tested at 0-3 hours + T-Cell Xtend
2 invalid results
28 tested at 5-8 hours + T-Cell Xtend
0 invalid result
25 tested at 5-8 hours + T-Cell Xtend
0 invalid results
21 tested at 5-8 hours + T-Cell Xtend 0 invalid results
74 test results 0 invalid results
31-33 hours
30 results 18-21 h + T-Cell Xtend 1 invalid results
26 results18-21 h + T-Cell Xtend 0 invalid results
24 results 18-21h + T-Cell Xtend 3 invalid results
28 results 31-33 h + T-Cell Xtend 0 invalid results
25 results 31-33 h + T-Cell Xtend 0 invalid results
21 results 31-33 h + T-Cell Xtend 0 invalid results
Combine results across sites
74 test results 0 invalid results
5-8 hours
76 test results 4 invalid results
18-21 hours
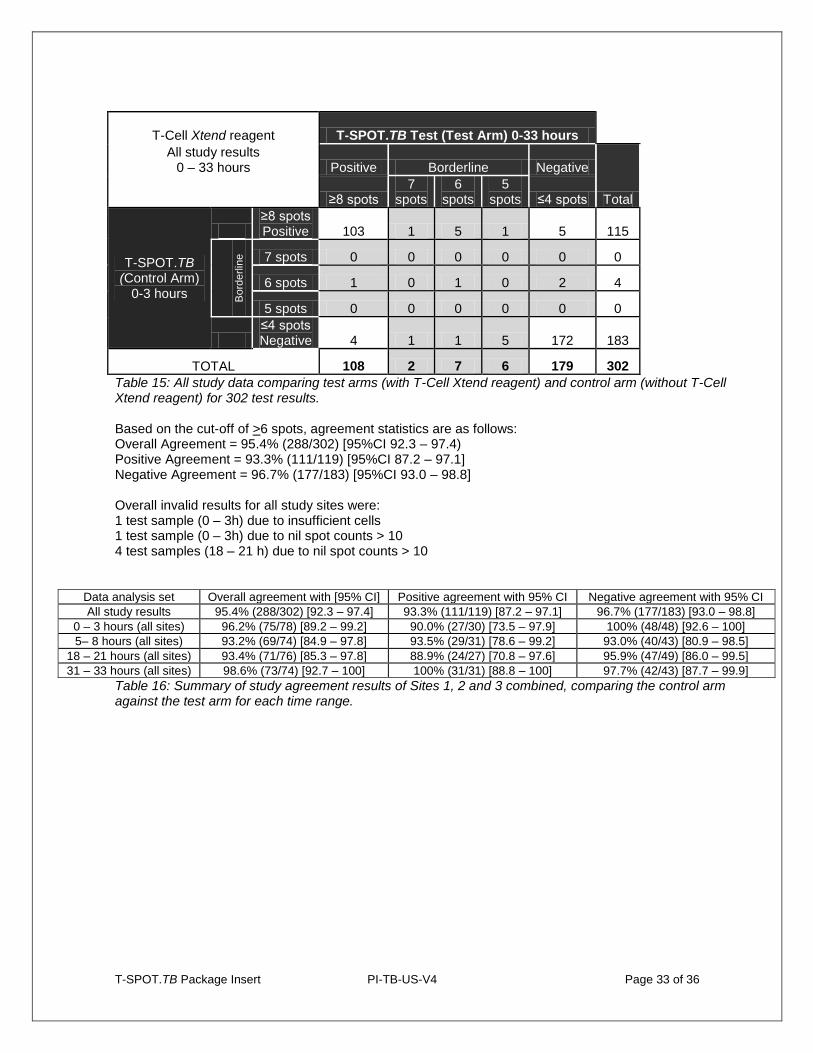
T-SPOT.TB Package Insert PI-TB-US-V4 Page 33 of 36
T-Cell Xtend reagent T-SPOT.TB Test (Test Arm) 0-33 hours
All study results 0 – 33 hours Positive Borderline Negative
Total ≥8 spots 7
spots 6
spots 5
spots ≤4 spots
T-SPOT.TB (Control Arm)
0-3 hours
≥8 spots Positive 103 1 5 1 5 115
Bord
erlin
e
7 spots 0 0 0 0 0 0
6 spots 1 0 1 0 2 4
5 spots 0 0 0 0 0 0
≤4 spots Negative 4 1 1 5 172 183
TOTAL 108 2 7 6 179 302
Table 15: All study data comparing test arms (with T-Cell Xtend reagent) and control arm (without T-Cell Xtend reagent) for 302 test results. Based on the cut-off of >6 spots, agreement statistics are as follows: Overall Agreement = 95.4% (288/302) [95%CI 92.3 – 97.4) Positive Agreement = 93.3% (111/119) [95%CI 87.2 – 97.1] Negative Agreement = 96.7% (177/183) [95%CI 93.0 – 98.8] Overall invalid results for all study sites were: 1 test sample (0 – 3h) due to insufficient cells 1 test sample (0 – 3h) due to nil spot counts > 10 4 test samples (18 – 21 h) due to nil spot counts > 10
Data analysis set Overall agreement with [95% CI] Positive agreement with 95% CI Negative agreement with 95% CI
All study results 95.4% (288/302) [92.3 – 97.4] 93.3% (111/119) [87.2 – 97.1] 96.7% (177/183) [93.0 – 98.8]
0 – 3 hours (all sites) 96.2% (75/78) [89.2 – 99.2] 90.0% (27/30) [73.5 – 97.9] 100% (48/48) [92.6 – 100]
5– 8 hours (all sites) 93.2% (69/74) [84.9 – 97.8] 93.5% (29/31) [78.6 – 99.2] 93.0% (40/43) [80.9 – 98.5]
18 – 21 hours (all sites) 93.4% (71/76) [85.3 – 97.8] 88.9% (24/27) [70.8 – 97.6] 95.9% (47/49) [86.0 – 99.5]
31 – 33 hours (all sites) 98.6% (73/74) [92.7 – 100] 100% (31/31) [88.8 – 100] 97.7% (42/43) [87.7 – 99.9]
Table 16: Summary of study agreement results of Sites 1, 2 and 3 combined, comparing the control arm against the test arm for each time range.
T-SPOT.TB Package Insert PI-TB-US-V4 Page 34 of 36
10. TROUBLESHOOTING
This assay should be performed using the principles of Good Laboratory Practice and by strictly adhering to these Instructions for Use.
Borderline (equivocal) Results
Borderline (equivocal) results are those where the maximum of the two (Panel minus Nil) spot count results are within ±1 spots from the ROC-determined assay cutoff of ≥6 spots. Borderline (equivocal) results, although valid, are less reliable than results where the spot count is further from the cut-off. Retesting of the patient, using a new sample, is therefore recommended. If the result is still Borderline (equivocal) on retesting, then other diagnostic tests and/or epidemiologic information should be used to help determine TB infection status of the patient.
Invalid Results Invalid results are uncommon and may be related to the immune status of the individual being tested
12. They may
also be related to a number of technical factors, potentially resulting in “high background”, “low mitogen”, and “high nil” results such as:
Use of inappropriate blood collection tubes
Storage of blood greater than 8 hours prior to processing without the use of T-Cell Xtend reagent.
Storage of blood outside the recommended temperature range prior to processing blood samples
Contamination of the cell culture media
Incomplete plate washing
Repeating the test using a new patient sample is recommended for invalid results. Technical documents are available covering key troubleshooting points. These are available by contacting Oxford Immunotec.
For Technical Support in the United States contact: 1 – 877 – 20-TSPOT (87768).
11. ABBREVIATIONS & GLOSSARY OF SYMBOLS
ATS American Thoracic Society BCG Bacillus Calmette-Guerin BCIP/NBT 5-bromo, 4-chloro, 3-indoylphosphate/nitroblue tetrazolium CDC Centers for Disease Control and Prevention CFP10 Culture Filtrate Protein CPT Cell Preparation Tubes ELISA Enzyme-Linked Immunosorbent Assay ELISPOT Enzyme-Linked Immnunospot Assay ESAT-6 Early Secretory Antigenic Target FDA Food and Drug Administration IFN-γ Interferon gamma LTBI Latent TB Infection NTM Non Tuberculous Mycobacteria PBMC Peripheral Blood Mononuclear Cells PBS Phosphate Buffered Saline PHA Phytohemagglutinin PPD Purified Protein Derivative (also known as Tuberculin) RCF Relative Centrifugal Force RPM Revolutions per minute TST Tuberculin Skin Test Yrs Years
T-SPOT.TB Package Insert PI-TB-US-V4 Page 35 of 36
12. REFERENCES
1. American Thoracic Society. Diagnostic Standards and Classification of Tuberculosis in Adults and Children. Am J Respir Crit Care Med., 2000; 161: 1376-1395
2. CDC. Targeted Tuberculin Testing and Treatment of Latent Tuberculosis. MMWR weekly, June 09, 2000; 49(RR06): 1 – 54.
3. PMA P010033 supplement number S011. Quantiferon-TB Gold In Tube package insert. Downloaded from www.cellestis.com. Date accessed 5
th March 2008.
4. Andersen P, Munk ME, Pollock JM, Doherty TM. Specific immune- based diagnosis of tuberculosis. Lancet 2000; 356:1099–1104.
5. Behr MA, Wilson MA, Gill WP, et al. Comparative genomics of BCG vaccines by whole-genome DNA microarray. Science 1999; 284:1520–3.
6. Lalvani A. Spotting latent infection: the path to better tuberculosis control. Thorax, 2003; 58(11): 916-918.
7. Arend SM, Geluk A, van Meijgaarden KE, van Dissel JT, Theisen M, Andersen P and Ottenhoff T. Antigenic equivalence of Human T Cell responses to Mycobacterium tuberculosis-specific RD1-encoded protein antigens ESAT-6 and Culture Filtrate Protein 10 and to mixtures of synthetic proteins. Infection and Immunity, 2000; 68(6): 3314-3321.
8. Lalvani A, Pathan AA, McShane H, Wilkinson RJ, Latif M, Conlon CP, Pasvol G and Hill AVS. Rapid detection of Mycobacterium tuberculosis infection by enumeration of antigen-specific T Cells. Am. J. Respir. Crit. Care Med., 2001; 163: 824-828.
9. NCCLS. Performance of single cell immune response assays; approved guideline. NCCLS document I/LA26-A.
10. Meier T, Eulenbruch H-P, Wrighton-Smith P, Enders G and Regnath T. Sensitivity of a new commercial enzyme-linked immunospot assay (T SPOT-TB) for diagnosis of tuberculosis in clinical practice. Eur. J. Clin. Microbiol. Infect. Dis., 2005; 24: 529-536.
11. Köller MD, Kiener HP, Aringer M, Graninger WB, Meuer S, Samstag Y, Smolen JS. Functional and molecular aspects of transient T cell unresponsiveness: role of selective interleukin-2 deficiency. Clin Exp Immunol. 2003 May; 132(2):225-31.
12. NCCLS. Assessment of the Clinical Accuracy of Laboratory Tests Using Receiver Operating Characteristic (ROC) Plots. NCCLS document GP10.
13. Huebner RE, Schein MF and Bass JB Jr. The tuberculin skin test. Clin. Infect. Dis., 1993; 17: 968-975.
14. Huebner RM, Schein M, Hall C and Barnes S. Delayed-type hypersensitivity anergy in human immunodeficiency virus-infected persons screened for infection with Mycobacterium tuberculosis. Clin. Infect. Dis. 1994; 19: 26-32
15. Shankar MS,Aravindan AN, Sohal PM, Kohil HS, Sud K, Gupta KL, Sakhuja V and Jha V. The prevalence of tuberculin sensitivity and anergy in chronic renal failure in an endemic area: tuberculin test and the risk of post-transplant tuberculosis. Nephrol Dial Transplant. 2005; Dec; 20(12): 2720 – 4
16. Fang HC, Chou KJ, Chen CL, Lee PT, Chiou YH, Hung SY and Chung HM. Tuberculin skin test and anergy in dialysis patients of a tuberculosis-endemic area. Nephron. 2002; Aug; 91(4): 682 – 7
17. CDC. Anergy skin testing and tuberculosis preventive therapy for HIV-infected persons: revised recommendations. MMWR. 1997; 46(RR-15): 1 – 10
18. Zuber PL, McKenna MT, Binkin NJ, Onorato IM and Castro KG. Long-term risk of tuberculosis among foreign-born persons in the United States. JAMA, 1997; 278: 304-307.
19. Leung CC, Yam WC, Yew WW, Ho PL, Tam CM, Law WS, Wong MY, Leung M, Tsui D. Comparison of T-Spot.TB and tuberculin skin test among silicotic patients. Eur Respir J. 2007 Oct 24
T-SPOT.TB Package Insert PI-TB-US-V4 Page 36 of 36
13. CONTACT INFORMATION
Oxford Immunotec, Inc 700 Nickerson Road, Suite 200 Marlborough, MA 01752, USA Toll Free: 877-208-7768 (877-20T-SPOT)
Oxford Immunotec Ltd 94C Innovation Drive, Milton Park, Abingdon Oxfordshire, OX14 4RZ, UK Tel: +44 (0) 1235 442796
For product support downloads and further technical information, please visit our website: www.oxfordimmunotec.com T-SPOT, T-Cell Xtend and the Oxford Immunotec logo are trademarks of Oxford Immunotec Limited AIM-V, RPMI and GIBCO are trademarks of Invitrogen CPT and Vacutainer are trademarks of Becton Dickinson Ficoll-Paque is a trademark of GE Health Technologies Tween is a trademark of ICI Americas T-SPOT.TB is protected by the following patents and patents pending : US7575870, US12/510,594, EP941478, JP4094674, AU728357, CA2272881; US7115361; US7632646, EP1144447, JP4633931, ZA2001-3356; US7901898, US8216795; US13/489,621; US6290969, US6338852, US11/801,112, EP1203817, JP2006-034593, AU727602, CA2653566, CN1200147, CZ300953, HU0900047, NO9800883, TR2009/01109, ZA9607394, ZW10496; US5955077, EP0706571, AU682879, CA2165949, NZ267984; US7579141, US8021832, EP1214088, JP4820489, AU773268, CA2372583.
The use of the T-Cell Xtend reagent is protected by the following patents and patents pending; EP2084508; US13/253,598, CN101529221, AU2007-303994, JP2009-530943, IN2165/DELNP/2009, CA2665205. . T-SPOT.TB incorporates patented technology under license from the Statens Serum Institut, Copenhagen, Denmark, and Isis Innovation Limited, Oxford, UK. Revision number: 4 Date of Issue: 20 Mar 13 © Oxford Immunotec Limited, 2013. All rights reserved.