Embed Size (px)
Citation preview
Available online at www.sciencedirect.com
www.elsevier.com/locate/solener
Solar Energy 86 (2012) 3084–3098
Packed-bed thermal storage for concentrated solar power –Pilot-scale demonstration and industrial-scale design
G. Zanganeh a, A. Pedretti c, S. Zavattoni b, M. Barbato b, A. Steinfeld a,d,⇑
a Department of Mechanical and Process Engineering, ETH Zurich, 8092 Zurich, Switzerlandb Department of Innovative Technologies, SUPSI, 6928 Manno, Switzerland
c Airlight Energy Holding SA, 6710 Biasca, Switzerlandd Solar Technology Laboratory, Paul Scherrer Institute, 5232 Villigen PSI, Switzerland
Received 29 March 2012; received in revised form 3 July 2012; accepted 26 July 2012Available online 24 August 2012
Communicated by: Associated editor Yogi Goswami
Abstract
A thermal energy storage system, consisting of a packed bed of rocks as storing material and air as high-temperature heat transferfluid, is analyzed for concentrated solar power (CSP) applications. A 6.5 MWhth pilot-scale thermal storage unit immersed in the groundand of truncated conical shape is fabricated and experimentally demonstrated to generate thermoclines. A dynamic numerical heat trans-fer model is formulated for separate fluid and solid phases and variable thermo-physical properties in the range of 20–650 �C, and val-idated with experimental results. The validated model is further applied to design and simulate an array of two industrial-scale thermalstorage units, each of 7.2 GWhth capacity, for a 26 MWel round-the-clock concentrated solar power plant during multiple 8 h-charging/16h-discharging cycles, yielding 95% overall thermal efficiency.� 2012 Elsevier Ltd. All rights reserved.
Keywords: Packed bed; Solar thermal storage; Concentrated solar power; CSP; Sensible heat; Air
1. Introduction
Thermal energy storage systems for concentrated solarpower (CSP) plants have featured the use of molten salt(DeLaquil et al., 1991; Herrmann and Kearney, 2002),steam (Steinmann and Eck, 2006), and concrete (Tammeet al., 2004) for sensible heat, phase change materials forlatent heat (Watanabe et al., 1993), and reversible reactionsfor thermochemical storage (Gil et al., 2010; Lovegroveet al., 2004; Medrano et al., 2010). Of special interest isthe use of a packed bed of rocks as sensible heat storingmaterial and air as heat transfer fluid (Meier et al., 1991).Such a storage concept can be incorporated in solar powerplants using air as working fluid (Bader et al., 2011). Itsmain advantages are: (1) abundant and economical storing
0038-092X/$ - see front matter � 2012 Elsevier Ltd. All rights reserved.
http://dx.doi.org/10.1016/j.solener.2012.07.019
⇑ Corresponding author.E-mail address: [email protected] (A. Steinfeld).
material; (2) applicability in a wide temperature range, withlimiting temperatures given by the rock’s melting point; (3)direct heat transfer between working fluid and storagematerial; (4) no degradation or chemical instability; (5)no safety concerns, and (6) elimination of chemicals andcorrosive materials. The characteristics of packed bedsfor thermal storage have been applied for food processing(Laguerre et al., 2006), catalytic reactions (Beek, 1962),waste heat recovery (Jalalzadeh-Azar et al., 1996), andlow-temperature seasonal (Hahne, 2000) as well as high-temperature hourly solar energy storage (Meier et al.,1991). Pertinent modeling studies (Beasley and Clark,1984) are mostly based on the original analytic work bySchumann (1929) and include 1D and 2D heat transfermodels with two separate phases (Ismail and Stuginsky,1999), and several models developed for the temperaturerange 60–200 �C using air, water, or oil as working fluid(Gross et al., 1980; Mawire et al., 2009; Sanderson and
Nomenclature
A surface area (m2)Bi Biot number; Bi ¼ hpd=ks (–)cp heat capacity of air at constant pressure (J/kg K)cs heat capacity of the solid (J/kg K)C circumference of dodecagon (m)d rock diameter (m)D diameter (m)E energy (J)f fraction of energy flow (–)fcs compressive stress limit of concrete (N/m2)fs safety factor (–)g gravitational constant; g ¼ 9:81 (m/s2)G mass flow rate per unit cross section (kg/m2s)hf specific enthalpy of fluid (J/kg)hv volumetric convective heat transfer coefficient
(W/m3K)hp Particle convective heat transfer coefficient
(W/m2K)hrv void to void radiative heat transfer coefficient
(W/m2K)hrs solid to solid radiative heat transfer coefficient
(W/m2K)h thickness of concrete (m)H height (m) /specific enthalpy of a control volume
(J m3/kg)k thermal conductivity (W/mK)L length of packed bed in Ergun’s equation (m)_m mass flow rate (kg/s)m bending moment per unit length (Nm/m0)M molecular weight (g/mol)Nu Nusselt number (–)p pressure (Pa)Pe Peclet number; P e ¼ RePr (–)Pr Prandtl number; Pr ¼ cpl=k (–)q Load on circular plate (N/m2)_q heat flux per surface area (W/m2)_Q heat flux (W)r radius (m)R specific gas constant (J/mol K)Re Reynolds number; for packed bed Re ¼ Gd=l, for
cover Re ¼ qDCoveruwind=l (–)S section modulus per unit length (m3/m0)t time (s)T temperature (K) or (�C)u specific internal energy (J/kg)U overall heat transfer coefficient (W/m2 K)
v interstitial fluid velocity (m/s)V volume (m3)W function of c in Pfeffer’s correlation (–)z axial coordinate (m)
Greek letters
a Convective heat transfer coefficient (W/m2 K)b Ratio of the average length between the centers of
two neighboring solids to the mean particle diam-eter (–)
e void fraction (–)� emissivity (–)c function of void fraction in Pfeffer’s correlation/
ratio of the length of solid affected by thermalconductivity to the mean particle diameter (–)
g Efficiency (–)j ratio of solid to fluid thermal conductivity (–)l dynamic viscosity (kg/ms)m Poisson ratio (–)q density (kg/m3)r Stefan–Boltzmann constant (r ¼ 5:6704E � 08
W/m2K4)/stress (N/m2)/ capacity ratio of thestorage unit (–)
/ relative humidity (–) / measure of the effectivethickness of the fluid film (–)
w sphericity (–)x specific humidity (–) / measure of the effective
thickness of the fluid film (–)
Subscripts
1 surroundinga aireff effectivef fluidn spatial increments solidsat saturationw water
Superscripts
t time level
Abbreviations
CSP concentrated solar powerRMS root mean square
G. Zanganeh et al. / Solar Energy 86 (2012) 3084–3098 3085
Cunningham, 1995; Waked, 1986). Fewer studies havedealt with the high-temperature range, including experi-mental tests and modeling of a lab-scale packed bed ofcrushed steatite up to 550 �C (Hanchen et al., 2011;Meier et al., 1991) and of ZrO2 pellets up to 1000 �C(Jalalzadeh-Azar et al., 1996; Nsofor and Adebiyi, 2001).
Recently, a packed bed of 150 � 150 � 150 mm3 Al2O3
bricks with 9 MWh storage capacity was tested using agas burner for charging at 650 �C and discharging at120 �C (Zunft et al., 2011) and simulated using a thermo-mechanical model (Dreissigacker et al., 2010). Most previ-ous simulation models considered temperature-invariant
3086 G. Zanganeh et al. / Solar Energy 86 (2012) 3084–3098
properties of fluid and solid, which introduces uncertaintiesfor wide-range temperature operation.
In this paper, we describe the design, fabrication, andtesting of a pilot-scale packed bed of rocks and its simula-tion by means of a dynamic two-phase heat transfer model.As it will be shown in the analysis, the model incorporatesvariable thermo-physical properties for both fluid and solidphases and, hence, enables good matching between experi-mental and numerical results. The storage tank geometryand practical design aspects are discussed for operatingconditions relevant to large-scale industrial implementa-tion. The validated model is further applied to optimizeand scale-up the design of a thermal storage system foran industrial-size round-the-clock CSP plant and identifythe major sources of irreversibility.
2. Pilot-scale thermal storage design and experimental setup
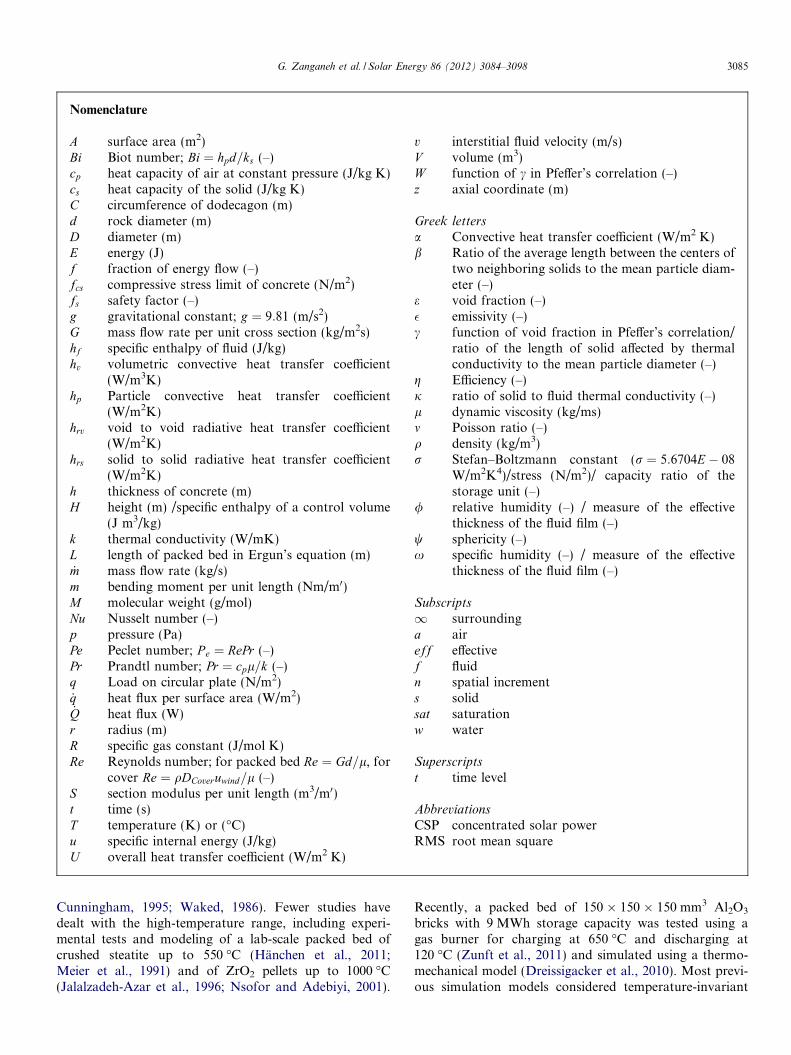
The pilot-scale storage design and experimental setupare shown schematically in Fig. 1. The tank is immersedin the ground and has a truncated cone shape for exploitingthe effect of lateral earth pressure at higher load bearingand for reducing the normal force on the walls during ther-mal expansion of the rocks by guiding them upwards (Langand Huder, 1990). It has a dodecagon cross section, a totalheight of 4 m, and a radius of the inscribed circle thatdecreases from 2 m at the top to 1.25 m at the bottom ata wall inclination of 12�. The tank is made of concretefor avoiding deforming caused by thermal expansion ofthe storing material. The 12 lateral wall segments consistof a 15-mm layer of ultra-high performance concrete onthe packed bed side with high mechanical stability andthermal conductivity and a 235-mm layer of low densityconcrete with low thermal conductivity in order to reducethe thermal losses (Martinola et al., 2010). The thermalproperties of the concrete layers were experimentally deter-
Fig. 1. Scheme of the pilot-scale thermal stor
mined and are presented later. The tank is filled to theheight of 2.9 m with pebbles with an equivalent spherediameter of 2–3 cm. A 400 mm Foamglas� insulation ispacked under the lid. The hot air enters through the inletpipe from the top, flows through the packed bed, and iscollected at the bottom after flowing across a metal gridperforated with 10 mm-dia. holes every 30 mm, which pre-vents congestion of the outlet pipe by the rocks and debriswhile ensuring low resistance to the flow. Charging fromthe top allows the exploitation of the buoyancy effect tocreate and maintain thermal stratification inside the packedbed, the hottest region being at the top. During discharg-ing, the direction of the flow is reversed as cold air is circu-lated through the tank from the bottom.
As it will be shown in the analysis that follows, an addi-tional advantage of the conical shape of the storage tankvis-a-vis a cylindrical shape is the larger storing volumeon top of the tank, where the temperature is highest, lead-ing to a higher volume-to-surface ratio and hence smallerlosses from the lateral walls. The relatively smaller volumeat the bottom, where most of the energy is alreadyextracted from the air, results in lesser necessary storingmaterial.
The temperature is recorded by K-type thermocouples,of which five are located inside the packed bed at differentvertical positions (T1–T5, T6 is not covered with rocks)and at a distance of 10 cm from the lateral walls, as indi-cated in Fig. 1. Two thermocouples measure the tempera-ture just above the packed bed on the tank axis (T8) andin the outlet pipe (T7). The air flow is fed with ambientair aspirated through air filters by a fan coupled to an elec-tric motor and heated in a tubular 58 kW electric heaterbefore entering the storage tank. Additional measurementsinclude: ambient air temperature and relative humidity,flow velocity, and pressure drop in the air flow across thepacked bed.
age configuration and experimental setup.
G. Zanganeh et al. / Solar Energy 86 (2012) 3084–3098 3087
3. Heat transfer model
A quasi-one-dimensional, two-phase heat transfermodel was formulated. The unsteady-state energy equationaccounts for the convective heat transfer between the fluidand the solid phase, and axial dispersion by conductionand radiation through the solid phase. The single rock tem-perature is considered uniform, as justified by Bi� 1 forall relevant operating conditions in this study (Bimax calcu-lated in the respective sections). The fluid flow is assumedplug flow. The pressure and viscous terms are neglected.Temperature-dependent solid and fluid properties are con-sidered for the temperature range of 20–650 �C. Energyconservation for the fluid phase term, see Panton (Panton,2005), after the indicated simplifications, yields:
@ðqf H f Þ@t
þ@ðqf vHf Þ
@z¼ _Q ð1Þ
The first and second terms on the l.h.s. describe thechange in specific enthalpy of the fluid over time and overspace respectively. _Q accounts for the net flux in or out ofthe fluid phase. With the specific enthalpy of a control vol-ume given by Hf ¼ eAhf dz and the mass flow rate given by_m ¼ veAqf and invariant in space, Eq. (1) becomes:
@ðeAqf hf dzÞ@t
þ _m@ðhf dzÞ@z
¼ _Q ð2Þ
The net flux is:
_Q ¼ AhvdZðT s � T f Þ þ U wallCdZðT1 � T f Þ ð3Þ
The first term on the r.h.s. considers the convective heattransfer between the fluid and the solid phases and the sec-ond term the losses through the lateral walls. Additionalterms have to be added to the r.h.s. of Eq. (3) for the lidand the bottom (e.g. first and last layers): U cover;conductive
AcoverðT surface � T 8Þ and Ubottom;conductiveAbottomðT1 � T f ;bottomÞrespectively, which are explained in detail in the followingsection.
Energy conservation for the solid phase yields:
@ðð1� eÞAqsusdzÞ@t
¼ AhvdzðT f � T sÞ þ@
@zðkeff A
@T s
@zÞdz ð4Þ
The l.h.s. comprises the change in internal energy withtime. The first term on the r.h.s. accounts for convectiveheat transfer which is the coupling term between the solidand fluid phases. The second term accounts for axial dis-persion by conduction and radiation.
3.1. Numerical method
Eqs. (2) and (4) are solved for hf and us at the next timestep. For the fluid phase time derivative, the void fractionand area are independent of time and are hence takenout of the derivative. Using a first-order forward differencein time and a first-order backward difference in space, andusing the lagging coefficient method for the fluid density,this becomes:
enAnqtf ;n
htþ1f ;n � ht
f ;n
Dtþ _mt
htf ;n � ht
f ;n�1
Dz¼ Anht
v;nðT ts;n � T t
f ;nÞ þ U twall;nCnðT1 � T t
f ;nÞ ð5Þwhere the subscript n and the superscript t denote the spa-tial and temporal position respectively. Considering the so-lid phase equation, the rock’s density is not varying withtemperature (Somerton, 1992). Since the effective thermalconductivity and the cross sectional area vary with space,the axial dispersion needs to be calculated using the chainrule. With a first-order forward difference in time and back-ward difference in space for the first derivatives and second-order central difference in space for the second derivative,Eq. (4) becomes:
ð1�enÞAnqs
utþ1s;n �ut
s;n
Dt
¼Anhtv;nðT t
f ;n�T ts;nÞþ
kteff ;nAnðT t
s;nþ1�T ts;nÞ�kt
eff ;n�1An�1ðT ts;n�T t
s;n�1ÞDz2
!
ð6Þ
The specific enthalpy of the fluid phase is defined as
hf ¼R T
T refcp;f dT and the internal energy of the solid phase
as us ¼R T
T refcsdT . The temperature dependent heat capacity
for the fluid, cp;f , is a sixth order polynomial fit on literaturevalues between 0 and 650 �C (Incropera et al., 2007), and forthe solid, cs, is a correlation according to Kelley (Kelley,1960) to extrapolate the experimentally measured value atambient temperature as it will be introduced in the follow-ing section. Due to the large variation of the solid heatcapacity with temperature and the large density of the rocks,it is important to implement the internal energy with respectto variable properties. Further, the axial dispersion term hasto be calculated using the chain rule due to varying crosssectional area and effective conductivity. The packed bedis divided in 100 equal layers. Temperature dependent coef-ficients are calculated at every time step and for every layer.
Eqs. (5) and (6) can now be solved explicitly for htþ1f ;n and
utþ1s;n . Using the known correlations for cp;f and cs, the tem-
perature is calculated at every time step and position usinga Newton–Raphson subroutine. The following initial andboundary conditions have to be fulfilled: (1) The initial solidand fluid temperature distributions of the packed bedshould be specified, but do not need to be uniform. (2)The inlet temperature and mass flow rate should be specifiedat all times, but they can be temporally variable. (3) Adia-batic conditions for the fluid phase at the outlet, i.e.@T f ðz¼HÞ
@z ¼ 0. (4) Adiabatic conditions for the solid phase at
the inlet and outlet, i.e. @T sðz¼0Þ@z ¼ @T sðz¼HÞ
@z ¼ 0. Numerical sta-
bility is ensured by the more restrictive Courant–Fried-richs–Lewy condition (Courant et al., 1928) of the fluidand solid phases. According to the von Neumann stabilityanalysis (Anderson, 1995) on the simplified linear and peri-odic Eqs. (5) and (6), with the source terms neglected, thecriteria are: CFL ¼ vDt
Dz < 1 for the fluid phase and
Dt < 12Dz2 ð1�eÞqscs
kefffor the solid phase.
3088 G. Zanganeh et al. / Solar Energy 86 (2012) 3084–3098
3.2. Physical correlations
The thermo-physical properties of air are calculatedusing tabulated data given in literature (Incropera et al.,2007). The mass flow rate is calculated using the air veloc-ity measured by the velocity meter, the pipe cross sectionalarea, and the density of moist air (Moran and Shapiro,2006): qair;moist ¼ qair;dry
1�x1þRw=Rax
, with Rw and Ra the specific
gas constant of water and air respectively. The density ofdry air is calculated using the ideal gas law,qair;dry ¼ p=ðRaT Þ, and the specific humidity using the par-
tial pressure of water vapor: x ¼ MwMa
pwp�pw
, with Mw and
Ma the molecular weight of water and air respectively,the atmospheric pressure, and pw the partial pressure ofwater vapor: P w ¼ /P w;sat. The relative humidity, /, isrecorded during the experimental runs. The water vaporsaturation pressure, P w;sat is given by the extended Antoineequation (Yaws, 1999): log 10(pw,sat/133.32) =A � B/T � C log 10T + DT + ET2, with the coefficients A
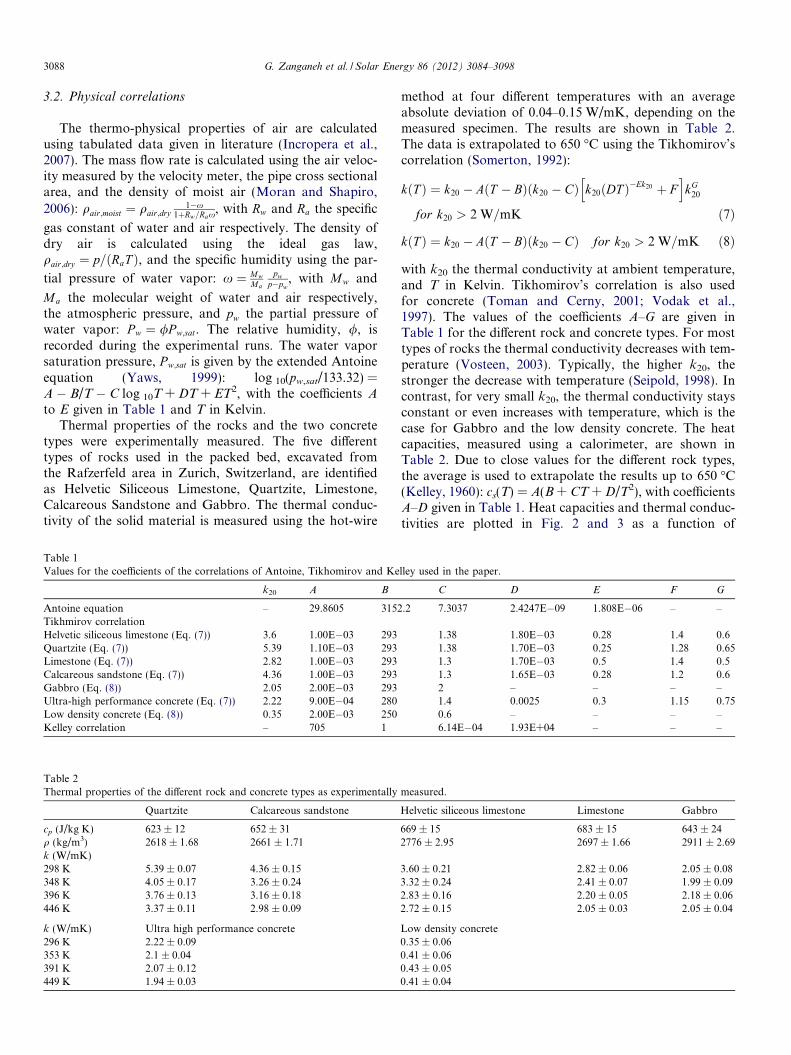
to E given in Table 1 and T in Kelvin.Thermal properties of the rocks and the two concrete
types were experimentally measured. The five differenttypes of rocks used in the packed bed, excavated fromthe Rafzerfeld area in Zurich, Switzerland, are identifiedas Helvetic Siliceous Limestone, Quartzite, Limestone,Calcareous Sandstone and Gabbro. The thermal conduc-tivity of the solid material is measured using the hot-wire
Table 1Values for the coefficients of the correlations of Antoine, Tikhomirov and Ke
k20 A B
Antoine equation – 29.8605 3152Tikhmirov correlationHelvetic siliceous limestone (Eq. (7)) 3.6 1.00E�03 293Quartzite (Eq. (7)) 5.39 1.10E�03 293Limestone (Eq. (7)) 2.82 1.00E�03 293Calcareous sandstone (Eq. (7)) 4.36 1.00E�03 293Gabbro (Eq. (8)) 2.05 2.00E�03 293Ultra-high performance concrete (Eq. (7)) 2.22 9.00E�04 280Low density concrete (Eq. (8)) 0.35 2.00E�03 250Kelley correlation – 705 1
Table 2Thermal properties of the different rock and concrete types as experimentally
Quartzite Calcareous sandstone
cp (J/kg K) 623 ± 12 652 ± 31q (kg/m3) 2618 ± 1.68 2661 ± 1.71k (W/mK)298 K 5.39 ± 0.07 4.36 ± 0.15348 K 4.05 ± 0.17 3.26 ± 0.24396 K 3.76 ± 0.13 3.16 ± 0.18446 K 3.37 ± 0.11 2.98 ± 0.09
k (W/mK) Ultra high performance concrete296 K 2.22 ± 0.09353 K 2.1 ± 0.04391 K 2.07 ± 0.12449 K 1.94 ± 0.03
method at four different temperatures with an averageabsolute deviation of 0.04–0.15 W/mK, depending on themeasured specimen. The results are shown in Table 2.The data is extrapolated to 650 �C using the Tikhomirov’scorrelation (Somerton, 1992):
kðT Þ ¼ k20 � AðT � BÞðk20 � CÞ k20ðDT Þ�Ek20 þ Fh i
kG20
for k20 > 2 W=mK ð7Þ
kðT Þ ¼ k20 � AðT � BÞðk20 � CÞ for k20 > 2 W=mK ð8Þ
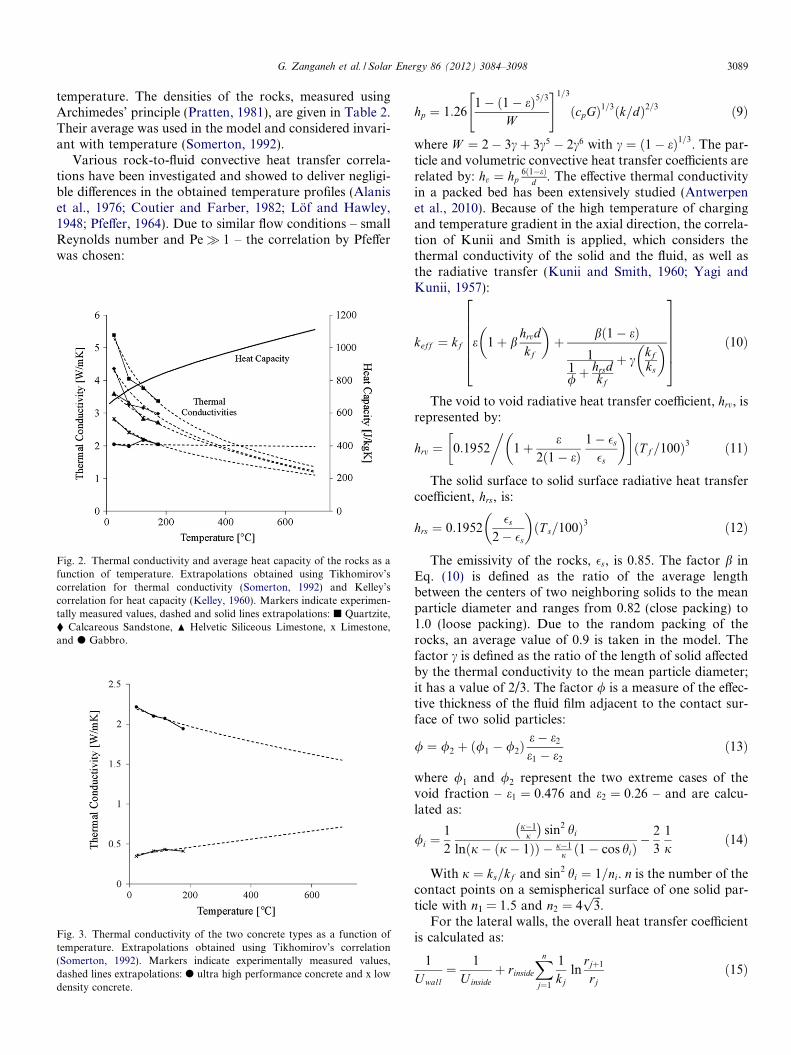
with k20 the thermal conductivity at ambient temperature,and T in Kelvin. Tikhomirov’s correlation is also usedfor concrete (Toman and Cerny, 2001; Vodak et al.,1997). The values of the coefficients A–G are given inTable 1 for the different rock and concrete types. For mosttypes of rocks the thermal conductivity decreases with tem-perature (Vosteen, 2003). Typically, the higher k20, thestronger the decrease with temperature (Seipold, 1998). Incontrast, for very small k20, the thermal conductivity staysconstant or even increases with temperature, which is thecase for Gabbro and the low density concrete. The heatcapacities, measured using a calorimeter, are shown inTable 2. Due to close values for the different rock types,the average is used to extrapolate the results up to 650 �C(Kelley, 1960): cs(T) = A(B + CT + D/T2), with coefficientsA–D given in Table 1. Heat capacities and thermal conduc-tivities are plotted in Fig. 2 and 3 as a function of
lley used in the paper.
C D E F G
.2 7.3037 2.4247E�09 1.808E�06 – –
1.38 1.80E�03 0.28 1.4 0.61.38 1.70E�03 0.25 1.28 0.651.3 1.70E�03 0.5 1.4 0.51.3 1.65E�03 0.28 1.2 0.62 – – – –1.4 0.0025 0.3 1.15 0.750.6 – – – –6.14E�04 1.93E+04 – – –
measured.
Helvetic siliceous limestone Limestone Gabbro
669 ± 15 683 ± 15 643 ± 242776 ± 2.95 2697 ± 1.66 2911 ± 2.69
3.60 ± 0.21 2.82 ± 0.06 2.05 ± 0.083.32 ± 0.24 2.41 ± 0.07 1.99 ± 0.092.83 ± 0.16 2.20 ± 0.05 2.18 ± 0.062.72 ± 0.15 2.05 ± 0.03 2.05 ± 0.04
Low density concrete0.35 ± 0.060.41 ± 0.060.43 ± 0.050.41 ± 0.04
G. Zanganeh et al. / Solar Energy 86 (2012) 3084–3098 3089
temperature. The densities of the rocks, measured usingArchimedes’ principle (Pratten, 1981), are given in Table 2.Their average was used in the model and considered invari-ant with temperature (Somerton, 1992).
Various rock-to-fluid convective heat transfer correla-tions have been investigated and showed to deliver negligi-ble differences in the obtained temperature profiles (Alaniset al., 1976; Coutier and Farber, 1982; Lof and Hawley,1948; Pfeffer, 1964). Due to similar flow conditions – smallReynolds number and Pe� 1 – the correlation by Pfefferwas chosen:
Fig. 2. Thermal conductivity and average heat capacity of the rocks as afunction of temperature. Extrapolations obtained using Tikhomirov’scorrelation for thermal conductivity (Somerton, 1992) and Kelley’scorrelation for heat capacity (Kelley, 1960). Markers indicate experimen-tally measured values, dashed and solid lines extrapolations: j Quartzite,� Calcareous Sandstone, N Helvetic Siliceous Limestone, x Limestone,and d Gabbro.
Fig. 3. Thermal conductivity of the two concrete types as a function oftemperature. Extrapolations obtained using Tikhomirov’s correlation(Somerton, 1992). Markers indicate experimentally measured values,dashed lines extrapolations: d ultra high performance concrete and x lowdensity concrete.
hp ¼ 1:261� ð1� eÞ5=3
W
" #1=3
ðcpGÞ1=3ðk=dÞ2=3 ð9Þ
where W ¼ 2� 3cþ 3c5 � 2c6 with c ¼ ð1� eÞ1=3. The par-ticle and volumetric convective heat transfer coefficients arerelated by: hv ¼ hp
6ð1�eÞd . The effective thermal conductivity
in a packed bed has been extensively studied (Antwerpenet al., 2010). Because of the high temperature of chargingand temperature gradient in the axial direction, the correla-tion of Kunii and Smith is applied, which considers thethermal conductivity of the solid and the fluid, as well asthe radiative transfer (Kunii and Smith, 1960; Yagi andKunii, 1957):
keff ¼ kf e 1þ bhrvdkf
� �þ bð1� eÞ
11/þ
hrsdkf
þ ckf
ks
� �2666664
3777775 ð10Þ
The void to void radiative heat transfer coefficient, hrv, isrepresented by:
hrv ¼ 0:1952 1þ e2ð1� eÞ
1� �s
�s
� ��� �ðT f=100Þ3 ð11Þ
The solid surface to solid surface radiative heat transfercoefficient, hrs, is:
hrs ¼ 0:1952�s
2� �s
� �ðT s=100Þ3 ð12Þ
The emissivity of the rocks, �s, is 0.85. The factor b inEq. (10) is defined as the ratio of the average lengthbetween the centers of two neighboring solids to the meanparticle diameter and ranges from 0.82 (close packing) to1.0 (loose packing). Due to the random packing of therocks, an average value of 0.9 is taken in the model. Thefactor c is defined as the ratio of the length of solid affectedby the thermal conductivity to the mean particle diameter;it has a value of 2/3. The factor / is a measure of the effec-tive thickness of the fluid film adjacent to the contact sur-face of two solid particles:
/ ¼ /2 þ ð/1 � /2Þe� e2
e1 � e2
ð13Þ
where /1 and /2 represent the two extreme cases of thevoid fraction – e1 ¼ 0:476 and e2 ¼ 0:26 – and are calcu-lated as:
/i ¼1
2
j�1j
� �sin2 hi
lnðj� ðj� 1ÞÞ � j�1j ð1� cos hiÞ
� 2
3
1
jð14Þ
With j ¼ ks=kf and sin2 hi ¼ 1=ni. n is the number of thecontact points on a semispherical surface of one solid par-ticle with n1 = 1.5 and n2 ¼ 4
ffiffiffi3p
.For the lateral walls, the overall heat transfer coefficient
is calculated as:
1
Uwall¼ 1
Uinsideþ rinside
Xn
j¼1
1
kjln
rjþ1
rjð15Þ
3090 G. Zanganeh et al. / Solar Energy 86 (2012) 3084–3098
The second term on the r.h.s. considers conductionthrough three layers: ultra-high performance concrete,low density concrete and ground. T1 is assumed after20 cm of depth in the ground, as justified by thermalimages. The wall-film heat transfer coefficient, Uinside, isgiven as:
Uinside ¼ aconvective þ aradiative�conductive ð16ÞWhere aconvective accounts for convective heat transfer
between the fluid and the lateral walls (Beek, 1962):
aconvective ¼kf
dð3:22Re1=3Pr1=3 þ 0:117Re0:8Pr0:4Þ ð17Þ
The second term in Eq. (16) accounts for radiation andconduction heat transfer between the packed bed and thewalls and is obtained using correlations given by Ofuchiand Kunii (Ofuchi and Kunii, 1964) that are similar tothe Eqs. (10)–(14) introduced above. The heat loss throughthe lid is calculated by applying an energy balance on thelid:
_Qcoverloss ¼ _Qconductive ¼ _Qconvective þ _Qradiative � _Qsolar ð18Þ
which states that the energy conducted from the storage tothe lid surface must be equal to the energy loss by convec-tion and radiation to the surrounding under considerationof incoming solar radiation during day time. The conduc-tive term is:
_Qconductive ¼ U cover;conductiveAcoverðT surface � T 8Þ ð19Þ
where Ucover;conductive considers conduction through threelayers: Foamglas� insulation, concrete lid, and 200 mmground that was put on top of the lid to reduce thermallosses. The convective term in Eq. (18) is calculated as:
_Qconvective ¼ aoutsideAcoverðT surface � T ambientÞ ð20Þaoutside is the convective heat transfer at the lid outer
surface under consideration of the wind speed andtemperature of the ambient, both recorded during theexperimental runs:
aoutside ¼NuDka
Dcoverð21Þ
where (Incropera et al., 2007):
Nux ¼ 0:332Re1=2Pr1=3 for Re < 105 ð22ÞNuD ¼ ð0:037Re4=5 � AÞPr1=3 for Re > 105
withA ¼ ð0:037Re45x;critical � 0:664Re
12x;criticalÞ ¼ 871 Rex;critical ¼ 105
ð23Þ
The radiation loss from the cover is calculated as (Siegeland Howell, 2002):
_Qradiative ¼ �groundrAcoverðT 4surface � T 4
skyÞ ð24Þ
with �ground ¼ 0:95. The sky temperature, T sky , is calculatedas (Berdahl and Martin, 1984; Martin and Berdahl, 1984):
T sky ¼ T ambientð0:711þ 0:56ððT dewpoint � 273Þ=100Þ
þ 0:73ððT dewpoint � 273Þ=100Þ2Þ1=4 ð25Þ
with T ambient and T dewpoint in Kelvin. The incoming solarradiation is considered during daytime and is calculatedas:
_Qsolar ¼ _qsolarAcover ð26Þ
with _qsolar ¼ 1000 W=m2. The only unknown, T surface, isobtained at every time step by solving Eq. (18) usingthe Newton–Raphson method, which in turn is used tocalculate the cover losses. Conductive heat transferthrough the bottom concrete layer and 10 cm of groundis considered, after which ambient temperature isassumed.
The pressure drop in the packed bed is calculated usingthe equation given by Ergun (Ergun, 1952) which has beenmodified with a buoyancy term (Anderson, 2003):
Dp ¼ LG2
qdAð1� eÞ2
e3w2
lGdþ B
1� ee3w
!þ qgL
DTT
ð27Þ
The first and second terms in the brackets represent vis-cous and kinetic energy losses respectively. The secondterm considers the pressure difference over the layer dueto temperature difference. It has an augmenting effect onthe pressure drop during charging and a reducing effectduring discharging. A and B are study dependent constantsand w considers the sphericity of the rocks (Ozahi et al.,2008) with unity for a perfect sphere. Published data byMacdonald (Macdonald et al., 1979) for randomly shapedgravel with similar particle size and void fraction as in thisstudy have been taken: A = 217, B = 1.83 and w = 0.6. Eq.(27) is solved for every layer after every time step consider-ing the local flow conditions – separately from Eqs. (5) and(6) – in order to calculate the pressure drop across thepacked bed.
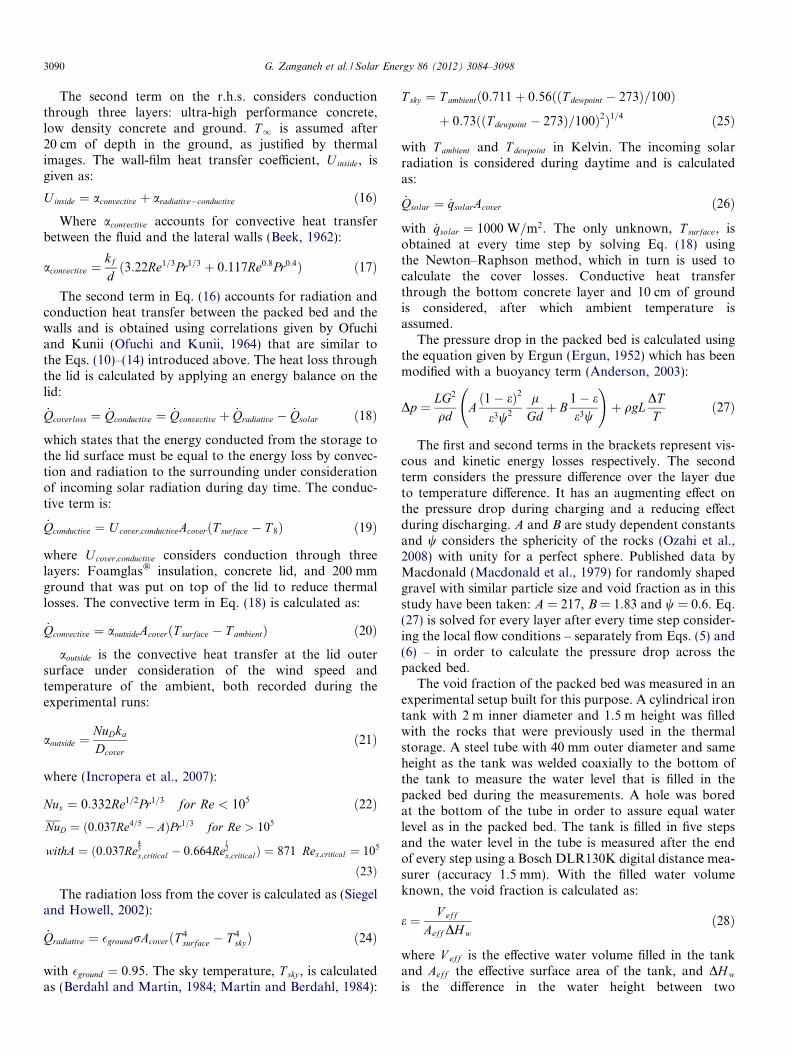
The void fraction of the packed bed was measured in anexperimental setup built for this purpose. A cylindrical irontank with 2 m inner diameter and 1.5 m height was filledwith the rocks that were previously used in the thermalstorage. A steel tube with 40 mm outer diameter and sameheight as the tank was welded coaxially to the bottom ofthe tank to measure the water level that is filled in thepacked bed during the measurements. A hole was boredat the bottom of the tube in order to assure equal waterlevel as in the packed bed. The tank is filled in five stepsand the water level in the tube is measured after the endof every step using a Bosch DLR130K digital distance mea-surer (accuracy 1.5 mm). With the filled water volumeknown, the void fraction is calculated as:
e ¼ V eff
Aeff DH wð28Þ
where V eff is the effective water volume filled in the tankand Aeff the effective surface area of the tank, and DH w
is the difference in the water height between two
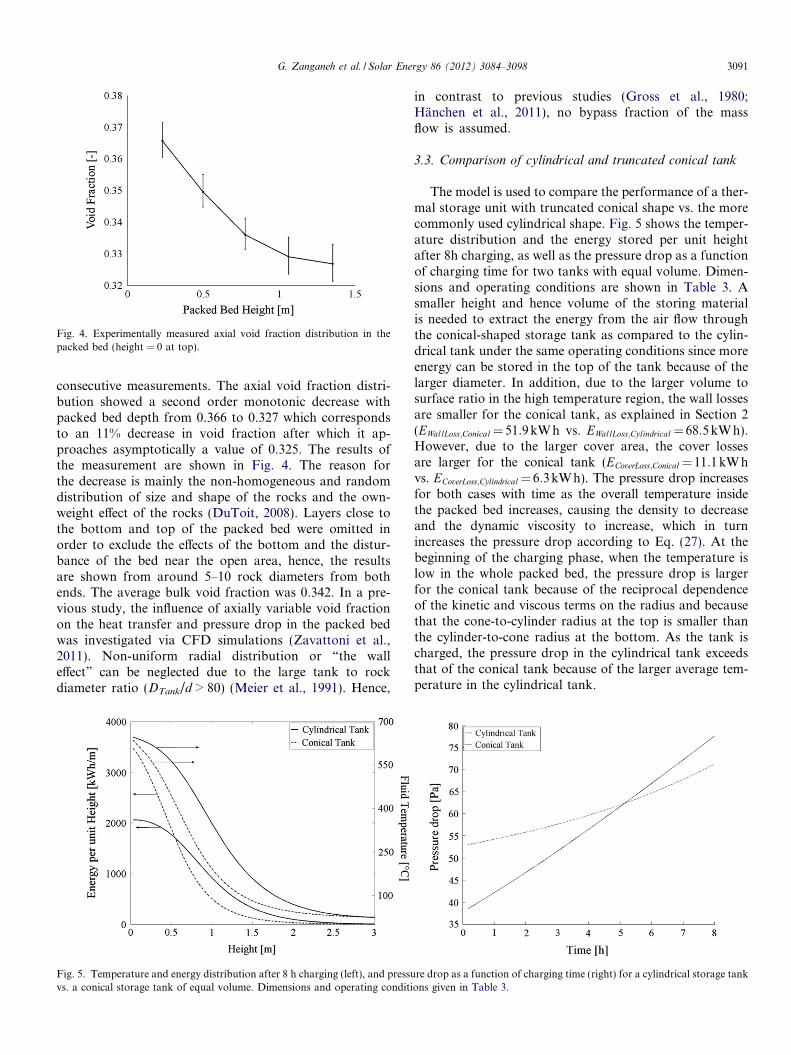
Fig. 4. Experimentally measured axial void fraction distribution in thepacked bed (height = 0 at top).
G. Zanganeh et al. / Solar Energy 86 (2012) 3084–3098 3091
consecutive measurements. The axial void fraction distri-bution showed a second order monotonic decrease withpacked bed depth from 0.366 to 0.327 which correspondsto an 11% decrease in void fraction after which it ap-proaches asymptotically a value of 0.325. The results ofthe measurement are shown in Fig. 4. The reason forthe decrease is mainly the non-homogeneous and randomdistribution of size and shape of the rocks and the own-weight effect of the rocks (DuToit, 2008). Layers close tothe bottom and top of the packed bed were omitted inorder to exclude the effects of the bottom and the distur-bance of the bed near the open area, hence, the resultsare shown from around 5–10 rock diameters from bothends. The average bulk void fraction was 0.342. In a pre-vious study, the influence of axially variable void fractionon the heat transfer and pressure drop in the packed bedwas investigated via CFD simulations (Zavattoni et al.,2011). Non-uniform radial distribution or “the walleffect” can be neglected due to the large tank to rockdiameter ratio (DTank/d > 80) (Meier et al., 1991). Hence,
Fig. 5. Temperature and energy distribution after 8 h charging (left), and pressuvs. a conical storage tank of equal volume. Dimensions and operating conditi
in contrast to previous studies (Gross et al., 1980;Hanchen et al., 2011), no bypass fraction of the massflow is assumed.
3.3. Comparison of cylindrical and truncated conical tank
The model is used to compare the performance of a ther-mal storage unit with truncated conical shape vs. the morecommonly used cylindrical shape. Fig. 5 shows the temper-ature distribution and the energy stored per unit heightafter 8h charging, as well as the pressure drop as a functionof charging time for two tanks with equal volume. Dimen-sions and operating conditions are shown in Table 3. Asmaller height and hence volume of the storing materialis needed to extract the energy from the air flow throughthe conical-shaped storage tank as compared to the cylin-drical tank under the same operating conditions since moreenergy can be stored in the top of the tank because of thelarger diameter. In addition, due to the larger volume tosurface ratio in the high temperature region, the wall lossesare smaller for the conical tank, as explained in Section 2(EWallLoss;Conical¼51:9 kW h vs. EWallLoss;Cylindrical¼68:5 kW h).However, due to the larger cover area, the cover lossesare larger for the conical tank (ECoverLoss;Conical¼11:1 kW hvs. ECoverLoss;Cylindrical¼6:3 kW h). The pressure drop increasesfor both cases with time as the overall temperature insidethe packed bed increases, causing the density to decreaseand the dynamic viscosity to increase, which in turnincreases the pressure drop according to Eq. (27). At thebeginning of the charging phase, when the temperature islow in the whole packed bed, the pressure drop is largerfor the conical tank because of the reciprocal dependenceof the kinetic and viscous terms on the radius and becausethat the cone-to-cylinder radius at the top is smaller thanthe cylinder-to-cone radius at the bottom. As the tank ischarged, the pressure drop in the cylindrical tank exceedsthat of the conical tank because of the larger average tem-perature in the cylindrical tank.
re drop as a function of charging time (right) for a cylindrical storage tankons given in Table 3.
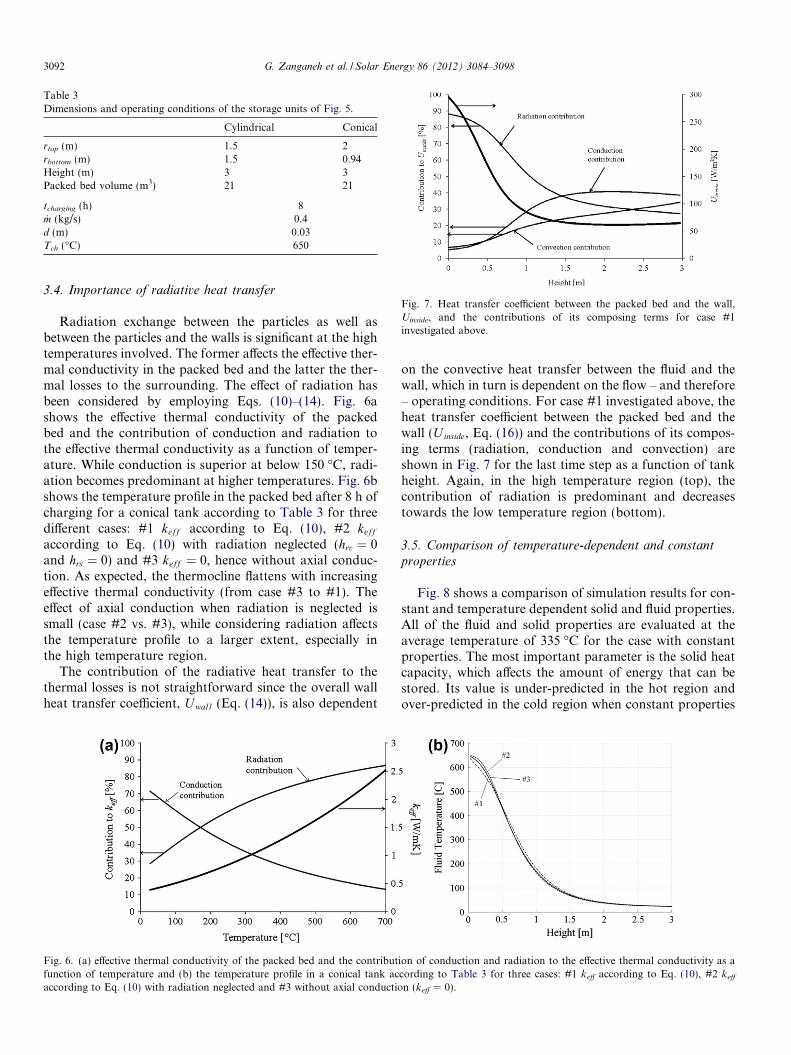
Table 3Dimensions and operating conditions of the storage units of Fig. 5.
Cylindrical Conical
rtop (m) 1.5 2rbottom (m) 1.5 0.94Height (m) 3 3Packed bed volume (m3) 21 21
tcharging (h) 8_m (kg/s) 0.4d (m) 0.03Tch (�C) 650
Fig. 7. Heat transfer coefficient between the packed bed and the wall,Uinside, and the contributions of its composing terms for case #1investigated above.
3092 G. Zanganeh et al. / Solar Energy 86 (2012) 3084–3098
3.4. Importance of radiative heat transfer
Radiation exchange between the particles as well asbetween the particles and the walls is significant at the hightemperatures involved. The former affects the effective ther-mal conductivity in the packed bed and the latter the ther-mal losses to the surrounding. The effect of radiation hasbeen considered by employing Eqs. (10)–(14). Fig. 6ashows the effective thermal conductivity of the packedbed and the contribution of conduction and radiation tothe effective thermal conductivity as a function of temper-ature. While conduction is superior at below 150 �C, radi-ation becomes predominant at higher temperatures. Fig. 6bshows the temperature profile in the packed bed after 8 h ofcharging for a conical tank according to Table 3 for threedifferent cases: #1 keff according to Eq. (10), #2 keff
according to Eq. (10) with radiation neglected (hrv ¼ 0and hrs ¼ 0) and #3 keff ¼ 0, hence without axial conduc-tion. As expected, the thermocline flattens with increasingeffective thermal conductivity (from case #3 to #1). Theeffect of axial conduction when radiation is neglected issmall (case #2 vs. #3), while considering radiation affectsthe temperature profile to a larger extent, especially inthe high temperature region.
The contribution of the radiative heat transfer to thethermal losses is not straightforward since the overall wallheat transfer coefficient, U wall (Eq. (14)), is also dependent
Fig. 6. (a) effective thermal conductivity of the packed bed and the contributfunction of temperature and (b) the temperature profile in a conical tank acaccording to Eq. (10) with radiation neglected and #3 without axial conductio
on the convective heat transfer between the fluid and thewall, which in turn is dependent on the flow – and therefore– operating conditions. For case #1 investigated above, theheat transfer coefficient between the packed bed and thewall (U inside, Eq. (16)) and the contributions of its compos-ing terms (radiation, conduction and convection) areshown in Fig. 7 for the last time step as a function of tankheight. Again, in the high temperature region (top), thecontribution of radiation is predominant and decreasestowards the low temperature region (bottom).
3.5. Comparison of temperature-dependent and constant
properties
Fig. 8 shows a comparison of simulation results for con-stant and temperature dependent solid and fluid properties.All of the fluid and solid properties are evaluated at theaverage temperature of 335 �C for the case with constantproperties. The most important parameter is the solid heatcapacity, which affects the amount of energy that can bestored. Its value is under-predicted in the hot region andover-predicted in the cold region when constant properties
ion of conduction and radiation to the effective thermal conductivity as acording to Table 3 for three cases: #1 keff according to Eq. (10), #2 keff
n (keff = 0).
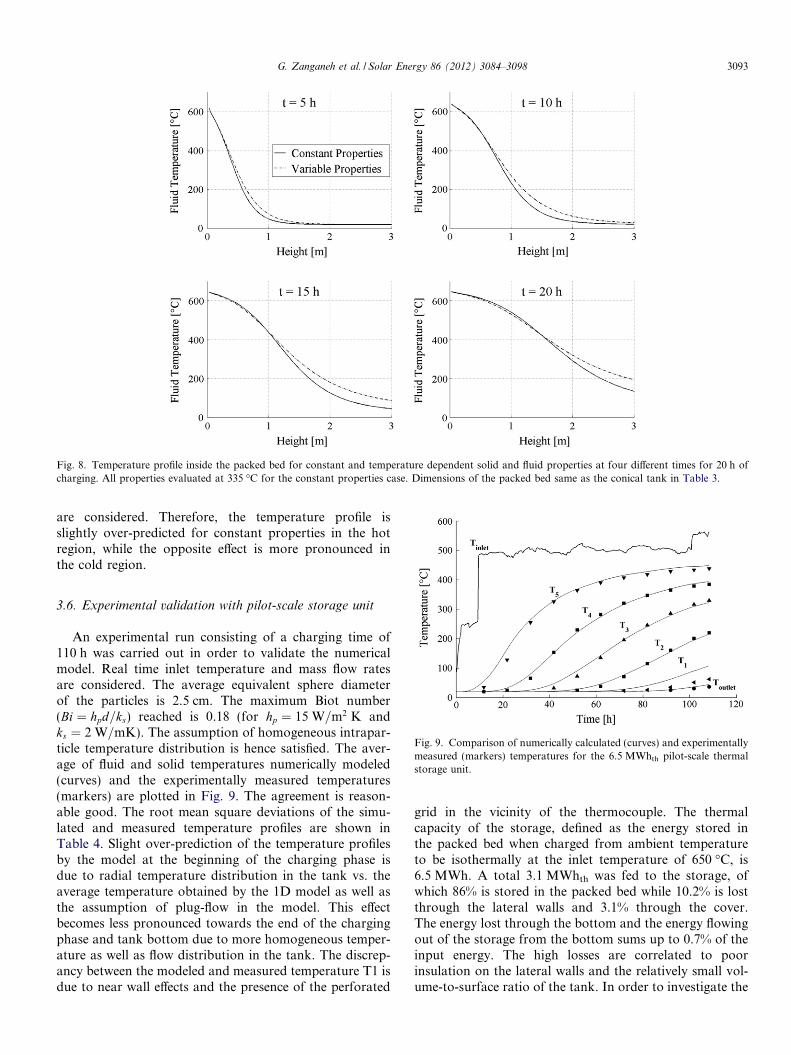
Fig. 8. Temperature profile inside the packed bed for constant and temperature dependent solid and fluid properties at four different times for 20 h ofcharging. All properties evaluated at 335 �C for the constant properties case. Dimensions of the packed bed same as the conical tank in Table 3.
G. Zanganeh et al. / Solar Energy 86 (2012) 3084–3098 3093
are considered. Therefore, the temperature profile isslightly over-predicted for constant properties in the hotregion, while the opposite effect is more pronounced inthe cold region.
Fig. 9. Comparison of numerically calculated (curves) and experimentallymeasured (markers) temperatures for the 6.5 MWhth pilot-scale thermalstorage unit.
3.6. Experimental validation with pilot-scale storage unit
An experimental run consisting of a charging time of110 h was carried out in order to validate the numericalmodel. Real time inlet temperature and mass flow ratesare considered. The average equivalent sphere diameterof the particles is 2.5 cm. The maximum Biot number(Bi ¼ hpd=ks) reached is 0.18 (for hp ¼ 15 W=m2 K andks ¼ 2 W=mK). The assumption of homogeneous intrapar-ticle temperature distribution is hence satisfied. The aver-age of fluid and solid temperatures numerically modeled(curves) and the experimentally measured temperatures(markers) are plotted in Fig. 9. The agreement is reason-able good. The root mean square deviations of the simu-lated and measured temperature profiles are shown inTable 4. Slight over-prediction of the temperature profilesby the model at the beginning of the charging phase isdue to radial temperature distribution in the tank vs. theaverage temperature obtained by the 1D model as well asthe assumption of plug-flow in the model. This effectbecomes less pronounced towards the end of the chargingphase and tank bottom due to more homogeneous temper-ature as well as flow distribution in the tank. The discrep-ancy between the modeled and measured temperature T1 isdue to near wall effects and the presence of the perforated
grid in the vicinity of the thermocouple. The thermalcapacity of the storage, defined as the energy stored inthe packed bed when charged from ambient temperatureto be isothermally at the inlet temperature of 650 �C, is6.5 MWh. A total 3.1 MWhth was fed to the storage, ofwhich 86% is stored in the packed bed while 10.2% is lostthrough the lateral walls and 3.1% through the cover.The energy lost through the bottom and the energy flowingout of the storage from the bottom sums up to 0.7% of theinput energy. The high losses are correlated to poorinsulation on the lateral walls and the relatively small vol-ume-to-surface ratio of the tank. In order to investigate the
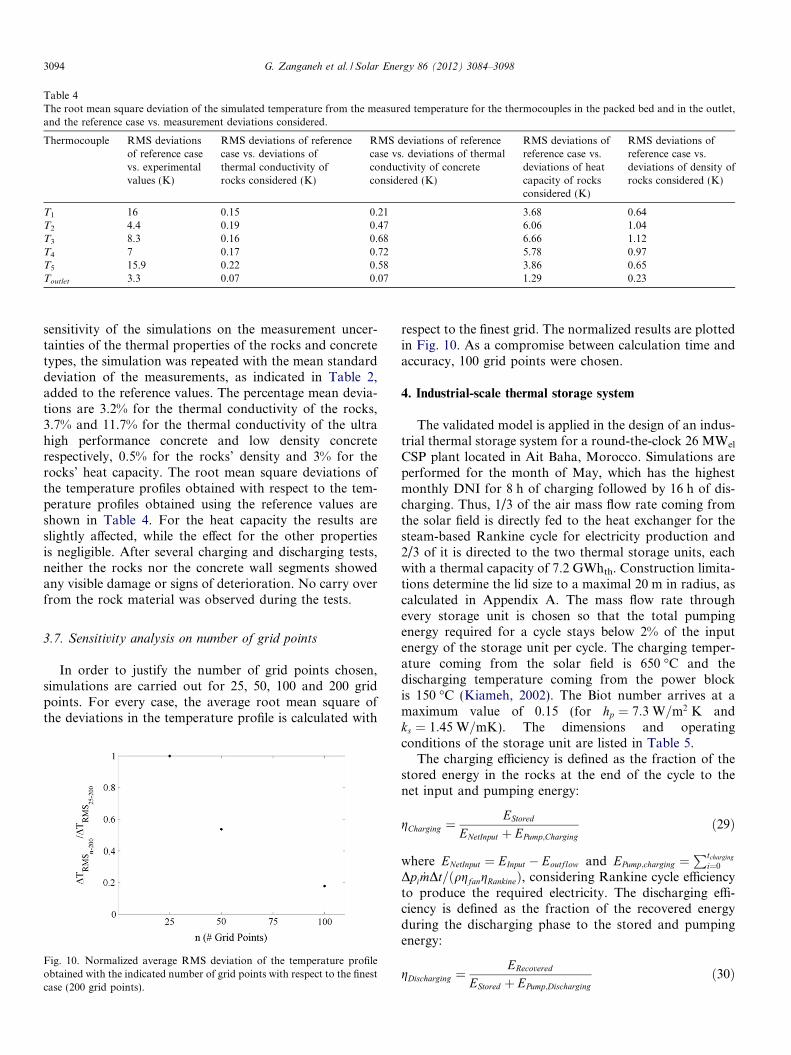
Table 4The root mean square deviation of the simulated temperature from the measured temperature for the thermocouples in the packed bed and in the outlet,and the reference case vs. measurement deviations considered.
Thermocouple RMS deviationsof reference casevs. experimentalvalues (K)
RMS deviations of referencecase vs. deviations ofthermal conductivity ofrocks considered (K)
RMS deviations of referencecase vs. deviations of thermalconductivity of concreteconsidered (K)
RMS deviations ofreference case vs.deviations of heatcapacity of rocksconsidered (K)
RMS deviations ofreference case vs.deviations of density ofrocks considered (K)
T1 16 0.15 0.21 3.68 0.64T2 4.4 0.19 0.47 6.06 1.04T3 8.3 0.16 0.68 6.66 1.12T4 7 0.17 0.72 5.78 0.97T5 15.9 0.22 0.58 3.86 0.65Toutlet 3.3 0.07 0.07 1.29 0.23
3094 G. Zanganeh et al. / Solar Energy 86 (2012) 3084–3098
sensitivity of the simulations on the measurement uncer-tainties of the thermal properties of the rocks and concretetypes, the simulation was repeated with the mean standarddeviation of the measurements, as indicated in Table 2,added to the reference values. The percentage mean devia-tions are 3.2% for the thermal conductivity of the rocks,3.7% and 11.7% for the thermal conductivity of the ultrahigh performance concrete and low density concreterespectively, 0.5% for the rocks’ density and 3% for therocks’ heat capacity. The root mean square deviations ofthe temperature profiles obtained with respect to the tem-perature profiles obtained using the reference values areshown in Table 4. For the heat capacity the results areslightly affected, while the effect for the other propertiesis negligible. After several charging and discharging tests,neither the rocks nor the concrete wall segments showedany visible damage or signs of deterioration. No carry overfrom the rock material was observed during the tests.
3.7. Sensitivity analysis on number of grid points
In order to justify the number of grid points chosen,simulations are carried out for 25, 50, 100 and 200 gridpoints. For every case, the average root mean square ofthe deviations in the temperature profile is calculated with
Fig. 10. Normalized average RMS deviation of the temperature profileobtained with the indicated number of grid points with respect to the finestcase (200 grid points).
respect to the finest grid. The normalized results are plottedin Fig. 10. As a compromise between calculation time andaccuracy, 100 grid points were chosen.
4. Industrial-scale thermal storage system
The validated model is applied in the design of an indus-trial thermal storage system for a round-the-clock 26 MWel
CSP plant located in Ait Baha, Morocco. Simulations areperformed for the month of May, which has the highestmonthly DNI for 8 h of charging followed by 16 h of dis-charging. Thus, 1/3 of the air mass flow rate coming fromthe solar field is directly fed to the heat exchanger for thesteam-based Rankine cycle for electricity production and2/3 of it is directed to the two thermal storage units, eachwith a thermal capacity of 7.2 GWhth. Construction limita-tions determine the lid size to a maximal 20 m in radius, ascalculated in Appendix A. The mass flow rate throughevery storage unit is chosen so that the total pumpingenergy required for a cycle stays below 2% of the inputenergy of the storage unit per cycle. The charging temper-ature coming from the solar field is 650 �C and thedischarging temperature coming from the power blockis 150 �C (Kiameh, 2002). The Biot number arrives at amaximum value of 0.15 (for hp ¼ 7:3 W=m2 K andks ¼ 1:45 W=mK). The dimensions and operatingconditions of the storage unit are listed in Table 5.
The charging efficiency is defined as the fraction of thestored energy in the rocks at the end of the cycle to thenet input and pumping energy:
gCharging ¼EStored
ENetInput þ EPump;Chargingð29Þ
where ENetInput ¼ EInput � Eoutflow and EPump;charging ¼Ptcharging
i¼0
Dpi _mDt=ðqgfangRankineÞ, considering Rankine cycle efficiencyto produce the required electricity. The discharging effi-ciency is defined as the fraction of the recovered energyduring the discharging phase to the stored and pumpingenergy:
gDischarging ¼ERecovered
EStored þ EPump;Dischargingð30Þ
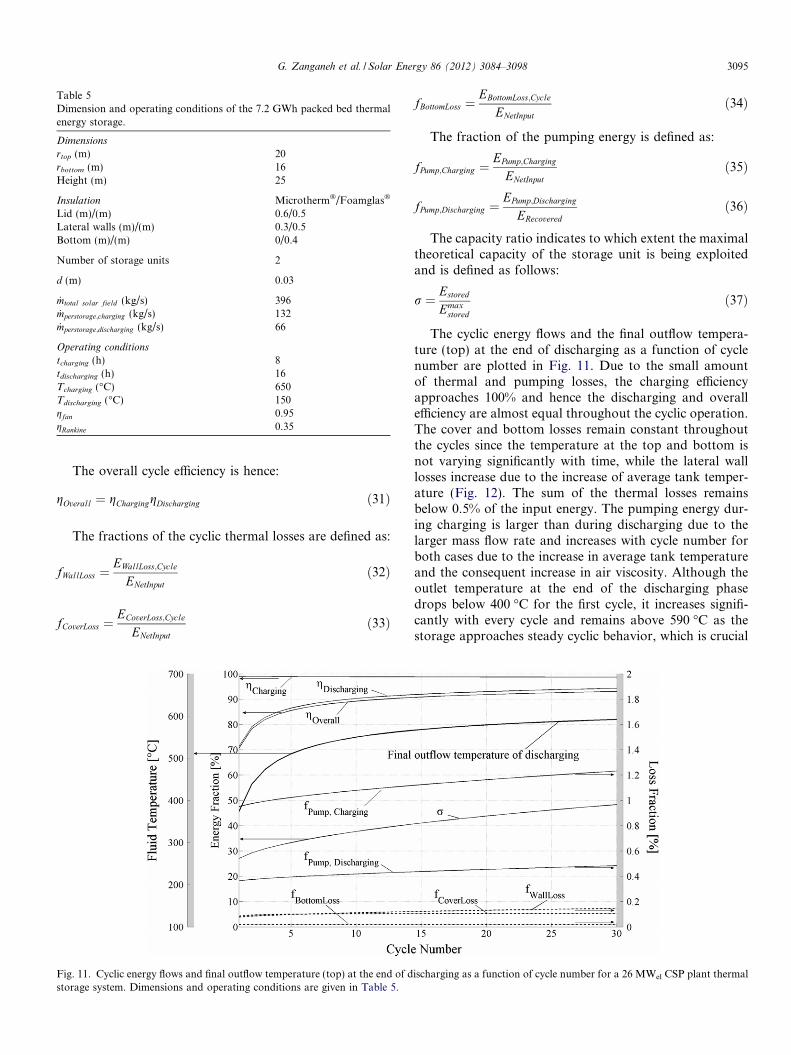
Table 5Dimension and operating conditions of the 7.2 GWh packed bed thermalenergy storage.
Dimensions
rtop (m) 20rbottom (m) 16Height (m) 25
Insulation Microtherm�/Foamglas�
Lid (m)/(m) 0.6/0.5Lateral walls (m)/(m) 0.3/0.5Bottom (m)/(m) 0/0.4
Number of storage units 2
d (m) 0.03
_mtotal solar field (kg/s) 396_mperstorage;charging (kg/s) 132_mperstorage;discharging (kg/s) 66
Operating conditions
tcharging (h) 8tdischarging (h) 16Tcharging (�C) 650Tdischarging (�C) 150gfan 0.95gRankine 0.35
G. Zanganeh et al. / Solar Energy 86 (2012) 3084–3098 3095
The overall cycle efficiency is hence:
gOverall ¼ gCharginggDischarging ð31Þ
The fractions of the cyclic thermal losses are defined as:
fWallLoss ¼EWallLoss;Cycle
ENetInputð32Þ
fCoverLoss ¼ECoverLoss;Cycle
ENetInputð33Þ
Fig. 11. Cyclic energy flows and final outflow temperature (top) at the end of dstorage system. Dimensions and operating conditions are given in Table 5.
fBottomLoss ¼EBottomLoss;Cycle
ENetInputð34Þ
The fraction of the pumping energy is defined as:
fPump;Charging ¼EPump;Charging
ENetInputð35Þ
fPump;Discharging ¼EPump;Discharging
ERecoveredð36Þ
The capacity ratio indicates to which extent the maximaltheoretical capacity of the storage unit is being exploitedand is defined as follows:
r ¼ Estored
Emaxstored
ð37Þ
The cyclic energy flows and the final outflow tempera-ture (top) at the end of discharging as a function of cyclenumber are plotted in Fig. 11. Due to the small amountof thermal and pumping losses, the charging efficiencyapproaches 100% and hence the discharging and overallefficiency are almost equal throughout the cyclic operation.The cover and bottom losses remain constant throughoutthe cycles since the temperature at the top and bottom isnot varying significantly with time, while the lateral walllosses increase due to the increase of average tank temper-ature (Fig. 12). The sum of the thermal losses remainsbelow 0.5% of the input energy. The pumping energy dur-ing charging is larger than during discharging due to thelarger mass flow rate and increases with cycle number forboth cases due to the increase in average tank temperatureand the consequent increase in air viscosity. Although theoutlet temperature at the end of the discharging phasedrops below 400 �C for the first cycle, it increases signifi-cantly with every cycle and remains above 590 �C as thestorage approaches steady cyclic behavior, which is crucial
ischarging as a function of cycle number for a 26 MWel CSP plant thermal
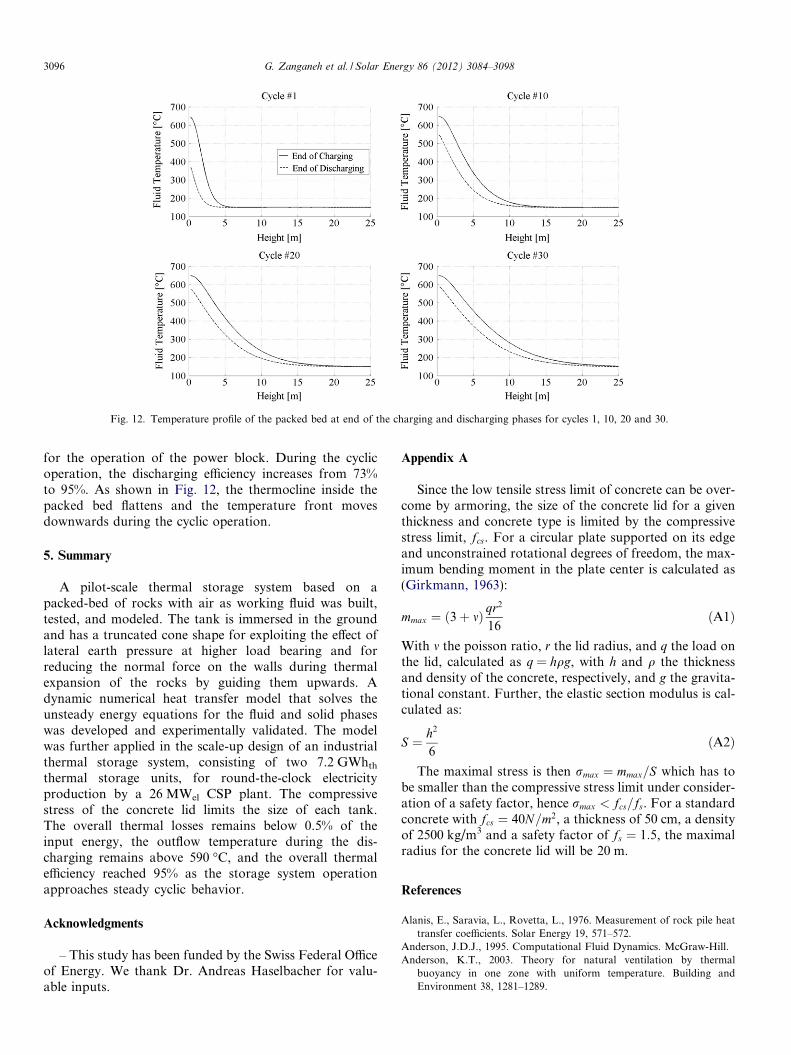
Fig. 12. Temperature profile of the packed bed at end of the charging and discharging phases for cycles 1, 10, 20 and 30.
3096 G. Zanganeh et al. / Solar Energy 86 (2012) 3084–3098
for the operation of the power block. During the cyclicoperation, the discharging efficiency increases from 73%to 95%. As shown in Fig. 12, the thermocline inside thepacked bed flattens and the temperature front movesdownwards during the cyclic operation.
5. Summary
A pilot-scale thermal storage system based on apacked-bed of rocks with air as working fluid was built,tested, and modeled. The tank is immersed in the groundand has a truncated cone shape for exploiting the effect oflateral earth pressure at higher load bearing and forreducing the normal force on the walls during thermalexpansion of the rocks by guiding them upwards. Adynamic numerical heat transfer model that solves theunsteady energy equations for the fluid and solid phaseswas developed and experimentally validated. The modelwas further applied in the scale-up design of an industrialthermal storage system, consisting of two 7.2 GWhth
thermal storage units, for round-the-clock electricityproduction by a 26 MWel CSP plant. The compressivestress of the concrete lid limits the size of each tank.The overall thermal losses remains below 0.5% of theinput energy, the outflow temperature during the dis-charging remains above 590 �C, and the overall thermalefficiency reached 95% as the storage system operationapproaches steady cyclic behavior.
Acknowledgments
– This study has been funded by the Swiss Federal Officeof Energy. We thank Dr. Andreas Haselbacher for valu-able inputs.
Appendix A
Since the low tensile stress limit of concrete can be over-come by armoring, the size of the concrete lid for a giventhickness and concrete type is limited by the compressivestress limit, fcs. For a circular plate supported on its edgeand unconstrained rotational degrees of freedom, the max-imum bending moment in the plate center is calculated as(Girkmann, 1963):
mmax ¼ ð3þ mÞ qr2
16ðA1Þ
With m the poisson ratio, r the lid radius, and q the load onthe lid, calculated as q = hqg, with h and q the thicknessand density of the concrete, respectively, and g the gravita-tional constant. Further, the elastic section modulus is cal-culated as:
S ¼ h2
6ðA2Þ
The maximal stress is then rmax ¼ mmax=S which has tobe smaller than the compressive stress limit under consider-ation of a safety factor, hence rmax < fcs=fs. For a standardconcrete with fcs ¼ 40N=m2, a thickness of 50 cm, a densityof 2500 kg/m3 and a safety factor of fs ¼ 1:5, the maximalradius for the concrete lid will be 20 m.
References
Alanis, E., Saravia, L., Rovetta, L., 1976. Measurement of rock pile heattransfer coefficients. Solar Energy 19, 571–572.
Anderson, J.D.J., 1995. Computational Fluid Dynamics. McGraw-Hill.Anderson, K.T., 2003. Theory for natural ventilation by thermal
buoyancy in one zone with uniform temperature. Building andEnvironment 38, 1281–1289.

G. Zanganeh et al. / Solar Energy 86 (2012) 3084–3098 3097
Antwerpen, W.v., Toit, C.G.d., Rousseau, P.G., 2010. A review ofcorrelations to model the packing structure and effective thermalconductivity in packed beds of mono-sized spherical particles. NuclearEngineering and Design 240, 1803–1818.
Bader, R., Pedretti, A., Steinfeld, A., 2011. A 9-m-aperture solar parabolictrough concentrator based on a multilayer polymer mirror membranemounted on a concrete Structure. ASME Journal of Solar EnergyEngineering 133, 031016, 1–12.
Beasley, D.E., Clark, J.A., 1984. Transient response of a packed bed forthermal energy storage. International Journal of Heat and MassTransfer 27, 1659–1669.
Beek, J., 1962. Design of packed catalytic reactors. Advances in ChemicalEngineering 3, 203–271.
Berdahl, P., Martin, M., 1984. Emissivity of clear skies. Solar Energy 32,663–664.
Courant, R., Friedrichs, K., Lewy, H., 1928. Uber die partiellenDifferenzengleichungen der mathematischen Physik. MathematischeAnnalen 100, 32–74.
Coutier, J.P., Farber, E.A., 1982. Two applications of a numericalapproach of heat transfer process within rock beds. Solar Energy 29,451–462.
DeLaquil, P., Kelly, B., Lessley, R., 1991. Solar one conversion project.Solar Energy Materials 24, 151–161.
Dreissigacker, V., Muller-Steinhagen, H., Zunft, S., 2010. Thermo-mechanical analysis of packed beds for large-scale storage of high-temperature heat. Heat and Mass Transfer 46, 1199–1207.
DuToit, C.G., 2008. Radial variation in porosity in annular packed beds.Nuclear Engineering and Design 238, 3073–3079.
Ergun, S., 1952. Fluid flow through packed columns. Chemical Engineer-ing Progress 48, 89–94.
Gil, A., Medrano, M., Martorell, I., Lazaro, A., Dolado, P., Zalba, B.,Cabeza, L.F., 2010. State of the art on high temperature thermalenergy storage for power generation. Part 1—Concepts, materials andmodellization. Renewable and Sustainable Energy Reviews 14, 31–55.
Girkmann, K., 1963. Flachentragwerke, sixth ed. Springer-Verlag, Wien.Gross, R.J., Hickox, C.E., Hackett, C.E., 1980. Numerical simulation of
dual-media thermal energy storage systems. Journal of Solar EnergyEngineering 102, 287–293.
Hahne, E., 2000. The ITW solar heating system: an oldtimer fully inaction. Solar Energy 69, 469–493.
Hanchen, M., Bruckner, S., Steinfeld, A., 2011. High-temperature thermalstorage using a packed bed of rocks – heat transfer analysisand experimental validation. Applied Thermal Engineering 31, 1798–1806.
Herrmann, U., Kearney, D.W., 2002. Survey of thermal energy storage forparabolic trough power plants. Journal of Solar Energy Engineering124, 145–152.
Incropera, F.P., Dewitt, D.P., Bergman, T.L., Lavince, A.S., 2007.Fundamentals of Heat and Mass Transfer, sixth ed. John Wiley &Sons.
Ismail, K.A.R., Stuginsky Jr., R., 1999. A parametric study on possiblefixed bed models for PCM and sensible heat storage. Applied ThermalEngineering 19, 757–788.
Jalalzadeh-Azar, A.A., Steele, W.G., Adebiyi, G.A., 1996. Heat transfer ina high-temperature packed bed thermal energy storage system – rolesof radiation and intraparticle conduction. Journal of EnergyResources Technology 118, 50–57.
Kelley, K., 1960. Contribution to the data on theoretical metallurgy: XIIIhigh-temperature heat-content, heat-capacity, and entropy data for theelements and inorganic compounds, U.S. Bur. Mines Bull. No. 584,U.S. Government Printing Office.
Kiameh, P., 2002. Power Generation Handbook. McGraw-Hill.Kunii, D., Smith, J.M., 1960. Heat transfer characteristics of porous
rocks. A.I.Ch.E. Journal 6, 71–78.Laguerre, O., Amara, S.B., Flick, D., 2006. Heat transfer between wall
and packed bed crossed by low velocity airflow. Applied ThermalEngineering 26, 1951–1960.
Lang, H.-J., Huder, J., 1990. Bodenmechanik und Grundbau, fourth ed.Springer.
Lof, G.O.G., Hawley, R.W., 1948. Unsteady-state heat transfer betweenair and loose solids. Industrial and Engineering Chemistry 40, 1061–1070.
Lovegrove, K., Luzzi, A., Soldiani, I., Kreetz, H., 2004. Developingammonia based thermochemical energy storage for dish power plants.Solar Energy 76, 331–337.
Macdonald, I.F., El-Sayed, M.S., Mow, K., Dullien, F.A.L., 1979. Flowthrough porous media – the Ergun equation revisited. Industrial andEngineering Chemistry Fundamentals 18, 199–208.
Martin, M., Berdahl, P., 1984. Characteristics of infrared sky radiation inthe United States. Solar Energy 33, 321–336.
Martinola, G., Meda, A., Plizzari, G.A., Rinaldi, Z., 2010. Strengtheningand repair of RC beams with fiber reinforced concrete. Cement andConcrete Composites 32, 731–739.
Mawire, A., McPherson, M., Heetkamp, R.R.J.v.d., Mlatho, S.J.P., 2009.Simulated performance of storage materials for pebble bed thermalenergy storage (TES) systems. Applied Energy 86, 1246–1252.
Medrano, M., Gil, A., Martorell, I., Potau, X., Cabeza, L.F., 2010. Stateof the art on high-temperature thermal energy storage for powergeneration. Part 2 – Case studies. Renewable and Sustainable EnergyReviews 14, 56–72.
Meier, A., Winkler, C., Wuillemin, D., 1991. Experiment for modellinghigh temperature rock bed storage. Solar Energy Materials 24, 255–264.
Moran, M.J., Shapiro, H.N., 2006. Fundamentals of Engineering Ther-modynamics, fifth ed. Springer, Berlin.
Nsofor, E.C., Adebiyi, G.A., 2001. Measurements of the gas-particleconvective heat transfer coefficient in a packed bed for high-temperature energy storage. Experimental Thermal and FluidScience 24, 1–9.
Ofuchi, K., Kunii, D., 1964. Heat-transfer characteristics of packed bedswith stagnant fluids. International Journal of Heat and Mass Transfer8, 749–757.
Ozahi, E., Gundogdu, M.Y., Carpinlioglu, M.O., 2008. A modification onErgun’s correlation for use in cylindrical packed beds with non-spherical particles. Advanced Powder Technology 19, 369–381.
Panton, R.L., 2005. Incompressible Flow, third ed. John Wiley & Sons,Hoboken, New Jersey.
Pfeffer, R., 1964. Heat and mass transport in multiparticle systems. I&ECFundamentals 3, 380–383.
Pratten, N.A., 1981. The precise measurement of the density of smallsamples. Journal of Materials Science 16, 1737–1747.
Sanderson, T.M., Cunningham, G.T., 1995. Packed bed thermal storagesystems. Applied Energy 51, 51–67.
Schumann, T.E.W., 1929. Heat transfer: a liquid flowing through a porousprism. Journal of the Franklin Institute 208, 405–416.
Seipold, U., 1998. Temperature dependence of thermal transportproperties of crystalline rocks – a general law. Tectonophysics291, 161–171.
Siegel, R., Howell, J., 2002. Thermal Radiation Heat Transfer, fourth ed.Taylor & Francis, New York.
Somerton, W.H., 1992. Thermal Properties and Temperature-RelatedBehavior of Rock/Fluid Systems. Elsevier, New York, NY.
Steinmann, W.-D., Eck, M., 2006. Buffer storage for direct steamgeneration. Solar Energy 80, 1277–1282.
Tamme, R., Laing, D., Steinmann, W.-D., 2004. Advanced thermal energystorage technology for parabolic trough. Journal of Solar EnergyEngineering 126, 794–800.
Toman, J., Cerny, R., 2001. Thermal conductivity of high performanceconcrete in wide temperature and moisture ranges. Acta Polytechnica41, 8–10.
Vodak, F., Cerny, R., Drchalova, J., Hoskova, S., Kapickova, O.,Michalko, O., Semerak, P., Toman, J., 1997. Thermophysical prop-erties of concrete for nuclear-safety related structures. Cement andConcrete Research 27, 415–426.

3098 G. Zanganeh et al. / Solar Energy 86 (2012) 3084–3098
Vosteen, H., 2003. Influence of temperature on thermal conductivity,thermal capacity and thermal diffusivity for different types of rock.Physics and Chemistry of the Earth, Parts A/B/C 28, 499–509.
Waked, A.M., 1986. Solar energy storage in rocks. Solar & WindTechnology 3, 27–31.
Watanabe, T., Kikuchi, H., Kanzawa, A., 1993. Enhancement of chargingand discharging rates in a latent heat storage system by use of PCMwith different melting temperatures. Heat Recovery Systems and CHP13, 57–66.
Yagi, S., Kunii, D., 1957. Studies on effective thermal conductivities inpacked beds. A.I.Ch.E. Journal 3, 373–381.
Yaws, C.L., 1999. Chemical Properties Handbook. McGraw-Hill.Zavattoni, S.A., Barbato, M.C., Pedretti, A., Zanganeh, G., 2011. CFD
simulations of a pebble bed thermal energy storage system accountingfor porosity radiation effects. In: SolarPACES, 20–23 September 2011,Granada (Spain).
Zunft, S., Hanel, M., Kruger, M., Dreissigacker, V., Gohring, F., Wahl,E., 2011. Julich solar power tower – experimental evaluation of thestorage subsystem and performance calculation. Journal of SolarEnergy Engineering 133, 031019.