Embed Size (px)
Citation preview

Page 1
Notes on FDI
By Saul Estrin
Page 2
Outline of Presentation
Context on FDI to Emerging Marketso definitionso scale
The Determinants of FDI
Findings From our Survey
Findings From the Cases
Learning Points

Page 3
Context of FDI to Emerging Markets
Definition of FDI
Role of FDI
Scale of FDI
Page 4
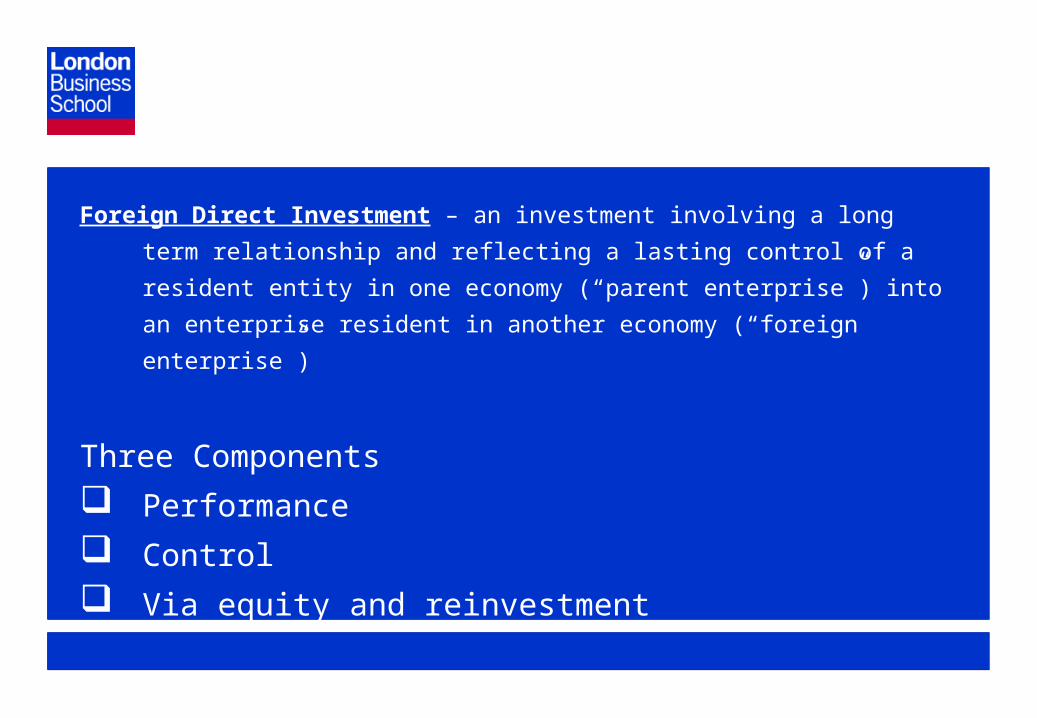
Foreign Direct Investment – an investment involving a long term
relationship and reflecting a lasting control of a resident entity in
one economy (“parent enterprise”) into an enterprise resident in
another economy (“foreign enterprise”)
Three Components
Performance
Control
Via equity and reinvestment

Page 5
Why is FDI Important?
Permits investment to exceed savings without foreign borrowing – source of growth – evidence?
Transfer of technology
Transfer of skills Spillover effects
Transfer of managerial know-how
Integration into world economy

Page 6
Why is FDI Important?cont
But in emerging markets……..
Can lead to dual economy – lack of spillovers
Forward and backward linkages
Can weaken development of local institutions e.g. capital markets
Can lead to increase in domestic monopoly power

Page 7
Table 1 FDI to Whom: Inflows ($bn)
1991-1996 1997 1998 1999 2000 2001 2002
World 254 482 686 1079 1393 824 651
Developing Countries 92 193 191 230 246 209 162
Developing Share (%) 36 40 28 21 18 25 25
Africa 5 11 9 12 8 19 11
Latin America 27 73 82 108 93 84 56
Asia 59 109 100 108 142 107 95
Central & Eastern Europe 8 19 22 25 26 25 29
Page 8
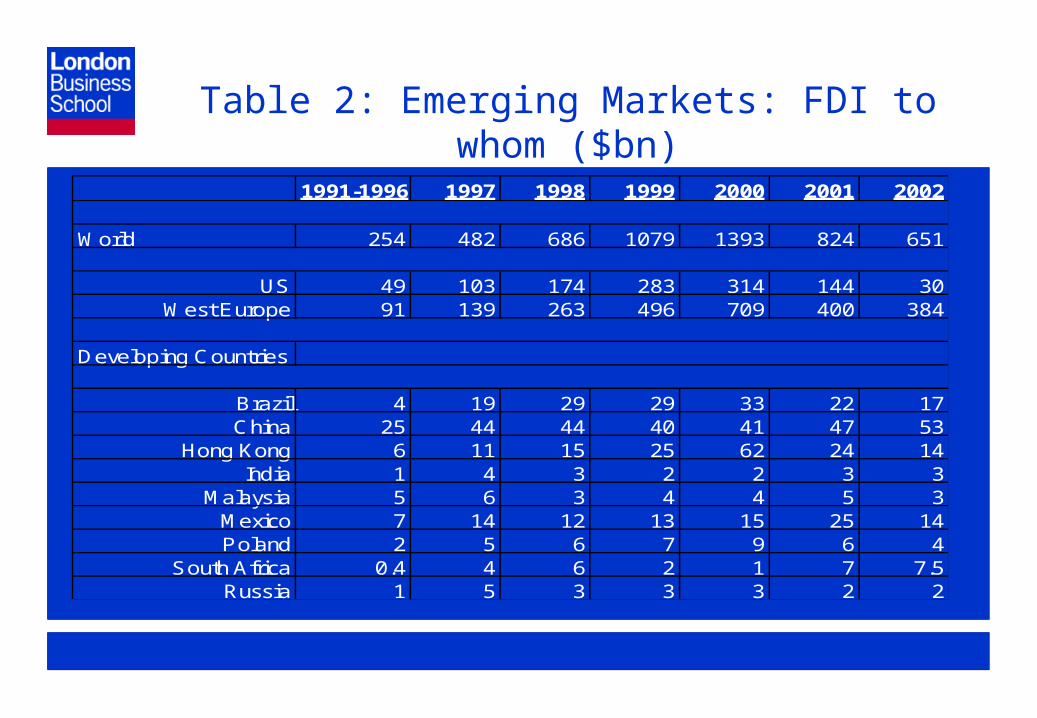
Table 2: Emerging Markets: FDI to whom ($bn)
1991-1996 1997 1998 1999 2000 2001 2002
World 254 482 686 1079 1393 824 651
US 49 103 174 283 314 144 30West Europe 91 139 263 496 709 400 384
Developing Countries
Brazil 4 19 29 29 33 22 17China 25 44 44 40 41 47 53
Hong Kong 6 11 15 25 62 24 14India 1 4 3 2 2 3 3
Malaysia 5 6 3 4 4 5 3Mexico 7 14 12 13 15 25 14Poland 2 5 6 7 9 6 4
South Africa 0.4 4 6 2 1 7 7.5Russia 1 5 3 3 3 2 2

Page 9
Table 3 Outflows: Major Countries ($bn)
1991-1996 1997 1998 1999 2000 2001 2002
World Developed Economies 280 477 683 1096 1200 711 647240 396 631 1021 1098 660 600
US 67 96 131 209 143 104 120West Europe 140 244 437 771 872 487 411
Developing Countries 39 77 50 73 99 47 43
Brazil 0.5 1.1 2.8 1.7 2.3 -2.6 2.5
Hong Kong 17 24 17 19 59 11 18
Russia 0.5 3 1 2 3 3 3
Page 10
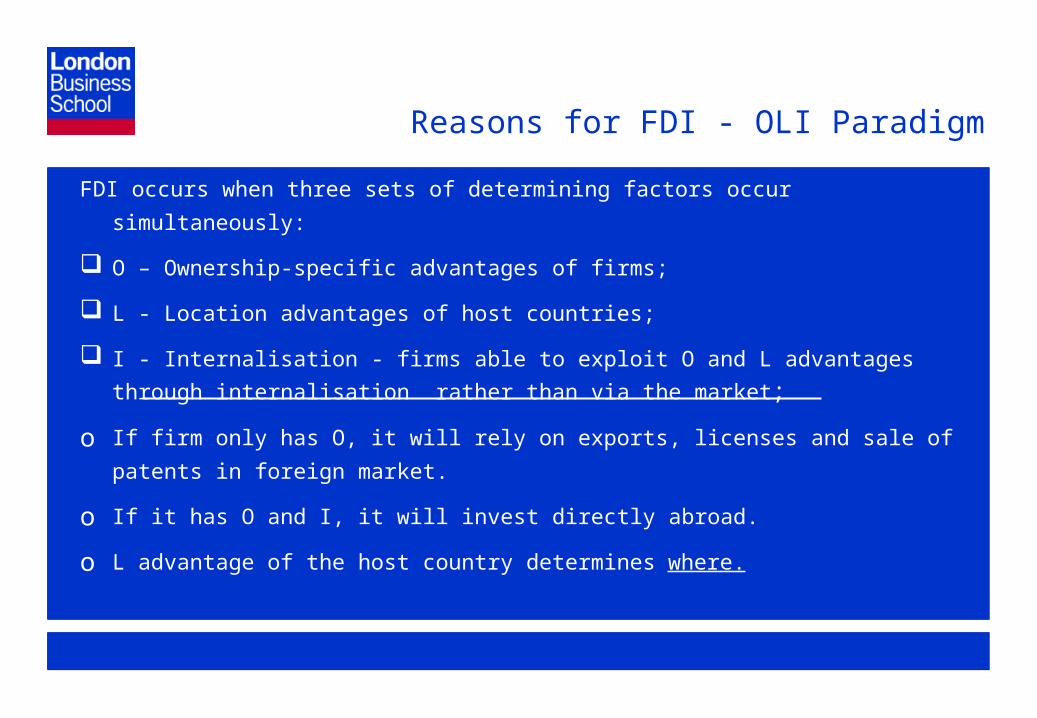
Reasons for FDI - OLI Paradigm
FDI occurs when three sets of determining factors occur simultaneously:
O – Ownership-specific advantages of firms;
L - Location advantages of host countries;
I - Internalisation - firms able to exploit O and L advantages through
internalisation rather than via the market;
o If firm only has O, it will rely on exports, licenses and sale of patents
in foreign market.
o If it has O and I, it will invest directly abroad.
o L advantage of the host country determines where.

Page 11
Main Economic Determinants of FDI
Type of FDI
Market Seeking;
Resource Seeking
Efficiency Seeking;
Determinants
market size;
market growth;
access to global/regional markets;
raw materials; oil, gas,minerals,timber
cost of resources and assets, e.g. labour, skills,
technology.
input costs e.g. transport, communication;

Page 12
Overview of Research Project
Study of FDI in Egypt, India, South Africa and Vietnam
Surveys of FDI subsidiaries – 600+ firms
12 cases (four per country)
Summarise comparative findings from survey and case results

Page 13
Our Countries
Very different in size, history, institutions
Similar in “level of” development
Similar in scale of FDI

Page 14
in million US$
South Africa 49 -5 -8 -42 -19 380 1241 818 3817 561 1502 888 6653India 113 236 155 233 574 973 2144 2525 3619 2633 2168 2319 3404Egypt 926 734 352 459 493 1256 598 636 887 1065 2919 1235 510Vietnam* 5 16 32 385 523 1936 2336 1803 2587 1700 1484 1289 1300
2001
Note: we use the latest available revision of the data, i.e. WIR 2002 for datafor 1996 onwards. * In the case of Vietnam, this involves a considerabledownward adjustment of the data from 1996 onwards, compared to the datareported in the WIR 2001.
Source: United Nations: World Investment Report annual 1994 to2002.
1982 – 89 (annual average)
97 98 99 200093 94 95 9690 91 92
Table 1.1: FDI in Emerging Markets

Page 15
Table 1.2 Key economic and social data in Egypt, India, South Africa and Vietnam
Sources: IMF: International Financial Statistics; World Bank: Development Report, Competitiveness Indicators; UN: Human Development Report, various years.
1990 2000 1990 1990
52 64 835 34
926 1.49 377 3.325
66.9 62.9
55.3 57.2
0.642 0.577
115 124
28.7 37.8
20.2 6.6
42.7 27.7
17 28
86 32
21 4
493 158
Vietnam
2000 2000 1990 2000
Egypt India S.Africa
66 79Population, million 1.016 43
78 390GDP per capita, US$ 460 3.02
53.7 53.9 50.3 67.8Life expectancy at birth ** 52.1 50.3
Adult literacy rate 85.3 93.4
HDI index 0.574 0.511 0.714 0.695 0.605 0.688
HDI rank na na na 107 na 109
Gini index *** na na na 59.3 na 36.1
Tertiary enrolment rates, % **** 15.8 6.1 13.2 18.9 1.9 4.1
Urban population, % of total ** 43.5 21.3 48 56.9 18.8 24.1
Agriculture % of GDP 19 31 5 4 37 26
32Phone lines (# per 1000 people) 30 6
10Mobile phones (# per 1000 people) na na
274Scientists and engineers in R&D per million peoplena na na 992 na
na 190 na
93 114 1
Notes * averages over the 1990-1995 and 1996-2000, ** data refer to 1975 and 1999, *** Gini coefficient refers to different years between 1993 and 1998, **** data refer to 1990 and 1995 .
Page 16
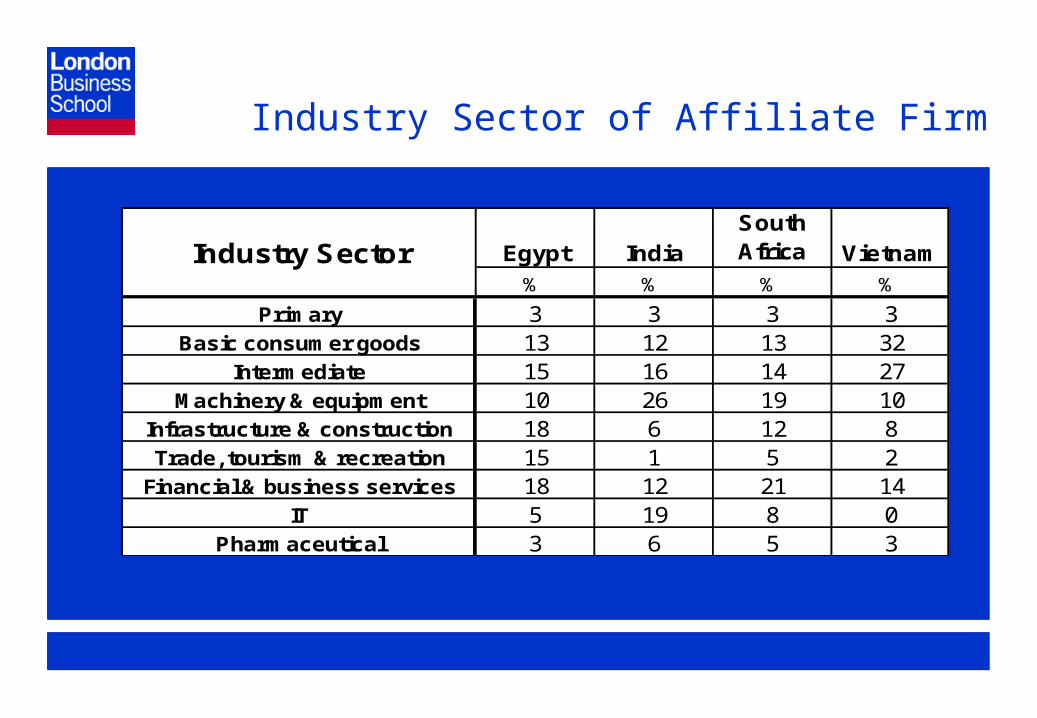
Industry Sector Egypt IndiaSouth Africa Vietnam
% % % %
Primary 3 3 3 3Basic consumer goods 13 12 13 32
Intermediate 15 16 14 27Machinery & equipment 10 26 19 10
Infrastructure & construction 18 6 12 8Trade, tourism & recreation 15 1 5 2
Financial & business services 18 12 21 14IT 5 19 8 0
Pharmaceutical 3 6 5 3
Industry Sector of Affiliate Firm
Page 17
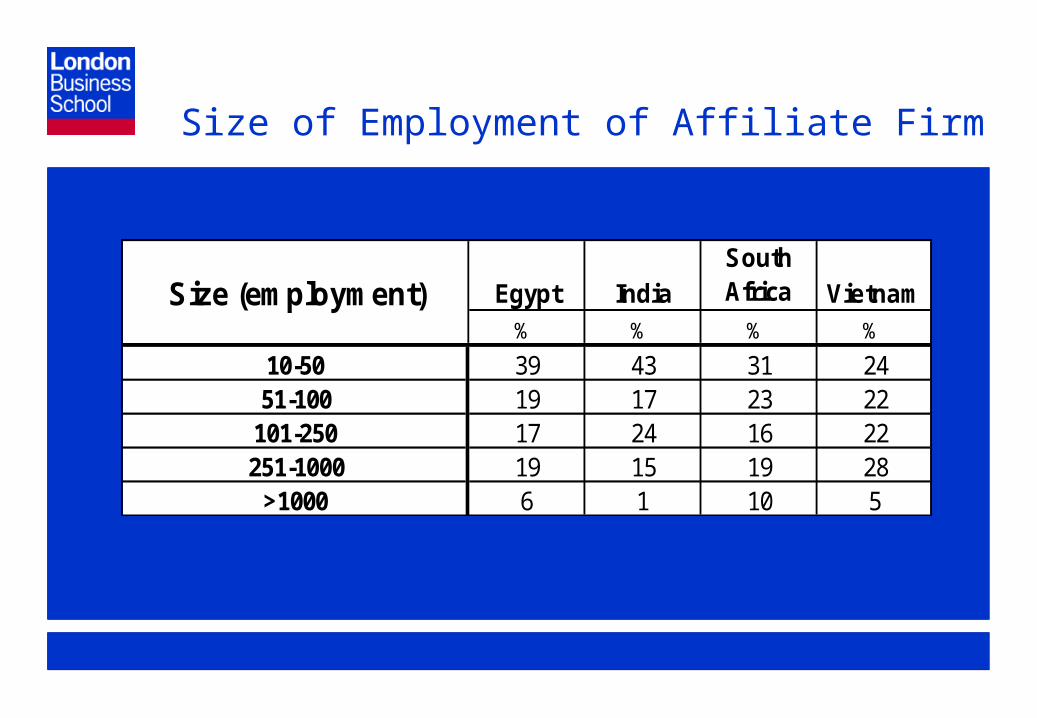
Size (employment) Egypt IndiaSouth Africa Vietnam
% % % %
10-50 39 43 31 2451-100 19 17 23 22
101-250 17 24 16 22251-1000 19 15 19 28
>1000 6 1 10 5
Size of Employment of Affiliate Firm

Page 18
Home Regions Egypt IndiaSouth Africa Vietnam
% % % %
North America 19 29 23 5Europe 43 48 57 15
Japan & East Asia 2 17 14 78MENA 33 2 0 1
Other (incl. Australia) 2 2 6 2
Geographic Regions of Parent Firms

Page 19
Global Employment Egypt IndiaSouth Africa Vietnam
% % % %
< 1000 32 38 19 351000 – 10,000 28 36 31 33
10,000 – 100,000 21 21 40 27> 100,000 19 5 10 5
Global Employment of Parent Firm

Page 20
Mode of Entry Egypt IndiaSouth Africa Vietnam
% % % %
Greenfield 47 36 32 55Joint Venture 37 52 22 33Acquisition 5 4 32 2
Partial Acquisition 12 8 14 11
Mode of Entry

Page 21
T6
Market Focus (initial and current) Initial Current Initial Current Initial Current Initial Current
1 % of Exported Product 22 27 38 39 18 26 49 50
2 Regional Market 10 12 5 7 3 9 25 243 Global Market 10 10 21 21 11 14 18 204 Other Affiliates of the Parent 3 4 12 10 4 3 7 6
Egypt India South Africa Vietnam
% % % %
Domestic Markets vs Exports

Page 22
0 10 20 30 40 50 60
Technology
Marketing
Management
Machinery
Equity
Distribution networks
Business networks
Brands
PercentageVietnam South Africa India Egypt
Figure 5: Critical Resources Chosen

Page 23
0 10 20 30 40 50 60 70 80 90 100
Technology
Marketing
Management
Machinery
Equity
Distribution networks
Business networks
Brands
PercentageVietnam South Africa India Egypt
Figure 5a: Local Firm Source of Resource

Page 24
0 10 20 30 40 50 60 70 80 90 100
Technology
Marketing
Management
Machinery
Equity
Distribution networks
Business networks
Brands
PercentageVietnam South Africa India Egypt
Figure 5b: Foreign Parent Source of Resource

Page 25
0 5 10 15 20 25 30 35 40
Technology
Marketing
Management
Machinery
Equity
Distribution networks
Business networks
Brands
PercentageVietnam South Africa India Egypt
Figure 5c: Other Local Source of Resource

Page 26
0 0.5 1 1.5 2 2.5 3 3.5 4 4.5
Executive management
Professionals
Operations management
Skilled non-managementlabour
Mean RankEgypt Mean Rank India Mean Rank South Africa Mean Rank Vietnam Mean Rank
Figure 6: Labour Market Evaluation - by Country

Page 27
0 0.5 1 1.5 2 2.5 3 3.5 4 4.5 5
Utility reliablility
IT& telecom reliability
Competent professionals
Real estate
Machinery & equipment
Raw material & components
Mean RankEgypt Mean Rank India Mean Rank South Africa Mean Rank Vietnam Mean Rank
Figure 7: Local Inputs - by Country

Page 28
0 0.5 1 1.5 2 2.5 3 3.5 4 4.5
Business license
Real estate
Visa & work permit
Environment regulations
General legal frameworks
Predictability
Central government
Provincial government
Local government
Mean RankEgypt Mean Rank India Mean Rank South Africa Mean Rank Vietnam Mean Rank
Figure 8: Institutional Environments - by Country

Page 29
0 0.5 1 1.5 2 2.5 3 3.5 4 4.5
Revenue Growth
Profitability
Productivity
Mean Rank
Vietnam South Africa India Egypt
Figure 9: Performance - by Country

Page 30
Lesson from Survey
Most FDI small – not a motor of employment creation
Local familiarity, experience and integration to regional trading blocks very important
High proportion of FDI is market - seeking
Entry mode mainly greenfield and JV
Contribution of key resources mainly from foreign firms
Business environment particularly weak in terms of institutions and policy

Page 31
Table 1: Sectoral Distribution of Case Studies
Egypt India South Africa Vietnam
Services ECMS ABN Amro ABN Amro ---
Food &
Beverages
Manufacturing,
intermediate
products
Manufacturing, final products
(Telecom)
Heinz
( ketchup)
----
GlaxoSmithKline
(pharmaceuticals)
(banking)
Barcardi-Martini
(spirits)
Packaging
(packaging)
-----
ABN Amro
(banking)
---
NGK/Behr
(autmotive suppliers)
EST
SEAB/Carlsberg
(brewing)
ABB
(Electrical
components)
Honda
(motorcycles)

Page 32
Findings from Cases
Global strategies are prime drivers of FDI Promote global or regional supply base, e.g.
Honda Extend market research, e.g. Carlsberg Follow customers e.g. Ziton Follow competitors , e.g. NGK Impact of institutions usually not general but
specific, but a few, e.g.• Impact of labour law in India, Egypt• Bureaucracy in Egypt• Visas in South Africa

Page 33
Findings from Cases cont
FDI given opportunity by liberalisation/privatisation
Regional factors in country significant determinants of location e.g. Vietnam, India.

Page 34
Capital Markets
Acquisitions rare because capital markets are not well developed in emerging markets. Explains differences between South Africa and others
Privatisation, capital market development and FDI related e.g. Vietnam or India
Need “supply” of acquisition targets
Page 35
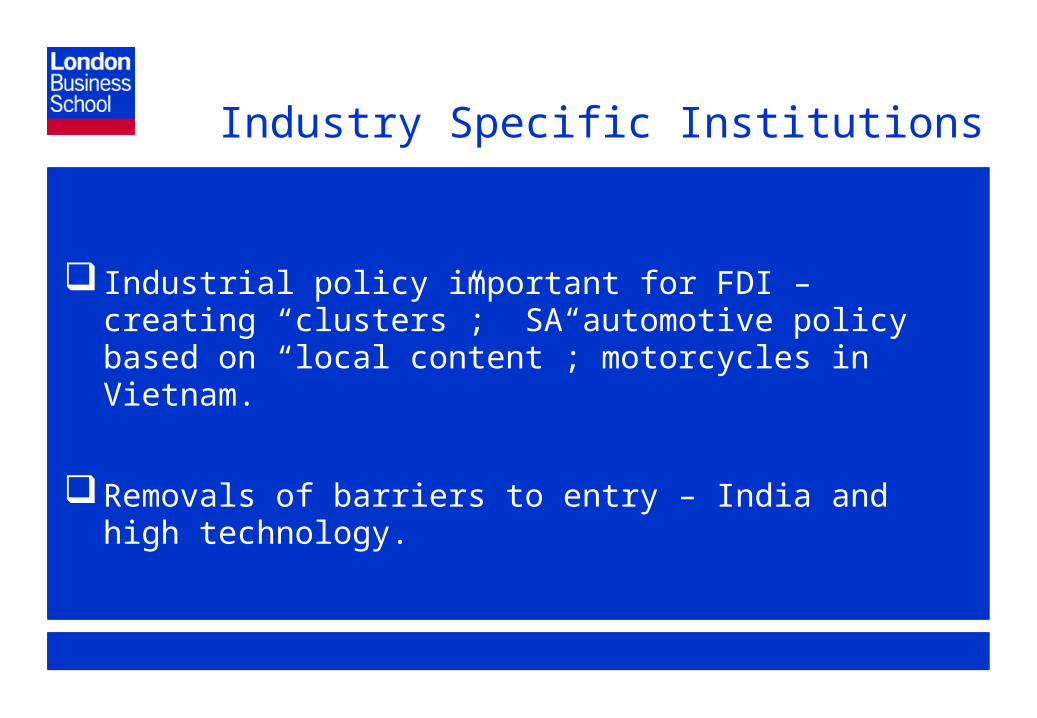
Industry Specific Institutions
Industrial policy important for FDI – creating “clusters”; SA automotive policy based on “local content”; motorcycles in Vietnam.
Removals of barriers to entry – India and high technology.

Page 36
Conclusions From Research
FDI to emerging markets increasing and likely to do so even more
Firms solve the problem of how to operate in institutionally weaker environments – size, entry mode
Global strategies are important but so are regional ones
Spillover benefits greater from acquisitions but integration into global market also relevant


![Curso de Aperturas Abiertas. Panov & Estrin [63]](https://img.pdfslide.net/doc/110x75/577cdbb11a28ab9e78a8d1db/curso-de-aperturas-abiertas-panov-estrin-63.jpg)


