Embed Size (px)
Citation preview

Aalborg Universitet
Pain adaptability in individuals with chronic musculoskeletal pain is not associatedwith conditioned pain modulation
Wan, Dawn Wong Lit; Arendt-Nielsen, Lars; Wang, Kelun; Xue, Charlie Changli; Wang,Yanyi; Zheng, ZhenPublished in:Journal of Pain
DOI (link to publication from Publisher):10.1016/j.jpain.2018.03.002
Publication date:2018
Document VersionAccepted author manuscript, peer reviewed version
Link to publication from Aalborg University
Citation for published version (APA):Wan, D. W. L., Arendt-Nielsen, L., Wang, K., Xue, C. C., Wang, Y., & Zheng, Z. (2018). Pain adaptability inindividuals with chronic musculoskeletal pain is not associated with conditioned pain modulation. Journal of Pain,19(8), 897-909. https://doi.org/10.1016/j.jpain.2018.03.002
General rightsCopyright and moral rights for the publications made accessible in the public portal are retained by the authors and/or other copyright ownersand it is a condition of accessing publications that users recognise and abide by the legal requirements associated with these rights.
- Users may download and print one copy of any publication from the public portal for the purpose of private study or research. - You may not further distribute the material or use it for any profit-making activity or commercial gain - You may freely distribute the URL identifying the publication in the public portal -
Take down policyIf you believe that this document breaches copyright please contact us at [email protected] providing details, and we will remove access tothe work immediately and investigate your claim.

Accepted Manuscript
Title: Pain Adaptability in Individuals with Chronic Musculoskeletal Pain is
Not Associated with Conditioned Pain Modulation
Author: Dawn Wong Lit Wan, Lars Arendt-Nielsen, Kelun Wang, Charlie
Changli Xue, Yanyi Wang, Zhen Zheng
PII: S1526-5900(18)30111-1
DOI: https://doi.org/10.1016/j.jpain.2018.03.002
Reference: YJPAI 3548
To appear in: The Journal of Pain
Received date: 2-4-2017
Revised date: 3-9-2017
Accepted date: 3-3-2018
Please cite this article as: Dawn Wong Lit Wan, Lars Arendt-Nielsen, Kelun Wang, Charlie
Changli Xue, Yanyi Wang, Zhen Zheng, Pain Adaptability in Individuals with Chronic
Musculoskeletal Pain is Not Associated with Conditioned Pain Modulation, The Journal of Pain
(2018), https://doi.org/10.1016/j.jpain.2018.03.002.
This is a PDF file of an unedited manuscript that has been accepted for publication. As a service
to our customers we are providing this early version of the manuscript. The manuscript will
undergo copyediting, typesetting, and review of the resulting proof before it is published in its
final form. Please note that during the production process errors may be discovered which could
affect the content, and all legal disclaimers that apply to the journal pertain.

1
Pain adaptability in individuals with chronic musculoskeletal pain is
not associated with conditioned pain modulation
Running title:
Pain adaptability in MSK participants
Authors:
Dawn Wong Lit Wan1, Lars Arendt-Nielsen2, Kelun Wang2, Charlie Changli Xue1, Yanyi Wang1, Zhen
Zheng1
1. School of Health and Biomedical Science, RMIT University, Bundoora, Australia
2. Center for Sensory-Motor Interaction, Department of Health Science and Technology, Faculty of
Medicine, Aalborg University, Aalborg, Denmark
Corresponding author:
Associate Professor Zhen Zheng
Address: RMIT University, PO BOX 71, Bundoora, Vic 3083, Australia
Phone: +61 03 9925 7167
Email: [email protected]
Disclosures:
All the authors of this manuscript declare that there is no funding involved and there is no conflict of
interest.
Highlights
The dichotomy of pain adaptability exists in individuals with chronic musculoskeletal
pain.
Pain adaptability is dissociated with the potency of conditioned pain modulation.
Pain adaptability could reflect the temporal aspect of pain inhibition.
Page 1 of 38

2
Abstract (199 words)
Healthy humans can be divided into the pain adaptive (PA) and the pain non-adaptive (PNA) groups;
PA showed a greater decrease in pain rating to a cold pressor test (CPT) than PNA. This study
examined if the dichotomy of pain adaptability existed in individuals with chronic musculoskeletal
pain (MSK). CPTs at 2°C and 7°C were used to assess the status of pain adaptability in participants
with either chronic non-specific low back pain or knee osteoarthritis. The participants’ potency of
conditioned pain modulation (CPM) and local inhibition were measured. The strengths of pain
adaptability at both CPTs were highly correlated. PA and PNA did not differ in their demographics,
pain thresholds from thermal and pressure stimuli, or potency of local inhibition or CPM. PA reached
their maximum pain faster than PNA (t41=-2.76, p<0.01), and had a gradual reduction of pain
unpleasantness over seven days whereas PNA did not (F (6,246) = 3.01, p = 0.01). The dichotomy of
pain adaptability exists in MSK patients. Consistent with the healthy human study, the strength of
pain adaptability and potency of CPM are not related. Pain adaptability could be another form of
endogenous pain inhibition which clinical implication is yet to be understood.
Perspective
The dichotomy of pain adaptability was identified in healthy humans. The current study confirms
that this dichotomy also exists in individuals with chronic musculoskeletal pain, and could be reliably
assessed with cold pressor tests at 2°C and 7°C. Similar to the healthy human study, pain adaptability
is not associated with conditioned pain modulation, and may reflect the temporal aspect of pain
inhibition.
Page 2 of 38

3
Keywords
Cold pressor test, conditioned pain modulation, musculoskeletal pain, pain adaptability, pressure
pain threshold.
Page 3 of 38

4
Introduction (554 words) 1
The ability of the body to modulate pain without the help of medical interventions is known as 2
endogenous pain inhibition. Conditioned pain modulation (CPM) is one of the well-studied 3
endogenous pain inhibitions. It involves the reduction of pain from a painful stimulus when a second 4
painful stimulus is applied distantly or heterotopically63. Potency of CPM is defined by percentage 5
change in pain threshold or pain rating at baseline to that during or after cold pressor. However, the 6
relationship between potency of CPM and chronic pain is inconclusive; some studies showed that 7
patients with high intensity of chronic pain displayed poorer CPM whereas4,17 other studies found no 8
association between pain intensity and potency of CPM10,14,18. Due to those inconsistent results and 9
not well-understood clinical implications, the clinical use of CPM, as the only test of pain inhibition in 10
quantitative sensory test (QST), is limited62. 11
12
Pain adaptability could be another form of pain modulation. It is assessed using a similar method to 13
that used in the measurement of the potency of CPM15,67: the cold pressor test (CPT). When healthy 14
humans were subjected to a cold pressor of 2°C for five minutes, all of them reported moderate to 15
severe pain. After about two minutes, one group experienced significant pain reduction in the 16
remaining three minutes from the cold water, i.e., the pain adaptive group (PA); whereas the other 17
group experienced no changes or a slight increase in pain over time, i.e., the pain non-adaptive 18
group (PNA)67. This dichotomy in response to noxious stimulation was also found in another study 19
where cold water at 7°C or hot water at 47.5°C was used15. When CPT was used to assess CPM, all 20
tests were completed within two minutes. It is important to note that the dichotomy of PA and PNA 21
only appeared after two minutes or longer into CPT, when everyone has nearly reached their peak 22
pain. More importantly, PA reached their peak pain within a significantly shorter time than the PNA 23
did. This confirms that pain adaptability measures a form of pain inhibition that differs from CPM. It 24
Page 4 of 38

5
reflects the intensity as well as the temporal aspects of pain inhibition, which is not measured in 1
CPM. Indeed, in their healthy human study, Zheng67 found an association between pain adaptability 2
and the potency of local inhibition, but not between pain adaptability and potency of CPM. 3
4
So far, pain adaptability has not been studied among clinical samples. It is unclear whether this 5
dichotomy exists among patients with chronic musculoskeletal pain (MSK), who are considered to 6
have a compromised CPM5,31,35,49,53, and whether pain adaptability is related to CPM in those 7
individuals and what its clinical implications are. 8
9
This study examined whether PA and PNA could be identified in MSK participants. More specifically, 10
it aimed (1) to compare the feasibility of CPTs in two temperature settings in MSK participants, in 11
assessing pain adaptability status and the potency of CPM. Feasibility was defined as the CPT with a 12
higher rate of completion and a lower frequency of adverse events. (2) To investigate if PA could be 13
differentiated from PNA using demographics, clinical pain history (years in pain), thermal detection 14
and pain thresholds, pressure pain threshold (PPT), and potency of CPM and local inhibition. (3) To 15
explore the association between pain adaptability and potency of CPM and between pain 16
adaptability and local pain inhibition. 17
18
Methods 19
Study procedure 20
This study was conducted at RMIT University, Australia, with the approval of the RMIT Human 21
Research Ethics Committee (HREC No 18892). All participants gave written consent to be in the study. 22
Page 5 of 38

6
1
Previous studies used five-minute CPTs at temperatures of 1-4°C67 or 7°C15 to determine the pain 2
adaptability of healthy humans. Such temperatures have also been used in other studies to test CPM 3
or cold pain tolerance in chronic pain participants without any adverse events 18,42,45,48,60. It is known 4
that for CPT, water of lower temperatures is perceived as more painful than that of higher 5
temperatures61. In a healthy humans study, one out of 42 participants could not complete a CPT at 6
1-4°C67. It was speculated that a CPT at 2°C might be too painful for MSK participants. On the other 7
hand, a CPT at 8°C could not induce CPM32. A CPT at 7°C might be suitable to identify PA and PNA 8
and to induce CPM in individuals with MSK. Thus, a comparison of both temperatures should be 9
explored. 10
11
The steps of this study are summarised in Fig 1. All participants underwent three sessions with an 12
interval of one week. Baseline data such as demographics, body mass index, quality of life, sleep 13
quality, pain catastrophizing, clinical pain history, and thermal detection and pain thresholds were 14
collected at session 1. After session 1, participants were given a pain diary to record their time 15
courses (in hours) of the average daily pain and intensity of the average daily pain (0-10 numerical 16
rating scale), highest daily pain (0-10 numerical rating scale), as well as unpleasantness of clinical 17
pain (0-20 scale, 20 being intolerable unpleasantness) over 7 days. At each of the sessions 2 and 3, 18
the participants received a CPT. They were randomly allocated to receive a CPT at 2°C (2-4°C, for five 19
minutes) at session 2 followed by a CPT at 7°C (7-9°C, for seven minutes) at session 3 or a CPT at 7°C 20
followed by CPT at 2°C (Fig 1) by drawing a sealed envelope containing a number which 21
corresponded to a random number sequence generated in Excel by an independent assessor (ZZ). 22
The strength of pain adaptability and potency of CPM were assessed in both sessions. The 23
participants were informed that the test would be painful but would not cause any harm. They were 24
also informed that they could remove their foot from the cold pressor at any time without prejudice. 25
Page 6 of 38

7
Water and skin temperatures prior to each CPT were measured. Any adverse event due to the tests 1
was recorded. Participants were in a seated position during all testing. 2
3
4
Selection criteria 5
Participants were enrolled by the outcome assessor (DWLW) and an independent clinician (SH). 6
Non-specific low back pain and knee osteoarthritis are two highly prevalent chronic musculoskeletal 7
conditions2,40,58. Thus, these two types of chronic musculoskeletal pain were chosen for the current 8
study. Furthermore, they both share similar mechanisms such as central sensitization and 9
abnormal/weaker CPM when compared with healthy individuals13,17,52. 10
11
Inclusion criteria 12
Those aged between 20 and 65 years, with non-specific low back pain for more than three months 13
(diagnosed based on the Guideline from the American College of Physicians and the American Pain 14
Society11) of intensity of 2 or more on a 0-10 numerical rating scale, and with adequate 15
conversational English were included in the study. 16
17
Individuals within the age range of 40 to 80 years, with adequate conversational English, with knee 18
OA diagnosed based on the guideline of the American college of Rheumatology on the criteria for 19
idiopathic osteoarthritis of the knee3 and knee pain of intensity of 2 or more on a 0-10 numerical 20
rating scale were included. 21
22
Page 7 of 38
8
Exclusion criteria 1
Participants were excluded if pregnant, intending to become pregnant or breast feeding, had 2
thermal sensitivity deficits (two Standard deviations less or more than the normal range of 3
corresponding age), had brain tumour, cancer or haemophilia, uncontrolled hypertension or had 4
injuries at the testing sites. Also, individuals with recreational drug use, excessive alcohol use, anti-5
convulsant use, anti-depressant or opioid medication use for pain, or previously diagnosed mental 6
illnesses were excluded. Since there are no standard guidelines for the diagnosis of chronic non-7
specific low back pain, the participants were selected based on the recommendations of previous 8
studies, which is by an elimination process11,34. Low back pain caused by radicular neuropathy, 9
osteoporosis, surgery or previous fractures of the spine, acute trauma in the spine, inflammation, 10
malignant or autoimmune disease were not included11. Individuals suffering from both chronic low 11
back pain and knee osteoarthritis were excluded. 12
13
Test sites 14
The participants’ thermal detection (cold and warm) and pain thresholds (cold and heat) were 15
assessed at the knees, wrists and lower back bilaterally (Fig S1). Their PPTs and pain ratings to 16
suprathreshold pressure stimulus (SUPRA) were also assessed bilaterally at these sites before the 17
CPTs. During the CPTs, PPT was measured at the wrist (contralateral to the most painful knee/side of 18
the lower back) and on the knee (ipsilateral). 19
20
Outcome measures 21
Pain intensity from cold water 22
While their foot (ipsilateral to the most painful knee/side of the lower back) was immersed in cold 23
water (mixture of ice and water), participants were asked to rate their pain continuously using a 0-10 24
Page 8 of 38

9
electronic visual analogue scale (eVAS, Aalborg university, Aalborg, Denmark), where 0 indicated no 1
pain at all and 10 the worst pain possible. For the CPT at 2°C, participants were asked to immerse 2
their foot for five minutes and for the CPT at 7°C (7-9°C ± 0.1°C), seven minutes. If a participant could 3
not complete the CPT, the last value carried forward method was used for missing data of the 4
maximum and end pain. The time for each participant to reach their maximum pain from the cold 5
water was recorded. 6
7
PPT and potency of endogenous pain controls 8
The PPTs were measured using a hand held algometer with a circular probe of surface area 1 cm2 9
(Algomed, Medoc, Ramat Yishai, Israel). Participants were given a switch to press as soon as they 10
started to feel pain from the pressure applied at the testing sites. The algometer was applied 11
perpendicularly to the sites, and pressure was gradually increased at a rate of 30KPa/s67 until the 12
participant pressed on the switch. The average of two PPT readings at each site was recorded. 13
14
To measure the potency of endogenous pain controls, CPT was used as conditioning stimulus and 15
PPT as the testing stimulus. The parallel paradigm63 was used. The change in PPT at the contralateral 16
wrist reflected the potency of CPM, while the change in PPT at the ipsilateral knee reflected the 17
potency of local inhibition. The PPTs were measured before and at two minutes after the start of the 18
CPTs. The assessor was blinded to the pain history and the pain adaptability status of the 19
participants. 20
Confounding factors 21
Thermal detection and pain thresholds 22
The cold and warm detection thresholds and cold and heat pain thresholds of the participants were 23
measured using the Thermal Sensory Analyser II (TSA-II, Medoc, Ramat Yishai, Israel) at all six sites. 24
Page 9 of 38

10
Three consecutive cold or warm stimuli were applied using the method of limits (thermode size 1
30x30mm2) starting from a baseline temperature of 32°C and a temperature returning rate of 4°C/s. 2
For the assessment of the cold and warm detection thresholds, the temperature was decreased or 3
increased at a rate of 1°C/s, with an inter-stimulus interval ranging from 3 to 5s7,51. The temperature 4
was changed at a rate of 3°C/s with an interval of 20s for the assessment of cold pain and heat pain 5
thresholds24,26. The safety cut-off temperatures were set at 0°C and 50°C. For participants whose 6
pain thresholds were beyond this range, 0°C and 50°C were recorded as their cold and heat pain 7
thresholds respectively. 8
9
Pain catastrophizing 10
Pain catastrophizing scale (PSC), which is a validated questionnaire46,47, was used to assess the 11
participants’ feeling and thoughts when they were in pain54. Participants were asked to rate how 12
often they experienced the 13 thoughts and feelings listed when they were in pain. The total score 13
was calculated, a higher score indicates a higher extent of catastrophizing. 14
15
Level of depression, anxiety and stress 16
The Depression Anxiety and Stress Scale- 21 items (DASS-21)39 was used. This questionnaire, with 17
proven psychometric properties8, consists of three subscales, each containing seven items for 18
depression, anxiety and stress, respectively. Higher scores represent more severe depression, 19
anxiety or stress. 20
Functional status 21
A validated modified Roland Morris Questionnaire (RMQ) was used30,50. This questionnaire contains 22
24 items of which participants chose those that applied to them. The total number of items chosen 23
was calculated; the greater the score, the more severe the disability6,30. 24
Page 10 of 38
11
1
Sleep quality 2
The sleep quality was measured using the validated questionnaire, Pittsburgh Sleep Quality Index 3
(PSQI)9,21,41. Participants were asked about their sleep pattern in the last month. A score of five or 4
less was associated with a good sleep quality, otherwise a score greater than five was associated 5
with poor sleep quality. 6
7
Skin and water temperatures 8
The skin temperature of the foot was recorded by taking thermal snapshots using an infrared 9
camera with 0.1°C accuracy (Testo 890, thermal imager, Testo, Germany) prior to the CPT. The 10
temperature of the foot to be immersed in the cold pressor was measured at the midpoint between 11
the tip of the middle toe and the anterior aspect of the ankle level with the malleoli. This point was 12
chosen as it was fully immersed in the cold pressor, and the malleoli are easily identified on thermal 13
images. The water temperature was measured using an external probe immersed in the water bath 14
(external probe, Thermo Scientific, USA). 15
16
Adverse events 17
The participants were monitored for any adverse events associated with CPT such as fainting, and 18
the frequency of adverse events were recorded. 19
20
Sample size calculation 21
It was hypothesised that the proportions of PA (39%) and PNA (61%) found in healthy participants67 22
would be applicable to the MSK sample. Based on these proportions, with 80% power and 5% level 23
Page 11 of 38

12
of significance (2-sided) a total of 42 participants were required. Considering that 15% of the 1
participants might not be able to complete the three sessions, we recruited 49 participants. 2
3
Data analysis 4
SPSS version 23.0 (IBM corporation, USA) was used for all analyses. The status of pain adaptability 5
was determined following the protocol from Zheng’s study67. The strength of pain adaptability was 6
measured by subtracting the pain rating (to the cold water) at the end the CPT from the maximum 7
pain during the CPT. A decrease of two or more on a 0-10 pain scale from the maximum pain at the 8
end of CPT was categorised as PA; a decrease of less than two in pain was categorised as PNA. The 9
potency of CPM and local inhibition was assessed by calculating the percentage change in PPT 10
before and at two minutes after the start of the CPTs at the wrist and knee respectively. The 11
correlations of the experimental pain characteristics between the two CPTs were investigated using 12
Pearson correlation to assess the consistency of the measurements of the strength of pain 13
adaptability and potency of CPM across the two CPTs. Paired t-tests were used to compare the 14
strength of pain adaptability and potency of CPM assessed at the CPTs at 2°C and 7°C. The 15
proportions of PA and PNA, and the proportions of participants who completed and those who could 16
not complete the CPTs at 2°C and 7°C were compared using McNemar’s chi square test. The baseline 17
characteristics, PPT and SUPRA of the PA and PNA were compared using independent t-tests and chi 18
square tests. Three-way (group, site and sides) mixed analysis of variance (ANOVA) with two 19
repeated measures (sites, 3 levels and sides, 2 levels) were used to analyse their cold detection 20
threshold, warm detection threshold, cold pain threshold and heat pain threshold. Mixed-design 21
ANOVAs with one repeated measures (time, 7 levels) were used to examine the change in daily 22
average pain, highest daily pain, daily hours in pain, and unpleasantness of pain over seven days in 23
PA and PNA. The correlations between the strength of pain adaptability and baseline clinical pain, 24
thermal pain thresholds and pressure pain thresholds were explored using Pearson correlations. The 25
Page 12 of 38

13
Holm-Bonferroni adjustment was used for multiple comparisons27. The hypotheses were arranged in 1
ascending order according to their p-value, and the p-values were compared with the Holm-2
Bonferroni adjusted significance. A p-value that was smaller than the Holm-Bonferroni adjusted 3
significance was considered significant. The data in the text and tables are reported as mean and 4
standard deviation (SD) and in figures as mean and standard error of mean (SEM). 5
6
Results 7
Recruitment of MSK participants 8
Recruitment was between February 2015 and February 2016. After screening 138 individuals, 49 9
were eligible and were included in the study. Out of the 49 included participants, 25 participants 10
were chronic non-specific low back pain participants and 24 knee osteoarthritis participants (Fig 1). 11
After the first session, the baseline measurements and thermal tests, six participants (five chronic 12
non-specific low back pain and one knee osteoarthritis) dropped out: four due to work or study 13
commitment, one for medical reasons and one for unknown reasons. Their data were excluded from 14
the analysis. 15
16
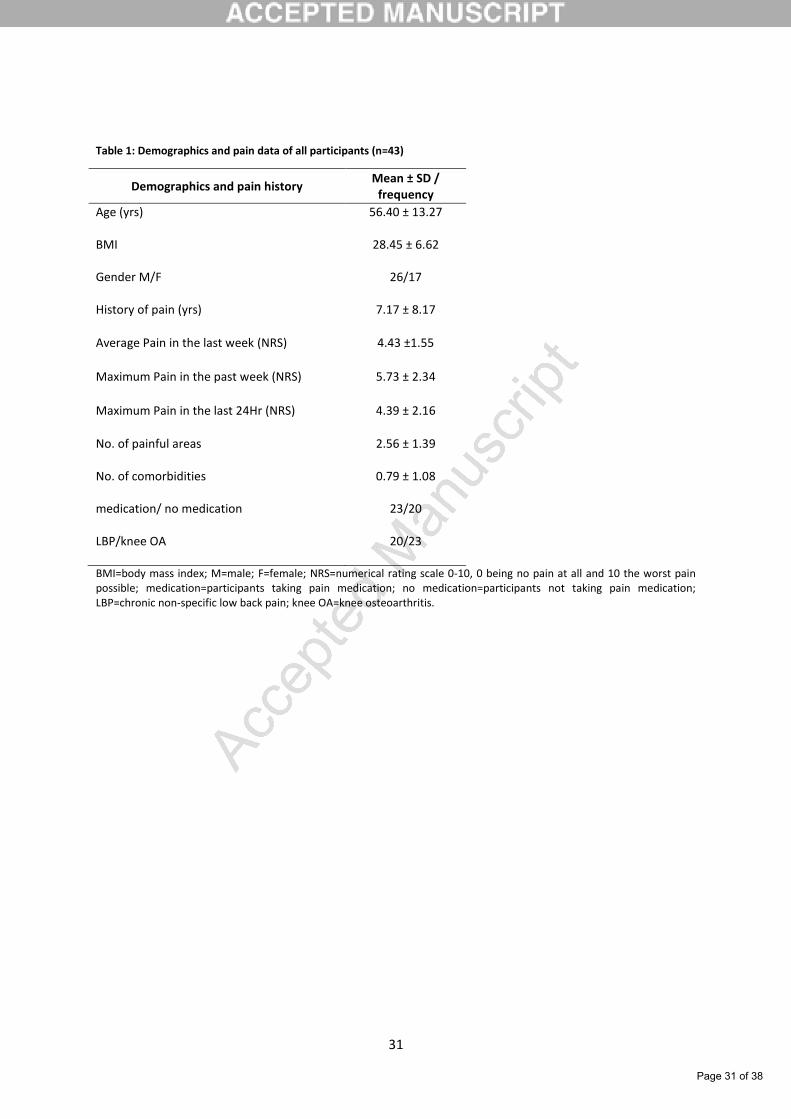
Forty-three (43) participants completed the study. The comparison between participants with 17
chronic non-specific low back pain or knee osteoarthritis resulted in no significant differences in any 18
outcome measures, including strength of the pain adaptability and potency of CPM at both 2°C and 19
7°C CPTs, thermal detection and pain thresholds, PPT, SUPRA, sleep quality and psychological factors 20
(Supplementary materials Tables S1-S5). Therefore, the data presented here are the combined data 21
of participants with chronic non-specific low back pain or knee osteoarthritis, with a total sample of 22
43. All analyses were performed for the 43 MSK participants with a majority of them being male, 23
Page 13 of 38

14
middle aged, overweight, and suffering from moderate pain with a pain history over seven years 1
(Table 1). 2
3
4
CPT 2°C vs CPT 7°C 5
All 43 pain participants were tested with both CPTs (2°C and 7°C) in a random order. Pain induced by 6
the CPT at 2°C was moderately correlated with that induced at 7°C (average pain, r=0.53, p<0.01; 7
maximum pain, r=0.70, p<0.01) (Table 2). There was a statistically significant difference in the 8
maximum pain between the two CPTs, however the difference was very small (0.54 ± 1.31). Strong 9
correlations were found in the time to reach maximum pain (r=0.77, p<0.01) and strength of pain 10
adaptability (r=0.74, p<0.01) between the two CPTs. PA and PNA were identified during both tests. 11
Out of the 43 participants 34 (79%) were consistent in their pain adaptability status, that is, they 12
were either PA or PNA for both CPTs. The remaining 21% (nine participants) were not consistent in 13
their pain adaptability status, meaning these participants were PA in one CPT and PNA in the other. 14
Although there were nine participants who were inconsistent in their pain adaptability status, there 15
was no significant difference in any measure between them and the rest of the participants. The 16
proportions of the PA and PNA, and those who completed the CPTs and those who could not were 17
not statistically different across the two CPTs either (Table 2). No statistically significant difference 18
was observed in the potency of CPM between the two CPTs. Although not all of participants could 19
successfully complete the five minutes at 2°C (n=11, 25.6% could not complete) or seven minutes at 20
7°C (n=8, 18.60% could not complete), no adverse events were reported. 21
22
23
24
Page 14 of 38

15
Characteristics of PA and PNA in MSK participants 1
Since a strong correlation was shown between the strengths of pain adaptability across the two CPTs, 2
and the proportion of PA and PNA between the two CPTS did not differ, in the following sections, PA 3
and PNA identified using the CPT at 2°C will be used to explore the differences between PA and PNA. 4
5
Baseline characteristics 6
Among the 43 participants, 18 PA and 25 PNA were identified using a CPT at 2°C. No significant 7
difference was found between PA and PNA in their demographics, pain history, sleep quality, 8
function, quality of life and psychological factors (Table 3). Similarly, no statistically significant 9
difference was observed between the PA and PNA in room temperature, water temperature or foot 10
temperature. There was a trend that PNA had more comorbidity than PA did (t41=-2.16, p=0.02), there 11
was however no statistically significant difference between the two groups (adjusted criterion of 12
statistical significance <0.01). 13
14
15
Pain adaptability and clinical pain 16
No significant correlations were found between the strength of pain adaptability and features of 17
clinical pain (daily average pain, highest pain, hours in pain, and unpleasantness of pain).No main 18
effect of group were observed for daily average pain, highest pain, hours in pain, and 19
unpleasantness of pain over a 7-day period. However, a statistically significant group by time 20
interaction for the unpleasantness over seven days (F (6,246) = 3.01, p = 0.01) was found (Fig 2). The 21
unpleasantness reduced from 7.12 ±3.22 to 6.06 ±3.47 over 7 days in the PA group whereas it 22
oscillated and stayed relatively high in PNA group (from 9.04 ± 3.89 to 8.80 ± 2.78). 23
24
Page 15 of 38

16
1
Pain adaptability and QST 2
Thermal and mechanical pain thresholds 3
The PPTs and SUPRAs of PA and PNA at all sites before the CPT showed no statistically significantly 4
difference between the two groups, although the PNA appeared to have lower PPTs than the PA 5
(Table 4). Mixed-design ANOVAs resulted in no main effect for groups in either the cold and warm 6
detection thresholds or their cold and heat pain thresholds at all sites (Table S6). 7
8
Correlations between the strength of pain adaptability and baseline thermal detection and pain 9
thresholds and pressure pain thresholds were explored. Significant correlations between the 10
strength of pain adaptability and warm sensation threshold at the right knee (r = 0.37, p = 0.02) and 11
heat pain threshold at the left wrist (r = 0.045, p < 0.01) were observed. The higher the warm 12
detection threshold or heat pain threshold, the stronger the strength of pain adaptability was. 13
14
CPT induced pain 15
The analysis of the experimental pain parameters during the CPT showed no difference in the 16
average (p=0.43) and maximum (p=0.60) pain between PA and PNA (Table 5). A statistically 17
significant difference was found between the PA and PNA in their time to reach maximum pain 18
during the CPT (Table 5), with the PA (65.81 ± 31.54s) reaching their maximum pain faster than the 19
PNA (142.28 ± 133.63s). A significant difference was also observed in their pain difference (strength 20
of pain adaptability) between the maximum experimental pain and the experimental pain at the end 21
of the CPT (Table 5). The PA had a higher pain difference (5.32 ± 1.96) than PNA (0.19 ± 0.47), which 22
is expected as it was based on this outcome measure that PA and PNA were categorized. The time 23
course for pain intensity from the CPT at 2°C is shown in Fig 3. 24
Page 16 of 38

17
1
2
3
Pain adaptability and potency of endogenous pain controls 4
There was no significant difference in the percentage PPT changes at the knee (t41=-1.04, p=0.30) 5
and wrist (t41=0.70, p=0.50) during the CPT between the PA and PNA, thus no difference between 6
the PA and PNA in their potency of either local inhibition or CPM. Further, no significant correlation 7
was found between the strength of pain adaptability and potency of local inhibition (r=0.04, p=0.79) 8
(Fig S2), and strength of pain adaptability and potency of CPM (r=0.23, p=0.14) (Fig S3). 9
Discussion (1499 words) 10
The dichotomy of PA and PNA exists in MSK participants. Both the CPTs at 2°C and at 7°C could be 11
used to identify PA and PNA. Pain adaptability was highly correlated between the two sessions. No 12
adverse events were observed. The time to reach the maximum experimental pain was shorter in 13
the PA than PNA. The PA, but not PNA, reported a gradual reduction in clinical pain unpleasantness 14
over seven days. The two groups did not differ in other measures. The strength of pain adaptability 15
and potency of CPM were not correlated, indicating potentially two forms of endogenous pain 16
controls were involved during the CPT. 17
18
Pain adaptability is reliable and is not temperature dependent 19
PA and PNA exist in healthy humans15,67. This is the first study showing that this dichotomy also 20
exists in MSK individuals. Indeed, about 40% and 60% of PA and PNA individuals were identified in 21
the current study, which is agreement with previous studies in healthy participants, with the 22
proportions of PA and PNA being 39% and 61% respectively in one study67 and 35% and 65% 23
Page 17 of 38

18
respectively in another 15. A similar proportion (31% PA, 69% PNA) was also found when a hot water 1
immersion at 47.5°C for five minutes was used in healthy participants15. This shows that pain 2
adaptability does not seem to be temperature dependent. 3
4
The pain adaptability status was inconsistent in 21% of participants between CPT at 2°C and 7°C. A 5
strong correlation of the strength of pain adaptability between the two sessions implies however 6
that status of pain adaptability is stable and can be reliably assessed. A previous healthy human 7
study15 reported that 65% of the participants were consistent and 35% were not. 8
9
Both CPTs could also be used to induce CPM, although very weak. This can be explained by the 10
impaired CPM in MSK individuals37. The completion rates and the percentage differences in the 11
strength of pain adaptability and potency of CPM did not differ between the two CPTs. No adverse 12
events were reported, being consistent with previous CPT studies18,45. Thus, two CPTs can be used to 13
assess both the strength of pain adaptability and potency of CPM, and are safe for MSK populations. 14
15
Pain adaptability is not associated with CPM 16
In the current study, CPT was used to assess both pain adaptability and potency of CPM. CPM is 17
usually transient or lasts the same duration as the conditioning stimulus55. However, some other 18
studies reported that CPM lasted after the conditioning stimulus terminated, and the duration 19
ranged from 5 minutes to one hour19,23,36,57. One could argue that the decrease in pain rating at the 20
end of the CPT seen in the PA could be the effect of CPM. However, in the current study, the 21
potency of CPM in the PA did not differ from that in the PNA, and no significant correlation was 22
observed between the strength of pain adaptability and potency of CPM. Therefore, the status of 23
pain adaptability was not impacted by the potency of CPM. This observation is consistent with the 24
Page 18 of 38

19
healthy human study67. This shows that these two endogenous pain controls could operate through 1
different mechanisms. 2
3
CPM is the only QST assessing endogenous pain inhibition. Limited studies show that a poorer CPM 4
is related to increased number of pain sites20 in MSK population, and its potency predicts the 5
outcomes of anti-depressants or surgery16,64,65. However, CPM and its association with pain are far 6
from clear. Inefficient CPM does not always lead to more severe pain. Patients with a longer 7
duration of pain history have a more efficient CPM than those with a shorter-pain history22. This 8
observation is resonated with other studies where even within chronic pain patients, the efficiency 9
levels of CPM varied17. Other forms of endogenous pain inhibition may contribute to those variations. 10
Pain adaptability could be one of them. 11
12
Clinical implications of pain adaptability 13
Consistent with the previous healthy human study67, the PA and PNA did not differ in any 14
demographic data, or QST. The only two significant differences were that the PA reached their 15
maximum pain faster than PNA did and reported a gradual reduction of pain unpleasantness over a 16
7-day period. It is likely the association between pain adaptability status and latency to the 17
maximum pain could be due to the time to process the nociceptive input from the noxious CPT and 18
to activate the descending inhibition. Such an inhibition is likely to be sustained in PA individuals 19
contributing to a continuous reduction of pain during the CPT, and a gradual reduction of pain 20
unpleasantness over seven days, which is in contrast to a fluctuation of pain unpleasantness in PNA. 21
This temporal aspect of pain and related inhibition is not assessed in the current QST paradigm. Yet 22
temporal characteristics of pain are important as illustrated in the following two examples. 23
24
Page 19 of 38

20
A previous study, comparing capsaicin-induced hyperalgesia between younger and older healthy 1
participants, found a delayed report of maximum experimental pain in the older group66. Both 2
groups had similar pain ratings and flare response to topical capsaicin. However, there was a trend 3
that the older participants were slower in reaching their maximum experimental pain. Further, the 4
secondary hyperalgesia induced by capsaicin (area of punctate hyperalgesia) was maintained for a 5
significantly longer duration in the older than in the younger participants, and was not reversed by 6
local anaesthesia66. This means that the younger participants reached their maximum pain faster, 7
and also presented with pain inhibition sooner than the older participants. It was proposed that 8
those differences in the latency of reporting maximum pain and maintained hyperalgesia might be 9
due to reduced capacity of the central nervous system to activate the inhibition systems in the older 10
participants66. Similarly, the PNA could have a reduced capacity to activate the inhibitory systems, 11
hence the longer time to reach the maximum pain and the lack of pain inhibition during the CPT. 12
13
This lack of pain inhibition might impact on the capability of individuals to cope with a new episode 14
of pain. A recent study28 followed up the day to day pain experience of post-surgical patients for 60 15
days and found significant individual variations in how post-operative pain was reduced and at which 16
time point. Significant pain reduction varied from day 10 to day 21 post-surgically, with some 17
patients presenting with a fast reduction whereas others a slow reduction. The authors commented 18
that currently there is no way to predict who would be in which category. Previous research shows 19
the potency of pre-surgical CPM may predict the severity of post-surgical pain. It is unknown if pre-20
surgical pain adaptability might help predict the time course of post-surgical pain. 21
22
Compared with PA, PNA tended to suffer from more comorbidities, which might interfere with this 23
activation-inhibition loop. A recent study on knee osteoarthritis identified a subgroup of patients 24
Page 20 of 38

21
with more comorbidities and more severe pain33, suggesting that comorbidity indeed could be 1
related to pain sensitivity and hence pain adaptability. However, this hypothesis should be debated 2
as pain adaptability was also identified in healthy participants without comorbidities15,67. 3
4
Pain sensitivity and pain modulation are physiological responses that are influenced by psychological 5
behaviours1,12,44,59 and genetics and environment43. PA and PNA did not however differ in anxiety, 6
depression, stress and pain catastrophizing measured in the current study. Further studies exploring 7
the influence of psychological factors, such as suggestibility, coping strategies or expectations, are 8
needed. 9
Limitations 10
This study has a few limitations. Firstly, the sample size might not be large enough to achieve 11
statistical differences in some outcome measures. Using the PPT results at the wrists from the 12
current study with 80% power and α level of 0.05, the minimum required total sample size to 13
achieve significance was 84. Secondly, some participants could not complete the CPTs and did not 14
have a PPT measurement at the two minutes time point. Their PPT was considered unchanged at the 15
two minutes time point and thus the potency of their CPM could have been underestimated. 16
However, removing such participants from the analysis did not change the results. Lastly, two 17
participants reported a low level of pain rating to CPT and the rating did not change during the 18
whole test. They were categorized as PNA. It is possible that this lack of change might be another 19
form of adaptive behaviour. This could be the reason why not much difference was found between 20
the PA and PNA. However, when those participants were removed from the analysis, this did not 21
impact on the current findings. 22
23
Page 21 of 38

22
Conclusions 1
The pain adaptive and pain non-adaptive exist in patients with chronic musculoskeletal pain. A cold 2
pressor test at either 2°C or 7°C is a reliable method to measure this form of inhibition. Pain 3
adaptability is dissociated with the potency of CPM; and could reflect the temporal aspect of pain 4
inhibition that is not explained by CPM. It would be important to replicate this study with less painful 5
stimuli than CPT, while controlling for psychological factors during the stimulation. The relevance of 6
pain adaptability in predicting the time course of post-operative pain and in treatment response 7
should be further explored. 8
9
10
Acknowledgements 11
We would like to thank Matthew Wong for his technical support, Samantha Harman for her help in 12
the enrolment of participants, and Thomas Graven-Nielsen for his comments on the data analysis. 13
Our gratitude also goes to all the participants who took part in the study. The authors declare that 14
no conflict of interest was involved. 15
16
Page 22 of 38
23
References
1 Ahles TA, Blanchard EB, Leventhal H. Cognitive control of pain: Attention to the sensory aspects of the cold pressor stimulus. Cognitive Therapy and Research 7:159-177, 1983.
2 Allen KD, Golightly YM. Epidemiology of osteoarthritis: state of the evidence. Current opinion in rheumatology 27:276-283, 2015.
3 Altman R, Asch E, Bloch D, Bole G, Borenstein D, Brandt K, Christy W, Cooke TD, Greenwald R, Hochberg M, Howell D, Kaplan D, Koopman W, Longley S, Mankin H, McShane D, Medsger T, Meenan R, Mikkelsen W, Moskowitz R, Murphy W, Rothschild B, Segal M, Sokoloff L, Wolfe F. Development of criteria for the classification and reporting of osteoarthritis. Classification of osteoarthritis of the knee. Diagnostic and Therapeutic Criteria Committee of the American Rheumatism Association. Arthritis Rheum 29:1039-1049, 1986.
4 Arendt-Nielsen L, Egsgaard LL, Petersen KK, Eskehave TN, Graven-Nielsen T, Hoeck HC, Simonsen O. A mechanism-based pain sensitivity index to characterize knee osteoarthritis patients with different disease stages and pain levels. Eur J Pain 19:1406-1417, 2015.
5 Arendt-Nielsen L, Nie H, Laursen MB, Laursen BS, Madeleine P, Simonsen OH, Graven-Nielsen T. Sensitization in patients with painful knee osteoarthritis. Pain 149:573-581, 2010.
6 Asghari Aa, Nicholas MKb. Pain self-efficacy beliefs and pain behaviour. A prospective study. Pain 94:85-100, 2001.
7 Blumenstiel K, Gerhardt A, Rolke R, Bieber C, Tesarz J, Friederich HC, Eich W, Treede RD. Quantitative sensory testing profiles in chronic back pain are distinct from those in fibromyalgia. Clin J Pain 27:682-690, 2011.
8 Brown TA, Chorpita BF, Korotitsch W, Barlow DH. Psychometric properties of the Depression Anxiety Stress Scales (DASS) in clinical samples. Behav Res Ther 35:79-89, 1997.
9 Buysse DJ, Reynolds CF, 3rd, Monk TH, Berman SR, Kupfer DJ. The Pittsburgh Sleep Quality Index: a new instrument for psychiatric practice and research. Psychiatry Res 28:193-213, 1989.
10 Cardoso JS, Riley JL, 3rd, Glover T, Sibille KT, Bartley EJ, Goodin BR, Bulls HW, Herbert M, Addison AS, Staud R, Redden DT, Bradley LA, Fillingim RB, Cruz-Almeida Y. Experimental pain phenotyping in community-dwelling individuals with knee osteoarthritis. Pain 157:2104-2114, 2016.
11 Chou R, Qaseem A, Snow V, Casey D, Cross JT, Jr., Shekelle P, Owens DK. Diagnosis and treatment of low back pain: a joint clinical practice guideline from the American College of Physicians and the American Pain Society. Ann Intern Med 147:478-491, 2007.
12 Coghill RC, McHaffie JG, Yen Y-F. Neural correlates of interindividual differences in the subjective experience of pain. Proceedings of the National Academy of Sciences 100:8538-8542, 2003.
13 Correa JB, Costa LO, de Oliveira NT, Sluka KA, Liebano RE. Central sensitization and changes in conditioned pain modulation in people with chronic nonspecific low back pain: a case-control study. Exp Brain Res 233:2391-2399, 2015.
14 Cruz-Almeida Y, King CD, Goodin BR, Sibille KT, Glover TL, Riley JL, Sotolongo A, Herbert MS, Schmidt J, Fessler BJ, Redden DT, Staud R, Bradley LA, Fillingim RB. Psychological profiles and pain characteristics of older adults with knee osteoarthritis. Arthritis Care and Research 65:1786-1794, 2013.
15 Devoize L, Chalaye P, Lafrenaye S, Marchand S, Dallel R. Relationship between adaptation and cardiovascular response to tonic cold and heat pain Adaptability to tonic pain and cardiovascular responses. Eur J Pain, 2015.
16 Edwards RR, Dolman AJ, Martel MO, Finan PH, Lazaridou A, Cornelius M, Wasan AD. Variability in conditioned pain modulation predicts response to NSAID treatment in patients with knee osteoarthritis. BMC Musculoskelet Disord 17:284, 2016.
17 Egsgaard LL, Eskehave TN, Bay-Jensen AC, Hoeck HC, Arendt-Nielsen L. Identifying specific profiles in patients with different degrees of painful knee osteoarthritis based on serological
Page 23 of 38

24
biochemical and mechanistic pain biomarkers: a diagnostic approach based on cluster analysis. Pain 156:96-107, 2015.
18 Finan PH, Buenaver LF, Bounds SC, Hussain S, Park RJ, Haque UJ, Campbell CM, Haythornthwaite JA, Edwards RR, Smith MT. Discordance between pain and radiographic severity in knee osteoarthritis: findings from quantitative sensory testing of central sensitization. Arthritis Rheum 65:363-372, 2013.
19 Fujii K, Motohashi K, Umino M. Heterotopic ischemic pain attenuates somatosensory evoked potentials induced by electrical tooth stimulation: diffuse noxious inhibitory controls in the trigeminal nerve territory. Eur J Pain 10:495-504, 2006.
20 Gerhardt A, Eich W, Treede RD, Tesarz J. Conditioned pain modulation in patients with nonspecific chronic back pain with chronic local pain, chronic widespread pain, and fibromyalgia. Pain 158:430-439, 2017.
21 Grandner MA, Kripke DF, Yoon I-Y, Youngstedt SD. Criterion validity of the Pittsburgh Sleep Quality Index: Investigation in a non-clinical sample. Sleep and biological rhythms 4:129-139, 2006.
22 Granovsky Y, Nahman-Averbuch H, Khamaisi M, Granot M. Efficient conditioned pain modulation despite pain persistence in painful diabetic neuropathy. Pain Reports 2:e592, 2017.
23 Graven-Nielsen T, Babenko V, Svensson P, Arendt-Nielsen L. Experimentally induced muscle pain induces hypoalgesia in heterotopic deep tissues, but not in homotopic deep tissues. Brain Res 787:203-210, 1998.
24 Hagander LG, Midani HA, Kuskowski MA, Parry GJ. Quantitative sensory testing: effect of site and skin temperature on thermal thresholds. Clin Neurophysiol 111:17-22, 2000.
25 Harkness EF, Macfarlane GJ, Silman AJ, McBeth J. Is musculoskeletal pain more common now than 40 years ago?: Two population-based cross-sectional studies. Rheumatology (Oxford) 44:890-895, 2005.
26 Heldestad V, Linder J, Sellersjo L, Nordh E. Reproducibility and influence of test modality order on thermal perception and thermal pain thresholds in quantitative sensory testing. Clin Neurophysiol 121:1878-1885, 2010.
27 Holm S. A Simple Sequentially Rejective Multiple Test Procedure. Scandinavian Journal of Statistics 6:65-70, 1979.
28 Houle TT, Miller S, Lang JE, Booth JL, Curry RS, Harris L, Aschenbrenner CA, Eisenach JC. Day-to-day experience in resolution of pain after surgery. Pain, 2017.
29 Hudon C, Fortin M, Vanasse A. Cumulative Illness Rating Scale was a reliable and valid index in a family practice context. Journal of Clinical Epidemiology 58:603-608, 2005.
30 Jensen MP, Strom SE, Turner JA, Romano JM. Validity of the Sickness Impact Profile Roland scale as a measure of dysfunction in chronic pain patients. Pain 50:157-162, 1992.
31 Kashima K, Rahman OI, Sakoda S, Shiba R. Increased pain sensitivity of the upper extremities of TMD patients with myalgia to experimentally-evoked noxious stimulation: possibility of worsened endogenous opioid systems. Cranio 17:241-246, 1999.
32 King CD, Sibille KT, Goodin BR, Cruz-Almeida Y, Glover TL, Bartley E, Riley JL, Herbert MS, Sotolongo A, Schmidt J, Fessler BJ, Redden DT, Staud R, Bradley LA, Fillingim RB. Experimental pain sensitivity differs as a function of clinical pain severity in symptomatic knee osteoarthritis. Osteoarthritis Cartilage 21:1243-1252, 2013.
33 Kittelson AJ, Stevens-Lapsley JE, Schmiege SJ. Determination of Pain Phenotypes in Knee Osteoarthritis: A Latent Class Analysis Using Data From the Osteoarthritis Initiative. Arthritis Care & Research 68:612-620, 2016.
34 Koes BW, van Tulder MW, Thomas S. Diagnosis and treatment of low back pain. Bmj 332:1430-1434, 2006.
35 Kosek E, Ordeberg G. Lack of pressure pain modulation by heterotopic noxious conditioning stimulation in patients with painful osteoarthritis before, but not following, surgical pain relief. Pain 88:69-78, 2000.
Page 24 of 38

25
36 Lewis GN, Heales L, Rice DA, Rome K, McNair PJ. Reliability of the conditioned pain modulation paradigm to assess endogenous inhibitory pain pathways. Pain Res Manag 17:98-102, 2012.
37 Lewis GN, Rice DA, McNair PJ. Conditioned pain modulation in populations with chronic pain: a systematic review and meta-analysis. J Pain 13:936-944, 2012.
38 Linn BS, Linn MW, Gurel L. Cumulative illness rating scale. J Am Geriatr Soc 16:622-626, 1968. 39 Lovibond SH, Lovibond PF. Manual for the Depression Anxiety Stress Scales Sydney: Psychology
foundation, 1995. 40 Meucci RD, Fassa AG, Faria NMX. Prevalence of chronic low back pain: systematic review. Revista
de Saúde Pública 49:1-1, 2015. 41 Mollayeva T, Thurairajah P, Burton K, Mollayeva S, Shapiro CM, Colantonio A. The Pittsburgh
sleep quality index as a screening tool for sleep dysfunction in clinical and non-clinical samples: A systematic review and meta-analysis. Sleep Med Rev 25:52-73, 2016.
42 Neziri AY, Curatolo M, Limacher A, Nuesch E, Radanov B, Andersen OK, Arendt-Nielsen L, Juni P. Ranking of parameters of pain hypersensitivity according to their discriminative ability in chronic low back pain. Pain 153:2083-2091, 2012.
43 Nielsen CS, Stubhaug A, Price DD, Vassend O, Czajkowski N, Harris JR. Individual differences in pain sensitivity: Genetic and environmental contributions. PAIN 136:21-29, 2008.
44 Nir RR, Yarnitsky D, Honigman L, Granot M. Cognitive manipulation targeted at decreasing the conditioning pain perception reduces the efficacy of conditioned pain modulation. PAIN 153:170-176, 2012.
45 Nouwen A, Cloutier C, Kappas A, Warbrick T, Sheffield D. Effects of focusing and distraction on cold pressor-induced pain in chronic back pain patients and control subjects. J Pain 7:62-71, 2006.
46 Osman A, Barrios FX, Gutierrez PM, Kopper BA, Merrifield T, Grittmann L. The Pain Catastrophizing Scale: further psychometric evaluation with adult samples. J Behav Med 23:351-365, 2000.
47 Osman A, Barrios FX, Kopper BA, Hauptmann W, Jones J, O'Neill E. Factor structure, reliability, and validity of the Pain Catastrophizing Scale. J Behav Med 20:589-605, 1997.
48 Pickering G, Pereira B, Dufour E, Soule S, Dubray C. Impaired modulation of pain in patients with postherpetic neuralgia. Pain Res Manag 19:e19-23, 2014.
49 Potvin S, Larouche A, Normand E, de Souza JB, Gaumond I, Marchand S, Grignon S. No relationship between the ins del polymorphism of the serotonin transporter promoter and pain perception in fibromyalgia patients and healthy controls. Eur J Pain 14:742-746, 2010.
50 Roland M, Morris R. A study of the natural history of back pain. Part I: development of a reliable and sensitive measure of disability in low-back pain. Spine (Phila Pa 1976) 8:141-144, 1983.
51 Rolke R, Baron R, Maier C, Tolle TR, Treede RD, Beyer A, Binder A, Birbaumer N, Birklein F, Botefur IC, Braune S, Flor H, Huge V, Klug R, Landwehrmeyer GB, Magerl W, Maihofner C, Rolko C, Schaub C, Scherens A, Sprenger T, Valet M, Wasserka B. Quantitative sensory testing in the German Research Network on Neuropathic Pain (DFNS): standardized protocol and reference values. Pain 123:231-243, 2006.
52 Staud R. Evidence for shared pain mechanisms in osteoarthritis, low back pain, and fibromyalgia. Curr Rheumatol Rep 13:513-520, 2011.
53 Staud R, Robinson ME, Vierck CJ, Jr., Price DD. Diffuse noxious inhibitory controls (DNIC) attenuate temporal summation of second pain in normal males but not in normal females or fibromyalgia patients. Pain 101:167-174, 2003.
54 Sullivan MJL, Bishop SR, Pivik J. The Pain Catastrophizing Scale: Development and validation. Psychological Assessment 7:524-532, 1995.
55 Svensson P, Hashikawa CH, Casey KL. Site- and modality-specific modulation of experimental muscle pain in humans. Brain Res 851:32-38, 1999.
Page 25 of 38

26
56 Tesarz J, Gerhardt A, Schommer K, Treede RD, Eich W. Alterations in endogenous pain modulation in endurance athletes: an experimental study using quantitative sensory testing and the cold-pressor task. Pain 154:1022-1029, 2013.
57 Tuveson B, Leffler AS, Hansson P. Time dependent differences in pain sensitivity during unilateral ischemic pain provocation in healthy volunteers. Eur J Pain 10:225-232, 2006.
58 Vos T, Flaxman AD, Naghavi M, Lozano R, Michaud C, Ezzati M, Shibuya K, Salomon JA, Abdalla S, Aboyans V, Abraham J, Ackerman I, Aggarwal R, Ahn SY, Ali MK, AlMazroa MA, Alvarado M, Anderson HR, Anderson LM, Andrews KG, Atkinson C, Baddour LM, Bahalim AN, Barker-Collo S, Barrero LH, Bartels DH, Basáñez M-G, Baxter A, Bell ML, Benjamin EJ, Bennett D, Bernabé E, Bhalla K, Bhandari B, Bikbov B, Abdulhak AB, Birbeck G, Black JA, Blencowe H, Blore JD, Blyth F, Bolliger I, Bonaventure A, Boufous S, Bourne R, Boussinesq M, Braithwaite T, Brayne C, Bridgett L, Brooker S, Brooks P, Brugha TS, Bryan-Hancock C, Bucello C, Buchbinder R, Buckle G, Budke CM, Burch M, Burney P, Burstein R, Calabria B, Campbell B, Canter CE, Carabin H, Carapetis J, Carmona L, Cella C, Charlson F, Chen H, Cheng AT-A, Chou D, Chugh SS, Coffeng LE, Colan SD, Colquhoun S, Colson KE, Condon J, Connor MD, Cooper LT, Corriere M, Cortinovis M, de Vaccaro KC, Couser W, Cowie BC, Criqui MH, Cross M, Dabhadkar KC, Dahiya M, Dahodwala N, Damsere-Derry J, Danaei G, Davis A, De Leo D, Degenhardt L, Dellavalle R, Delossantos A, Denenberg J, Derrett S, Des Jarlais DC, Dharmaratne SD, Dherani M, Diaz-Torne C, Dolk H, Dorsey ER, Driscoll T, Duber H, Ebel B, Edmond K, Elbaz A, Ali SE, Erskine H, Erwin PJ, Espindola P, Ewoigbokhan SE, Farzadfar F, Feigin V, Felson DT, Ferrari A, Ferri CP, Fèvre EM, Finucane MM, Flaxman S, Flood L, Foreman K, Forouzanfar MH, Fowkes FGR, Franklin R, Fransen M, Freeman MK, Gabbe BJ, Gabriel SE, Gakidou E, Ganatra HA, Garcia B, Gaspari F, Gillum RF, Gmel G, Gosselin R, Grainger R, Groeger J, Guillemin F, Gunnell D, Gupta R, Haagsma J, Hagan H, Halasa YA, Hall W, Haring D, Haro JM, Harrison JE, Havmoeller R, Hay RJ, Higashi H, Hill C, Hoen B, Hoffman H, Hotez PJ, Hoy D, Huang JJ, Ibeanusi SE, Jacobsen KH, James SL, Jarvis D, Jasrasaria R, Jayaraman S, Johns N, Jonas JB, Karthikeyan G, Kassebaum N, Kawakami N, Keren A, Khoo J-P, King CH, Knowlton LM, Kobusingye O, Koranteng A, Krishnamurthi R, Lalloo R, Laslett LL, Lathlean T, Leasher JL, Lee YY, Leigh J, Lim SS, Limb E, Lin JK, Lipnick M, Lipshultz SE, Liu W, Loane M, Ohno SL, Lyons R, Ma J, Mabweijano J, MacIntyre MF, Malekzadeh R, Mallinger L, Manivannan S, Marcenes W, March L, Margolis DJ, Marks GB, Marks R, Matsumori A, Matzopoulos R, Mayosi BM, McAnulty JH, McDermott MM, McGill N, McGrath J, Medina-Mora ME, Meltzer M, Memish ZA, Mensah GA, Merriman TR, Meyer A-C, Miglioli V, Miller M, Miller TR, Mitchell PB, Mocumbi AO, Moffitt TE, Mokdad AA, Monasta L, Montico M, Moradi-Lakeh M, Moran A, Morawska L, Mori R, Murdoch ME, Mwaniki MK, Naidoo K, Nair MN, Naldi L, Narayan KMV, Nelson PK, Nelson RG, Nevitt MC, Newton CR, Nolte S, Norman P, Norman R, O'Donnell M, O'Hanlon S, Olives C, Omer SB, Ortblad K, Osborne R, Ozgediz D, Page A, Pahari B, Pandian JD, Rivero AP, Patten SB, Pearce N, Padilla RP, Perez-Ruiz F, Perico N, Pesudovs K, Phillips D, Phillips MR, Pierce K, Pion S, Polanczyk GV, Polinder S, Pope Iii CA, Popova S, Porrini E, Pourmalek F, Prince M, Pullan RL, Ramaiah KD, Ranganathan D, Razavi H, Regan M, Rehm JT, Rein DB, Remuzzi G, Richardson K, Rivara FP, Roberts T, Robinson C, De Leòn FR, Ronfani L, Room R, Rosenfeld LC, Rushton L, Sacco RL, Saha S, Sampson U, Sanchez-Riera L, Sanman E, Schwebel DC, Scott JG, Segui-Gomez M, Shahraz S, Shepard DS, Shin H, Shivakoti R, Singh D, Singh GM, Singh JA, Singleton J, Sleet DA, Sliwa K, Smith E, Smith JL, Stapelberg NJC, Steer A, Steiner T, Stolk WA, Stovner LJ, Sudfeld C, Syed S, Tamburlini G, Tavakkoli M, Taylor HR, Taylor JA, Taylor WJ, Thomas B, Thomson WM, Thurston GD, Tleyjeh IM, Tonelli M, Towbin JA, Truelsen T, Tsilimbaris MK, Ubeda C, Undurraga EA, van der Werf MJ, van Os J, Vavilala MS, Venketasubramanian N, Wang M, Wang W, Watt K, Weatherall DJ, Weinstock MA, Weintraub R, Weisskopf MG, Weissman MM, White RA, Whiteford H, Wiersma ST, Wilkinson JD, Williams HC, Williams SRM, Witt E, Wolfe F, Woolf AD, Wulf S, Yeh P-H, Zaidi AKM, Zheng Z-J, Zonies D, Lopez AD, Murray CJL. Years lived with disability (YLDs) for 1160 sequelae of
Page 26 of 38

27
289 diseases and injuries 1990–2010: a systematic analysis for the Global Burden of Disease Study 2010. The Lancet 380:2163-2196, 2012.
59 Wager TD, Rilling JK, Smith EE, Sokolik A, Casey KL, Davidson RJ, Kosslyn SM, Rose RM, Cohen JD. Placebo-Induced Changes in fMRI in the Anticipation and Experience of Pain. Science 303:1162, 2004.
60 Wilder-Smith CH, Robert-Yap J. Abnormal endogenous pain modulation and somatic and visceral hypersensitivity in female patients with irritable bowel syndrome. World J Gastroenterol 13:3699-3704, 2007.
61 Wolf S, Hardy JD. STUDIES ON PAIN. OBSERVATIONS ON PAIN DUE TO LOCAL COOLING AND ON FACTORS INVOLVED IN THE "COLD PRESSOR" EFFECT. J Clin Invest 20:521-533, 1941.
62 Yarnitsky D. Role of endogenous pain modulation in chronic pain mechanisms and treatment. Pain 156 Suppl 1:S24-31, 2015.
63 Yarnitsky D, Arendt-Nielsen L, Bouhassira D, Edwards RR, Fillingim RB, Granot M, Hansson P, Lautenbacher S, Marchand S, Wilder-Smith O. Recommendations on terminology and practice of psychophysical DNIC testing. Eur J Pain 14:339-339, 2010.
64 Yarnitsky D, Crispel Y, Eisenberg E, Granovsky Y, Ben-Nun A, Sprecher E, Best LA, Granot M. Prediction of chronic post-operative pain: pre-operative DNIC testing identifies patients at risk. Pain 138:22-28, 2008.
65 Yarnitsky D, Granot M, Nahman-Averbuch H, Khamaisi M, Granovsky Y. Conditioned pain modulation predicts duloxetine efficacy in painful diabetic neuropathy. Pain 153:1193-1198, 2012.
66 Zheng Z, Gibson SJ, Helme RD, McMeeken JM. The effect of local anaesthetic on age-related capsaicin-induced mechanical hyperalgesia--a randomised, controlled study. Pain 144:101-109, 2009.
67 Zheng Z, Wang K, Yao D, Xue CC, Arendt-Nielsen L. Adaptability to pain is associated with potency
of local pain inhibition, but not conditioned pain modulation: a healthy human study. Pain
155:968-976, 2014.
Page 27 of 38

28
Figure legends
Fig 1: Study procedure
LBP= chronic non-specific low back pain participants; OA=knee osteoarthritis participants; 2°C= 2-4°C
cold pressor test; 7°C=7-9°C cold pressor test; CPM=conditioned pain modulation; Sessions 1, 2 and
3 were one week apart.
Page 28 of 38

29
Fig 2: Time courses for unpleasantness of clinical pain for PA and PNA groups
PA=pain adaptive; PNA=pain non-adaptive; NRS=numerical rating scale; *=significant group by time
interaction.
0
2
4
6
8
10
12
14
1 2 3 4 5 6 7
Un
ple
asan
tne
ss (
NR
S 0
-20
)
Time (Day)
PA
PNA
Page 29 of 38

30
Fig 3: Time courses for pain intensity from the CPT at 2°C for PA and PNA groups
PA=pain adaptive; PNA=pain non-adaptive; VAS=visual analogue scale.
0
1
2
3
4
5
6
7
8
9
10
1min 2min
VA
S (0
-10
)
Time (min)
PA
PNA
Page 30 of 38
31
Table 1: Demographics and pain data of all participants (n=43)
Demographics and pain history Mean ± SD /
frequency
Age (yrs) 56.40 ± 13.27
BMI 28.45 ± 6.62
Gender M/F 26/17
History of pain (yrs) 7.17 ± 8.17
Average Pain in the last week (NRS) 4.43 ±1.55
Maximum Pain in the past week (NRS) 5.73 ± 2.34
Maximum Pain in the last 24Hr (NRS) 4.39 ± 2.16
No. of painful areas 2.56 ± 1.39
No. of comorbidities 0.79 ± 1.08
medication/ no medication 23/20
LBP/knee OA 20/23
BMI=body mass index; M=male; F=female; NRS=numerical rating scale 0-10, 0 being no pain at all and 10 the worst pain possible; medication=participants taking pain medication; no medication=participants not taking pain medication; LBP=chronic non-specific low back pain; knee OA=knee osteoarthritis.
Page 31 of 38

32
Table 2: Pain parameters during CPT and items to assess the feasibility of CPT at 2°C and CPT at 7°C (mean ± SD)
Pain parameters and items to assess feasibility
CPT2 (n=43) CPT7 (n=43) %
difference Pearson
correlation, r p-
value t1-
value p-
value Adjusted
significance1
Average pain from CPT (VAS) 6.08 ± 1.97 5.76 ± 1.83 5.40 0.53 <0.01* 1.14 0.26 0.03
Maximum Pain from CPT (VAS) 8.88 ± 1.77 8.34 ± 1.60 6.27 0.7 <0.01* 2.72 0.01* 0.02
Time to reach Maximum Pain (s) 110.27 ± 109.83 153.68 ± 143.48 32.89 0.77 <0.01* -3.08 <0.01* 0.01
Strength of Pain adaptability (Max-
End) 2.34 ± 2.87 2.27 ± 2.81 3.04 0.74 <0.01* 0.22 0.83 0.05
No. of PA/PNA 18/25 17/26 - McNemar's test 1.00 - - 0.05
No. of completed/ not completed 32/11 35/8 - McNemar's test 0.45 - - 0.05
Potency of CPM (%PPT Change) 4.99 ± 27.52 4.34 ± 28.36 13.93 0.11 0.48 0.12 0.91 0.05
No. of adverse events 0 0 - - - - - 0.05
CPT2= cold pressor test at 2°C; CPT7=cold pressor test at 7°C; VAS= visual analogue scale 0-10, 0 being no pain at all and 10 the worst pain possible; Max-End= difference between maximum pain and pain at the end of the cold pressor test; PA=pain adaptive; PNA=pain non-adaptive; completed=participants who completed the cold pressor test; not completed=participants who did not complete the cold pressor test; PPT=pressure pain threshold; % difference= |CPT2-CPT7|*100/average of CPT2 and CPT7; *=significant p values; 1= Holm-Bonferroni adjusted criterion of statistical significance (significant p values are less than these values).
Page 32 of 38

33
Page 33 of 38

34
Table 3: Baseline characteristics of PA and PNA (mean ± SD)
Baseline characteristics PA (n=18) PNA (n=25) X2
1/ t41-test p value Adjusted significance1
Age (yrs) 55.67 ± 14.07 56.92 ± 12.93 -0.3 0.76 0.01
BMI 28.01 ± 3.58 28.77 ± 8.21 -0.37 0.72 0.01
Gender M/F 12/6 14/11 0.5 0.48 0.01
History of pain (yrs) 5.51 ± 6.72 8.37 ± 9.01 -1.14 0.26 <0.01
Average Pain over past 7 day (NRS 0-10) 3.27 ± 1.61 3.92 ± 1.81 -1.23 0.23 <0.01
Maximum Pain over past 7 day (NRS 0-10) 4.44 ± 1.75 5.02 ± 1.80 -1.04 0.31 0.01
Unpleasantness of pain over past 7 day (NRS 10-
20) 7.00 ± 2.86 8.11 ± 2.43 -1.37 0.18 0.01
Daily duration of pain over past 7 day (hrs) 6.19 ± 6.17 6.88 ± 4.36 -0.41 0.68 0.01
Maximum Pain in the last 24Hr (NRS) 3.76 ± 2.13 4.84 ± 2.11 -1.64 0.11 <0.01
No. of painful areas2 2.33 ± 1.41 2.72 ± 1.37 -0.9 0.37 <0.01
No. of comorbidities3 0.39 ± 0.50 1.08 ± 1.29 -2.16 0.02 <0.01
Sleep quality (PSQI) 6.67 ± 3.87 6.56 ± 3.49 0.09 0.93 0.03
Function (RMQ) 6.72 ± 4.73 6.96 ± 4.35 -0.17 0.87 0.01
Page 34 of 38

35
Physical health (SF-36) 45.79 ± 5.33 42.71 ± 8.27 1.48 0.15 <0.01
Mental health (SF-36) 53.70 ± 6.63 53.15 ± 7.53 0.25 0.81 0.01
Pain catastrophizing (PCS) 13.67 ± 10.37 16.24 ± 10.88 -0.78 0.44 <0.01
Depression (DASS21) 2.17 ± 2.62 2.64 ± 3.90 -0.45 0.66 0.01
Anxiety (DASS21) 1.44 ± 1.65 2.00 ± 2.16 -0.91 0.37 <0.01
Stress (DASS21) 4.06 ± 3.96 4.00 ± 4.12 0.04 0.96 0.05
Room temperature (°C) 22.61 ± 0.40 22.83 ± 0.45 -1.64 0.11 <0.01
Water temperature at start of CPT (°C) 2.69 ± 0.32 2.58 ± 0.27 1.22 0.23 <0.01
Foot temperature at start of CPT (°C) 21.95 ± 0.80
^ 22.00 ± 0.71
$ -0.16
# 0.87 0.02
LBP/knee OA 7/11 13/12 0.29 0.59 0.01
PA=pain adaptive; PNA=pain non-adaptive; BMI=body mass index; M=male; F=female; NRS 0-10=numerical rating scale 0-10, 0 being no pain at all and 10 the worst pain possible; NRS 0-20=numerical rating scale 0-20, 0 being neutral and 20 intolerable unpleasantness; PSQI=Pittsburgh Sleep Quality index; RMQ= modified Roland Morris Questionnaire; SF-36= short form 36 items survey, to measure quality of life; PCS=Pain Catastrophizing Scale; DASS21=Depression, Anxiety and Stress Scale 21 items; ^= sample size is 15; $= sample size is 20; #= degree of freedom is t33; LBP= chronic non-specific low back pain; OA=osteoarthritis; 1= Holm-Bonferroni adjusted criterion of statistical significance (significant p values are less than these values); 2=assessed based on the 10 body area method
20,25,56; 3=assessed using the Cumulative Illness Rating Scale
29,38.
Page 35 of 38

36
Table 4: PPT and SUPRA in PA and PNA before CPT (mean ± SD)
Psychophysical tests Sites Sides PA (n=18) PNA (n=25) t41-test p value Adjusted significance1
Cohen's d
PPT (Kgf/cm2)
Knees
Right 3.83 ± 1.32 3.01 ± 1.23 2.08 0.04 <0.01 0.64
Left 3.51 ± 1.13 2.79 ± 0.95 2.28 0.03 <0.01 0.69
Wrists
Right 3.22 ± 1.10 2.92 ± 0.96 0.97 0.34 0.01 0.30
Left 2.98 ± 1.03 2.81 ± 0.97 0.55 0.58 0.01 0.17
Lower back
Right 4.28 ± 1.91 3.42 ± 1.39 1.69 0.10 0.01 0.51
Left 3.74 ± 1.71 3.41 ± 1.36 0.59 0.48 0.01 0.22
SUPRA (NRS)
Knees
Right 4.42 ± 1.95 3.82 ± 2.24 0.91 0.37 0.01 0.28
Left 3.92 ± 1.80 3.80 ± 2.30 0.18 0.86 0.01 0.06
Wrists
Right 3.67 ± 2.40 3.74 ± 2.12 -0.11 0.92 0.05 0.03
Left 3.22 ± 1.82 3.12 ± 2.45 0.15 0.88 0.02 0.05
Lower back
Right 3.50 ± 2.36 3.58 ± 2.35 -0.11 0.91 0.03 0.03
Left 3.11 ± 2.19 3.68 ± 2.53 -0.77 0.45 0.01 0.24
Page 36 of 38

37
PA=pain adaptive; PNA= pain non-adaptive; PPT=pressure pain threshold; SUPRA=pain intensity from suprathreshold pressure stimulus; NRS= numerical scale 0-10, 0 being no pain and 10 the worst pain; K= knee; W= wrist; LB= lower back; *= significant p value; 1= Holm-Bonferroni adjusted criterion of statistical significance (significant p values are less than these values); The effect size was calculated as the Cohen’s d, where d= 0.20 would be a small effect, d= 0.50 would be a medium effect, and d= 0.80 would be a large effect.
Page 37 of 38

38
Table 5: Pain characteristics of PA and PNA during the CPT at 2°C (mean ± SD)
CPT Pain characteristics PA (n=18) PNA (n=25) t41-test p value Adjusted significance1 Cohen's d
Average pain from CPT (VAS) 6.37 ± 1.53 5.88 ± 2.24 0.80 0.43 0.03 0.26
Maximum Pain from CPT (VAS) 9.05 ± 1.15 8.76 ± 2.12 0.52 0.60 0.05 0.17
Time to reach Maximum Pain (s) 65.81 ± 31.54 142.28 ± 133.63 -2.76 0.01* 0.02 0.79
Strength of Pain adaptability (Max-End) 5.32 ± 1.96 0.19 ± 0.47 12.63 <0.01* 0.01 3.60
PA= pain adaptive; PNA= pain non-adaptive; CPT= cold pressor test; VAS=visual analogue scale 0-1, 0 meaning no pain at all and 10 the worst pain possible; Max-End= difference between maximum pain and pain at the end of the cold pressor test; *= significant p value; 1= Holm-Bonferroni adjusted criterion of statistical significance (significant p values are less than these values); The effect size was calculated as the Cohen’s d, where d= 0.20 would be a small effect, d= 0.50 would be a medium effect, and d= 0.80 would be a large effect.
Page 38 of 38