Embed Size (px)
Citation preview
(c) 2
004
Victor
ia Univ
ersit
y
1
Pain, depression, anxiety and disability in back pain:
Do people seeking osteopathic treatment fit known profiles?
Master of Health Science (Osteopathy)
Caroline Delaney
Student number. 3520462
13th December, 2004
Supervisors
Melainie Cameron B.App.Sc (Ost), M.H.Sc. (Research).
Edwina Ryan B.Sc., B.Osteo.Sc., B.App.Sc (Clin Sc.), Grad.Dip.Ex.Rehab.
(c) 2
004
Victor
ia Univ
ersit
y
2
ABSTRACT
Background and Objectives: Low back pain (LBP) is a common and challenging
problems in primary health care. Many people consult osteopaths regarding LBP.
The biopsychosocial model is significant in LBP research, highlighting the effects of
psychological factors on the development and outcomes of LBP episodes. However
to date there have been no studies carried out in osteopathic clinics to investigate
these relationships.
Aims: This study aims to establish whether there is an association between length of
LBP episode, acute or chronic, the type of pain experience, depression, anxiety and
disability in people presenting to a student osteopathic clinic. The associations
between dimensions of pain, disability levels, depression and anxiety were also
examined.
Procedure: The study took place at the Victoria University Osteopathic Medicine
Clinic. Participants were volunteers who presented with acute (n=20) or chronic
(n=20) LBP and had received no treatment in the prior 6 months. They completed the
Short-form McGill Pain Questionnaire (SF-MPQ), the Hospital Anxiety and
Depression Scale (HADS) and the Roland and Morris Disability Questionnaire (RM-
24) prior to commencing osteopathic treatment. Differences between the acute and
chronic groups were examined via independent-samples t-tests. Relationships
between dimensions of pain, psychological measures, and disability levels were
examined using Pearson correlations.
Results: No significant differences were found between the acute and chronic low
back pain groups for the pain (APRI, SPRI, TPI, PPI and VAS), anxiety, depression
and disability variables. Correlations were found between all pain dimensions and
(c) 2
004
Victor
ia Univ
ersit
y
3
disability with all pain dimensions (r(SPRI) = 0.492; r(APRI) = 0.569; r(TPI) = 0.568;
r(PPI) = 0.595; r(VAS) = 0.511). Anxiety and depression were strongly correlated (r
= 0.541) and anxiety and levels of affective pain (APRI) (r = 0.36) were also related.
Disability was not correlated with anxiety (r = 0.024) or depression (r = 0.1) and pain
dimensions were not correlated with anxiety or depression.
Conclusion: The results suggest that the population attending an osteopathic clinic
with LBP do not fit the biopsychosocial model prevalent in current literature. More
research is required in the future to confirm these findings.
Keywords: osteopathy, low back pain – acute and chronic, depression, anxiety,
disability
(c) 2
004
Victor
ia Univ
ersit
y
4
INTRODUCTION
Low back pain (LBP) is one of the most common and challenging problems in
primary health care. 79.2% of the Australian population have LBP at some time in
their lives, and 2.7% of these people seek care from osteopaths.1 Low back pain is
associated with enormous costs, particularly in the westernized world. In particular,
chronic LBP is a major cause of medical expenses, work absenteeism and disability.2
Our study investigated which factors may vary between people with acute and chronic
low back pain.
Pain perception and responses are extremely subjective and vary widely
between individuals, depending upon many different physical and psychological
factors. A sound scientific explanation of the aetiology of spine pain, particularly its
development into a chronic state, has been elusive. One belief is that pain has many
facets and thus cannot be easily explained by simple models.3 Currently a
biopsychosocial model is prevalent in research, with psychological factors closely
associated with both chronic,3, 4 and with acute and sub acute pain.5, 6
In a recent study of 3000 randomly selected Australian adults, Walker et al.7
found that more than 10% of people had a high-disability LBP problem in the 6
months prior to the survey. This high point prevalence demonstrates the importance
of understanding disability arising from LBP. It is conventionally accepted that pain
produces or motivates disability. However, much evidence indicates that pain is not
related to functional capacity in a linear fashion.8 In fact people with similar
intensities of pain may function at very different levels. For example, some
individuals who experience mild pain exhibit significant disability, whereas some that
(c) 2
004
Victor
ia Univ
ersit
y
5
have high pain demonstrate low levels of disability. This inconsistency means that
pain cannot be considered to have a strong correlation with disability.
There is much evidence that psychological profiles are important in the natural
history of low back pain.3, 9 Various scores produced from psychological
questionnaires correlate highly with work absence, claims for financial compensation,
and treatment response.10, 11, 12, 13 Some questionnaires are useful for predicting the
cases of acute back pain that are likely to progress to chronic pain and disability.14, 15,
16, 17, 18 Recognition that these are a part of human behaviour and have a strong
psychological component is an important part of the recent advance in understanding
the aetiology and progression of low back pain.
A review study by Pincus et al.19 produced strong evidence for the role of
distress and depression in acute and sub acute stages of LBP and in the development
of long-term disability. However, it has been established that people with chronic
pain score higher on depression scales than people with acute pain.20 Most depression
scales include somatic items, such as fatigue, weight, and sleep problems, that may
muddy the reporting of depression in people with pain.19 In particular, the impact of
pain can cause a heavy endorsement of these somatic items, inflating the overall
scores of depression gained on these scales.19
Persistent LBP is not only determined by clinical factors at the time of onset
but by the pre-morbid psychological state. LBP sufferers who show symptoms of
depression/distress represent a group in which effective interventions may result in
substantially reduced morbidity and healthcare costs.21 Disability, including loss of
work and reduction in activity, is commonly influenced by a range of psychosocial
factors, such as attitudes and beliefs held by the patient, behaviour, emotions, such as
(c) 2
004
Victor
ia Univ
ersit
y
6
fear and low mood.22 Psychosocial factors appear to be important markers for the risk
of developing long-term disability, making it vital to identify at-risk clients early.6, 14
However, the strong associations between psychometric scores and various
aspects of behaviour related to back pain do not prove that "abnormal" psychosocial
characteristics precede or cause back problems.23 Further evidence that the
psychological condition of a patient prior to the development of symptoms of chronic
disability may contribute to its evolution, was explored in a previous study by Linton
& Andersson.9 In this study, non-symptomatic participants who received cognitive
behaviour therapy had significantly fewer days off work and consumed smaller
amounts of health care over a 12-month period than a group who received the usual
medical treatment. They concluded that early psychological oriented interventions
might be helpful in preventing the development of chronic disability. It could actually
be argued that depression and antisocial attitudes merely reflect normal human
reactions to vague diagnosis, ineffectual treatment, and inconsiderate employers.
Further research is required to determine the interaction between psychological
characteristics and back pain.
The report of injuries and pain, and the seeking of health care, is usually
influenced by a complex interaction of medical, work-related beliefs and behaviour,
and other psychosocial factors.24, 25 Primary health care practitioners see the majority
of acute LBP cases, of which only a very small minority require referral to
specialists.24 For this reason, primary health care professionals are in a unique
position to identify potential problems in their clients at an early stage, allowing them
to modify their management strategies to gain optimal outcomes. Further
(c) 2
004
Victor
ia Univ
ersit
y
7
understanding, generally, in the manual therapy field, and specifically, in the holistic
osteopathic field can only be of benefit to practitioners and patients alike.
As osteopathy is a holistic therapy it should explore the interaction of mood
state and the benefits of addressing the patient’s psychological state as an adjunct to
regular physical therapy. Previous research of this type has been carried out in
populations seeking physiotherapy,26 chiropractic27, 28 and other forms of manual
health care.29, 30 To date there have been no studies on this field carried out in
osteopathic clinics. In this study we aimed to make a start on filling this gap, generate
information that is specific to identifying psychological profiles for LBP patients
presenting at a student osteopathic clinic, and provide some data for cross-checking
against some of the findings from the research reviewed above. Confirmation of the
connection between psychological state and LBP may have a two-fold benefit for the
osteopathic profession, firstly it may allow the use of strategies that have been
developed in current research to be utilised within the osteopathic field, and secondly
it may stimulate the development of specific osteopathic treatment modalities in the
treatment of LBP patients.
Specifically, we investigated the extent to which people with acute versus
chronic low back pain differ in dimensions of pain, levels of disability and the
occurrence of symptoms of depression and anxiety. We also explored the association
between dimensions of pain, disability levels, depression and anxiety.
(c) 2
004
Victor
ia Univ
ersit
y
8
METHODS
Aims
The aims in this study were: a) to identify whether people with acute versus
chronic low back pain differ in dimensions of pain, b) to identify whether people with
acute versus chronic low back pain differ in their levels of disability, c) to identify
whether people with acute versus chronic low back pain differ in the occurrence of
symptoms of depression and anxiety, and d) to investigate the association between
dimensions of pain, disability levels, depression and anxiety.
Participants
Forty adult volunteers who had not received treatment in the previous 6
months were recruited from the Victoria University Osteopathic Medicine Clinic for
this study. After being informed of the nature and purpose of this study written
consent was obtained from all participants. All volunteers were within the age range
of 18-60 years (average age 27.3 years) and presented with self-reported,
uncomplicated LBP. Participants (n=20, male 9, female 11) who presented with LBP
of less than 2 weeks duration formed the acute LBP group. Participants (n=20, male
8, female 12) who presented with LBP of 6 months or longer were grouped together
as the chronic LBP group. The Human Research Ethics Committee of Victoria
University approved the study. Volunteers were excluded from this study if they were
experiencing lower limb pain, numbness, tingling or weakness linked to their LBP, or
if they had a previous diagnosis of clinical depression.
Procedure
Upon first presentation to the Victoria University Osteopathic Medicine Clinic
participants completed the Short-form McGill Pain Questionnaire (SF-MPQ), the

(c) 2
004
Victor
ia Univ
ersit
y
9
Hospital Anxiety and Depression Scale (HADS) and the Roland and Morris Disability
Questionnaire (RM-24). Questionnaires were completed prior to commencing
osteopathic treatment.
Measures
Three questionnaires, the Short-form McGill Pain Questionnaire (SFMPQ),
the Hospital Anxiety and Depression Scale (HADS) and the Roland and Morris
Disability Questionnaire (RM-24) are commonly used in the primary care setting.
They were chosen for their relevance to the manual therapy field.
The short-form McGill Pain Questionnaire (SF-MPQ) comprises 15 pain
descriptors, which represent the sensory, and the affective dimension of the pain
experience. It also includes a visual analogue scale (VAS) and ordinal present pain
index (PPI).31 The SF-MPQ was developed from the standard McGill Pain
Questionnaire. Each pain descriptor is ranked on a four-point intensity scale (0=none
to 3=severe). The three items of the SF-MPQ return five scores. A sensory pain
rating index (SPRI), an affective pain rating index (APRI), and a total pain index
(TPI) are returned from the word list, and the VAS and PPI each return single scores.
The Hospital Anxiety and Depression Scale (HADS) is a reliable tool that
measures symptoms of anxiety and depression.32 It is a 14-item scale that establishes
the presence and severity of symptoms of anxiety and depression over the previous
week. Each item was scored from 0 to 3. A total score of greater than ten is
indicative of clinically significant levels of depression and/or anxiety. The HADS has
been validated in many clinical and non-clinical populations. It is favoured in clinical
populations because the items avoid physical symptoms of psychological distress that
(c) 2
004
Victor
ia Univ
ersit
y
10
may overlap with medical illnesses. This makes it a suitable instrument to assess
psychological state in individuals with co-morbid illnesses, such as LBP.30
The Roland and Morris Disability Questionnaire (RM-24) is a validated scale
for measuring disability as it relates to LBP.33 The scale consists of 24 yes/no
statements that represent limitations in different activities of daily living relevant to
low back pain. Each statement ticked is worth 1 point, with the scores ranging from 0
(no disability) to 24 (extremely severe disability). It has a scale width appropriate for
primary care settings (eg; osteopathic practice) where clients are ambulatory and low
levels of disability are expected.
Statistical methods
Raw data was collated using Microsoft Excel and all data were analysed using
the statistical package SPSS Version 11. Differences between the acute and chronic
groups were examined via independent-samples t-tests. A 2-tailed t-test was
performed to test for non-directional differences between the groups. Relationships
between dimensions of pain, psychological measures, and disability levels were
examined using Pearson correlations.

(c) 2
004
Victor
ia Univ
ersit
y
11
RESULTS
As seen in Table 1, the acute LBP population showed normal distribution of
results for all pain dimensions measured, with all but VAS producing a trend towards
the lower end of mild pain intensity. Anxiety measures were generally within the
non-anxious range, with an average of 5.6, with only 10% scoring within the anxious
range (>11). None of the acute LBP scored levels of depression that fell within the
depressed range. Similarly, most participants recorded low levels of disability, with
only 15% registering a disability scoring between 12.5-17.5 out of a possible maximal
disability (24).
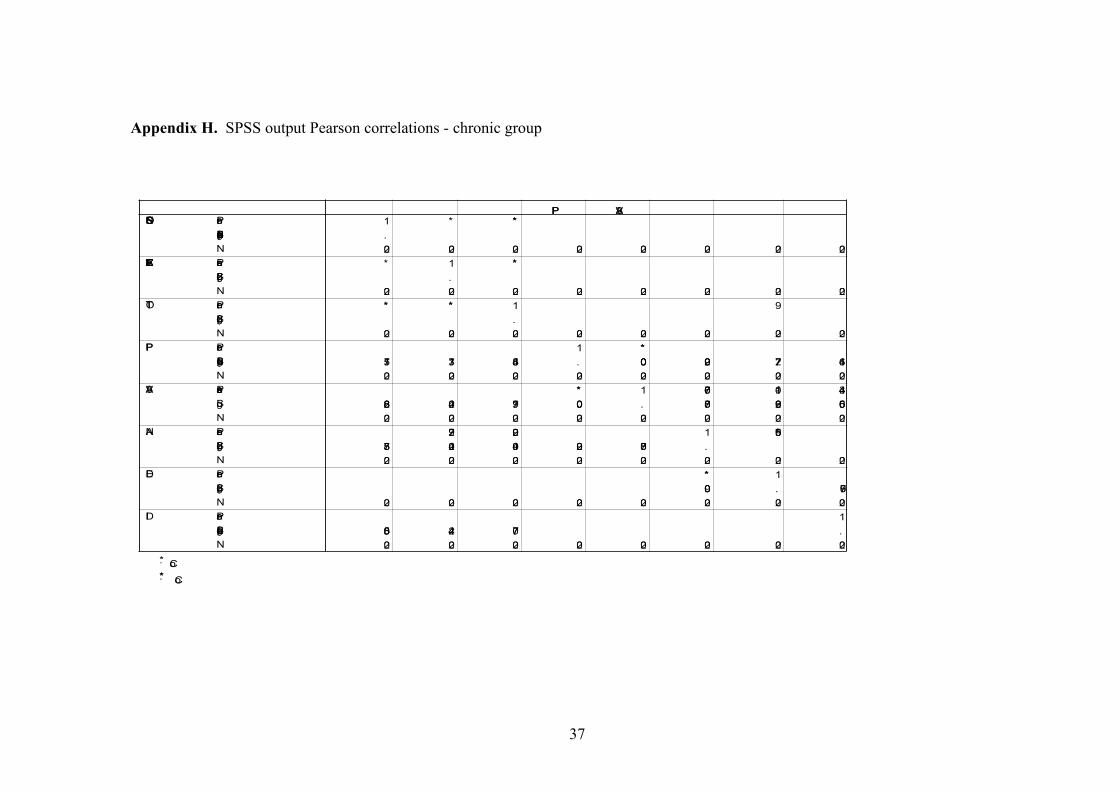
The chronic LBP group also produced normal distributions for all pain
dimensions and showed an average pain intensity that was largely above that recorded
by acute sample (see Table 1). Measurements of anxiety levels produced only three
participants who recorded clinically significant levels of anxiety (>11). Levels of
depression were found to be insignificant in the chronic group, with only one patient
scoring at a depressed level (12). Similarly, levels of disability were all markedly
lower than the acute group, with a maximum score of 10 and an average of 3.8.
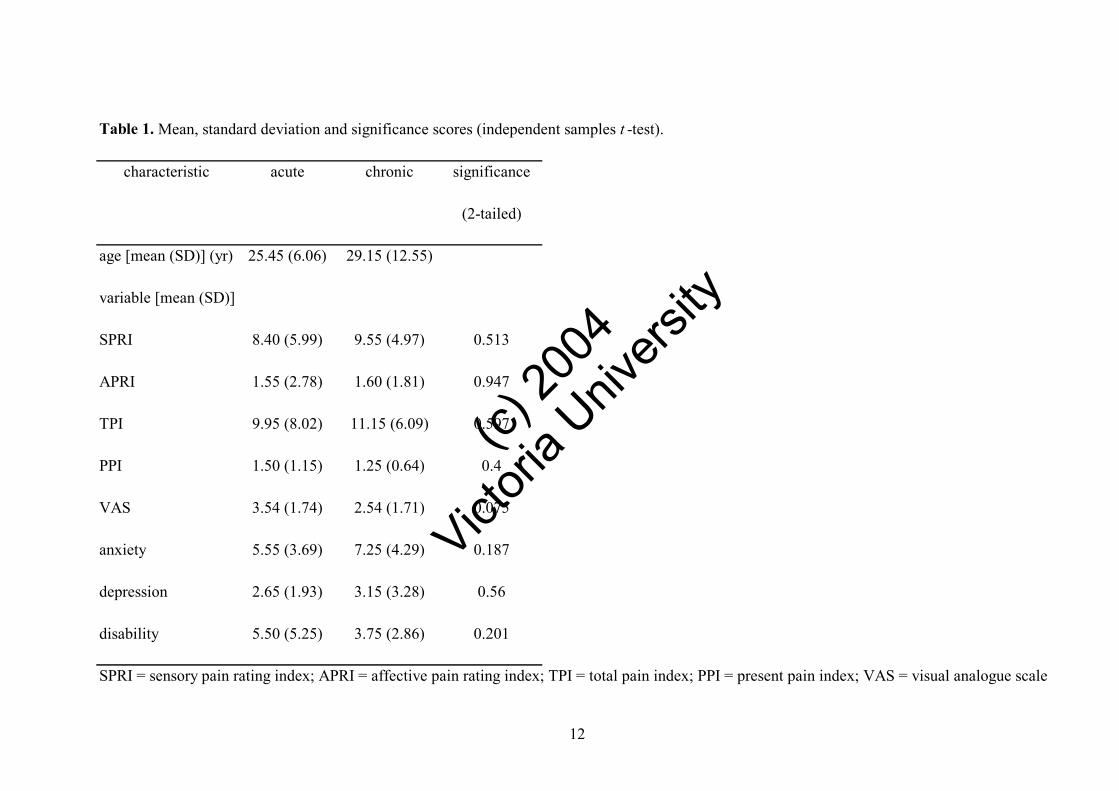
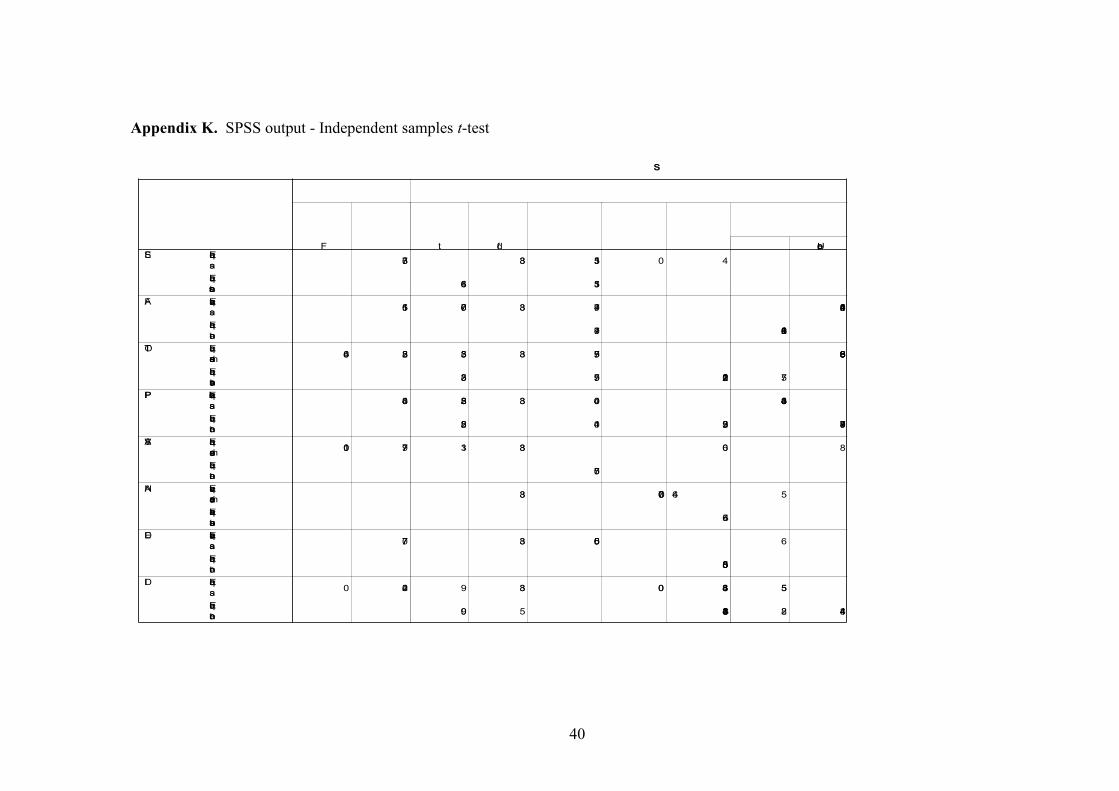
Statistical comparison using a two-tailed independent measures t-test showed
no significant difference between the acute and chronic low back pain groups in the
pain (APRI, SPRI, TPI, PPI and VAS), anxiety, and depression and disability
variables. These results are outlined in Table 1.
(c) 2
004
Victor
ia Univ
ersit
y
12
Table 1. Mean, standard deviation and significance scores (independent samples t -test).
characteristic acute chronic significance
(2-tailed)
age [mean (SD)] (yr) 25.45 (6.06) 29.15 (12.55)
variable [mean (SD)]
SPRI 8.40 (5.99) 9.55 (4.97) 0.513
APRI 1.55 (2.78) 1.60 (1.81) 0.947
TPI 9.95 (8.02) 11.15 (6.09) 0.597
PPI 1.50 (1.15) 1.25 (0.64) 0.4
VAS 3.54 (1.74) 2.54 (1.71) 0.075
anxiety 5.55 (3.69) 7.25 (4.29) 0.187
depression 2.65 (1.93) 3.15 (3.28) 0.56
disability 5.50 (5.25) 3.75 (2.86) 0.201
SPRI = sensory pain rating index; APRI = affective pain rating index; TPI = total pain index; PPI = present pain index; VAS = visual analogue scale

(c) 2
004
Victor
ia Univ
ersit
y
13
Table 2. Pearson correlation (r) of total population (N=40) for dimensions of pain, psychological measures and disability levels.
SPRI APRI TPI PPI VAS Anxiety Depression Disability
SPRI 1
APRI 0.574** 1
TPI 0.963** 0.773** 1
PPI 0.251 0.435** 0.337* 1
VAS 0.360* 0.456** 0.429** 0.599** 1
Anxiety 0.064 0.360* 0.168 -0.027 0.051 1
Depression 0.039 0.097 0.062 -0.026 -0.03 0.541** 1
Disability 0.492** 0.569** 0.568** 0.595** 0.511** 0.024 0.1 1
** Correlation is significant at the 0.01 level (2-tailed).
* Correlation is significant at the 0.05 level (2-tailed).
SPRI = sensory pain rating index; APRI = affective pain rating index; TPI = total pain index;
PPI = present pain intensity; VAS = visual analogue scale.

(c) 2
004
Victor
ia Univ
ersit
y
14
Exploratory analysis of pain dimension, mood states and disability levels were then
performed (see Table 2). It can be seen that the pain dimensions are all correlated
with each other as expected. Disability was found to correlate highly with all pain
dimensions, showing a strong relationship between pain dimensions and disability in
the population measured. The measurements of psychological distress, namely
anxiety and depression are strongly correlated with each other. A significant
relationship between symptoms of anxiety and levels of affective pain (APRI) were
found. An interesting finding was that disability was not correlated with
measurements of mood (anxiety and depression). Another significant finding is that
pain was not correlated with anxiety or depression.
Further analysis was performed to determine how much variance was shared
between pain dimensions, mood states and disability. This was achieved by
calculating the coefficient of determination (r2) as seen in Table 3. The values of pain
dimensions contributed between 11% and 93% in their relationships with each other.
The highest level was produced by the relationship between sensory pain (SPRI) and
total pain (TPI), as one would expect when the SPRI contributed a possible 11 out of
the highest possible TPI (15). A weak relationship exists between anxiety and
affective pain (APRI), with only 13% of variance shared. Disability and pain shared a
variance of between 24% and 35%, representing a moderately strong relationship.
Anxiety and depression shared a variance of 29%.

(c) 2
004
Victor
ia Univ
ersit
y
15
Table 3. Coefficient of determination (r2) of total population (N=40) for dimensions of pain, psychological measures and disability levels.
SPRI APRI TPI PPI VAS Anxiety Depression Disability
SPRI 0 0 0 0 0 0 0 0
APRI 0.329 0 0 0 0 0 0 0
TPI 0.927 0.598 0 0 0 0 0 0
PPI 0 0.189 0.114 0 0 0 0 0
VAS 0.13 0.208 0.184 0.359 0 0 0 0
Anxiety 0 0.13 0 0 0 0 0 0
Depression 0 0 0 0 0 0.293 0 0
Disability 0.242 0.324 0.327 0.354 0.261 0 0 0
SPRI = sensory pain rating index; APRI = affective pain rating index; TPI = total pain index;
PPI = present pain intensity; VAS = visual analogue scale
(c) 2
004
Victor
ia Univ
ersit
y
16
DISCUSSION
Psychological profiles are known to differ between the acute and chronic LBP
states. People with chronic back pain usually score higher on depression scales than
their acute LBP counterparts.20 Functional capacity is not linearly related to the report
of pain.8 Axis I psychopathologies (DSM4-TM), such as anxiety and depression, are
evident in people with acute, subacute, and chronic LBP.19 The acute and chronic
LBP samples tested in our study showed no differences in their pain dimensions,
mood states, or disability levels. Anxiety and depression were found to have only very
small correlation with disability levels or pain dimensions, contrary to our
expectations based on the available literature. Some less expected associations
between variables were found in the current research, including, a strong relationship
between pain and disability, and a weak relationship between anxiety and levels of
affective pain. The mood states (anxiety and depression) were predictably correlated
with each other in both samples.
One explanation of the insignificant levels of anxiety and depression in this
study is that clients at the osteopathic teaching clinic self select when they attend. Put
bluntly, people with LBP they perceive to be severe or dangerous may choose to seek
care from “qualified professionals” rather than students. Care seeking decisions are
motivated by medical beliefs and a variety of other psychosocial factors such as health
locus of control24, 25 as well as market forces such as cost of care, and practical
considerations like travel and parking arrangements. Once a person makes a decision
to self-refer, they generally become proactive to seek a remedy. The morose nature of
severely depressed people means that they may not seek care at all, particularly at a
(c) 2
004
Victor
ia Univ
ersit
y
17
student osteopathic clinic. Similarly, anxious people are unlikely to seek care from
students.
Health locus of control (HLC) is a construct widely used in health research. It
refers to an individual’s belief in his or her control over illness.34 In general, lifestyle
based outcomes are more positive in people who strongly believe in their internal
control over illness,35 but practitioner-driven interventions may be most powerful in
people who believe strongly in the control of healthcare professionals over disease
(i.e., powerful-others locus of control).36 Although HLC was not specifically
measured in this study, the psychological domains of anxiety and depression may be
evidence of participants’ health beliefs as well as responses or antecedents to the
condition of LBP. We are unsure whether people with strong powerful-others HLC
are likely to seek care for their LBP from student osteopaths. Osteopathy is somewhat
known for being a holistic therapy which uses lifestyle-type interventions (e.g.,
nutrition, exercise, and other “wellness” interventions),37 and thus may also be an
appealing therapy option for people with strong internal health loci of control. It is
probable that the participants in this study displayed a range of health beliefs, some of
which influenced their decision to seek osteopathic care. Follow-up research could
include the investigation of HLC to investigate its influence on people who attend a
student osteopathic clinic.
Although counter-intuitive, some epidemiological studies have shown that disc
degeneration and other causes of LBP may develop because of the personal
characteristics of a person, rather than any exposure to physical activities.25, 38 These
characteristics may be genetic or acquired from a person’s life experience, and are
intrinsically related to the psychological make-up of the individual. Many studies
(c) 2
004
Victor
ia Univ
ersit
y
18
have recognised the effects of psychosocial factors (such as depressive tendencies) on
all aspects of LBP behaviour, including reporting and response to treatment.10, 12, 25, 39,
40
LBP is a condition in which pain is episodic, thus the level of pain at any
single point in time doesn’t indicate where the patients are in relation to their
characteristic pain level. In health care, patients with pain tend to seek care when
there is a flare-up in the level of pain or when their level of pain is no longer
tolerable.41 Generally, people seek treatment when they are at their worst. Over time
it is likely their presenting symptoms will improve, treatment or no treatment, because
all extreme states seek equilibria. This phenomenon is known as ‘regression to the
mean’.42 In this study, we assessed patients who had not received treatment for at
least 6 months, and their care seeking was likely to have been driven by pain.
Depression and anxiety may have been somewhat overshadowed by the more
predominant feature of pain. This hypothesis could reasonably be explored in a future
controlled clinical trial to plot the psychological profiles of people with LBP over a
course of treatment or no treatment.
There is some question as to why the patients had not received treatment for 6
months, particularly the chronic LBP group. This lack of treatment seeking may have
been driven by pain, however it may be due to individual personality differences or
simply due to their financial situation (i.e. patients attending a student clinic may be
driven by the low costs involved, as they probably cannot afford to pay to see a
qualified practitioner). Further examination of this may be beneficial in future
research.

(c) 2
004
Victor
ia Univ
ersit
y
19
Some studies of people with LBP have used psychological scales that include
somatic items that may inflate the overall scores. It is possible that the current study
did not find significant levels of anxiety and depression because the scale used
(HADS) removed the somatic items that may inflate the overall scores. Recent
research in the LBP population have suggested that psychological instruments that do
not include somatic items should be utilised.19
This study describes a subset of people that attend a student osteopathic clinic,
in particular people who attend a student osteopathic clinic. The results may have a
contribution to treatment within this clinic, and in osteopathic clinics treating an
Australian population. For instance, the mild, but positive relationship between
affective pain and anxiety will be useful in clients who present with pain symptoms
described as ‘tiring/exhausting’, ‘sickening’ or ‘punishing’. These symptoms, if
reported, can indicate an anxious person, which in turn should be considered and
managed when treating.
The findings of this study suggest the population attending an Australian
student osteopathic clinic with LBP do not fit the biopsychosocial model prevalent in
current literature. More research is required to confirm these findings.
(c) 2
004
Victor
ia Univ
ersit
y
20
CONCLUSION
The study found that a sample of LBP population attending a student
osteopathic clinic in Australia show no differences in levels of pain, depression,
anxiety and disability between those presenting with acute or chronic pain. Some of
the correlations indicated by previous research were not found, with no relationship
apparent between depression levels and severity of pain. However, links were found
between disability and pain dimensions and between levels of anxiety and the
presence of affective pain. This is potentially useful information for student
practitioners who treat LBP clients in teaching clinic settings, however, follow-up
research, involving a larger number of participants, is required to validate these
preliminary findings and determine whether they are translatable to non-student
osteopathic clinics and similar health care settings.

(c) 2
004
Victor
ia Univ
ersit
y
21
Acknowledgments
The authors would like to acknowledge Luke and Sandy Delaney for their
constructive comments during the preparation of this manuscript.
I would also like to acknowledge the support my family, particularly my parents, have
provided during the completion of my studies.

(c) 2
004
Victor
ia Univ
ersit
y
22
REFERENCES
1. Walker, B.F. (8-5-2003: Written personal communication) Low Back Pain in
Australian Adults (research data), James Cook University, Paper under review.
2. van Tulder MW, Ostelo R, Vlaeyen JWS, Linton SJ, Morley SJ, Assendelft WJJ.
Behavioural treatment for chronic low back pain - a systematic review within the
framework of the Cochrane Back Review Group. 2000; 26 (3): 270-281.
3. Waddell G. Biopsychosocial analysis of low back pain. Baillieres Clinical
Rheumatology. 1992; 6: 523-557.
4. Gatchel RJ, Turk DC Ed. Psychological Approaches to Pain Management: A
Practitioner’s Handbook, Volume 1. New York: Guildford Press; 1996.
5. Croft PR, Rigby AS. Socioeconomic influences on back problems in the
community in Britain. Journal of Epidemiological Community Health. 1994; 48: 166-
170.
6. Linton SJ, Hallden K. Can we screen for problematic back pain? A screening
questionnaire for predicting outcome in acute and subacute back pain. Clinical
Journal of Pain. 1998; 14: 209-215.
7. Walker BF, Muller R, Grant WD. Low back pain in Australian adults, prevalence
and associated disability. Journal of Manipulative and Physiological Therapeutics.
2004; 27 (4): 238-244.
8. Lackner JM, Carosella AM. The relative influence of perceived pain control,
anxiety, and functional self efficacy on spinal function among patients with chronic
low back pain. Spine. 1999; 24 (21): 2254-2261.

(c) 2
004
Victor
ia Univ
ersit
y
23
9. Linton SJ, Andersson T. Can Chronic Disability be Prevented? A randomized trial
of a cognitive-behaviour intervention and two forms of information for patients with
spinal pain. Spine. 2000; 25 (21): 2825-2831.
10. Greenough CG, Fraser RD. The effects of compensation on recovery from low-
back injury. Spine. 1989; 14: 947-955.
11. Greenough CG, Fraser RD. Comparison of eight psychometric instruments in
unselected patients with back pain. Spine. 1991; 16: 1068-1074.
12. Coste J, Delecoeuillerie G, Cohen de Lara A, Le Parc JM, Paolaggi JB. Clinical
course and prognostic factors in acute low back pain: an inception cohort study in
primary care practice. British Medical Journal. 1994; 308: 577-580.
13. Williams MM, Grant RN, Main CJ. The distress and risk assessment method
(DRAM) as a predictor of outcome in chronically disabled workers attending a
physical rehabilitation programme, Presented to the International Society for the
Study of the Lumbar Spine, Helsinki, Finland, June 18-21, 1995.
14. Main CJ, Wood PLR, Hollis S, Spanswick CC, Waddell G. The distress and risk
assessment method: A simple patient classification to identify distress and evaluate
the risk of poor outcome. Spine. 1992 17: 42-52.
15. Waddell G, Newton M, Henderson I, Somerville D, Main CJ. A Fear-Avoidance
Beliefs Questionnaire (FABQ) and the role of fear-avoidance beliefs in chronic low
back pain and disability. Pain. 1993; 52: 157-168.
16. Hasenbring M, Marienfeld G, Kuhlendahl D, Soyka D. Risk factors of chronicity
in lumbar disc patients. Spine. 1994; 19: 2759-2765.
17. Burton AK, Tillotson KM, Main CJ, Hollis S. Psychosocial predictors of outcome
in acute and subchronic low back trouble. Spine. 1995; 20: 722-728.
(c) 2
004
Victor
ia Univ
ersit
y
24
18. Gatchel RJ, Polatin PB, Mayer TG. The Dominant Role of Psychosocial Risk
Factors in the Development of Chronic Low Back Pain Disability. Spine. 1995; 20
(24): 2702-2709.
19. Pincus T, Burton AK, Vogel S, Field AP. A systematic review of psychological
factors as predictors of chronicity/disability in prospective cohorts of low back pain.
Spine. 2002; 27: E109-120.
20. Pincus T, Williams A. Models and measurements of depression in chronic pain.
Journal of Psychosomatic Research. 1999; 47 (3): 211-219.
21. Thomas E, Silman AJ, Croft PR et al. Predicting who develops chronic low back
pain in primary care: a prospective study. British Medical Journal. 1999; 318: 1662-
1667.
22. Kendall NAS. Psychosocial approaches to the prevention of chronic pain: the low
back pain paradigm. Baillieres Clinical Rheumatology: Best Practice and Research.
1999; 13: 545-554.
23. Magni G. Chronic low-back pain and depression: an epidemiologic survey. Acta
Psychiatric Scandinavia. 1984; 70: 614-617.
24. Kendall NAS. Manual therapy rounds – low back pain: treatment and prevention.
Journal of Manual and Manipulative Therapy. 1997; 5: 134-139.
25. Bigos SJ, Battie MC, Spengler DM. et al. A prospective study of work perceptions
and psychosocial factors affecting the report of back injury. Spine. 1991; 16: 1-6.
26. Pengel LHM, Refshauge KM, Maher CG. Responsiveness of pain, disability, and
physical impairment outcomes in patients with low back pain. Spine. 2004; 29 (8):
879-883.
(c) 2
004
Victor
ia Univ
ersit
y
25
27. Haas M, Jacobs G, Raphael R, Petzing K. Low back pain outcome measurement
in chiropractic teaching clinics: responsiveness and applicability of two functional
disability questionnaires. Journal of Manipulative & Physiological
Therapeutics.1995; 18 (2): 79-87.
28. Haas M, Nyiendo J, Aickin M. One-year trend in pain and disability relief recall in
acute and chronic ambulatory low back pain patients. Pain. 2002; 95: 83-91.
29. Kovacs FM, Abraira V, Zamora J, Gil del Real MT, Llobera J, Fernandez C et al.
Correlation between pain, disability, and quality of life in patients with common low
back pain. Spine 2004; 29 (2): 206-210.
30. Dickens C, Jayson M, Creed F. Psychological correlates of pain behavior in
patients with chronic low back pain. Psychosomatics. 2002; 43: 42-48.
31. Melzack R. The short-form McGill Pain Questionnaire. Pain. 1987; 30: 191-197.
32. Zigmond AS, Snaith RP. The hospital anxiety and depression scale. Acta
Psychiatrica Scandinavica. 1983; 67: 361-370.
33. Roland M, Morris R. A study of the natural history of back pain. Spine. 1983; 8:
141-150.
34. Härkäpää K, Järvikoski A. Mellin G, Hurri H, Luoma J. Health locus of control
beliefs and psychological distress as predictors for treatment outcome in low-back
pain patients: results of a 3-month follow-up of a controlled intervention study. Pain.
1991; 46: 35-41.
35. Wallston KA, Wallston BS. Health locus of control scales. In: Lefcourt HM. ed.
Research with the Locus of Control Construct. Volume 1. Assessment Methods. New
York. Academic Press; 1981: 189-243.
(c) 2
004
Victor
ia Univ
ersit
y
26
36. Norman P, Bennett P, Smith C, Murphy S. (1998). Health locus of control and
health behaviour. Journal of Health Psychology, 3(2), 171-180.
37. www. osteopathic.com.au. website accessed 12-12-2004.
38. Battie MC, Videman T, Gibbons LE, et al. Determinants of lumbar disc
degeneration: a study relating lifetime exposures and MRI findings in identical twins.
Spine. 1995; 16: 1-12.
39. Croft PR, Papageorgiou AC, Ferry S, Thomas E, Jayson MIV, Silman AJ.
Psychologic distress and low back pain: Evidence from a prospective study in the
general population. Spine. 1995; 20: 2731-2737.
40. Mannion AF, Dolan P, Adams MA. Psychological questionnaires: Do “abnormal”
scores precede or follow first-time low back pain? Spine. 1996; 21: 2603-2611.
41. Von Korff M, Wagner EH, Dworkin SF, Saunders KW. Chronic pain and use of
ambulatory health care. Psychosomatic Medicine, 1991; 53: 61-79.
42. Whitney CW, Von Korff M. Regression to the mean in treated versus untreated
chronic pain. Pain. 1992; 50: 281-285.
(c) 2
004
Victor
ia Univ
ersit
y
27
Appendix A. Information to participants form
INFORMATION TO PARTICIPANTS We invite you to be a part of a study investigating low back pain and the interaction of psychological factors and disability. This study will involve three short questionnaires (approximately 15 minutes completion time), which will examine factors such as levels of pain, anxiety, depression and ability to perform general daily activities. This study aims to identify possible issues facing people with low back pain. The outcomes of this study may influence the treatment of people with low back pain in osteopathic practice, highlight potential developmental and maintaining factors of low back pain and form a greater understanding of issues effecting people with low back pain. Further understanding of the interactions between pain, depression and disability may be of benefit to practitioners and patients alike. In the event that any potential issues of concern arise, participants will be provided with written feedback from the investigator. The data from this research may be published. In this case, your confidentiality will be protected by the use of an alphanumerical coding system. In addition to this information leaflet you will find an informed consent form, which must be filled out in pen and returned to the student investigator. Completion of this form implies consent to participation in this study. The researchers will in NO way identify individual participants. Participation in this study is voluntary. Procedures: Three questionnaires regarding low back pain are to be undertaken. They include a pain questionnaire, a psychological questionnaire and a survey about general daily activities. Each volunteer will be screened to ensure that his or her low back pain is uncomplicated. The following eligibility and exclusion criteria shall be observed: 1. Participants must be between the ages of 18-60 years. 2. Each participant must have uncomplicated low back pain. Any presence of lower limb pain,
numbness, tingling or weakness linked to the low back pain will exclude participation. 3. Participants must not have a previous diagnosis of clinical depression. 4. Each participant must sign an informed consent for before participation in this study. If participants have any queries regarding the study then they can forward any question to the researchers at Victoria University City Flinders Campus on (03) 9248 1111 or to Melainie Cameron (Principal Investigator), on (03) 9248 1149. Any queries about your participation in this project may be directed to the researcher Melainie Cameron (Principal Investigator) (03) 9248 1149. If you have any queries or complaints about the way you have been treated, you may contact the Secretary, University Human Research Ethics Committee, Victoria University of Technology, PO Box 14428 MCMC, Melbourne, 8001 (telephone no: 03-9688 4710).
(c) 2
004
Victor
ia Univ
ersit
y
28
Appendix B. Informed consent form
CERTIFICATION BY PARTICIPANTS I, of certify that I am at least 18 years old and that I am voluntarily giving my consent to participate in the research entitled:
Pain, depression, anxiety and disability in back pain: Do people seeking osteopathic treatment fit known profiles?
being conducted at Victoria University of Technology by: Melainie Cameron – B.App.Sc (Ost), M.H.Sc. (Research) Edwina Ryan – B.Sc., B.Osteo.Sc., B.App.Sc (Clin Sc.), Grad.Dip.Ex.Rehab Caroline Delaney – BSc (Clinical Sciences), BSc Participation in this study will involve the completion of three questionnaires regarding low back pain, they include a pain questionnaire, a psychological questionnaire and a survey about general daily activities. I certify that the objectives of the research, together with any risks and safeguards associated with the procedures listed hereunder to be carried out in the research, have been fully explained to me and that I freely consent to participation involving the use on me of these procedures. I certify that I have had the opportunity to have any questions answered and that I understand that I can withdraw from this research at any time and that this withdrawal will not jeopardise me in any way. I have been informed that the data from this research may be published and that the information I provide will be kept confidential. Signed: ................................................. } Witness other than the researcher: } Date: .................... ................................................................} Any queries about your participation in this project may be directed to the researcher Melainie Cameron (Principal Investigator) (03) 9248 1149. If you have any queries or complaints about the way you have been treated, you may contact the Secretary, University Human Research Ethics Committee, Victoria University of Technology, PO Box 14428 MCMC, Melbourne, 8001 (telephone no: 03-9688 4710).
(c) 2
004
Victor
ia Univ
ersit
y
29
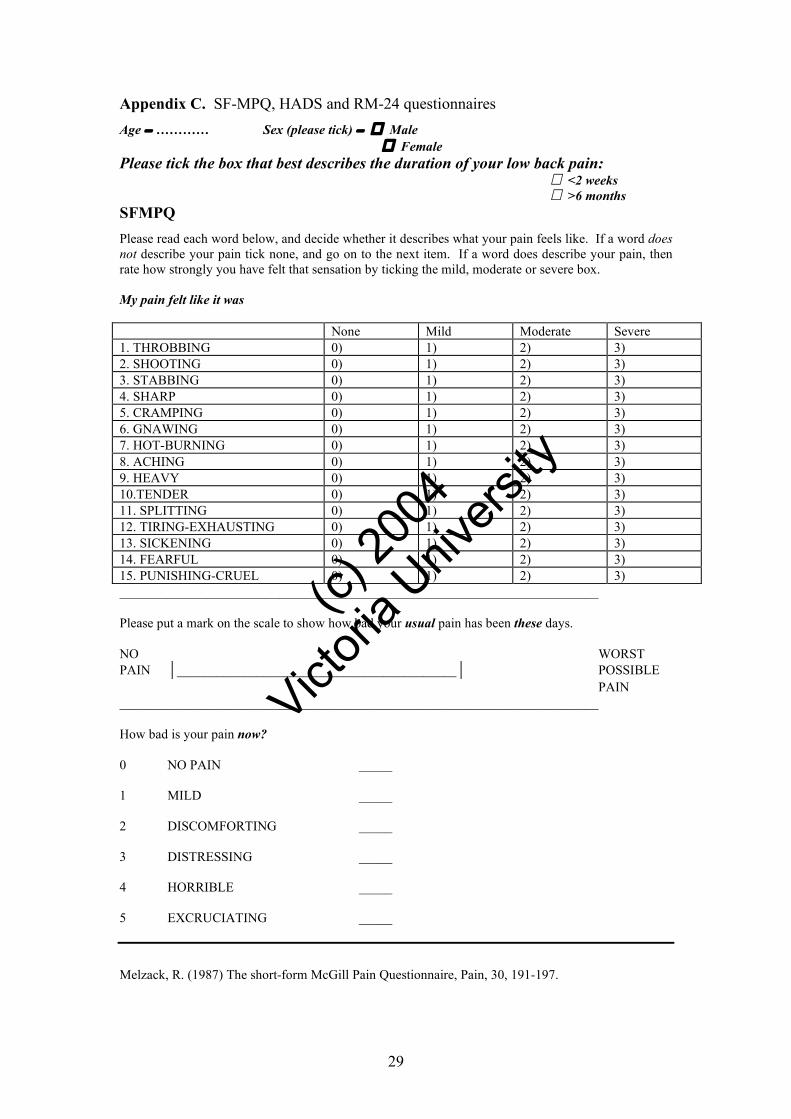
Appendix C. SF-MPQ, HADS and RM-24 questionnaires Age − ………… Sex (please tick) − � Male
� Female Please tick the box that best describes the duration of your low back pain:
� <2 weeks � >6 months SFMPQ
Please read each word below, and decide whether it describes what your pain feels like. If a word does not describe your pain tick none, and go on to the next item. If a word does describe your pain, then rate how strongly you have felt that sensation by ticking the mild, moderate or severe box. My pain felt like it was None Mild Moderate Severe 1. THROBBING 0) 1) 2) 3) 2. SHOOTING 0) 1) 2) 3) 3. STABBING 0) 1) 2) 3) 4. SHARP 0) 1) 2) 3) 5. CRAMPING 0) 1) 2) 3) 6. GNAWING 0) 1) 2) 3) 7. HOT-BURNING 0) 1) 2) 3) 8. ACHING 0) 1) 2) 3) 9. HEAVY 0) 1) 2) 3) 10.TENDER 0) 1) 2) 3) 11. SPLITTING 0) 1) 2) 3) 12. TIRING-EXHAUSTING 0) 1) 2) 3) 13. SICKENING 0) 1) 2) 3) 14. FEARFUL 0) 1) 2) 3) 15. PUNISHING-CRUEL 0) 1) 2) 3) ________________________________________________________________________ Please put a mark on the scale to show how bad your usual pain has been these days. NO WORST PAIN __________________________________________ POSSIBLE PAIN ________________________________________________________________________ How bad is your pain now? 0 NO PAIN _____ 1 MILD _____ 2 DISCOMFORTING _____ 3 DISTRESSING _____ 4 HORRIBLE _____ 5 EXCRUCIATING _____
Melzack, R. (1987) The short-form McGill Pain Questionnaire, Pain, 30, 191-197.
(c) 2
004
Victor
ia Univ
ersit
y
30
HADS
Please read each item and tick the reply which comes closest to
how you have been feeling in the PAST WEEK.
1. I feel tense or ‘wound up’: � Most of the time � A lot of the time � From time to time, occasionally � Not at all 2. I still enjoy the things I used to enjoy: � Definitely as much � Not quite as much � Only a little � Hardly at all 3. I get a sort of frightened feeling as if something awful is about to happen: � Very definitely and quite badly � Yes, but not too badly � A little, but it doesn’t worry me � Not at all 4. I can laugh and see the funny side of things: � As much as I always could � Not quite so much now � Definitely not so much now � Not at all 5. Worrying thoughts go through my mind: � A great deal of the time � A lot of the time � From time to time but not too often � Only occasionally 6. I feel cheerful: � Not at all � Not often � Sometimes � Most of the time 7. I can sit at ease and feel relaxed: � Definitely � Usually � Not often � Not at all
(c) 2
004
Victor
ia Univ
ersit
y
31
8. I feel as if I am slowed down: � Nearly all the time � Very often � Sometimes � Not at all 9. I get a sort of frightened feeling like'butterflies’ in the stomach: � Not at all � Occasionally � Quite often � Very often 10. I have lost interest in my appearance: � Definitely � I don’t take so much care as I should � I may not take quite as much care � I take just as much care as ever 11. I feel restless as if I have been on the move: � Very much indeed � Quite a lot � Not very much � Not at all 12. I look forward with enjoyment to things: � As much as I ever did � Rather less than I used to � Definitely less than I used to � Hardly at all 13. I get sudden feelings of panic: � Very often indeed � Quite often � Not very often � Not at all 14. I can enjoy a good book or radio or TV program: � Often � Sometimes � Not often � Very seldom Zigmond, A.S., Snaith, R.P. (1983). The Hospital Anxiety and Depression Scale, Acta psychiatrica scandinavica, 67, 361-370.
(c) 2
004
Victor
ia Univ
ersit
y
32
RM-24 When your back hurts, you may find it difficult to do some of the things you normally do. This list contains some sentences that people have used to describe themselves when they have back pain. When you read them, you may find that some stand out because they describe you today. As you read the list, think of yourself today. When you read a sentence that describes you today, fill the box to the left of the sentence. If the sentence does not describe you, then leave the box blank and go on to the next one. Remember, only mark the sentence if you are sure that it describes you today.
1. I stay at home most of the time because of my back.
2. I change positions frequently to try and get my back comfortable.
3. I walk more slowly than usual because of my back.
4. Because of my back, I am not doing any of the jobs that I usually do around the house.
5. Because of my back, I use a handrail to get upstairs.
6. Because of my back, I lie down to rest more often.
7. Because of my back, I have to hold on to something to get out of an easy chair.
8. Because of my back, I try to get other people to do things for me.
9. I get dressed more slowly than usual because of my back.
10. I only stand up for short periods of time because of my back.
11. Because of my back, I try not to bend or kneel down.
12. I find it difficult to get out of a chair because of my back.
13. My back is painful almost all the time.
14. I find it difficult to turn over in bed because of my back.
15. My appetite is not very good because of my back pain.
16. I have trouble putting on my socks (or stockings) because of the pain in my back.
17. I only walk short distances because of my back pain.
18. I sleep less well because of my back.
19. Because of my back pain, I get dressed with help from someone else.
20. I sit down for most of the day because of my back.
21. I avoid heavy jobs around the house because of my back.
22. Because of my back pain, I am more irritable and bad tempered with people than usual.
23. Because of my back, I go upstairs more slowly than usual.
24. I stay in bed most of the time because of my back.
I am no longer employed or am no longer able to perform my usual daily duties (eg home
based activities).
Roland M, Morris R. (1983) A study of the natural history of back pain, Spine, 8: 141-150.

(c) 2
004
Victor
ia Univ
ersit
y
33
Appendix D. Victoria University Faculty of Human Research Ethics Committee
Approval
Faculty Human Research Ethics Committee
MEMORANDUM
TO: Melainie Cameron, Edwina Ryan (Caroline Delaney) Principal Investigators Education
FROM: Prof Colin Torrance Acting Chair Human Research Ethics Committee Faculty of Human Development
DATE: January 29, 2008 SUBJECT: Approval of application involving human subjects Thank you for your submission detailing amendments to the research protocol for the project titled, Pain, depression, anxiety and disability in back pain: Do people seeking osteopathic treatment fit known profiles? (HRETH.FHD.097/03). The proposed amendments have been accepted by the Faculty Human Research Ethics Committee and approval for application HRETH.FHD.097/03 has been granted from 5/2/04 to 5/2/06. Please note that, the Faculty Human Research Ethics Committee must be informed of the following: any changes to the approved research protocol, project timelines, any serious or unexpected adverse effects on participants, and unforeseen events that may effect continued ethical acceptability of the project. In these unlikely events, researchers must immediately cease all data collection until the Committee has approved the changes. If you have any queries, please do not hesitate to contact me on ext 4486. The Committee wishes you all the best for the conduct of the project. Prof Colin Torrance Acting Chair Human Research Ethics Committee Faculty of Human Development
(c) 2
004
Victor
ia Univ
ersit
y
34
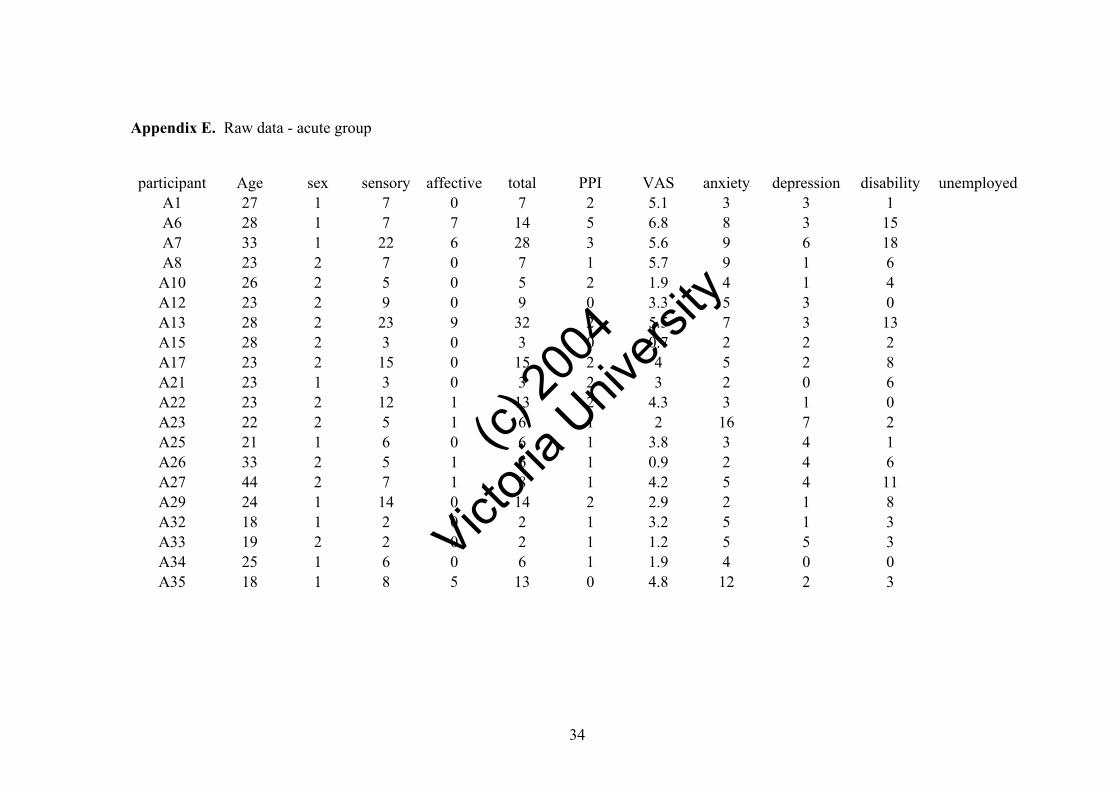
Appendix E. Raw data - acute group
participant Age sex sensory affective total PPI VAS anxiety depression disability unemployed
A1 27 1 7 0 7 2 5.1 3 3 1 A6 28 1 7 7 14 5 6.8 8 3 15 A7 33 1 22 6 28 3 5.6 9 6 18 A8 23 2 7 0 7 1 5.7 9 1 6 A10 26 2 5 0 5 2 1.9 4 1 4 A12 23 2 9 0 9 0 3.3 5 3 0 A13 28 2 23 9 32 2 5.5 7 3 13 A15 28 2 3 0 3 0 0.7 2 2 2 A17 23 2 15 0 15 2 4 5 2 8 A21 23 1 3 0 3 2 3 2 0 6 A22 23 2 12 1 13 2 4.3 3 1 0 A23 22 2 5 1 6 1 2 16 7 2 A25 21 1 6 0 6 1 3.8 3 4 1 A26 33 2 5 1 6 1 0.9 2 4 6 A27 44 2 7 1 8 1 4.2 5 4 11 A29 24 1 14 0 14 2 2.9 2 1 8 A32 18 1 2 0 2 1 3.2 5 1 3 A33 19 2 2 0 2 1 1.2 5 5 3 A34 25 1 6 0 6 1 1.9 4 0 0 A35 18 1 8 5 13 0 4.8 12 2 3

(c) 2
004
Victor
ia Univ
ersit
y
35
Appendix F. Raw data - chronic group
participant Age sex sensory affective total PPI VAS anxiety depression disability unemployed
C1 23 2 12 7 19 2 2.9 11 3 8 C4 30 2 10 2 12 1 1.2 5 0 3 C6 19 2 4 0 4 1 0.8 8 1 4 C7 22 2 11 3 14 2 5.2 9 1 4 C8 27 1 18 3 21 2 5.3 8 8 8 y C9 23 2 5 0 5 1 0.5 5 0 1 C10 21 1 8 1 9 2 4.8 12 4 7 C14 32 2 6 0 6 2 5.4 1 4 2 C15 24 2 7 2 9 1 1.9 10 1 1 C16 57 1 4 0 4 1 1.8 0 2 4 C17 18 2 15 3 18 1 3.1 9 1 4 C21 21 1 13 0 13 2 2.2 5 0 2 C24 26 2 11 2 13 1 4.2 11 5 5 C25 20 1 6 0 6 1 0.4 15 12 1 C26 56 2 6 1 7 2 3.9 1 1 8 C30 30 2 6 2 8 1 0.9 13 9 2 C31 20 1 3 0 3 0 1.1 10 5 0 C33 56 2 18 0 18 0 0.9 2 3 9 C35 35 1 19 4 23 1 2 5 2 1 C38 23 1 9 2 11 1 2.3 5 1 1

(c) 2
004
Victor
ia Univ
ersit
y
36
Appendix G. SPSS output Pearson correlations - acute group
Corre l at ions
1 .622** .962** .360 .534* .156 .154 .603**
. .003 .000 .119 .015 .511 .516 .005
20 20 20 20 20 20 20 20
.622** 1 .811** .487* .611** .446* .274 .698**
.003 . .000 .030 .004 .049 .243 .001
20 20 20 20 20 20 20 20
.962 **.811 ** 1.438 .611 **.271 .210 .693 **
.000 .000. .053 .004.247 .374 .001
20 20 20 20 20 20 20 20
.360 .487 *.438 1.550 *.019 .036 .665**
.119 .030.053 . .012 .938 .881 .001
20 20 20 20 20 20 20 20
.534* .611** .611** .550* 1 .331 .011.537 *
.015 .004 .004 .012 ..153 .964 .015
20 20 20 20 20 20 20 20
.156 .446 *.271 .019 .331 1.495 *.205
.511 .049 .247 .938 .153 ..027 .386
20 20 20 20 20 20 20 20
.154 .274 .210 .036 .011 .495 * 1.268
.516 .243 .374.881 .964.027 . .253
20 20 20 20 20 20 20 20
.603 ** .698** .693** .665** .537*.205 .268 1
.005 .001 .001 .001.015 .386 .253 .
20 20 20 20 20 20 20 20
Pearson Correl at io n
Sig. (2- tai l ed )
N
Pearso n Corr e la tion
Sig. (2- t a il e d )
N
Pears on Correlation
Sig. (2-tailed)
N
Pear so n Corr e la ti on
Sig. (2-tai l e d)
N
Pearson C o rr e l a ti on
Sig. ( 2- t a i le d)
N
Pearson Correl at i o n
Sig. (2-tailed )
N
Pearson Corr elati on
Sig. (2-taile d)
N
Pearso n Corr e la ti o n
Sig. (2-tailed)
N
SENSO RY
AF F E CTI V
TOT A L
PPI
VAS
AN X I ETY
DE P R ESSI
DI S A BILI
SE N S ORY AF F E CTIV TOTA L PPI VASAN X I ETYDE P R ESS IDI S A B ILI
Cor relat ion i s signific ant at t he 0. 0 1 level (2- ta il ed). **.
Correl at ion is signifi cant at the 0 . 0 5 l ev el ( 2- ta il ed ).*.
(c) 2
004
Victor
ia Univ
ersit
y
37
Appendix H. SPSS output Pearson correlations - chronic group
Corre l ations
1.503 *.966 **.087 .260-.0 7 3-.05 7.395
..024 .000 .715 .268 .758 .811 .085
20 20 20 20 20 20 20 20
.503 * 1.709 **.317 .297 .297 -.04 2.273
.024 ..000 .173 .204 .204 .859 .244
20 20 20 20 20 20 20 20
.966 **.709 ** 1.166 .301 .029 -.0 59.404
.000 .000 ..485 .197 .904 .804.077
20 20 20 20 20 20 20 20
.087.317 .166 1.723 **-.0 24-.0 69.324
.715 .173 .485 . .000 .920 .772 .164
20 20 20 20 20 20 20 20
.260 .297 .301 .723 ** 1 -.067 -.011 .434
.268 .204 .197 .000 . .780 .962 .056
20 20 20 20 20 20 20 20
-.07 3 .297 .029-.02 4-.06 7 1 .569**-.12 7
.758 .204 .904 .920 .780 ..009 .592
20 20 20 20 20 20 20 20
-.0 57 -.0 42 -.0 59 -.0 69 -.0 11.569 ** 1.010
.811 .859 .804.772 .962 .009 . .967
20 20 20 20 20 20 20 20
.395 .273 .404 .324 .434 -.1 27 .010 1
.085 .244 .077.164 .056 .592 .967 .
20 20 20 20 20 20 20 20
Pear son Cor r el a tion
Sig. (2-tailed)
N
Pears on Correl ation
Sig. (2- taile d)
N
Pear son Cor r el a tion
Sig. (2- tail ed)
N
Pears on Correl ation
Sig. (2-taile d)
N
Pearso n Corr e la tion
Sig. ( 2-tai led)
N
Pear son Correlation
Sig. (2- t a il e d )
N
Pears on Correlation
Sig. (2- tailed)
N
Pearso n Cor re la ti on
Sig. (2-tail ed)
N
SENSORY
AFFECTIV
TOT AL
PPI
VAS
AN XIETY
DE PRESSI
DI SABILI
SEN SORYAF FECTI VTOT ALPPI VASAN XIETY DEP R ESS I DI SA BILI
Corre lation is significant at the 0.05 level (2-ta i l e d) . *.
Corre l at ion is signi fican t at the 0.01 level (2- tailed). **.

(c) 2
004
Victor
ia Univ
ersit
y
38
Appendix I. SPSS output Pearson correlations - total population
Correl at i ons
1 .574** .963** .251 .360* .064 .039 .492**
. .000 .000 .119 .022 .693 .813 .001
40 40 40 40 40 40 40 40
.574** 1 .773** .435** .456** .360* .097 .569**
.000. .000 .005 .003 .022 .553 .000
40 40 40 40 40 40 40 40
.963 **.773 ** 1.337 *.429 **.168 .062 .568 **
.000 .000 . .033.006 .299 .706 .000
40 40 40 40 40 40 40 40
.251 .435 ** .337* 1 .599** -.0 27 -.0 26.595 **
.119 .005.033 ..000 .867 .874 .000
40 40 40 40 40 40 40 40
.360* .456** .429** .599** 1 .051 -.030 .511**
.022 .003 .006 .000. .755 .854.001
40 40 40 40 40 40 40 40
.064 .360 *.168-.0 27 .051 1.541 **.024
.693 .022 .299 .867 .755 ..000 .884
40 40 40 40 40 40 40 40
.039 .097 .062 -.0 26-.0 30.541 ** 1.100
.813 .553 .706 .874.854 .000 ..538
40 40 40 40 40 40 40 40
.492 ** .569** .568**.595 **.511 ** .024 .100 1
.001 .000 .000 .000 .001 .884 .538 .
40 40 40 40 40 40 40 40
Pearso n Corr e la tion
Sig. (2- t ailed)
N
Pearson C orr el at ion
Sig. (2-tailed)
N
Pear so n Corr e la ti o n
Sig. (2-tail ed )
N
Pears o n C orrel at i on
Sig. (2- tailed)
N
Pearso n Co rrelation
Sig. ( 2- taile d)
N
Pearson Correlation
Sig. (2- tailed )
N
Pear son Co rre lati on
Sig. ( 2- t a i le d)
N
Pear son C or r e l at i on
Sig. (2- tailed )
N
SENSORY
AFFECT I V
TOTAL
PPI
VAS
ANXIE TY
DE P R ES S I
DI S A BILI
SE N S ORY AF F E C T IVTOT A L PPI VAS AN XI E T Y DE PR ESSI DI SA BI LI
Cor relation is si gnifica nt at the 0.01 l ev el (2-tailed).**.
Cor re la t i on i s s i gnifican t a t th e 0 . 05 level (2-t ai led).*.

(c) 2
004
Victor
ia Univ
ersit
y
39
Appendix J. SPSS output descriptive statistics
* LBP group 1 – acute group LBP group 2 – chronic group
Group Statistics
20 8.4000 5.98595 1.33850
20 9.5500 4.96806 1.11089
20 1.5500 2.78104 .62186
20 1.6000 1.81804 .40653
20 9.9500 8.01627 1.79249
20 11.1500 6.08946 1.36165
20 1.5000 1.14708 .25649
20 1.2500 .63867 .14281
20 3.5400 1.74459 .39010
20 2.5400 1.70862 .38206
20 5.5500 3.69174 .82550
20 7.2500 4.29044 .95937
20 2.6500 1.92696 .43088
20 3.1500 3.28113 .73368
20 5.5000 5.24655 1.17316
20 3.7500 2.86310 .64021
LBPGROUP
1.00
2.00
1.00
2.00
1.00
2.00
1.00
2.00
1.00
2.00
1.00
2.00
1.00
2.00
1.00
2.00
SENSORY
AFFECTIV
TOTAL
PPI
VAS
ANXIETY
DEPRESSI
DISABILI
N Mean Std. Deviation
Std. Error
Mean
(c) 2
004
Victor
ia Univ
ersit
y
40
Appendix K. SPSS output - Independent samples t-test
Ind epe n de n t S am pl es Test
.115 .736-.661 38 .513 -1.150 01.739 4 4-4.67 1 32 2.37132
-.661 36.752.513 -1.150 0 1.7394 4-4.67 5 25 2.3752 5
2.091.156 -.067 38 .947-.050 0.7429 5-1.55 4 02 1.45402
-.06732.73 2.947-.050 0.7429 5 -1.562011.462 01
.406 .528 -.533 38 .597-1.20 00 2.2510 2 -5.756 96 3.35696
-.533 35.450 .597-1.20 0 0 2.25102-5.76 7 753.36775
3.139 .084 .852 38 .400.2500.2935 7 -.34430.8443 0
.852 29.747 .401.2500 .2935 7-.3497 7 .84977
.001 .9771.8 31 38.0751.0 00 0 .54 60 3-.1053 8 2.10538
1.831 37.984.0751.0 000 .54 603-. 105392. 105 39
1.4 44.237 -1. 34338.187-1 . 7000 1.2 65 64-4 . 26 2 15 .862 1 5
-1.3 4 3 37.1 7 3.187 -1.7 00 0 1.26 564 -4.2 640 3 .86403
3.309.077 -.58838 .560 -.5000 .85 085 -2.2 22 4 6 1.22 2 4 6
-.588 30.71 3.561 -.5 000 .85085-2.23598 1.2359 8
5.50 0 .0241.30 9 38.198 1.7 5001. 33648-. 955 5 74. 4555 7
1.3 0929. 39 5.2011.7500 1.33648-.981 82 4.481 8 2
Equal v a riance s
ass u med
Equal va riances
not assumed
Equal var ianc es
ass u med
Equal va riances
not a ssu m ed
Equal v a ria nces
assumed
Equal va r iance s
not assu med
Equal variances
ass umed
Equal variance s
not a ss umed
Equal va riances
assumed
Equal v a riances
not a ssumed
Equal v ariances
assumed
Equal var ian c es
not assu med
Equal varia n ces
ass umed
Equal v ariances
not a ss umed
Equal va ri ances
as s u me d
Equal va rianc e s
not as su m e d
SE N S O RY
AF F E CT I V
TOT A L
PPI
VAS
AN X I E TY
DE P R E SSI
DI S A BI LI
FSig.
Levene's T est for
Equal i ty of V ariances
t df Sig. (2-t ai led)
Mean
D i f ferenc e
S t d . E r ro r
D i f ferenc e LowerUpper
95% C o nfi denc e
Interval o f t h e
Dif fe r e nc e
t-test fo r E quali ty of Means