Embed Size (px)
Citation preview
I
Pakistan's Trade Competitiveness &
Complementarities in South Asia
By:
Dr. Dawood Mamoon
Sohail A. Paracha
Hammad Mughal
Anam Ayesha

II
Abstract:
Over the past decade Pakistan remained involved in two major trade
agreements with in the South Asia (Pakistan-Sri Lanka FTA and SAFTA). It is
meaningful from an operational and policy perspective to evaluate Pakistan's
trade performance in South Asia against its objectives of greater trade
integration and suggest policy interventions to improve its effectiveness. In
order to achieve this objective, current study evaluates Pakistan‟s trade
performance with major South Asian economies for the last eight years (2003-
10). This study has been disaggregated into two parts: In the first part of the
study, an assessment of trade performance of major South Asian economies is
carried out with respect to the rest of the world. Pakistan's trade performance
vis-à-vis other major South Asian members is the focus of this part. In the
second part Pakistan‟s trade performance in South Asia has been analyzed and
policy interventions have been suggested to improve its effectiveness. Certain
trade indicators like Trade Complementarity Index (TCI), Grubel Lloyd Index
(GLI), Revealed Comparative Analysis (RCA), Bilateral Revealed
Comparative Analysis (BRCA) and Revealed Market Access (RMA) have
been employed to achieve the above objectives.
JEL Classification: F13, F15

III
Table of Contents
1. INTRODUCTION: ........................................................................................................ 1
1.1. Objective of Study: .................................................................................................................. 1
1.2. Data and Methodology: .......................................................................................................... 2
1.3. Literature Review: ................................................................................................................... 2
2. SOUTH-ASIAN MAJOR ECONOMIES TRADE PERFORMANCE ....................................... 4
(World and Intra-regional trade)
2.1. BIPS Exports Performance (World) ......................................................................................... 4
2.2. BIPS Exports Performance (Intra-regional) ............................................................................. 5
2.3 Comparison between BIPS World and Intraregional Exports Shares: .................................... 7
2.3. BIPS Import Performance (World) .......................................................................................... 8
2.4 BIPS Imports Performance (Intra-regional) ............................................................................ 9
2.5 Comparison between BIPS World and Intraregional Imports Shares ................................... 11
3. PAKISTAN’S TRADE PERFORMANCE WITH SOUTH-ASIA’S MAJOR ECONOMIES ......... 12
3.1. Pakistan’s Exports Performance ........................................................................................... 12
3.2. Pakistan’s Imports Performance ........................................................................................... 13
4. COMMODITY WISE SHARE IN INTRA-REGIONAL TRADE: ........................................... 14
(Exports and Imports of Pakistan to Major South Asian Countries)
4.1. Pakistan’s Trade with India: .................................................................................................. 14
4.2. Pakistan’s Trade with Sri Lanka: ............................................................................................ 17
4.3. Pakistan’s Trade with Bangladesh: ....................................................................................... 19
5. TRADE INDICATORS ANALYSIS: ................................................................................ 21
(Competitiveness and Complementarities)
5.1. Trade Complementarily Index: ............................................................................................. 21
5.1.1. TCI of Pakistan’s Export to South-Asian Major Economies ........................................... 22
5.1.1. TCI of South-Asian Major Economies Export to Pakistan: ............................................ 23
5.2. Revealed Comparative Advantage: ....................................................................................... 25
5.3. Regional Revealed Comparative Analysis: ............................................................................ 27
5.4. Revealed Market Access: ...................................................................................................... 29
5.5. Summary of RCA, BRCA and RMA: ........................................................................................ 32

IV
5.6. Grubel-Lloyd Index: ............................................................................................................... 34
5.6.1. Intra Industry Trade between Pakistan and India: ........................................................ 35
5.6.2. Intra Industry Trade between Pakistan and Sri Lanka: ................................................. 36
5.6.3. Intra Industry Trade between Pakistan and Bangladesh: ............................................. 37
6. CONCLUSION ........................................................................................................... 38
7. ANNEXURE: ............................................................................................................. 40
8. REFERENCES: ........................................................................................................... 47

1
1. INTRODUCTION:
South Asia is an important region playing a significant role in world trade. The region
comprises major economies of Bangladesh, India, Pakistan and Sri-Lanka (BIPS), whereas
other economies include Nepal, Maldives, Bhutan and Afghanistan. All these eight countries
are member of South Asian Association for Regional Corporation (SAARC). The
proliferation of regional trade agreements along with liberalization of international trade in
the 90s created a consensus to increase trade integration among SAARC countries. This led
to signing of South Asian Preferential Trading Agreement (SAPTA) in 1993. SAPTA came
into force in December 1995 after first round of negotiations was concluded in April 1995.
In December 1995, it was also decided to create South Asian Free Trade Area (SAFTA). The
SAFTA agreement was signed in January 2004 among its seven initial partners, i.e., India,
Pakistan, Sri Lanka, Bangladesh, Nepal, Bhutan and Maldives, and came into force in
January 2006. In addition to SAFTA other bilateral trade agreements (BTA) also came into
being in the time period of 2003 to 2010 like Pakistan Sri-Lanka FTA (2005) and India Sri-
Lanka FTA are the agreements between the major economies of South Asia. From
multilateral trade agreement SAFTA to certain other bilateral trade agreements enforce
between South-Asian countries, it is meaningful from an operational and policy perspective
to evaluate Pakistan‟s trade performance with respect to South-Asian major economies
against its objectives of greater trade integration and suggest policies and interventions to
improve its effectiveness. At the outset, it should be mentioned that economic and non-
economic impacts (whether they are small or large) of any type of trade agreements permeate
the entire economy of partner countries. Trade performance as measured by various trade
indicators is just one component of economy-wide impacts. Overall, sector level growth,
employment, revenue and poverty impacts are few other factors that constitute the economy-
wide impacts of any trade agreement.
The current study is comprised of the following sections. Section 1 explains the brief
introduction, objectives of the study, literature review and data & methodology used for the
current study. Section 2 highlights the South-Asian major economies including, Bangladesh,
India, Pakistan and Sri-Lanka (BIPS) trade performance with the world and its comparison
with their Intraregional trade. Section 3 shows the Pakistan‟s trade performance with Sout-
Asian major economies like India, Bangladesh and Sri-Lanka based on share analysis of its
exports and imports. Section 4 provides the commodity-wise shares analysis of Pakistan‟s
exports and imports with major economies of South-Asia. Section 5 provides the results of
certain trade indices calculated to evaluate the trade performance of Pakistan with the major
economies in South-Asia. Section 6 concludes and provides certain recommendations for
policy makers.
1.1. Objective of Study:
The study provides guidelines for the relevant stakeholders and government policy makers by
providing a detailed import and export profiles of major products which are traded within the
South Asian region by Pakistan, India, Sri Lanka and Bangladesh. The study utilizes various
indicators of trade competitiveness and highlights all those major products where each
member country has witnessed a positive or negative change in its trade share.

2
1.2. Data and Methodology:
Current study evaluates the Pakistan‟s intra-regional trade performance (merchandise imports
and exports) for the years 2003 to 2010. The trade data utilized in the study is at chapter and
6-Digit product level, whereas GL-Index of major traded products is also calculated at SITC
level for the years 2003 and 2010. The bilateral trade patterns are estimated for Pakistan,
India, Sri-Lanka and Bangladesh.
The main data source used for current study is the online database of www.trademap.org
along with certain other additional data sources of commerce and trade. The type of analysis
done majorly comprised of shares analysis and calculation of certain trade indicators and
indices.
1.3. Literature Review:
Regional Agreements are important frameworks to boost intra regional trade among member
countries. There are many studies which look at South Asian region and prospects of intra
regional trade among its members. For example, Mehta and Kumar (2004) argued that
signing of SAFTA agreement was a landmark in the evolution of SAARC since its formation
in 1985. SAARC would benefit from regionalism if its cooperation would extend beyond
formal trade. Dhungel (2004) noted that actual progress and achievement in implementation
of SAARC agendas were considered insignificant. Jhamb (2006) supported Dhungel‟s view
and argued that it was primarily due to the tenuous political relations between India and
Pakistan and a general environment of mistrust among member countries. However, by using
the Gravity Model, Rahman, et al. (2006) showed that elimination of trade barriers and
structural rigidities originating from adverse political relationship could lead to substantial
increase in intra-SAARC trade. Pitigala (2005) found that the trade structures that evolved
among the South Asian countries might not facilitate a rapid increase in intraregional trade
due to weak trading relations among the SAARC countries. This view was supported by a
study by Baysan, (2006). He argued that the economic case for SAFTA is relatively weak.
Compared to the rest of the world, this region was tiny both in terms of economic size as
measured by GDP (and per capita income) and the share in the world trade. Therefore, trade
preferences to the regional partners would likely be leading to a consequence of trade
diversion rather than trade creation. Similarly, Das (2007) argued that evidence of trade
complementarily in South Asia is mixed, so preferential trading initiative was based on a
weak proposition. Recently, New Farmer and Pierola (2007) found that the arrangements of
preferential trading in South Asia including SAFTA fell short of their potential because of
product exemptions, special arrangements for selected products and restrictive rules for point
of origin. Though upside potentials for SAFTA were great, benefits from this trading
arrangement were uncertain. So, the policy makers will require relentless determination to
make it successful in future.
In the literature, there exists a debate on possible gains of SAFTA. Different studies use
different methodologies and computed different results. Most of the studies have examined
the impact of lowering tariffs to zero under SAFTA though few other studies also examined
the affect of other scenarios as well. Krueger (2004) examined that the potential gains do
exists in SAFTA but for successful trade agreements, it is necessary that South Asian region
must meet the theory based criteria for large welfare gains. When the comprehensive study
3
on the regional trade is conducted, it concluded that SAFTA countries trade in similar goods
with apparel and clothing being the major export item and crude oil being the major import
item and large potential exists for increased trade. The study also concluded that SAFTA
could lead to growth in South Asian region. The study takes a comprehensive look at the
pessimistic and optimistic predictions relating to SAFTA. The study concluded that even
though this agreement would lead to growth in the South Asian region but it has limited
capability to increase intra-regional or extra regional trade for its members. Baysan and
Panagriya (2006) analyzed the qualitative and quantitative arguments which make SAFTA
weak. In the qualitative analysis, it is seen that the economic size of the region is small as
compared to the world in terms of GDP with a contribution of only 2% to world GDP in
2009. If India is excluded than this size falls to only 0.4%. Therefore the possibility of most
efficient member countries in the region is very small. Similarly the protection level given to
the region is very high and if the country participates in the regional trade agreement than it
must incur the welfare losses because of trade diversion. Another reason why SAFTA is
weak is that the domestic lobbies want that the sectors which do not withstand competition
must be entered in to sensitive list, so that no tariff reduction and other rules of SAFTA
agreement are applied on them. Pigato (1997) & Shakur and Rae (2005) used CGE model to
SAFTA and concluded that SAFTA gains are smaller than unilateral trade liberalization.
Govindan (1994) examined liberalization will result in increased trade and welfare gains
within the region. And in 1996, he concluded with Derosa (1996) that if liberalization is done
on non-discriminatory basis than the welfare gains are larger. Raihan and Razzaque (2007)
also used CGE model for the analysis and investigated if there is full implementation of
SAFTA agreement than this will lead to welfare gains to Sri Lanka, India and other South
Asian countries with the exception of Bangladesh because of negative trade diversion effect.
Bangladesh and other LDCs in South Asia will have to increase their export share in Indian
market to eliminate negative trade diversion. Kumar and Saini (2007) estimated different
scenarios of SAFTA and its implications for the welfare of each economy within the region.
They found that the SAFTA scenario does not result in welfare gains for all the economies in
South Asia except Bangladesh. While the rest of South Asia gains about half a billion dollars,
India gains by about $204 million, Sri Lanka by $89 million and Bangladesh has a welfare
loss of $225 million. Gains for India and Sri Lanka are mainly due to the gains in terms of
trade.

4
2. SOUTH-ASIAN MAJOR ECONOMIES TRADE PERFORMANCE
(World and Intra-regional trade)
This section examines and estimates the trade performance of the South-Asian major
economies like Bangladesh, India, Pakistan and Sri-Lanka (BIPS) as a group, excluding
Nepal, Maldives and Bhutan because of their negligible trade with the World and regionally
within the South-Asia. In this study a comparison of BIPS countries trade with the world and
their intraregional trade performance is also carried out for the last seven years i.e. from the
year 2003 to 2010. The main objective of this exercise is to examine whether there has been
any change in the trade performance of the region major economies (BIPS) with the rest of
the world over sample period of time. Whereas the second objective of the study is to make
the cross-comparison of BIPS economies global trade performance vis-à-vis, their
intraregional trade performance over the last seven years. The BIPS countries lagged behind
in terms of openness to international trade in- spite of the fact that most of the countries have
undertaken trade reforms in late 90s as compared to ASEAN countries. The intra-regional
trade among South-Asian major economies was affected by political tension within the
region, protectionist trade regime and large volume of informal trade. It is argued out that the
region has limited complementarities that constrain expansion of intra-regional trade under
free trade mechanismi. Secondly it is argued that greater the extent of competitiveness among
the major economies the lower is the probability of a regional agreement to succeed. Thirdly,
these countries trade very little among themselves which may lead to substantial trade
diversion than trade creation for some member countries within and outside South Asia
region.
2.1. BIPS Exports Performance (World)
Despite showing good economic performance, South-Asian countries faces array of social
and economic constraints ranging from poor infrastructure, weak institutional policies,
poverty, poor health, poor education, unhygienic environment and unskilled labor etc.
Table 2.1 shows that South-Asian major economies Bangladesh, India, Pakistan and Sri-lanka
(BIPS) as a group exports to world in terms of absolute value rise from $ US 82.56 billion in
2003 to $ US 211.14 billion in 2010, collectively contributing a share of about 1.11% in total
world export in 2003, which rose marginally to about 1.53% in 2010. Whereas in terms of
growth rates the BIPS countries annual percentage export growth rate decreased from 24.78%
in 2003 to 1.16% in 2010. Since 2004, South Asia exports to the world experienced a
sustained positive annual growth rate for all years except for the year 2009 when it abruptly
declined by -3.75% is due to the affects of global financial crises.
Table: 2.1
BIPS Global Exports (US $ billions)
2003 2004 2005 2006 2007 2008 2009 2010
Global Exports 7470.79 9100.72 10367.89 12013.92 13843.14 15981.79 12318.90 14464.84
BIPS Global Exports 82.56 103.02 131.89 156.59 184.54 227.13 218.61 221.14
% Share 1.11% 1.13% 1.27% 1.30% 1.33% 1.42% 1.77% 1.53%
% Growth 24.78% 28.03% 18.72% 17.85% 23.08% -3.75% 1.16%
Source: Author’s own calculations based on Trade Map Data
5
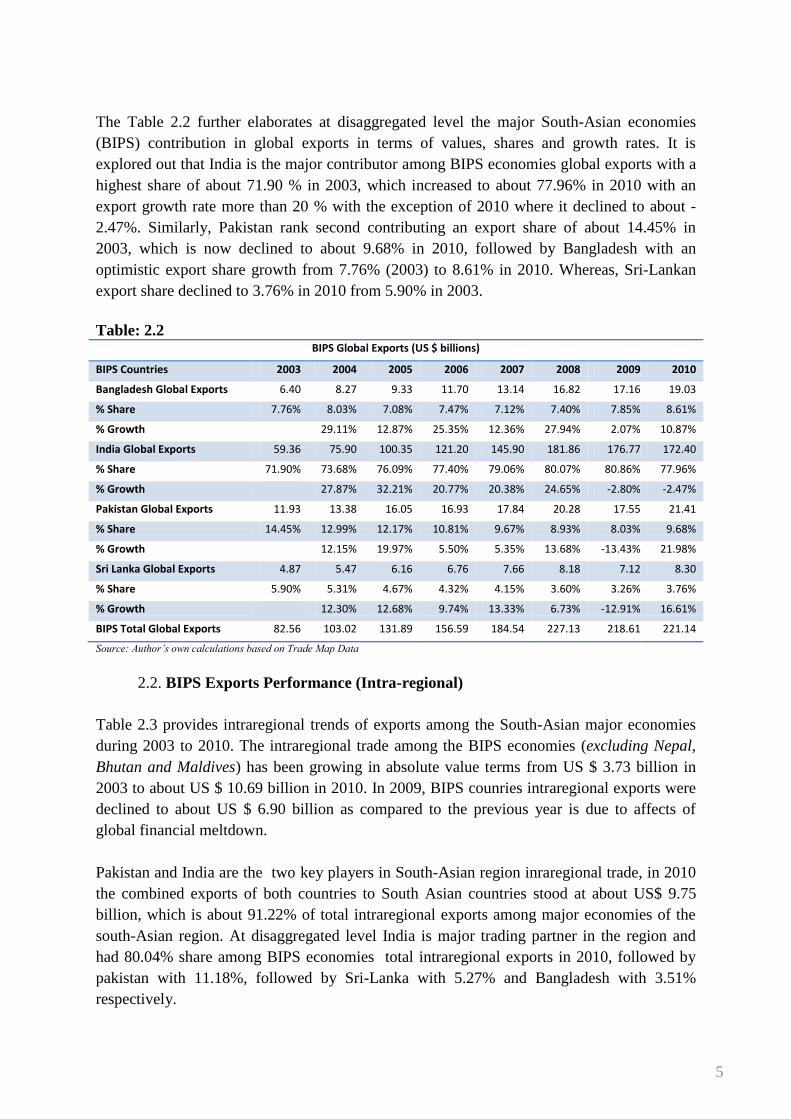
The Table 2.2 further elaborates at disaggregated level the major South-Asian economies
(BIPS) contribution in global exports in terms of values, shares and growth rates. It is
explored out that India is the major contributor among BIPS economies global exports with a
highest share of about 71.90 % in 2003, which increased to about 77.96% in 2010 with an
export growth rate more than 20 % with the exception of 2010 where it declined to about -
2.47%. Similarly, Pakistan rank second contributing an export share of about 14.45% in
2003, which is now declined to about 9.68% in 2010, followed by Bangladesh with an
optimistic export share growth from 7.76% (2003) to 8.61% in 2010. Whereas, Sri-Lankan
export share declined to 3.76% in 2010 from 5.90% in 2003.
Table: 2.2 BIPS Global Exports (US $ billions)
BIPS Countries 2003 2004 2005 2006 2007 2008 2009 2010
Bangladesh Global Exports 6.40 8.27 9.33 11.70 13.14 16.82 17.16 19.03
% Share 7.76% 8.03% 7.08% 7.47% 7.12% 7.40% 7.85% 8.61%
% Growth 29.11% 12.87% 25.35% 12.36% 27.94% 2.07% 10.87%
India Global Exports 59.36 75.90 100.35 121.20 145.90 181.86 176.77 172.40
% Share 71.90% 73.68% 76.09% 77.40% 79.06% 80.07% 80.86% 77.96%
% Growth 27.87% 32.21% 20.77% 20.38% 24.65% -2.80% -2.47%
Pakistan Global Exports 11.93 13.38 16.05 16.93 17.84 20.28 17.55 21.41
% Share 14.45% 12.99% 12.17% 10.81% 9.67% 8.93% 8.03% 9.68%
% Growth 12.15% 19.97% 5.50% 5.35% 13.68% -13.43% 21.98%
Sri Lanka Global Exports 4.87 5.47 6.16 6.76 7.66 8.18 7.12 8.30
% Share 5.90% 5.31% 4.67% 4.32% 4.15% 3.60% 3.26% 3.76%
% Growth 12.30% 12.68% 9.74% 13.33% 6.73% -12.91% 16.61%
BIPS Total Global Exports 82.56 103.02 131.89 156.59 184.54 227.13 218.61 221.14
Source: Author’s own calculations based on Trade Map Data
2.2. BIPS Exports Performance (Intra-regional)
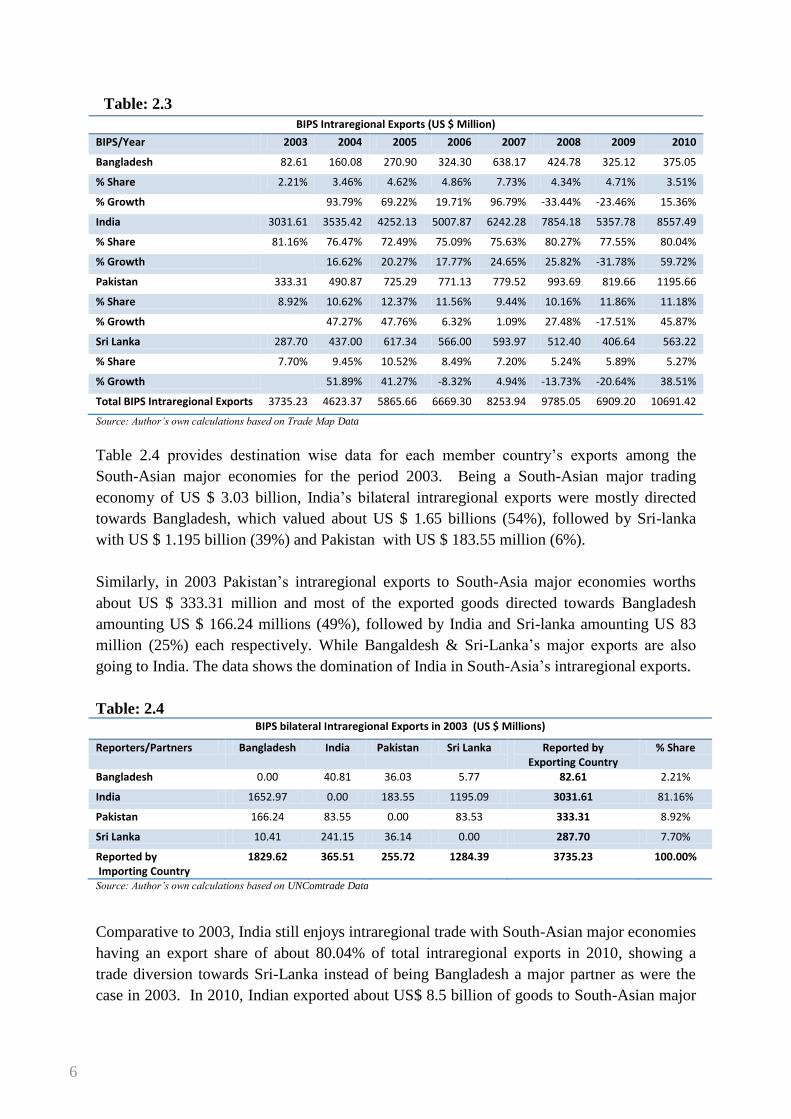
Table 2.3 provides intraregional trends of exports among the South-Asian major economies
during 2003 to 2010. The intraregional trade among the BIPS economies (excluding Nepal,
Bhutan and Maldives) has been growing in absolute value terms from US $ 3.73 billion in
2003 to about US $ 10.69 billion in 2010. In 2009, BIPS counries intraregional exports were
declined to about US $ 6.90 billion as compared to the previous year is due to affects of
global financial meltdown.
Pakistan and India are the two key players in South-Asian region inraregional trade, in 2010
the combined exports of both countries to South Asian countries stood at about US$ 9.75
billion, which is about 91.22% of total intraregional exports among major economies of the
south-Asian region. At disaggregated level India is major trading partner in the region and
had 80.04% share among BIPS economies total intraregional exports in 2010, followed by
pakistan with 11.18%, followed by Sri-Lanka with 5.27% and Bangladesh with 3.51%
respectively.
6
Table: 2.3
BIPS Intraregional Exports (US $ Million)
BIPS/Year 2003 2004 2005 2006 2007 2008 2009 2010
Bangladesh 82.61 160.08 270.90 324.30 638.17 424.78 325.12 375.05
% Share 2.21% 3.46% 4.62% 4.86% 7.73% 4.34% 4.71% 3.51%
% Growth 93.79% 69.22% 19.71% 96.79% -33.44% -23.46% 15.36%
India 3031.61 3535.42 4252.13 5007.87 6242.28 7854.18 5357.78 8557.49
% Share 81.16% 76.47% 72.49% 75.09% 75.63% 80.27% 77.55% 80.04%
% Growth 16.62% 20.27% 17.77% 24.65% 25.82% -31.78% 59.72%
Pakistan 333.31 490.87 725.29 771.13 779.52 993.69 819.66 1195.66
% Share 8.92% 10.62% 12.37% 11.56% 9.44% 10.16% 11.86% 11.18%
% Growth 47.27% 47.76% 6.32% 1.09% 27.48% -17.51% 45.87%
Sri Lanka 287.70 437.00 617.34 566.00 593.97 512.40 406.64 563.22
% Share 7.70% 9.45% 10.52% 8.49% 7.20% 5.24% 5.89% 5.27%
% Growth 51.89% 41.27% -8.32% 4.94% -13.73% -20.64% 38.51%
Total BIPS Intraregional Exports 3735.23 4623.37 5865.66 6669.30 8253.94 9785.05 6909.20 10691.42
Source: Author’s own calculations based on Trade Map Data
Table 2.4 provides destination wise data for each member country‟s exports among the
South-Asian major economies for the period 2003. Being a South-Asian major trading
economy of US $ 3.03 billion, India‟s bilateral intraregional exports were mostly directed
towards Bangladesh, which valued about US $ 1.65 billions (54%), followed by Sri-lanka
with US $ 1.195 billion (39%) and Pakistan with US $ 183.55 million (6%).
Similarly, in 2003 Pakistan‟s intraregional exports to South-Asia major economies worths
about US $ 333.31 million and most of the exported goods directed towards Bangladesh
amounting US $ 166.24 millions (49%), followed by India and Sri-lanka amounting US 83
million (25%) each respectively. While Bangaldesh & Sri-Lanka‟s major exports are also
going to India. The data shows the domination of India in South-Asia‟s intraregional exports.
Table: 2.4 BIPS bilateral Intraregional Exports in 2003 (US $ Millions)
Reporters/Partners Bangladesh India Pakistan Sri Lanka Reported by Exporting Country
% Share
Bangladesh 0.00 40.81 36.03 5.77 82.61 2.21%
India 1652.97 0.00 183.55 1195.09 3031.61 81.16%
Pakistan 166.24 83.55 0.00 83.53 333.31 8.92%
Sri Lanka 10.41 241.15 36.14 0.00 287.70 7.70%
Reported by Importing Country
1829.62 365.51 255.72 1284.39 3735.23 100.00%
Source: Author’s own calculations based on UNComtrade Data
Comparative to 2003, India still enjoys intraregional trade with South-Asian major economies
having an export share of about 80.04% of total intraregional exports in 2010, showing a
trade diversion towards Sri-Lanka instead of being Bangladesh a major partner as were the
case in 2003. In 2010, Indian exported about US$ 8.5 billion of goods to South-Asian major

7
economies and its major exports destination is Sri-Lanka amounting about US $ 3.3 billion
(38%), followed by Bangladesh with US$ 3.0 billion (35%) and Pakistan with US$ 2.2
billion (26%).
While on the other hand in 2010, Pakistan‟s export in South-Asia majorly destinated towards
Bangladesh of amount US $ 636.81 millions, followed by Sri-Lanka (US $ 283.87 million)
and India (US $ 274.98 million). The table shows that major economies of South-Asia i.e.
India and Pakistan have witnessed export gains within the region. Whereas Sri-Lankan &
Bangladesh in the South-Asian region majorly exports its goods to India of valued US $
274.98 million and US $ 288.53 million respectively.
Table: 2.5 BIPS Bilateral Intraregional Exports in 2010 (US $ Millions)
Reporters/Partners Bangladesh India Pakistan Sri Lanka Reported by Exporting Country
% Share
Bangladesh 0.00 288.53 73.90 12.62 375.05 3.51%
India 3016.57 0.00 2235.79 3305.12 8557.49 80.04%
Pakistan 636.81 274.98 0.00 283.87 1195.66 11.18%
Sri Lanka 35.58 467.18 60.45 0.00 563.22 5.27%
Reported by Importing Country
3688.97 1030.70 2370.14 3601.61 10691.42 100.00%
Source: Author’s own calculations based on UNComtrade Data
2.3 Comparison between BIPS World and Intraregional Exports Shares:
When compared to the economic performance of the South-Asian major economies global
trade with respect to their intraregional trade, it is found that in terms of absolute value the
intraregional trade among BIPS countries increased from US $ 3.74 billion in 2003 to US $
10.69 billion in 2010 but in term of their percentage share to their global exports it is almost
remain stagnant to about 4% since 2003 to 2010. The trade within the region is low when
compared to its economic size in terms of GDP value and shares when comparing the BIPS
economies trade with the world.
Table 2.6
Comparison between BIPS Global and Intraregional Exports Values & Shares (US $ Billions)
2003 2004 2005 2006 2007 2008 2009 2010
Global Export by BIPS Economies 82.56 103.02 131.89 156.59 184.54 227.13 218.61 221.14
Total Intraregional Exports Among BIPS Economies
3.74 4.62 5.87 6.67 8.25 9.79 6.91 10.69
% share of BIPS Intraregional Exports w.r.t Global Exports
4.52% 4.49% 4.45% 4.26% 4.47% 4.31% 3.16% 4.83%
Source: Author’s own calculations based on Trade Map Data
As shown in Table 2.6 in 2003, cumulatively about 95.48% of BIPS countries exports
directed towards rest of the world, while only 4.52% of region‟s total exports are traded
within the South-Asian region. While in 2010, this trend is more pronounced when 4.83% of

8
South-Asian region total exports took place within the region and 95.17% of the exports are
made to rest of the world.
The table 2.7 explains the export shares of most South-Asian major economies to rest of the
world (RoW) is almost above 90% but their contribution to intraregional export is in a single
digit having a share below 5% since last seven years (2003-2010). In the South Asian region,
Sri-Lanka stands at top contributing intraregional exports to about 5.91% of its total global
exports in 2003, which now rose about 6.78% in 2010, respectively. India stands second in
the South-Asian region, contributing intraregional exports to about 5.11% of its total export
to world in 2003, which decreased to about 4.96% in the period 2010. While Pakistan is the
only country within the South-Asian region, where its intraregional export contribution rise
significantly from 2.79% in 2003 of its total export to world to about 5.58% in 2010. While
the Bangladesh is the only country within the region where its export contribution
intraregional in terms of percentage share of its total export to world remains almost stable
which is below 2%.
Table 2.7
Comparison of % Share of BIPS Intraregional Exports w.r.t their Global Exports
2003 2010
Bangladesh 1.29% 1.97%
India 5.11% 4.96%
Pakistan 2.79% 5.58%
Sri Lanka 5.91% 6.78% Source: Author‟s calculations based on Trade Map data
2.3. BIPS Import Performance (World)
Like developing nations, South-Asian major economies are also highly dependent on world
to fulfill their needs of technology, machinery etc, which is elaborated in the Table 2.8 which
shows that the BIPS countries total imports from the world amounted to about US $ 102.18
billion in 2003 rising to US $ 291.68 billion in 2010. The share of the South-Asia region
imports against the global imports was about 1.33% in 2003 which rose to 2.59% in 2009 but
in 2010 it declined to 1.94%. While in terms of region‟s import growth mostly remained
above 20% since 2003, with the exception of last two years (2009 to 2010), the regions
dependency on world imports decreased to about -16.58% and further to -10.48%
respectively.
Table: 2.8 BIPS Global Imports (US $ Billions)
2003 2004 2005 2006 2007 2008 2009 2010
Total Global Imports 7663.71 9417.883 10641.57 12273.21 14081.21 16384.49 12587.45 15027.76
BIPS Global Imports 102.14 136.15 186.90 233.50 280.25 390.55 325.81 291.68
% Share 1.33% 1.45% 1.76% 1.90% 1.99% 2.38% 2.59% 1.94%
% Growth 33.30% 37.27% 24.94% 20.02% 39.36% -16.58% -10.48%
Source: Author‟s calculations based on Trade Map data

9
The Table 2.9 shows how much BIPS countries are dependent on world for their needs, in
terms of imports value, shares and annual growth rates from the period 2003 to 2010. Like
exports, India has the highest share of world imports within the region, which was about US$
72.43 billion (70.91% of BIPS global Imports) in 2003, rose both in terms of value and share
to about US$ 220.29 billion (80.58% of BIPS global Imports) in 2010.
Pakistan ranks second among the major economies of South-Asia with global import value
US$ 13.05 billion (12.78% of BIPS global Imports), which rose to about US$ 37.54 billion
(12.87% of BIPS global Imports) in 2010. Similarly, the Bangladesh and Sri Lanka ranked
third and fourth within the region with declining import share. The table 2.9 suggests that
India has the highest global imports growth rate within the region, followed by Pakistan, Sri-
Lanka and Bangladesh since 2003 to 2010.
Table: 2.9 BIPS Global Imports (dis-Aggregation) (US $ Billions)
BIPS/Year 2003 2004 2005 2006 2007 2008 2009 2010
Bangladesh Global Imports 10.15 11.37 12.63 15.69 17.62 18.88 18.39 21.50
% Share 9.93% 8.35% 6.76% 6.72% 6.29% 4.83% 5.65% 7.37%
% Growth 12.09% 11.06% 24.21% 12.33% 7.14% -2.58% 16.89%
India Global Imports 72.43 98.98 140.86 178.21 218.65 315.71 266.40 220.29
% Share 70.91% 72.70% 75.37% 76.32% 78.02% 80.84% 81.77% 75.52%
% Growth 36.66% 42.31% 26.52% 22.69% 44.39% -15.62% -17.31%
Pakistan Global Imports 13.05 17.95 25.10 29.83 32.59 42.33 31.58 37.54
% Share 12.78% 13.18% 13.43% 12.77% 11.63% 10.84% 9.69% 12.87%
% Growth 37.55% 39.82% 18.84% 9.28% 29.86% -25.38% 18.85%
Sri Lanka Global Imports 6.51 7.85 8.31 9.77 11.39 13.63 9.43 12.35
% Share 6.38% 5.77% 4.44% 4.19% 4.06% 3.49% 2.89% 4.24%
% Growth 20.54% 5.79% 17.65% 16.50% 19.70% -30.80% 30.98%
BIPS Total Global Imports 102.14 136.15 186.90 233.50 280.25 390.55 325.81 291.68
Source: Author‟s calculations based on Trade Map data
2.4 BIPS Imports Performance (Intra-regional)
In order to look the dependency of major South-Asian ecnomies‟ for their imports from the
region since 2003 to 2010, the Table 2.10 shows that the cummulative intraregional imports
among BIPS countries stood at US $ 3.30 billion in 2003, which now rose to US$ 9.12 US
billion in 2010. The country wise analysis indicates that Bangladesh and Sri-Lanka are the
bigger importers within the region and both commulatively imports about 71.58% of total
BIPS countries intraregional imports in 2010. Bangladesh imports about 40.42 % of
intraregional imports, while Sri-Lanka by about 31.16%. While Pakistan and India are the
least importer within the region and imports to about 18.49% and 9.93% of total intraregional
imports respectively. Similarly in terms of import growth, Bangladesh and Sri-Lanka are
highly integrated in intraregional trade as compared to Pakistan and India, who are highly
integrated to external trade and full fill their demand from rest of the world as shown in the
table.

10
Table: 2.10 BIPS Intraregional Imports (Dis-Aggregation) (US $ Millions)
BIPS/Year 2003 2004 2005 2006 2007 2008 2009 2010
Bangladesh 1571.82 1430.66 1540.50 2047.22 2538.66 3688.81 2570.89 3688.97
% Share 47.63% 36.42% 33.16% 32.68% 32.30% 37.56% 39.41% 40.42%
% Growth -8.98% 7.68% 32.89% 24.01% 45.31% -30.31% 43.49%
India 262.68 481.43 838.14 1015.46 961.37 1250.42 835.34 905.95
% Share 7.96% 12.26% 18.04% 16.21% 12.23% 12.73% 12.81% 9.93%
% Growth 83.27% 74.09% 21.16% -5.33% 30.07% -33.19% 8.45%
Pakistan 312.40 545.14 703.96 1241.85 1388.35 1843.64 1212.31 1687.19
% Share 9.47% 13.88% 15.15% 19.82% 17.66% 18.77% 18.58% 18.49%
% Growth 74.50% 29.13% 76.41% 11.80% 32.79% -34.24% 39.17%
Sri Lanka 1153.15 1470.65 1563.72 1959.69 2971.50 3037.12 1904.83 2844.17
% Share 34.94% 37.44% 33.66% 31.28% 37.81% 30.93% 29.20% 31.16%
% Growth 27.53% 6.33% 25.32% 51.63% 2.21% -37.28% 49.31%
BIPS Intraregional Imports 3300.06 3927.88 4646.33 6264.23 7859.88 9819.99 6523.37 9126.28
Source: Author‟s calculations based on Trade Map data
If we look at the imports among BIPS countries in base period (2003) , the table 2.11 shows
that the main importers among the South-Asia‟s intraregional trade were Bangladesh and Sri-
Lanka. Bangladesh has the largest share in total intraregional imports which was about
47.63% (US$ 1.57 billion), and within the region bangladesh full fills its domestic needs
mainly from India of about US$ 1.43 billion of goods and Pakistan with US$ 124.51 million.
Whereas Sri-Lanka comes second, who imports US$ 1.15 billion (34.94%) of BIPS countries
total intraregional imports and imports goods mainly from India amounting (US$ 1.0 billion).
While Pakistan mainly imports goods from India within the region.
Table: 2.11
BIPS Bilateral Intraregional Imports in 2003 (US $ Millions)
BIPS/Year Bangladesh India Pakistan Sri Lanka Reported by Importing Country
% Share
Bangladesh 0.00 1437.88 124.41 9.54 1571.82 47.63%
India 71.50 0.00 68.05 123.13 262.68 7.96%
Pakistan 42.91 226.24 0.00 43.25 312.40 9.47%
Sri Lanka 5.63 1076.52 71.00 0.00 1153.15 34.94%
Reported by Exporting Country
120.04 2740.64 263.46 175.92 3300.06 100.00%
Source: Author‟s calculations based on Trade Map data
Comparing to the 2003 intrargional imports among BIPS countries , the Table 2.12 shows
that in 2010 Bangladesh (40.42%) & Sri-Lanka (31.16%) are still the major importer‟s within
the region and had a cummulative share of about 71.58% of total intraregonal imports among
South-Asian major economies. Bangladesh, Sri-lanka and Pakistan in the region mostly rely
on Indian products to full fill their domestic needs. while It is interesting to note that in 2010
Pakistan‟s intraregional import share has been increased to about two fold when compared to

11
the base period 2003 share. Whereas, india imports products majorly form Sri-Lanka of
worth US$ 368.99 million in 2010. Comparison of 2003 and 2010 time period shows that
India & Pakistan had showed increase in imports shares, whereas Bangladesh and Sri-Lanka
showed decline in its imports share.
Table: 2.12
BIPS Bilateral Intraregional Imports in 2010 (US $ Millions)
BIPS/Year Bangladesh India Pakistan Sri Lanka Reported by Importing Country
% Share
Bangladesh 0.00 3016.57 636.81 35.58 3688.97 40.42%
India 288.53 0.00 248.42 368.99 905.95 9.93%
Pakistan 73.90 1559.92 0.00 53.37 1687.19 18.49%
Sri Lanka 12.62 2549.44 282.11 0.00 2844.17 31.16%
Reported by Exported Country
375.05 7125.93 1167.35 457.94 9126.28 100.00%
Source: Author‟s calculations based on Trade Map data
2.5 Comparison between BIPS World and Intraregional Imports Shares
The Table 2.13 explains that intraregional imports among South-Asian major economies
increased from US$ 3.30 billion to US$ 9.13 billion in 2010. The BIPS countries full fill
about 3% of their domestic need through intraregional imports, which is almost remained
stagnant since 2003 to 2010. The BIPS countries for the sake of technology, machinery and
value added goods to cater their domestic needs rely mainly on external trade and in 2010
BIPS countries imports about 96.87% of their total imports from rest of the world, which
amounts about US$ 291.68 billion. While in terms of BIPS import growth rate within the
region increased from 19.02% in 2003 to 39.90% in 2010. The main reason behind these
trends is increasing reliance of India and Pakistan on rest of the world for its imports.
Table 2.13
Comparison between BIPS Global and Intraregional Imports Values & Shares (US $ Billions)
2003 2004 2005 2006 2007 2008 2009 2010
Global Imports by BIPS Economies 102.14 136.15 186.90 233.50 280.25 390.55 325.81 291.68
Total Intraregional Imports among BIPS Economies
3.30 3.93 4.65 6.26 7.86 9.82 6.52 9.13
% Share of BIPS Intraregional Imports w.r.t their Global Imports
3.23% 2.88% 2.49% 2.68% 2.80% 2.51% 2.00% 3.13%
% Growth 19.02% 18.29% 34.82% 25.47% 24.94% -33.57% 39.90%
Source: Author‟s calculations based on Trade Map data
The table 2.14 explains the performance of BIPS countries global imports at dissagregated
level, India ranked top in importing goods from the rest of the world (excluding South Asia)
both in terms of absolute values and percentage shares out of its total global import. India full
fill its domestic need by importing only 0.4% of its total imports from South-Asia, which is
lowest in the region from 2003 to 2010. Similarly, Pakistan imports only 4.5% of its total
imports from the region to full fill its domestic need in 2010.
.

12
Table 2.14
Comparison of % Share of BIPS Intraregional Exports w.r.t their Global Exports
2003 2004 2005 2006 2007 2008 2009 2010
Bangladesh 15.5% 12.6% 12.2% 13.0% 14.4% 19.5% 14.0% 17.2%
India 0.4% 0.5% 0.6% 0.6% 0.4% 0.4% 0.3% 0.4%
Pakistan 2.4% 3.0% 2.8% 4.2% 4.3% 4.4% 3.8% 4.5%
Sri Lanka 17.7% 18.7% 18.8% 20.1% 26.1% 22.3% 20.2% 23.0%
However, among South-Asian major economies Sri-Lanka is the major importer of regional,
who full fill its domestic demand by about 23.0% from the South-Asian region in 2010,
followed by bangladesh who full fill its needs to about 17.2% from the region.
3. PAKISTAN’S TRADE PERFORMANCE WITH SOUTH-ASIA’S MAJOR ECONOMIES
This section highlights the Pakistan trade performance in South Asia with major economies
of India, Sri-Lanka and Bangladesh from 2003-10. Examining the existing intra-regional
trade flows of Pakistan not only help us to know more about the its partner economies but it
also makes us aware of the challenges at present in the way for enhancing the trade flows
among each other by way of finding out suitable policies for further deepening the trade
integration. In this section, a brief analysis of the trade between Pakistan and major
economies of South-Asian countries is undertaken highlighting export potential of Pakistan.
3.1. Pakistan’s Exports Performance
The Table 3.1 shows that Pakistan‟s export to South-Asian major economies has been
consistently increasing both in absolute value terms as well as in percentage share. Pakistan is
one of the major trading partners within the region. The total export of Pakistan to
Bangladesh, India and Sri-Lanka amounted to US $ 333.31 million in 2003 which rose to
about US $ 1.19 billion in 2010. Pakistan exports to South-Asian major economies accounted
2.79% of its global export in 2003, which is now increased to about 5.58% in 2010. However
Pakistan‟s export growth rate within the region was at 47.27% in 2004 which decreased to
45.87% in 2010.
Table 3.1 Pakistan Exports to South-Asian Major Economies (US $ million)
2003 2004 2005 2006 2007 2008 2009 2010
Bangladesh 166.23 197.65 234.41 266.83 279.25 422.33 367.37 636.80
% Share 49.87% 40.27% 32.32% 34.60% 35.82% 42.50% 44.82% 53.26%
% Growth 18.90% 18.60% 13.83% 4.65% 51.24% -13.01% 73.34%
India 83.54 158.49 33.72 326.70 291.69 354.63 235.32 274.98
% Share 25.07% 32.29% 4.65% 42.37% 37.42% 35.69% 28.71% 23.00%
% Growth 89.71% -78.72% 868.82% -10.72% 21.58% -33.64% 16.85%
Sri Lanka 83.52 134.71 153.66 177.59 208.57 216.71 216.96 283.87

13
% Share 25.06% 27.44% 21.19% 23.03% 26.76% 21.81% 26.47% 23.74%
% Growth 61.28% 14.06% 15.57% 17.44% 3.91% 0.11% 30.84%
Pakistan’s total exports to South-Asian Major Economies
333.31 490.86 725.29 771.13 779.52 993.69 819.66 1195.66
% Share 2.79% 3.67% 4.52% 4.55% 4.37% 4.90% 4.67% 5.58%
% Growth 47.27% 47.76% 6.32% 1.09% 27.48% -17.51% 45.87%
Pakistan Global Exports
11930.07 13379.02 16050.20 16932.87 17838.41 20279.05 17554.70 21413.10
Source: Author‟s calculations based on Trade Map data
The table also elaborates that Pakistan‟s major export destinations within the region directed
towards Bangladesh, where exports of Pakistani goods increased from US $ 166.23 million in
2003, to a highest level of US $ 636 million in 2010. Pakistan‟s other major export
destination in the region is Sri-Lanka, who imports about US$ 283.87 million of goods and
followed by India who imported US$ 274.98 millions of goods in 2010.
When we look over Pakistan‟s export share in South-Asia major economies with respect to its
global export; Pakistan exports share to Indian and Sri Lanka markets had gone down from
25.07% and 25.06% in 2003 to about 23% and 24% in 2010 respectively. Whereas in case of
Bangladesh market, Pakistan export share has increased from 49.87% in 2003 to about
53.26% in 2010.
3.2. Pakistan’s Imports Performance
The below table elaborates that Pakistan‟s imports dependency from South-Asian major
economies has increased over time, it was about US$ 312.40 million in 2003 and it was
increased to about US$ 1.68 billion in 2010. Among the major economies of South-Asia,
Pakistan imports goods majorly from India over the past seven years. In 2003 Pakistan‟s
imports from India was US$ 226.24 million, which accounts about 72.42% of Pakistan‟s total
intraregional imports has increased about two fold in terms of value to US$ 1.55 billion in
2010 accounting a share of about 92.46% of Pakistan‟s total intraregional imports from
South-Asia.
Table: 3.2 Pakistan’s imports from South-Asian Major Economies (US $ million)
2003 2004 2005 2006 2007 2008 2009 2010
Bangladesh 42.91 45.08 68.09 55.89 62.34 85.95 76.12 73.90
% Share 13.74% 8.27% 9.67% 4.50% 4.49% 4.66% 6.28% 4.38%
% Growth 5.05% 51.04% -17.92% 11.54% 37.89% -11.44% -2.91%
India 226.24 454.41 576.70 1114.99 1266.23 1691.48 1080.40 1559.92
% Share 72.42% 83.36% 81.92% 89.78% 91.20% 91.75% 89.12% 92.46%
% Growth 100.85% 26.91% 93.34% 13.56% 33.58% -36.13% 44.38%

14
Sri Lanka 43.25 45.66 59.18 70.97 59.79 66.22 55.79 53.37
% Share 13.84% 8.38% 8.41% 5.72% 4.31% 3.59% 4.60% 3.16%
% Growth 5.57% 29.61% 19.93% -15.76% 10.75% -15.75% -4.34%
Pakistan’s total imports from South-Asian Major Economies
312.40 545.14 703.96 1241.85 1388.35 1843.64 1212.31 1687.19
% Share 2.39% 3.04% 2.81% 4.16% 4.26% 4.36% 3.84% 4.49%
% Growth 74.50% 29.13% 76.41% 11.80% 32.79% -34.24% 39.17%
Pakistan's Global Imports
13048.609 17948.58 25096.58 29825.75 32593.94 42326.57 31583.72 37537.03
Source: Author‟s calculations based on Trade Map data
Similarly, Pakistan‟s imports from Bangladesh are negligible but showed an increased in
terms of value from US $ 42.91 million in 2003 to about US $ 73.90 million in 2010. But in
terms of import share from the region, Pakistan‟s import share declined in case of Bangladesh
from 13.74% in 2003 to 4.38% in 2010. While in case of Sri Lanka, Pakistan imports in 2010
from its partner show an increase of US$ 10 million since 2003.
4. COMMODITY WISE SHARE IN INTRA-REGIONAL TRADE:
(Exports and Imports of Pakistan to Major South Asian Countries)
In this section, commodity wise export and import share of the three major economies of
South Asia with Pakistan has been calculated. This analysis is done at HS 6 digit level; it will
throw light on the new emerging products in the year 2010 as compared to period 2003.
Similarly, it will also help to understand the increased shares of the products as compared to
previous period.
4.1. Pakistan’s Trade with India:
India and Pakistan are the two largest economies in South Asia. Together, they account for
90% of the gross domestic product (GDP) and 85% of the population of the region. The low
level of Pakistan-India bilateral trade is the result of border disputes and political tensions,
but also of inward-looking import-substitution growth strategies.
This has rendered South Asia among the least integrated economic region in the world.
Between 1980 and 2005, intraregional trade as a share of total trade within South Asia only
rose from 3 to 4%, whereas in East Asia (a region of comparable size in population and GDP)
intraregional trade more than doubled from 6 to 11 %. It is striking that over the same period,
South Asia‟s worldwide exports grew from only $12 billion to $126 billion (a 10-fold
increase) while East Asia‟s jumped from $48 billion to over $1 trillion (a 20-fold increase).
Trade between India and Pakistan is tiny compared to the potential, which by estimates could
be as high as US$10 billion or 2% of the combined merchandize trade with the world.
Starting from mid 1980‟s to late 1980‟s, economies of Pakistan and India introduced
economic liberalization programs. This include, opening international Trade and Investment,
deregulation of initiation of privatization, tax reforms and inflation controlling measures. As
far as India is concerned, fruits of liberalization reached to the peak in 2007 as India recorded
15
highest GDP growth rate of 9% and as a result became the second fastest growing economy
of the World. According to the World Bank India still faces challenges in public sector
reforms, infrastructure, agricultural and rural development, reforms in lagging states, and in
dealing with the impact of HIV/AIDS. There is also considerable room for more wide-
ranging and deeper reforms in the trade and investment regimes as well.
While in case of Pakistan, due to economic liberalization, the average tariffs fell from 70% in
1980 to 30% in 2001 and 14.68% in 2010. Measures that have restricted trade were also
eliminated by the Government which includes regulatory duties and para tariffs. The real
GDP growth rate was 1.7% in 2008-09, which jumped to 3.8% in 2009-10 and again fell back
to 2.4% in 2010-11.
Despite the overall economic liberalization and globalization in both India and Pakistan, the
bilateral trade relations have been highly “managed”. When the two countries started the
Composite Dialogue Process in January 2004, there has been a sizable increase in bilateral
trade. Official trade between India and Pakistan reached US$1.1 billion in 2005-06.
According to our estimates for 2004-05, there was an additional $545 million in unofficial
trade. Thus, total bilateral trade stood at $1.5billion, or 3.4 percent of Pakistan‟s total trade, in
2005-06. Total Indo Pak trade shows a mixed trend 2007 onwards. In 2007 total trade was
valued at US$ 1.5 billion which rose to US$ 2.04 billion in 2008 but fell back sharply to US$
1.3 billion in 2009. And in 2010, this trade has increased to US$ 4.3 billion. Pakistan‟s
exports to India in the period show a similar trend with 2007 exports reaching US$ 291
million then rising to a peak of US$ 354 million in 2008 before falling to US$ 274 million in
2010. Pakistan‟s imports also follow this pattern with 2007 imports from India valued at US$
1.2 billion, rising to their highest level of US$ 1.6 billion in 2008 before falling back to US$
1.5 billion in 2010. Bilateral trade between Pakistan and India had been limited to a few
goods with almost no trade in services. The composition of Indian imports from Pakistan
before during 2000-2004 was limited to about six commodity groups, which on average
accounted for more than 80 percent of total exports. These included edible vegetables and
roots; sugar and confectionary; edible fruits; gum/resins and vegetable extracts (e.g.
molasses); and products of milling industry. Since 2004, after Pakistan and India have begun
wide ranging dialogue on political and economic issues, the composition of Pakistani exports
to India has become more diversified. In addition to the traditional exports to India mentioned
above, mineral fuels and oils; vegetable plaiting materials; organic and inorganic chemicals;
raw hides and skins; lead and articles made of lead; and salt/sulphur/cement have also been
exported to India. The composition of official exports from India to Pakistan is broader,
reflecting India‟s more diversified industrial base. Organic chemicals form the biggest share
of Pakistani imports from India. Another major import to Pakistan from India has been of
ores/slag (mainly iron ore). During the last five years (2004 to 2010) imports of
pharmaceutical products; mineral fuels/oils; man-made filaments; plastic products; rubber
products; leather; and copper and copper products have become important. Periodically,
agricultural products (e.g. raw cotton, wheat, silk, and sugar) have accounted for one-time
imports or exports to meet domestic shortages in either country. The percentage shares of the
exported commodities to India from Pakistan have been calculated in table 4.1 at HS 6-digit
level for the period 2003 and 2010.

16
Table: 4.1
Source: Author‟s calculations based on Trade Map data
In this part of analysis, Pakistan‟s exports to India are compared between the two periods i.e.
2003 and 2010. Major export items of Pakistan to India in 2003 comprised of Dates, Beans,
Leguminous vegetables, chick peas etc. But in 2010 we see that new products emerged as the
major export items of Pakistan to India and these are Cement with the share of 10%, some
organic and inorganic chemicals which include ethylene dichloride, terephthalic acid and
disodium carbonate. Another major product is twill weave fabric with the share of 2% in
overall exports t0 India from Pakistan. Our analysis also indicates that Dates are still the
major export category but as compared to 2003, the share has been reduced to 16% from
25%. Similarly, the shares of the imported commodities by Pakistan from India has been
calculated at HS 6-digit level in table 4.2 to see whether Pakistan is now importing more
value added products or importing the primary commodities.
Table: 4.2
Source: Author‟s calculations based on Trade Map data
Codes Description 2003 Codes Description 2010
'080410 Dates, fresh or dried 25% '080410 Dates, fresh or dried 16%
'071339Beans dried, shelled, whether or not skinned
or split, nes23% '252329 Portland cement nes 10%
'071390
Leguminous vegetables
dried,shelled,whether or not skinnd or
split,nes
15% '271019 Light petroleum distillates nes 10%
'271019 Light petroleum distillates nes 7% '2903151,2-dichloroethane(ethylene
dichloride)4%
'520819
Woven fabrics of cotton,>/=85%, not more
than 200 g/m2,unbleached, nes3% '291736 Terephthalic acid and its salts 4%
'071320Chickpeas, dried, shelled, whether or not
skinned or split3% '283620 Disodium carbonate 3%
'121190Plants &pts of plants(incl sed&fruit) usd in
pharm,perf,insect etc nes2% '780110 Lead refined unwrought 3%
'130190
Natural gums, resins, gum-resins and balsam,
except arabic gum2% '520932
Twill weave cotton fabrics,>/=85%,
more than 200 g/m2, dyed2%
'510121Degreased shorn wool, not carded, combed
or carbonised2% '390120
Polyethylene having a specific gravity
of 0.94 or more2%
'842641Derricks/cranes o works trucks fittd w a
crane,self-propelld on tires2% '390110
Polyethylene having a specific gravity
of less than 0.942%
Codes Description 2003 Codes Description 2010
'290243P-xylene
25%'520100 Cotton, not carded or combed 20%
'260111
Iron ores&concentrates,oth than roasted iron
pyrites,non-agglomerated 12%'170199 Refined sugar, in solid form, nes 10%
'230400
Soya-bean oil-cake&oth solid
residues,whether or not ground or pellet 8%'230400
Soya-bean oil-cake&oth solid
residues,whether or not ground or
pellet
8%
'401120
Pneumatic tires new of rubber for buses or
lorries 6%'290243 P-xylene 8%
'390210Polypropylene
4%'071320
Chickpeas, dried, shelled, whether or
not skinned or split4%
'090240
Black tea (fermented) & partly fermented tea
in packages exceedg 3 kg 3%'070200 Tomatoes, fresh or chilled 3%
'294190Antibiotics nes, in bulk
3%'090240
Black tea (fermented) & partly
fermented tea in packages exceedg 3
kg
2%
'293399
Heterocyclic compounds with nitrogen
hetero-atom[s] only (excl. those 2%'890800
Vessels and other floating structures
for breaking up2%
'320416
Reactive dyes and preparations based
thereon 2%'390210 Polypropylene 2%
'760611
Plate,sheet or strip,aluminium,not alloyd,rect
or sq,exceedg 0.2mm thk 1%'290241 O-xylene 1%

17
When we compared the major import items from India in 2010 as compared to 2003, we see
that among the major import products, the share of P-xylene, polypropylene and black tea
have reduced from 25%, 4% and 3% to 8%, 2% and 2%. Now cotton and sugar have also
emerged as the major importing products by Pakistan from India. The share of soya-bean oil
cake and solid residues remain the same in 2010. Now Pakistan has also start importing
chickpeas and tomatoes from India as indicated in the top ten importing products by Pakistan.
Earlier Pakistan was also importing antibiotics from India but the share has been reduced to
10% in 2010.
4.2. Pakistan’s Trade with Sri Lanka:
Pakistan and Sri Lanka have good economic and trade relations. Exports of Pakistan to Sri
Lanka increased from $83 million in 2003 to $ 208 million in 2007 to $283 million in 2010.
And the imports from Sri Lanka increased from $43 million in 2003 to $53 million in 2010.
Trade expansion between the countries took place in agro-based products which includes
sugar production, sea food processing, value added textiles and clothing, tea and plantation,
electronics, metal fabrication and light engineering, pharmaceutical products, preservation
and canning of fruits and vegetables. Currently Pakistan receives 0.6% of Sri Lankan exports
and Sri Lanka receives 0.7% of Pakistanis exports. Pakistan is an important market for tea,
copra, rubber, betel leaves and tamarind and Sri Lanka is an important market for textiles,
pharmaceuticals, machinery and agricultural items.
Following FTA which came into operation on June 30, 2005, bilateral trade between both the
countries has been strengthened through an increase in the number of products that they can
now import from each other. Under FTA, both Pakistan and Sri Lanka have granted duty free
access to each other on several tariff lines, agreeing to eliminate custom tariff on almost 90%
of products by June 2010.Resultantly, Pakistan has now become the second largest trade
partner for Sri Lanka in the South Asian region. Under FTA, both the countries have agreed
to a 35% domestic value addition and change of tariff heading at a six digit level, which
provides flexibility for Sri Lankan and Pakistani investors to source their inputs from third
countries and export manufactured products to each other. Pakistan has granted TRQs to Sri
Lanka, on an annual basis, on 10,000 metric tons of tea at zero rate of duty and 1,200 metric
tons of betel leaves at a preferential margin of 35 per cent against the pre-2005 import duty of
Rs.150 per kilo. Before 2005, Sri Lanka exported about 3,000 metric tons of tea to Pakistan
and the annual TRQ of 10,000 metric tons enabled Sri Lankan tea trade to make a fresh start.
Likewise, TRQ on betel leaves has resulted in enhancing the income of betel growers in the
rural areas of Sri Lanka. Pakistan also granted Sri Lanka TRQs for 3 million pieces of apparel
products, covering 20 categories where there was market potential without restrictions
regarding the fabric‟s country of origin. The apparel categories also qualify for 35%
preferential tariff margin. In addition, Sri Lankan ceramic tiles and tableware also enjoy 20%
of preferential tariff margin. Sri Lanka has granted to Pakistan TRQs for duty free exports of
Kino and 6,000 metric tons of long grade basmati rice, in addition to 1,000 metric tons of
potatoes per annum. The percentage shares of the exported and imported commodities by
Pakistan to Sri-Lanka have been estimated at HS 6-digit level for the years 2003 and 2010 in
tables 4.3 and 4.4.

18
Table: 4.3
Source: Author‟s calculations based on Trade Map data
In Pakistan-Sri Lanka analysis, share of commodities like rice and potatoes have increased in
the year 2010 as compared to 2003. New products have emerged in the year 2010 which
Pakistan is exporting to Sri Lanka in the top ten shares which basically includes Portland
cement (6%), twill weave cotton fabrics (5%), plain weave cotton fabrics (5%), Denim
fabrics (4%), Dyed cotton fabrics (4%), Onions (3%), hydraulic cement (2%) and
medicaments (2%). If we see the data, it is clear that Pakistan is now majorly exporting
Cotton as among top ten list five products are of cotton. Now the shares have been calculated
for the imported commodities from Sri Lanka by Pakistan for the years 2003 and 2010. The
top ten shares have been mentioned in the table:
Table: 4.4
Source: Author‟s calculations based on Trade Map data
Codes Description 2003 Codes Description 2010
'520819
Woven fabrics of cotton,>/=85%, not more
than 200 g/m2,unbleached, nes 18%'100630
Rice, semi-milled or wholly milled,
whether or not polished or glazed17%
'030559
Fish nes, dried, whether or not salted but not
smoked 8%'252329 Portland cement nes 6%
'521213
Woven fabrics of cotton, weighing not more
than 200 g/m2, dyed, nes 7%'070190 Potatoes, fresh or chilled nes 6%
'520512
Cotton yarn,>/=85%,single,uncombed,714.29
>dtex>/=232.56, not put up 5%'730690
Tubes, pipe & hollow profiles, iron or
steel, welded, nes5%
'100630
Rice, semi-milled or wholly milled, whether
or not polished or glazed 4%'520932
Twill weave cotton fabrics,>/=85%,
more than 200 g/m2, dyed5%
'070190 Potatoes, fresh or chilled nes 4%'520911
Plain weave cotton fabric,>/=85%,
more than 200 g/m2, unbleached5%
'300490 Medicaments nes, in dosage 4%'520942
Denim fabrics of cotton,>/=85%,
more than 200 g/m24%
'730610
Pipe,line,i or s,weldd,rivetd or sim
closd,nes,for oil or gas pipeline 3%'600622
Dyed cotton fabrics, knitted or
crocheted, of a width of > 30 cm
(excl
4%
'521223
Woven fabrics of cotton, weighing more than
200 g/m2, dyed, nes 3%'070310 Onions and shallots, fresh or chilled 3%
'630231 Bed linen, of cotton, nes 2%'520939
Woven fabrics of cotton,>/=85%,
more than 200 g/m2, dyed, nes3%
'390410
Polyvinyl chloride, not mixed with any other
substances 2%'520839
Woven fabrics of cotton,>/=85%, not
more than 200 g/m2, dyed, nes3%
'520522
Cotton yarn,>/=85%,single,combed, 714.29
>dtex>/=232.56, not put up 2%'252390 Hydraulic cements nes 2%
'080520
Mandarins(tang&sats)clementines&wilkgs
&sim citrus hybrids,fresh/drid 2%'300490 Medicaments nes, in dosage 2%
Codes Description 2003 Codes Description 2010
'120300Copra
28% '400121Natural rubber in smoked sheets 25%
'090240
Black tea (fermented) & partly fermented tea
in packages exceedg 3 kg 14% '140490Vegetable products nes 11%
'400121Natural rubber in smoked sheets
14% '400110
Natural rubber latex, whether or not
prevulcanised9%
'140490Vegetable products nes
11% '080119Coconuts, excluding dessicated 6%
'400129Natural rubber in other forms nes
7% '090240
Black tea (fermented) & partly
fermented tea in packages exceedg 3
kg
6%
'080119Coconuts, excluding dessicated
4% '080111Coconuts, dessicated 5%
'140300
Vegetable materials, such as broom-corn,
piassava, couch-grass and ist 2% '090411
Pepper of the genus Piper,ex cubeb
pepper,neither crushd nor ground4%
'080111Coconuts, dessicated
2% '400129Natural rubber in other forms nes 3%
'441121
Fibreboard >0.5 g/cm2 <0.8 g/cm2 not
worked or surface covered 1% '120300Copra 3%
'760410
Bars, rods and profiles, aluminium, not
alloyed 1% '400122
Technically specified natural rubber
(TSNR)2%
'550410
Staple fibres of viscose, not carded or
combed 1% '441112
Medium density fibreboard MDF of
wood, of a thickness <= 5 mm2%
'090810Nutmeg
1% '540110Sewing thread of synthetic filaments 2%

19
In 2003, Copra was the major import item from Sri Lanka with the share of 28% but now in
2010, Natural rubber in smoked sheets has taken the top position. Copra is among the top ten
commodities imported from Sri Lanka but its share has largely reduced to 3% from
28%.Share of natural rubber in other forms and Black tea has also decreased in the current
scenario. On the other hand in case of Coconuts desiccated; share has increased from 2%
(2003) to 5% (2010). Among the top ten commodities, rubber is playing the major role in
2010 as five products are of rubber which is being imported from Sri Lanka.
4.3. Pakistan’s Trade with Bangladesh:
During the 8th meeting of Joint Economic Committee (JEC) held in Dhaka on 12-13
September 2005, Pakistan and Bangladesh both decided to increase the bilateral trade to US
$1 billion by 2007. It has increased from about US $147 million in 2002 to US $279 million
in 2007 and by the end of 2010; the trade between the two countries was $636 million. Major
imports from Bangladesh to Pakistan include tea, jute, medical and pharmaceutical products.
There is a duty free import of Bangladeshi tea by Pakistan. There are also prospects for the
development and establishment of direct shipping service between the two countries in order
to promote commercial and trade links. Efforts to expand technical cooperation in various
fields were identified by Joint Working Group. In 2006, four MoUs on cooperation in areas
of agriculture, tourism, promotion of trade, and product standardization and quality assurance
were signed during the visit of Begum Khaleda Zia, Prime Minister of Bangladesh to
Pakistan. There are MoUs signed between Pakistan Agriculture Research Council, Ministry
of Food, Agriculture & Livestock and Bangladesh Agricultural Research Council. Both
countries have also signed MoUs on tourism.
The percentage shares of the exported and imported commodities by Pakistan to Bangladesh
have been estimated at HS 6-digit level in tables 4.5 and 4.6.
Table: 4.5
Source: Author‟s calculations based on Trade Map data
Codes Description 2003 Codes Description 2010
'520100 Cotton, not carded or combed 15% '520100 Cotton, not carded or combed 13%
'520512
Cotton yarn,>/=85%,single,uncombed,714.29
>dtex>/=232.56, not put up 11% '520942
Denim fabrics of cotton,>/=85%, more than
200 g/m2 12%
'520819
Woven fabrics of cotton,>/=85%, not more
than 200 g/m2,unbleached, nes 10% '100630
Rice, semi-milled or wholly milled, whether
or not polished or glazed 10%
'520532
Cotton yarn,>/=85%,multi,uncombed,714.29
>dtex>/=232.56,nt put up,nes 8% '520532
Cotton
yarn,>/=85%,multi,uncombed,714.29
>dtex>/=232.56,nt put up,nes 7%
'521213
Woven fabrics of cotton, weighing not more
than 200 g/m2, dyed, nes 7% '520932
Twill weave cotton fabrics,>/=85%, more
than 200 g/m2, dyed 7%
'520859
Woven fabrics of cotton,>/=85%, not more
than 200 g/m2,printed, nes 3% '100640 Rice, broken 5%
'071320
Chickpeas, dried, shelled, whether or not
skinned or split 3% '520512
Cotton
yarn,>/=85%,single,uncombed,714.29
>dtex>/=232.56, not put up 5%
'540774
Woven fabrics,>/=85% of synthetic filaments,
printed, nes 2% '520939
Woven fabrics of cotton,>/=85%, more
than 200 g/m2, dyed, nes 3%
'520522
Cotton yarn,>/=85%,single,combed, 714.29
>dtex>/=232.56, not put up 2% '520544
Cotton
yarn,>/=85%,multiple,combed,192.31
>dtex>/=125,not put up,nes 2%
'521051
Plain weave cotton fab,<85% mixd w m-m
fib,nt more thn 200 g/m2,printd 2% '521223
Woven fabrics of cotton, weighing more
than 200 g/m2, dyed, nes 2%
20
In Pakistan-Bangladesh analysis, it is seen that Cotton is the major export item in 2003 as
well as 2010. 51% of the share among the top ten products is of cotton. The share of cotton,
not carded or combed was 15% on 2003 which is reduced to 13% in 2010. Another product
which has shown the major decline in the share of exports of Pakistan towards Bangladesh is
Cotton yarn, uncombed. Share has reduced from 11% to 5% in 2010. Rice has also emerged
as the major export item to Bangladesh. Share of Rice, semi milled and wholly milled is
10% and that of broken rice is 5%.
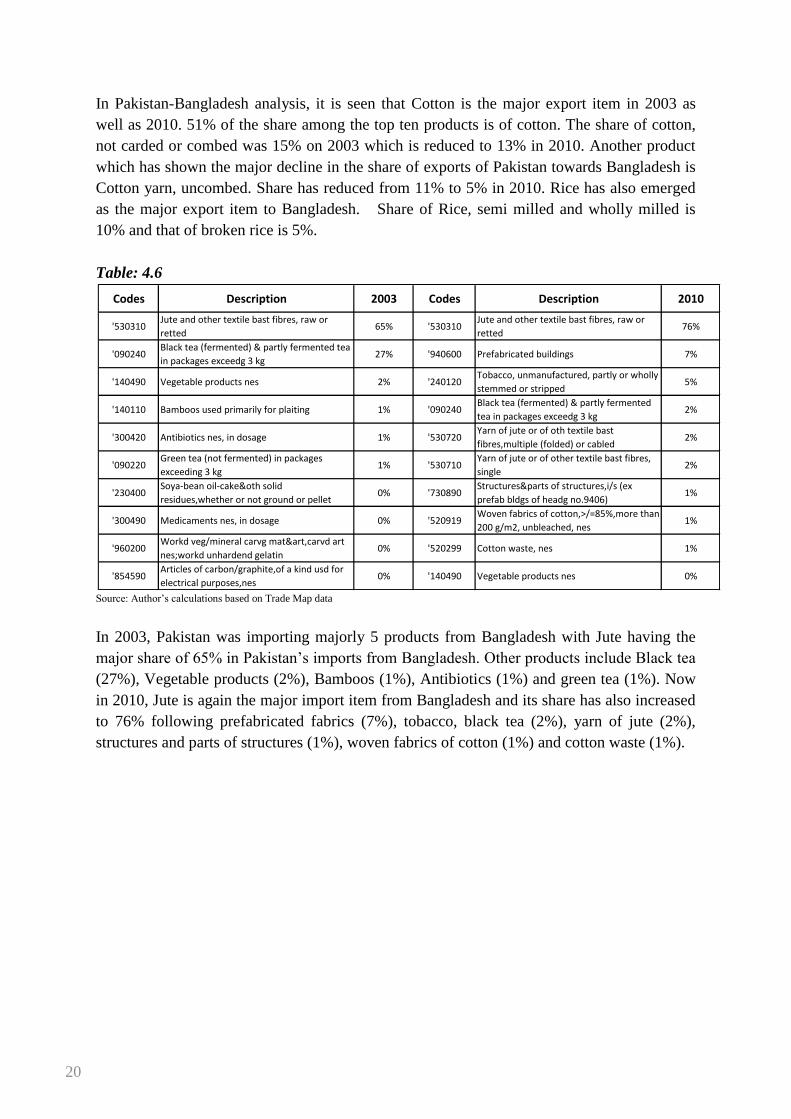
Table: 4.6
Source: Author‟s calculations based on Trade Map data
In 2003, Pakistan was importing majorly 5 products from Bangladesh with Jute having the
major share of 65% in Pakistan‟s imports from Bangladesh. Other products include Black tea
(27%), Vegetable products (2%), Bamboos (1%), Antibiotics (1%) and green tea (1%). Now
in 2010, Jute is again the major import item from Bangladesh and its share has also increased
to 76% following prefabricated fabrics (7%), tobacco, black tea (2%), yarn of jute (2%),
structures and parts of structures (1%), woven fabrics of cotton (1%) and cotton waste (1%).
Codes Description 2003 Codes Description 2010
'530310Jute and other textile bast fibres, raw or
retted65% '530310
Jute and other textile bast fibres, raw or
retted76%
'090240Black tea (fermented) & partly fermented tea
in packages exceedg 3 kg27% '940600 Prefabricated buildings 7%
'140490 Vegetable products nes 2% '240120Tobacco, unmanufactured, partly or wholly
stemmed or stripped5%
'140110 Bamboos used primarily for plaiting 1% '090240Black tea (fermented) & partly fermented
tea in packages exceedg 3 kg2%
'300420 Antibiotics nes, in dosage 1% '530720Yarn of jute or of oth textile bast
fibres,multiple (folded) or cabled2%
'090220Green tea (not fermented) in packages
exceeding 3 kg1% '530710
Yarn of jute or of other textile bast fibres,
single2%
'230400Soya-bean oil-cake&oth solid
residues,whether or not ground or pellet0% '730890
Structures&parts of structures,i/s (ex
prefab bldgs of headg no.9406)1%
'300490 Medicaments nes, in dosage 0% '520919Woven fabrics of cotton,>/=85%,more than
200 g/m2, unbleached, nes1%
'960200Workd veg/mineral carvg mat&art,carvd art
nes;workd unhardend gelatin0% '520299 Cotton waste, nes 1%
'854590Articles of carbon/graphite,of a kind usd for
electrical purposes,nes0% '140490 Vegetable products nes 0%

21
5. TRADE INDICATORS ANALYSIS:
(Competitiveness and Complementarities)
In this section the Pakistan‟s trade performance with major SAARC countries is analyzed.
The analysis is based on certain trade indices used in the literature i.e. TCI, RCA, BRCA,
RMA and GL-Index. The indices analysis is done at two digit chapter level for the years
2003-10.
5.1. Trade Complementarily Index:
In this section we calculated the overall Trade complementarity index for Pakistan with
Bangladesh, India and Sri Lanka for the period 2003 to 2010. The indices are calculated on
the basis of export and import profiles of selected major economies of South-Asia. The index
tells us how well a country‟s export supply fits into the import demand of its trading partners.
The higher TCI overtime indicates that the region is able to fulfill intraregional demand or
supply of goods and indicates more favorable prospect for a successful trade cooperation
arrangement between the countries. Trade complementarity index measures how well does
the export profile of one country, or group of countries, match with the import profiles of
others. Also, changes in the value of trade complementarity index over time can help
determine whether the trade profiles of the countries (under consideration) are growing more
or less compatible (Yeats and Ng 2003).Yeats and Ng (op.cit) had argued that similarities
between the types of goods exported and the goods imported by East Asian countries was a
strong factor underlying the expansion of their intra-regional trade. Some of the main
proponents of this index, such as, Michaely (1994), had used the index to evaluate prospects
for Latin American trade arrangements, whereas Yeats (1998) had applied the index to
analyze the compatibility of intra- regional trade in Sub-Saharan African countries. Das
(2007) finds that evidence of trade complementarily in South Asia is mixed, so preferential
trading initiative was based on a weak proposition.
The Trade complementarity in simple words defined as sum of the absolute value of the
difference between the import category shares and the export shares of the countries under
study divided by two and multiplied by 100 converts the index into percentage form. In the
present analysis of selected countries, Trade Complementarity between two countries or
regions i and j (Cij) can be defined as,
Cikj, = [1 - Σ (|Mik – Xij| / 2)] x 100 (eq 1)
Cijk, = [1 - Σ (|Mij – Xik| / 2)] x 100 (eq 2)
Where k = a country or any region; j = SAARC country or region; i represents product
category; Xij is the share of product i in the exports of country j; and Mik is the share of
product i in the imports of country k. The Trade Complementarity Index is a measure of
potential trade between two partners by comparing the export profile of country j to the
import profile of country k. The index is zero when no goods are exported by one country or
imported by the other/partner country and 100 when the exports and imports share exactly
match. In the index logic, trade complementarity between two partners is considered to be

22
high, when the products imported by country k are the same than the ones exported by
country j. However, the TCI has an inherent size bias, i.e. a sub-region whose export portfolio
is limited (or smaller than other sub-regions) will end up with having a low TCI value.
5.1.1. TCI of Pakistan’s Export to South-Asian Major Economies
The trade complementarity indices for Pakistan with selected South Asian countries are
computed in two ways i.e. Pakistan with Bangladesh, India and Sri Lanka vis-à-vis of
selected partners exports complementarity with Pakistan. This computation is based on Trade
Map data at HS-6 digit level (99 chapters) for two time periods i.e. 2003 to 2010 in order to
explore out that at what degree export of Pakistan should match with the imports of its
partner country as a whole and the expansion of intraregional trade within South Asia region
overtime. Also this analysis will give us an overview whether exports and import profiles
within the region are growing more compatible over time or less compatible, or to appraise
the change in the potential for intraregional trade in this region over the 2003 to 2010 period.
Table 5.1 shows that the trade complementarity indices (at HS-6 level) of Pakistan‟s supply
(exports) very much complements to the import demands of Bangladesh and Sri-Lanka but to
a lesser extent to India demands (Imports) of goods over the period from 2003 to 2010. In
2003, the calculated complementarity indices of Pakistan Supply (exports) to the demand
(import) of Bangladesh was 12.41 percent, Sri-Lanka was 10.73 and India was 5.28 percent,
which has now increased to about 20.52 percent, 17.37 percent and 6.09 percent in 2010
respectively. The result shows that Pakistan‟s exports match well to the import of all these
countries except for India, where the index is almost remained stagnant. From this we can
infer that trade liberalization between the countries with higher index value show that the
partners is likely to create gain as their imports demand match exactly with the export supply
of its partner country.
Table 5.1 Year TCI of Pakistan's Exports to
Bangladesh TCI of Pakistan's Exports
to India
TCI of Pakistan's Exports to Sri-Lanka
TCI of Pakistan's Exports Major Economies of
South Asia
2003 12.41043 5.28051 10.73198 9.474306
2004 11.34675 6.462866 12.07867 9.962762
2005 10.902 7.19192 13.62137 10.57177
2006 8.719562 7.578243 15.00349 10.43377
2007 11.46905 9.609341 16.76853 12.61564
2008 21.1379 7.178462 17.10898 15.14178
2009 17.19384 6.218501 16.43739 13.28325
2010 20.52462 6.093693 17.37678 14.66503
Average 14.21302 6.951692 14.8909 12.01854
Source: Author‟s calculations based on Trade Map data
Figure 5.1 shows that there has been an inclining trend in Pakistan‟s complementarity indices
as an exporter and other selected countries as an importer‟s during the last seven years (2003-
2010). It is interesting to note that TCI of Pakistan‟s export to Sri-Lanka had a higher value

23
since 2004 to 2007 as compared to Bangladesh and India. Furthermore, in terms of average
TCI value of Pakistan as an exporter to these countries in the region has improved and is
highest for Bangladesh at 14.21 percent, followed by Sri Lanka at 14.89 percent and India at
6.95 percent. Similarly, Pakistan‟s average trade complementarity indices in terms of its
exports with Major Economies of South Asia as a whole has also improved from 9.47
percent in 2003 to 12.01 percent in 2010.
From this analysis, it can be observed that Pakistan‟s exports show the maximum
complementarity with the imports of other regional trading partners. Thus Pakistan‟s exports
have an ability to fulfill to a certain extent; the regions imports demand of goods, in particular
for those of Bangladesh and Sri Lanka.
Figure 5.1
Source: Trade Map “Author‟s own calculations”
5.1.1. TCI of South-Asian Major Economies Export to Pakistan:
Table 5.2 shows the picture other-way round, that Pakistan‟s import demands of goods from
the region are highly complements with the export supply of goods from India, but lesser
extent from Bangladesh and Sri-Lanka. The calculated index of complementarity of
Pakistan‟s demand (imports) of goods very much match to the supply (export) from India
show a higher value of about 22.45 percent, Sri-Lanka it was 7.36 percent and from
Bangladesh the index has a value of about 2.07 percent in 2003, but in 2010 the value rose to
33.38 percent (India), 6.08 percent (Sri-Lanka) and 2.65 percent in case of Bangladesh.
The result shows that within the region Pakistan‟s import demand match well to the export
supply of India, where the index value remained almost above 20 percent since last seven

24
years. But in case of Bangladesh and Sri-Lanka the complementarity compatibility in terms
of supply (exports) to Pakistan is low. From this we can conclude that partners with higher
value is likely to create gain as their export supply match exactly with the import demand of
its partner country.
Table 5.2
Year TCI of Bangladesh's Exports to Pakistan
TCI of India's Exports to Pakistan
TCI of Sri-Lanka's Exports
to Pakistan
TCI of Major Exports Economies
of South Asia to Pakistan
2003 2.027231 22.45979 7.361937 10.61632
2004 3.191409 25.94183 6.792571 11.97527
2005 3.477381 27.6514 6.195638 12.44147
2006 2.932618 31.34578 5.945783 13.40806
2007 5.222404 31.5563 7.745032 14.84124
2008 2.795656 30.73697 4.97165 12.83476
2009 3.136569 29.80769 5.586582 12.84361
2010 2.654127 33.38644 6.087998 14.04286
Average 3.179675 29.11077 6.335899 12.87545 Source: Author‟s calculations based on Trade Map data
The overall observed pattern of result might seem consistent due to the fact that impact of
Pakistan‟s complementarity in imports from India is much higher than countries like
Bangladesh and Sri Lanka‟s, where their exports show low complementarity with Pakistan‟s
imports during 2003-2010.
Figure 5.2
Source: Trade Map “Author‟s own calculations” Further, the increasing trade complementarity index (TCI) between the major economies of
the region shows that there has been drastic change increase in complementarily indices of all

25
four major trading partners India, Pakistan, Bangladesh and Sri Lanka. The observed pattern
of the analysis implies that Pakistan‟ trade complementarities with its selected trade partners
in the South-Asian region has increased overtime although with comparatively low level1.
The low values of trade complementarity in the region are due to the fact that industrial
structure of south-Asian countries more or less similar and most of the trade is based on raw
materials especially in agriculture products, minerals and semi manufactured goods.
Pakistan‟s exports complementarity indices with Bangladesh and Sri Lanka increased with
comparative advantage advocate that Pakistan„s trade with these countries certainly has a
potential to grow over time, but the converse is not true. But in the backdrop of Pakistan‟s
low level of trade complementarity with its major trading partner in South Asia i.e. India with
which Pakistan‟s exports complement is not reasonably well to its partner imports, although
the degree has been rising overtime. However, in case of India‟s exports it complements
rationally well with Pakistan‟s imports and the trade potential is in favour of India with
significant comparative advantage overtime.
The trade complementarity analysis also conclude that the South Asian countries are at
different stages of production within an industry, and the exports of one country complements
reasonably well with the imports of other country, which results in strengthening the potential
of intra-regional trade in South-Asia in future. In order to assess, which industry or sector is
gaining potential in the South Asian trade, this issue is examined in the subsequent section of
the paper using Grubel Lloyd Index or Intra-industry trade indices for the selected countries.
5.2. Revealed Comparative Advantage:
The Revealed Comparative Advantage (RCA) measure is:
It gives us an indication of how much a country (Pakistan) is exporting a given good relative
to how much the world is exporting that same good. A country is said to have a revealed
comparative advantage when its share of export of a given good exceeds the equivalent share
of export of the world. This is captured when the numerator is bigger than the denominator,
or equivalently when the RCA is above 1, meaning that a given country exports,
proportionally to its total exports, more than the share of exports of the world in that given
product. An RCA below 1 indicates that a country does not have a revealed comparative
advantage in a given good or equivalently that the world share of that given product is higher
than that of the country under analysis. One always has to view this measure with certain
degree of caution as it will invariably be affected by trade policy. RCAs tend to be calculated
1 Comparative analysis of bilateral Export Trade Complementarity Indices of Pakistan with Bangladesh, India,
Sri-Lanka and SAARC region are mentioned in the Annex I.
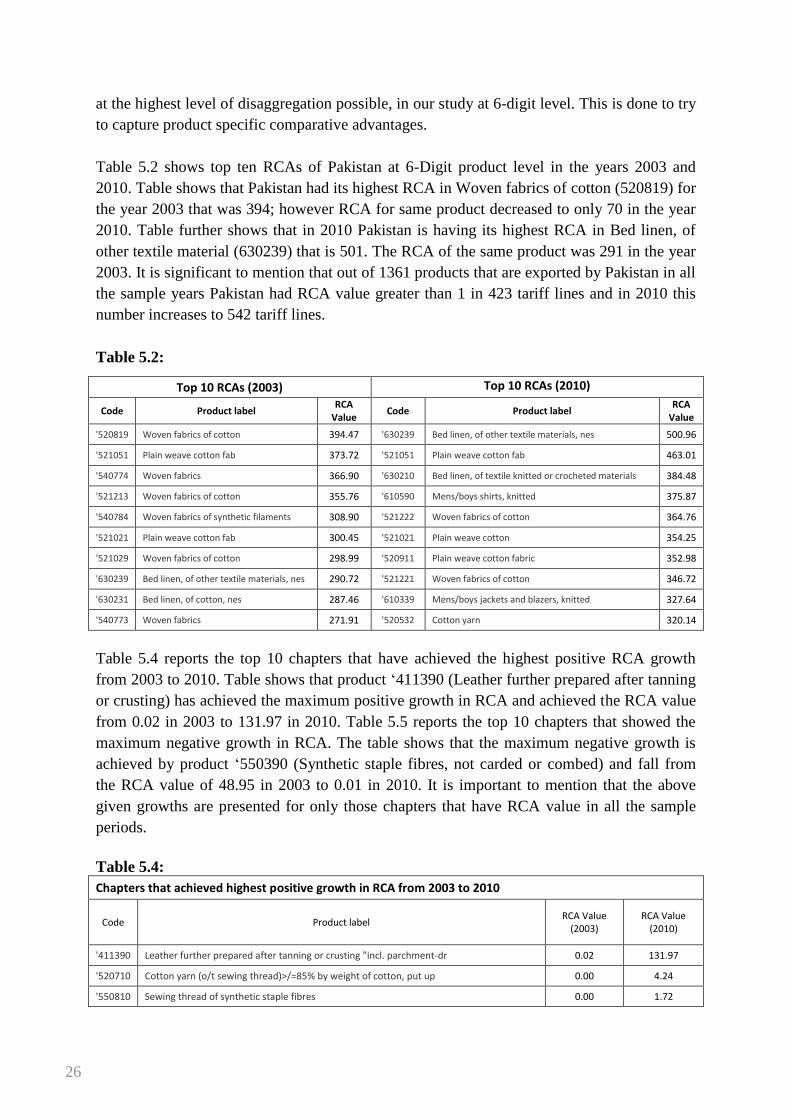
26
at the highest level of disaggregation possible, in our study at 6-digit level. This is done to try
to capture product specific comparative advantages.
Table 5.2 shows top ten RCAs of Pakistan at 6-Digit product level in the years 2003 and
2010. Table shows that Pakistan had its highest RCA in Woven fabrics of cotton (520819) for
the year 2003 that was 394; however RCA for same product decreased to only 70 in the year
2010. Table further shows that in 2010 Pakistan is having its highest RCA in Bed linen, of
other textile material (630239) that is 501. The RCA of the same product was 291 in the year
2003. It is significant to mention that out of 1361 products that are exported by Pakistan in all
the sample years Pakistan had RCA value greater than 1 in 423 tariff lines and in 2010 this
number increases to 542 tariff lines.
Table 5.2:
Top 10 RCAs (2003) Top 10 RCAs (2010)
Code Product label RCA
Value Code Product label
RCA Value
'520819 Woven fabrics of cotton 394.47 '630239 Bed linen, of other textile materials, nes 500.96
'521051 Plain weave cotton fab 373.72 '521051 Plain weave cotton fab 463.01
'540774 Woven fabrics 366.90 '630210 Bed linen, of textile knitted or crocheted materials 384.48
'521213 Woven fabrics of cotton 355.76 '610590 Mens/boys shirts, knitted 375.87
'540784 Woven fabrics of synthetic filaments 308.90 '521222 Woven fabrics of cotton 364.76
'521021 Plain weave cotton fab 300.45 '521021 Plain weave cotton 354.25
'521029 Woven fabrics of cotton 298.99 '520911 Plain weave cotton fabric 352.98
'630239 Bed linen, of other textile materials, nes 290.72 '521221 Woven fabrics of cotton 346.72
'630231 Bed linen, of cotton, nes 287.46 '610339 Mens/boys jackets and blazers, knitted 327.64
'540773 Woven fabrics 271.91 '520532 Cotton yarn 320.14
Table 5.4 reports the top 10 chapters that have achieved the highest positive RCA growth
from 2003 to 2010. Table shows that product „411390 (Leather further prepared after tanning
or crusting) has achieved the maximum positive growth in RCA and achieved the RCA value
from 0.02 in 2003 to 131.97 in 2010. Table 5.5 reports the top 10 chapters that showed the
maximum negative growth in RCA. The table shows that the maximum negative growth is
achieved by product „550390 (Synthetic staple fibres, not carded or combed) and fall from
the RCA value of 48.95 in 2003 to 0.01 in 2010. It is important to mention that the above
given growths are presented for only those chapters that have RCA value in all the sample
periods.
Table 5.4:
Chapters that achieved highest positive growth in RCA from 2003 to 2010
Code Product label RCA Value
(2003) RCA Value
(2010)
'411390 Leather further prepared after tanning or crusting "incl. parchment-dr 0.02 131.97
'520710 Cotton yarn (o/t sewing thread)>/=85% by weight of cotton, put up 0.00 4.24
'550810 Sewing thread of synthetic staple fibres 0.00 1.72

27
'610439 Women /girls jackets, of other textile materials, knitted 0.04 32.13
'620219 Women /girls overcoats & similar articles of other textile mat,not knit 0.01 8.71
'282720 Calcium chloride 0.01 4.60
'740821 Wire, copper-zinc base alloy 0.00 1.20
'391510 Polyethylene waste and scrap 0.00 1.62
'071090 Mixtures of vegetables, frozen 0.05 23.07
'920930 Strings, musical instrument 0.02 7.81
Source: Author‟s calculations based on Trade Map data
Table 5.5:
Chapters that achieved highest negative growth in RCA from 2003 to 2010
Code Product label RCA Value
(2003) RCA Value
(2010)
'550390 Synthetic staple fibres, not carded or combed, nes 48.95 0.01
'540794 Woven fabrics of synthetic filaments, printed, nes 27.85 0.01
'490210 Newspapers, journals & periodicals, appearing at least four times a week 2.85 0.00
'730719 Fittings, pipe or tube, cast, of iron or steel, nes 3.58 0.00
'581092 Embroidery of man-made fibres,in the piece,in strips or in motifs,nes 0.42 0.00
'071390 Leguminous vegetables dried, shelled, whether or not skinnd or split,nes 53.79 0.07
'392119 Film and sheet etc, cellular of plastics nes 0.14 0.00
'540773 Woven fabrics,>/=85% of synthetic filaments, yarn dyed, nes 271.91 0.73
'640691 Parts of footwear of wood 7.12 0.03
'410411 Full grains, unsplit and grain splits, in the wet state "incl. wet-blu 0.45 0.00
Source: Author‟s calculations based on Trade Map data
5.3. Regional Revealed Comparative Analysis:
The measure that we use to analyze the trade flows is the Regional RCA of Pakistan with
South Asian region. This measure is calculated using the following equation:
The bilateral RCA can be seen as a modified RCA, where rather than having the world as the
reference point, we compare the export shares of a given country (Pakistan) in a particular
destination market (South Asia), to the export shares of the world in that same destination
market, across all product lines. Hence the bilateral RCA gives us an indication of how much
a given country is exporting to a given market relative to how much the world is exporting to
that market. A bilateral RCA above one will tell us for that particular good that Pakistan has a
revealed comparative advantage in the South Asian market.
The top 10 chapters with highest Regional Revealed Comparative Advantage (RRCA) of
Pakistan with respect to South Asia for the year 2003 to 2010 are reported. The top 10
RRCAs are calculated on average basis for the sample periods. The table shows that Pakistan

28
has strong regional reveled comparative advantage in cotton (‟52), fish (‟03) and other made
textiles (‟63) in the pre period (average values 2003-06) with RRCA values of 29, 21 and 16
respectively. Whereas in the post period (average values 2007-09) Pakistan has high RRCAs
in Cotton („52), arms & ammunition („93) and other made textiles (‟63) with values of 48, 42
and 18 respectively. Chapter ‟93 (Arms and ammunition) is ranked at 2nd position for the
post period because it has highest RRCA in the year 2008 that is 116. The given high value of
RRCA for chapter „93 is achieved by Pakistan‟s due to rising exports that account to 5
million to Sri-Lanka in 2008. Out of 97 reported chapters, Pakistan has RRCA greater than 1
in 30 chapters (List of chapters is given in Annex - III) during the pre period, whereas in the
post period Pakistan has RRCA greater than 1 in 37 chapters (List of chapters is given in
Annex - IV). The highest RRCA in both the pre and post period is achieved by chapter ‟52
(Cotton) with RRCA values of 29 in the pre period and 48 in the post period.
Table 5.6:
Top 10 average RRCAs in Pre-period (2003-06) Top 10 average RRCAs in Post-period (2007-10)
Code Product label RRCA Code Product label RRCA
'52 Cotton 29.29 '52 Cotton 48.26
'03 Fish, crustaceans, molluscs, aquatic invertebrates nes 21.19 '93 Arms and ammunition, parts and accessories thereof 41.93
'63 Other made textile articles, sets, worn clothing etc 15.98 '63 Other made textile articles, sets, worn clothing etc 18.40
'07 Edible vegetables and certain roots and tubers 10.61 '03 Fish, crustaceans, molluscs, aquatic invertebrates nes 17.45
'08 Edible fruit, nuts, peel of citrus fruit, melons 10.47 '41 Raw hides and skins (other than furskins) and leather 12.13
'61 Articles of apparel, accessories, knit or crochet 8.45 '08 Edible fruit, nuts, peel of citrus fruit, melons 11.70
'13 Lac, gums, resins, vegetable saps and extracts nes 5.12 '20 Vegetable, fruit, nut, etc food preparations 8.64
'41 Raw hides and skins (other than furskins) and leather 4.90 '61 Articles of apparel, accessories, knit or crochet 8.15
'10 Cereals 4.61 '10 Cereals 7.96
'17 Sugars and sugar confectionery 4.15 '11 Milling products, malt, starches, inulin, wheat gluten 7.16
Source: Author‟s calculations based on Trade Map data
Table 5.7 reports the top 10 chapters that have achieved the highest positive RRCA growth
from pre to post period. The RRCA values are calculated on average basis from 2003 to
2010. The table reports that the maximum positive growth in RRCA is achieved by chapter
‟43 (Furskins and artificial fur, manufactures thereof) from 0.04 in pre period to 5.63 in post
period. Table 5.8 shows the top 10 chapters that have achieved the maximum negative growth
in RRCA from pre to post period. The maximum RRCA negative growth is achieved by
Chapter ‟53 (Vegetable textile fibers, paper yarn, woven fabric) from 0.15 in pre period to
zero in the post period. The above given growths are presented for only those chapters that
have RRCA value in all the sample period.
Table 5.7:
Chapters that achieved highest positive growth in RRCA from pre to post time period.
Code Product label RRCA Value
Pre (2003-06) RRCA Value
Post (2007-10)
'43 Furskins and artificial fur, manufactures thereof 0.04 5.63

29
'93 Arms and ammunition, parts and accessories thereof 0.39 41.93
'88 Aircraft, spacecraft, and parts thereof 0.01 0.19
'92 Musical instruments, parts and accessories 0.02 0.57
'75 Nickel and articles thereof 0.00 0.08
'25 Salt, sulphur, earth, stone, plaster, lime and cement 0.39 6.05
'05 Products of animal origin, nes 0.14 1.56
'22 Beverages, spirits and vinegar 0.72 6.79
'15 Animal, vegetable fats and oils, cleavage products, etc 0.00 0.00
'06 Live trees, plants, bulbs, roots, cut flowers etc 0.08 0.65 Source: Author‟s calculations based on Trade Map data
Table 5.8: Chapters that achieved highest negative growth in RRCA from pre to post time period.
Code Product label RRCA Value
Pre (2003-06) RRCA Value
Post (2007-10)
'53 Vegetable textile fibers nes, paper yarn, woven fabric 0.15 0.00
'66 Umbrellas, walking-sticks, seat-sticks, whips, etc 0.04 0.00
'01 Live animals 0.03 0.00
'31 Fertilizers 0.01 0.00
'02 Meat and edible meat offal 0.00 0.00
'97 Works of art, collectors pieces and antiques 0.71 0.01
'91 Clocks and watches and parts thereof 0.14 0.00
'99 Commodities not elsewhere specified 0.04 0.00
'81 Other base metals, cermets, articles thereof 0.03 0.00
'18 Cocoa and cocoa preparations 1.04 0.10
Source: Author‟s calculations based on Trade Map data
5.4. Revealed Market Access:
This measure allows exploring market access issues by extension of RCA analysis and helps
to asses by product that whether there is any evidence that the Pakistani access to the SAARC
market is higher or lower than that suggested by its revealed comparative advantage. RMA
measure (RMA1) is derived from the combination of the RCA and the bilateral RCA and is
calculated as follows.
Where i represent a tariff code (industry or product) and k represents the destination market.
The intuition behind this is that the bilateral trade should follow global comparative
advantage thus a country should gain entry into a given market following its comparative
advantage and following the demand that there will be for the given good in that market. To
calculate the RMA1, simply divide the bilateral RCA of a given country by the global RCA
of that country. An RMA value below 1 shows that a given good is not entering the target
market at the rate that would be expected according to its global revealed comparative

30
advantage. An RMA above 1 tells us that the market access for the given good is above that
which would be suggested by the indicator of global revealed comparative advantage. Where
the indicator is less than one, this could be an indication of market access barriers in the
South Asia for Pakistani products, in comparison to other exporters to the South Asia.
However, it could also be driven by other factors such as differences of tastes and
preferences. Similarly, where the indicator is greater than one, then this suggests that relative
to other exporters to the South Asia, and relative to its revealed comparative advantage
Pakistan has better access. This could be an indication, for example, of deeper integration and
niche specialization between Pakistan and the South Asia in that particular product, but
equally it could be driven by other factors such as differences in tastes.
The top 10 Revealed Market Access (RMAs) values of Pakistan at 2-Digit chapter level for
the sample period are given in the tables 5.9. The top 10 RMAs are calculated on average
basis in each sample period. The table shows that Pakistan is having strong reveled market
access in works of art (‟97), vehicles other than railway (‟87) and cocoa & cocoa preparations
(‟18) in the pre period with RMA values of 104, 25 and 22 respectively. In the post period
Pakistan is having strong revealed market access in furskins and artificial fur (‟43), arms and
ammunition (‟93) and live trees (‟06) with RMA values of 202, 71 and 22 respectively. The
results of RMA analysis show that out of 97 reported chapters Pakistan is having RMA
greater than 1 in 48 chapters (List of chapters is given in Annex - V) during the pre period,
whereas in the post period Pakistan is having RMA greater than 1 in 54 chapters (List of
chapters is given in Annex - VI). The chapters that are having RMA results greater than 1
show that the market access for these chapters is above than that which would be suggested
by the indicator of global revealed comparative advantage.
Table 5.9:
Top 10 average RMAs in Pre-period (2003-06) Top 10 average RMAs in Post-period (2007-10)
Code Product label RMA Code Product label RMA
'97 Works of art, collectors pieces and antiques 104.06 '43 Furskins and artificial fur, manufactures thereof 202.07
'87 Vehicles other than railway, tramway 25.55 '93 Arms and ammunition, parts and accessories thereof
71.45
'18 Cocoa and cocoa preparations 21.74 '06 Live trees, plants, bulbs, roots, cut flowers etc 22.41
'30 Pharmaceutical products 17.79 '20 Vegetable, fruit, nut, etc food preparations 22.10
'19 Cereal, flour, starch, milk preparations and products
15.14 '87 Vehicles other than railway, tramway 11.76
'03 Fish, crustaceans, molluscs, aquatic invertebrates nes
12.59 '30 Pharmaceutical products 11.47
'20 Vegetable, fruit, nut, etc food preparations 11.07 '80 Tin and articles thereof 10.99
'91 Clocks and watches and parts thereof 10.09 '51 Wool, animal hair, horsehair yarn and fabric thereof
9.45
'80 Tin and articles thereof 9.16 '03 Fish, crustaceans, molluscs, aquatic invertebrates nes
8.75
'12 Oil seed, oleagic fruits, grain, seed, fruit, etc, nes
8.26 '12 Oil seed, oleagic fruits, grain, seed, fruit, etc, nes
8.51
Source: Author‟s calculations based on Trade Map data
Table 5.10 reports the top 10 chapters that have achieved the highest positive RMA growth
on average basis from pre to post period, whereas table 5.11 reports the chapters that have

31
achieved the maximum negative growth in RMA from pre to post period. The highest RMA
growth is achieved by Chapter ‟43 (Fur-skins and artificial fur, manufactures thereof) and
maximum negative growth is achieved by chapter ‟66 (Umbrellas, walking-sticks, seat-sticks,
whips, etc). It is important to mention that the above given growths are presented for only
those chapters that are having RMA value in all the sample years.
Table 5.10:
Chapters that achieved highest positive growth in RMA from pre to post time period.
Code Product label RMA Value
Pre (2003-06) RMA Value
Post (2007-10)
'43 Furskins and artificial fur, manufactures thereof 1.73 202.07
'93 Arms and ammunition, parts and accessories thereof 1.69 71.45
'88 Aircraft, spacecraft, and parts thereof 0.03 1.28
'92 Musical instruments, parts and accessories 0.04 1.09
'05 Products of animal origin, nes 0.06 0.70
'89 Ships, boats and other floating structures 0.05 0.56
'22 Beverages, spirits and vinegar 0.60 4.75
'15 Animal, vegetable fats and oils, cleavage products, etc 0.00 0.00
'06 Live trees, plants, bulbs, roots, cut flowers etc 2.90 22.41
'11 Milling products, malt, starches, inulin, wheat gluten 0.51 3.30
Source: Author‟s calculations based on Trade Map data
Table 5.11:
Chapters that achieved highest negative growth in RMA from pre to post time period.
Code Product label RMA Value
Pre (2003-06) RMA Value
Post (2007-10)
'66 Umbrellas, walking-sticks, seat-sticks, whips, etc 0.73 0.00
'53 Vegetable textile fibers nes, paper yarn, woven fabric 0.12 0.00
'01 Live animals 0.04 0.00
'31 Fertilizers 0.03 0.00
'02 Meat and edible meat offal 0.01 0.00
'91 Clocks and watches and parts thereof 10.09 0.43
'97 Works of art, collectors pieces and antiques 104.06 5.59
'19 Cereal, flour, starch, milk preparations and products 15.14 1.09
'71 Pearls, precious stones, metals, coins, etc 0.06 0.01
'13 Lac, gums, resins, vegetable saps and extracts nes 0.89 0.18
Source: Author‟s calculations based on Trade Map data
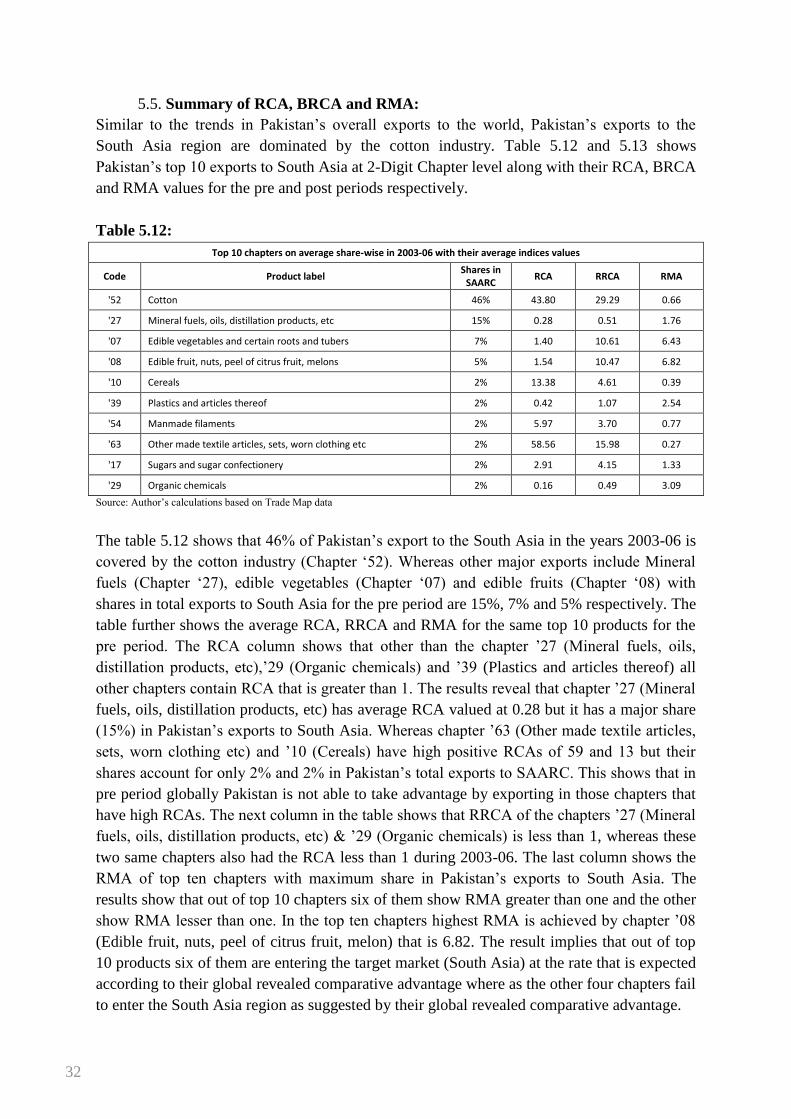
32
5.5. Summary of RCA, BRCA and RMA:
Similar to the trends in Pakistan‟s overall exports to the world, Pakistan‟s exports to the
South Asia region are dominated by the cotton industry. Table 5.12 and 5.13 shows
Pakistan‟s top 10 exports to South Asia at 2-Digit Chapter level along with their RCA, BRCA
and RMA values for the pre and post periods respectively.
Table 5.12:
Top 10 chapters on average share-wise in 2003-06 with their average indices values
Code Product label Shares in
SAARC RCA RRCA RMA
'52 Cotton 46% 43.80 29.29 0.66
'27 Mineral fuels, oils, distillation products, etc 15% 0.28 0.51 1.76
'07 Edible vegetables and certain roots and tubers 7% 1.40 10.61 6.43
'08 Edible fruit, nuts, peel of citrus fruit, melons 5% 1.54 10.47 6.82
'10 Cereals 2% 13.38 4.61 0.39
'39 Plastics and articles thereof 2% 0.42 1.07 2.54
'54 Manmade filaments 2% 5.97 3.70 0.77
'63 Other made textile articles, sets, worn clothing etc 2% 58.56 15.98 0.27
'17 Sugars and sugar confectionery 2% 2.91 4.15 1.33
'29 Organic chemicals 2% 0.16 0.49 3.09
Source: Author‟s calculations based on Trade Map data
The table 5.12 shows that 46% of Pakistan‟s export to the South Asia in the years 2003-06 is
covered by the cotton industry (Chapter „52). Whereas other major exports include Mineral
fuels (Chapter „27), edible vegetables (Chapter „07) and edible fruits (Chapter „08) with
shares in total exports to South Asia for the pre period are 15%, 7% and 5% respectively. The
table further shows the average RCA, RRCA and RMA for the same top 10 products for the
pre period. The RCA column shows that other than the chapter ‟27 (Mineral fuels, oils,
distillation products, etc),‟29 (Organic chemicals) and ‟39 (Plastics and articles thereof) all
other chapters contain RCA that is greater than 1. The results reveal that chapter ‟27 (Mineral
fuels, oils, distillation products, etc) has average RCA valued at 0.28 but it has a major share
(15%) in Pakistan‟s exports to South Asia. Whereas chapter ‟63 (Other made textile articles,
sets, worn clothing etc) and ‟10 (Cereals) have high positive RCAs of 59 and 13 but their
shares account for only 2% and 2% in Pakistan‟s total exports to SAARC. This shows that in
pre period globally Pakistan is not able to take advantage by exporting in those chapters that
have high RCAs. The next column in the table shows that RRCA of the chapters ‟27 (Mineral
fuels, oils, distillation products, etc) & ‟29 (Organic chemicals) is less than 1, whereas these
two same chapters also had the RCA less than 1 during 2003-06. The last column shows the
RMA of top ten chapters with maximum share in Pakistan‟s exports to South Asia. The
results show that out of top 10 chapters six of them show RMA greater than one and the other
show RMA lesser than one. In the top ten chapters highest RMA is achieved by chapter ‟08
(Edible fruit, nuts, peel of citrus fruit, melon) that is 6.82. The result implies that out of top
10 products six of them are entering the target market (South Asia) at the rate that is expected
according to their global revealed comparative advantage where as the other four chapters fail
to enter the South Asia region as suggested by their global revealed comparative advantage.

33
Table 5.13:
Top 10 chapters on average share-wise in 2007-10 with their average indices values
Code Product label Shares in
SAARC RCA RRCA RMA
'TOTAL All products
'52 Cotton 49% 52.95 48.26 0.91
'27 Mineral fuels, oils, distillation products, etc 10% 0.34 0.29 0.83
'25 Salt, sulphur, earth, stone, plaster, lime and cement 5% 9.18 6.05 0.62
'08 Edible fruit, nuts, peel of citrus fruit, melons 5% 1.77 11.70 6.69
'10 Cereals 4% 16.28 7.96 0.49
'41 Raw hides and skins (other than furskins) and leather 2% 9.70 12.13 1.25
'07 Edible vegetables and certain roots and tubers 2% 1.08 2.46 2.41
'84 Machinery, nuclear reactors, boilers, etc 2% 0.10 0.20 1.91
'60 Knitted or crocheted fabric 2% 2.09 6.41 3.07
'39 Plastics and articles thereof 1% 0.46 0.69 1.46
Source: Author‟s calculations based on Trade Map data
The table 5.13 shows that 49% of Pakistan‟s export to the South Asia is covered by the cotton
industry (‟52) in the period 2007-10. Whereas other major exports include Mineral fuels
(„27), Salt, sulphur, earth, stone, plaster, lime and cement („25), edible fruits („08) and
cereals („10) with shares equal to 10%, 5%, 5% and 4% respectively. The RCA column
shows that other than the chapters ‟27 (Mineral fuels, oils, distillation products, etc), ‟84
(Machinery, nuclear reactors, boilers, etc) and ‟39 (Plastics and articles thereof) all other
chapters from top 10 exports show RCA greater than 1. The results reveal that chapter ‟27
(Mineral fuels, oils, distillation products, etc) has average RCA of only 0.34 but it has a
major share of 10% (although decreased from 15% in pre period) during the post period in
Pakistan‟s exports to South Asia. Whereas chapters‟10 (Cereals) and ‟41 (Raw hides and
skins (other than furskins and leather) have RCAs of 16 and 10 but their shares are as low as
4% and 2% respectively in Pakistan‟s total exports to South Asia. This shows that Pakistan is
not taking full advantage of its export potential by exporting in those chapters to South Asia
where it has greater comparative advantage globally. The next column in the table shows that
RRCA values for the top 10 exports of Pakistan to South Asia in the post period. The table
shows that the RRCA of chapters ‟27 (Mineral fuels, oils, distillation products, etc), ‟84
(Machinery, nuclear reactors, boilers, etc) & ‟39 (Plastics and articles thereof) is less than 1,
whereas these three chapter also had the RCA less than 1.
The last column shows the RMA of top 10 chapters with maximum share in Pakistan‟s
exports to South Asia. The results show that out of top 10 chapters 4 of them show RMA
greater than 1 and the other show RMA lesser than 1. In the top 10 chapters, highest RMA is
achieved in chapter ‟08 (Edible fruit, nuts, peel of citrus fruit, melon) valued at 6.69 that was
similar to pre period value. The result implies that out of top 10 products 4 of them are
entering the target market (South Asia) at the rate that is expected according to their global
revealed comparative advantage where as the other 4 chapters failed to enter the South Asia
region as suggested by their global revealed comparative advantage.

34
5.6. Grubel-Lloyd Index:
An increase in the volume of trade can be caused either by changes in the pattern of
comparative advantage (inter-industry trade) or by increasing product differentiation with
scale economies (intra-industry trade). With many economies in the world following different
paths of industrialization, it is likely that at certain point of time they specialize in different
export items in accordance with what their comparative advantage dictates. However, it is
also likely that, with “convergence” in their income level, trade patterns become increasingly
complementary among the economies that compete with one another in similar export items.
Trade due to product differentiation with increasing returns to scale (IRS) plays an important
role in explaining trade between countries particularly when the differences in factor
proportions are not very large. So any measure of intra-industry trade (or inter-industry trade)
must somehow reflect how these two alternative forms of trade are combined to generate the
actual trade data.
The GL index is a standard indicator of measuring the share of intra-industry trade from a
data set composed of both homogeneous and differentiated goods. This index is calculated
from the share of intra-industry trade in total trade. It measures the degree of intra-industry
trade due to product differentiation with scale economies, which indicates how a country
import and export simultaneously varieties of a particular product. Expressed as the ratio of
intra-industry trade (two-way trade within industries) to total trade (sum of intra-industry
trade and inter-industry trade).The Grubel-Lloyd (GL) index is a widely used indicator
measuring the extent of intra industry trade as opposed to that of inter-industry trade. It is an
aggregate indicator, summed up over every country pairs on all goods traded. The GL index
sorts out the amount of trade flows a pair of countries simultaneously import and export. At
the same time when the country exports or imports goods and services of similar type, then
the Intra-trade arises.
There are two types of intra industry trade:
a. Horizontal Intra-Industry trade:
When the country exports or imports goods and services which are of the same sector
and are at the same stage of processing, this is known as horizontal intra-industry
trade.
b. Vertical Intra-Industry Trade:
When the country exports and imports goods and services which are of the same
sector but at different stages of processing, this is known as vertical intra-industry
trade.
Grubel Lloyd (1975) introduced an index to calculate intra-industry trade (IIT) and nowadays
this is the most frequently used method. This index is named as Grubel-Lloyd Index.
According to Grubel and Lloyd‟, when there is a difference in level of technology and human
capital in products with same input requirements then this type of trade takes place. The GL
index has been formulated to measure global trading pattern between two countries. The GL
Index is calculated as:
GL sector i = 1- (|Export sector i – Import sector i |/ Export sector i + Import sector i)

35
If the country only imports or only exports goods or services within the same sector, such that
there is no intra-industry trade, the second term on the right hand side of equation is equal to
1, such that the whole expression reduces to 0. Similarly, if the export value is exactly equal
to the import value, than the second term on the right hand of the equation is equal to 0, such
that the whole expression reduces to 1. For simplicity we multiplied by 100, therefore GL
Index varies between 0 and 100.0 indicates pure inter industry trade and 100 indicates pure
intra industry trade. In calculating the GL index, individual observations on bilateral trade
flows among countries are classified into two different data sets, the intra-industry and inter-
industry sets. Some observations whose export and import values are identical are deemed to
belong to the intra-industry trade set. Other observations whose export and import values are
not identical are regarded as belong to the inter-industry trade set. We calculate the GL-Index
between Pakistan and three major SAARC partners (India, Sri Lanka and Bangladesh) at the
SITC 3 digit level 2010.
Our analysis reveals that the extent of intra industry trade between Pakistan and other major
SAARC countries is low and that the production systems of the region are not as integrated as
that of other trading blocs like ASEAN. In the case of ASEAN the economies are highly
integrated as they are a part of the global supply chain for high technology products. Trade
between SAARC and Pakistan is concentrated mainly in agricultural and semi processed
products which are then used for local consumption.
5.6.1. Intra Industry Trade between Pakistan and India:
The GL Index identifies 8 chapters (at the SITC 3 digit level) that are having GL-Index
values greater than 60% in 2010. These chapters are listed in the table 5.14:
Table 5.14:
SITC Description GL
058 Fruit, preserved, and fruit preparations (excluding fruit juices) 88%
278 Other crude minerals 81%
582 Plates, sheets, film, foil and strip, of plastics 89%
654 Other textile fabrics, woven 79%
657 Special yarns, special textile fabrics and related products 94%
663 Mineral manufactures, n.e.s. 99%
665 Glassware 75%
898 Musical instruments and parts and accessories thereof; records, tapes and other sound or similar recordings (excluding goods of groups 763 and 883)
80%
Source: Author‟s calculations based on Trade Map data
In Fruits preserved and fruit preparations, Pakistan is the major exporter of Jams, fruits and
jellies, marmalades or nut puree to India and importing same product sub-category. Pakistan
is exporting sodium chloride, crude minerals and asbestos to India and importing clays and
other refractory minerals in the sub category 278. Similarly in Special yarn and special
textiles fabrics, Pakistan is majorly importing twines, cordage, rope and cables and Rubber
thread and cord and exports felt, coated covered or laminated, Textiles products coated or
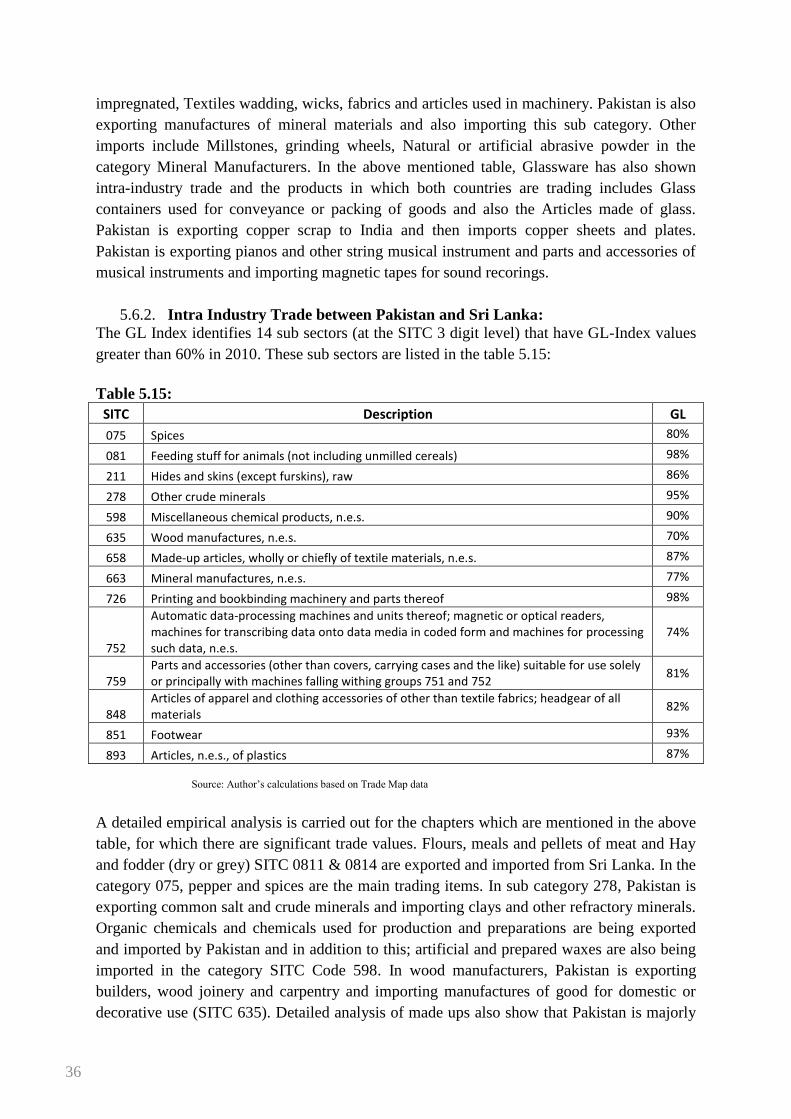
36
impregnated, Textiles wadding, wicks, fabrics and articles used in machinery. Pakistan is also
exporting manufactures of mineral materials and also importing this sub category. Other
imports include Millstones, grinding wheels, Natural or artificial abrasive powder in the
category Mineral Manufacturers. In the above mentioned table, Glassware has also shown
intra-industry trade and the products in which both countries are trading includes Glass
containers used for conveyance or packing of goods and also the Articles made of glass.
Pakistan is exporting copper scrap to India and then imports copper sheets and plates.
Pakistan is exporting pianos and other string musical instrument and parts and accessories of
musical instruments and importing magnetic tapes for sound recorings.
5.6.2. Intra Industry Trade between Pakistan and Sri Lanka:
The GL Index identifies 14 sub sectors (at the SITC 3 digit level) that have GL-Index values
greater than 60% in 2010. These sub sectors are listed in the table 5.15:
Table 5.15:
SITC Description GL
075 Spices 80%
081 Feeding stuff for animals (not including unmilled cereals) 98%
211 Hides and skins (except furskins), raw 86%
278 Other crude minerals 95%
598 Miscellaneous chemical products, n.e.s. 90%
635 Wood manufactures, n.e.s. 70%
658 Made-up articles, wholly or chiefly of textile materials, n.e.s. 87%
663 Mineral manufactures, n.e.s. 77%
726 Printing and bookbinding machinery and parts thereof 98%
752
Automatic data-processing machines and units thereof; magnetic or optical readers, machines for transcribing data onto data media in coded form and machines for processing such data, n.e.s.
74%
759 Parts and accessories (other than covers, carrying cases and the like) suitable for use solely or principally with machines falling withing groups 751 and 752
81%
848 Articles of apparel and clothing accessories of other than textile fabrics; headgear of all materials
82%
851 Footwear 93%
893 Articles, n.e.s., of plastics 87%
Source: Author‟s calculations based on Trade Map data
A detailed empirical analysis is carried out for the chapters which are mentioned in the above
table, for which there are significant trade values. Flours, meals and pellets of meat and Hay
and fodder (dry or grey) SITC 0811 & 0814 are exported and imported from Sri Lanka. In the
category 075, pepper and spices are the main trading items. In sub category 278, Pakistan is
exporting common salt and crude minerals and importing clays and other refractory minerals.
Organic chemicals and chemicals used for production and preparations are being exported
and imported by Pakistan and in addition to this; artificial and prepared waxes are also being
imported in the category SITC Code 598. In wood manufacturers, Pakistan is exporting
builders, wood joinery and carpentry and importing manufactures of good for domestic or
decorative use (SITC 635). Detailed analysis of made ups also show that Pakistan is majorly
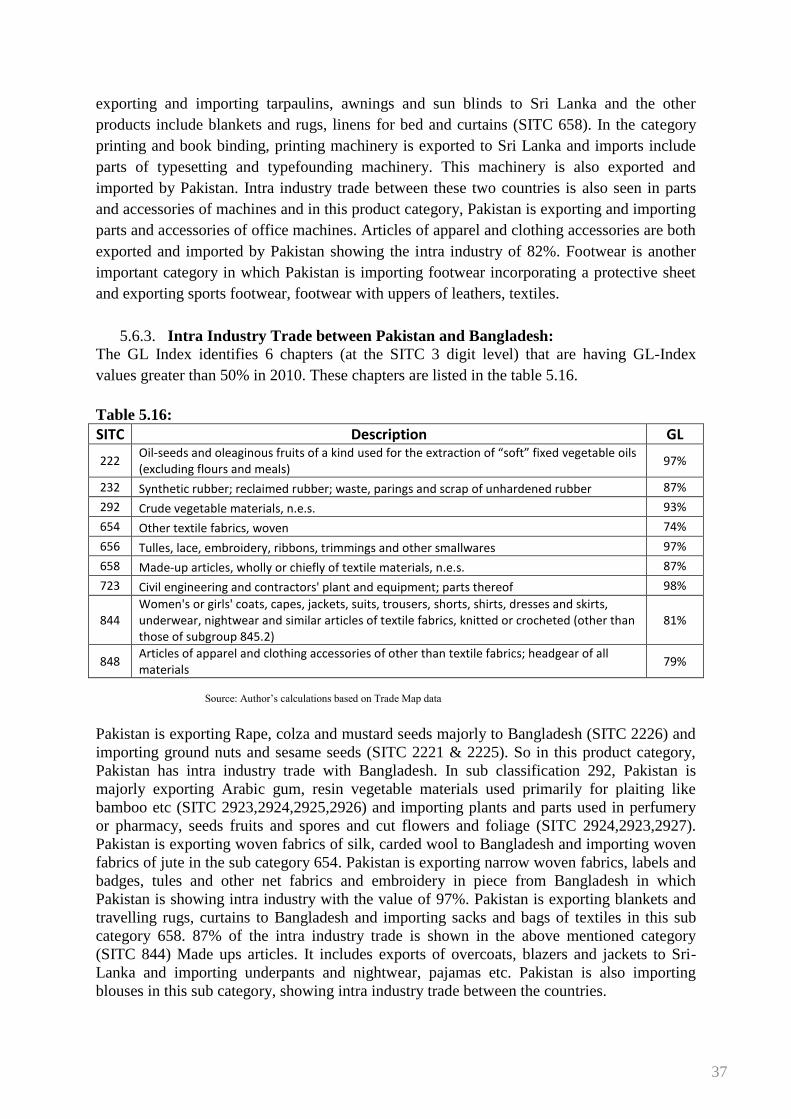
37
exporting and importing tarpaulins, awnings and sun blinds to Sri Lanka and the other
products include blankets and rugs, linens for bed and curtains (SITC 658). In the category
printing and book binding, printing machinery is exported to Sri Lanka and imports include
parts of typesetting and typefounding machinery. This machinery is also exported and
imported by Pakistan. Intra industry trade between these two countries is also seen in parts
and accessories of machines and in this product category, Pakistan is exporting and importing
parts and accessories of office machines. Articles of apparel and clothing accessories are both
exported and imported by Pakistan showing the intra industry of 82%. Footwear is another
important category in which Pakistan is importing footwear incorporating a protective sheet
and exporting sports footwear, footwear with uppers of leathers, textiles.
5.6.3. Intra Industry Trade between Pakistan and Bangladesh:
The GL Index identifies 6 chapters (at the SITC 3 digit level) that are having GL-Index
values greater than 50% in 2010. These chapters are listed in the table 5.16.
Table 5.16:
SITC Description GL
222 Oil-seeds and oleaginous fruits of a kind used for the extraction of “soft” fixed vegetable oils (excluding flours and meals)
97%
232 Synthetic rubber; reclaimed rubber; waste, parings and scrap of unhardened rubber 87%
292 Crude vegetable materials, n.e.s. 93%
654 Other textile fabrics, woven 74%
656 Tulles, lace, embroidery, ribbons, trimmings and other smallwares 97%
658 Made-up articles, wholly or chiefly of textile materials, n.e.s. 87%
723 Civil engineering and contractors' plant and equipment; parts thereof 98%
844 Women's or girls' coats, capes, jackets, suits, trousers, shorts, shirts, dresses and skirts, underwear, nightwear and similar articles of textile fabrics, knitted or crocheted (other than those of subgroup 845.2)
81%
848 Articles of apparel and clothing accessories of other than textile fabrics; headgear of all materials
79%
Source: Author‟s calculations based on Trade Map data
Pakistan is exporting Rape, colza and mustard seeds majorly to Bangladesh (SITC 2226) and
importing ground nuts and sesame seeds (SITC 2221 & 2225). So in this product category,
Pakistan has intra industry trade with Bangladesh. In sub classification 292, Pakistan is
majorly exporting Arabic gum, resin vegetable materials used primarily for plaiting like
bamboo etc (SITC 2923,2924,2925,2926) and importing plants and parts used in perfumery
or pharmacy, seeds fruits and spores and cut flowers and foliage (SITC 2924,2923,2927).
Pakistan is exporting woven fabrics of silk, carded wool to Bangladesh and importing woven
fabrics of jute in the sub category 654. Pakistan is exporting narrow woven fabrics, labels and
badges, tules and other net fabrics and embroidery in piece from Bangladesh in which
Pakistan is showing intra industry with the value of 97%. Pakistan is exporting blankets and
travelling rugs, curtains to Bangladesh and importing sacks and bags of textiles in this sub
category 658. 87% of the intra industry trade is shown in the above mentioned category
(SITC 844) Made ups articles. It includes exports of overcoats, blazers and jackets to Sri-
Lanka and importing underpants and nightwear, pajamas etc. Pakistan is also importing
blouses in this sub category, showing intra industry trade between the countries.

38
6. CONCLUSION
The Pakistan‟s regional economic relations in South-Asia have strengthened over the years,
particularly after the Implementation of SAFTA. However, the current size of trade between
the South Asian countries is low compared to the size and structural complementarities of the
regional economies. In this context, the present paper analyses trade relations and future areas
of co-operation between Pakistan and major South Asian countries. The merchandise trade
increase only in absolute term within the South Asian region has been mainly because of the
changing demand structures and comparative advantages of economies in complementary
sectors. Pakistan‟s inter-regional exports in South Asia are dominated by basic foods and
agricultural products. The import demand for these products fluctuates widely with domestic
supply conditions, and the South Asian governments apply arbitrary policies to maintain
stable domestic prices. The imports are allowed with domestic shortfalls, and restrictions are
imposed on them when domestic supply is stable. With the exception of India, most other
countries depend on a few products for export revenue, limiting the possibility of their export
expansion. The import demand depends on the level of development, and the demand for
agricultural products is subject to ad hoc policy changes depending on domestic supply
changes and political circumstances. Exporting countries find it difficult to absorb the
changed demand, and hence need careful scrutiny and negotiations at the regional level.
The analysis of competitiveness and complementarities of Pakistan with South-Asian major
economies reveals that there has been a distinct change in trade patterns of Pakistan with its
partners with respects to intraregional trade. Pakistan‟s exports mainly constitute low value-
added industrial products and agricultural products, while Pakistan‟s imports from the
economies largely consist of relatively raw material and low value-added products. Further,
Pakistan‟s exports complementarity indices with Bangladesh and Sri Lanka increased with
comparative advantage advocate that Pakistan„s trade with these countries certainly has a
potential to grow over time, but the converse is not true. But in the backdrop of Pakistan‟s
low level of trade complementarity with its major trading partner in South Asia i.e. India with
which Pakistan‟s exports complement is not reasonably well to its partner imports, although
the degree has been rising overtime, so it becomes imperative to think that intraregional trade
may have potential to expand in South Asia. The trade complementarity analysis also
conclude that the South Asian countries are at different stages of production within an
industry, and the exports of Pakistan‟s complements reasonably well with the imports of
other countries in South-Asian region, which results in strengthening the potential of intra-
regional trade in South-Asia in future.
The analysis of RCA Index at the level shows that Pakistan competitive basket changed
overtime and has been specializing in a few products which are highly competitive as South-
Asian major economies exports are less diversified. Moreover, Pakistan shows declining
comparative advantage in South-Asian region mainly in Cereals, Ceramic Products, Fish,
pharmaceutical products, precious stones (pearls) and photographic goods. The analysis of
GL-Index at the disaggregated level shows that there are some industries where Pakistan has
comparative advantage in different products, pointing to opportunities for intra-industry

39
trade. The intra-industry trade (IIT) analysis shows that IIT is low in the top traded product
groups and high in some products where trading is low. This offers huge opportunity for
intra-industry trade if sector-specific barriers are removed along with general barriers.

40
7. ANNEXURE:
Annex – I
Chapters having RCA value greater than 1 in pre period
Code Product label Average RCA
(2003-06)
'63 Other made textile articles, sets, worn clothing etc 58.56
'52 Cotton 43.80
'57 Carpets and other textile floor coverings 15.04
'10 Cereals 13.38
'42 Articles of leather, animal gut, harness, travel goods 11.47
'61 Articles of apparel, accessories, knit or crochet 8.93
'41 Raw hides and skins (other than furskins) and leather 7.13
'11 Milling products, malt, starches, inulin, wheat gluten 6.77
'54 Manmade filaments 5.97
'36 Explosives, pyrotechnics, matches, pyrophorics, etc 5.86
'13 Lac, gums, resins, vegetable saps and extracts nes 5.55
'62 Articles of apparel, accessories, not knit or crochet 5.51
'95 Toys, games, sports requisites 3.22
'55 Manmade staple fibers 3.03
'60 Knitted or crocheted fabric 3.01
'17 Sugars and sugar confectionery 2.91
'58 Special woven or tufted fabric, lace, tapestry etc 2.60
'14 Vegetable plaiting materials, vegetable products nes 2.54
'05 Products of animal origin, nes 2.19
'56 Wadding, felt, nonwovens, yarns, twine, cordage, etc 2.14
'25 Salt, sulphur, earth, stone, plaster, lime and cement 1.98
'03 Fish, crustaceans, molluscs, aquatic invertebrates nes 1.70
'08 Edible fruit, nuts, peel of citrus fruit, melons 1.54
'96 Miscellaneous manufactured articles 1.41
'07 Edible vegetables and certain roots and tubers 1.40
'15 Animal, vegetable fats and oils, cleavage products, etc 1.28
'64 Footwear, gaiters and the like, parts thereof 1.26
'53 Vegetable textile fibers nes, paper yarn, woven fabric 1.25

41
Annex – II
Chapters having RCA value greater than 1 in post period
Code Product label Average RCA
(2007-09)
'63 Other made textile articles, sets, worn clothing etc 54.74
'52 Cotton 52.95
'10 Cereals 16.28
'42 Articles of leather, animal gut, harness, travel goods 11.25
'57 Carpets and other textile floor coverings 10.25
'41 Raw hides and skins (other than furskins) and leather 9.70
'25 Salt, sulphur, earth, stone, plaster, lime and cement 9.18
'61 Articles of apparel, accessories, knit or crochet 8.00
'55 Manmade staple fibres 7.94
'62 Articles of apparel, accessories, not knit or crochet 5.84
'36 Explosives, pyrotechnics, matches, pyrophorics, etc 5.47
'13 Lac, gums, resins, vegetable saps and extracts nes 5.41
'14 Vegetable plaiting materials, vegetable products nes 4.03
'17 Sugars and sugar confectionery 3.20
'11 Milling products, malt, starches, inulin, wheat gluten 3.01
'05 Products of animal origin, nes 2.58
'60 Knitted or crocheted fabric 2.09
'03 Fish, crustaceans, molluscs, aquatic invertebrates nes 2.05
'08 Edible fruit, nuts, peel of citrus fruit, melons 1.77
'95 Toys, games, sports requisites 1.75
'54 Manmade filaments 1.56
'22 Beverages, spirits and vinegar 1.53
'58 Special woven or tufted fabric, lace, tapestry etc 1.47
'78 Lead and articles thereof 1.35
'15 Animal, vegetable fats and oils, cleavage products, etc 1.30
'56 Wadding, felt, nonwovens, yarns, twine, cordage, etc 1.12
'53 Vegetable textile fibres nes, paper yarn, woven fabric 1.11
'07 Edible vegetables and certain roots and tubers 1.08
'89 Ships, boats and other floating structures 1.08
'64 Footwear, gaiters and the like, parts thereof 1.07
'82 Tools, implements, cutlery, etc of base metal 1.02
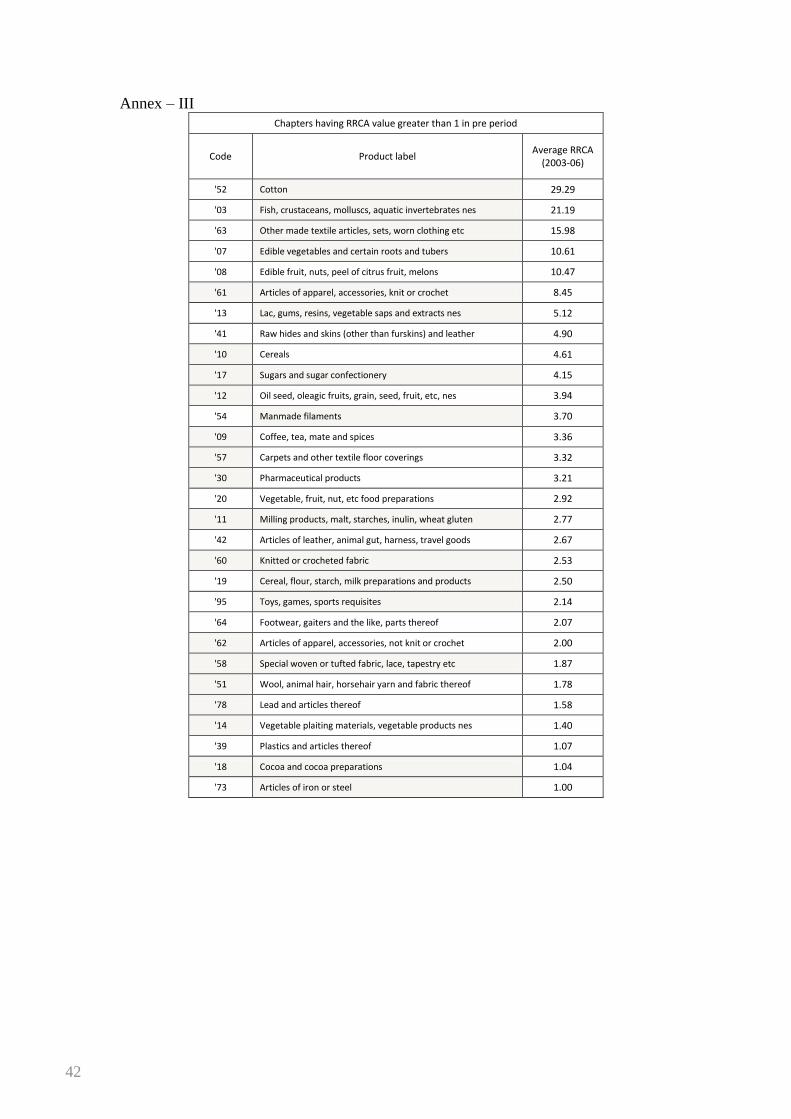
42
Annex – III
Chapters having RRCA value greater than 1 in pre period
Code Product label Average RRCA
(2003-06)
'52 Cotton 29.29
'03 Fish, crustaceans, molluscs, aquatic invertebrates nes 21.19
'63 Other made textile articles, sets, worn clothing etc 15.98
'07 Edible vegetables and certain roots and tubers 10.61
'08 Edible fruit, nuts, peel of citrus fruit, melons 10.47
'61 Articles of apparel, accessories, knit or crochet 8.45
'13 Lac, gums, resins, vegetable saps and extracts nes 5.12
'41 Raw hides and skins (other than furskins) and leather 4.90
'10 Cereals 4.61
'17 Sugars and sugar confectionery 4.15
'12 Oil seed, oleagic fruits, grain, seed, fruit, etc, nes 3.94
'54 Manmade filaments 3.70
'09 Coffee, tea, mate and spices 3.36
'57 Carpets and other textile floor coverings 3.32
'30 Pharmaceutical products 3.21
'20 Vegetable, fruit, nut, etc food preparations 2.92
'11 Milling products, malt, starches, inulin, wheat gluten 2.77
'42 Articles of leather, animal gut, harness, travel goods 2.67
'60 Knitted or crocheted fabric 2.53
'19 Cereal, flour, starch, milk preparations and products 2.50
'95 Toys, games, sports requisites 2.14
'64 Footwear, gaiters and the like, parts thereof 2.07
'62 Articles of apparel, accessories, not knit or crochet 2.00
'58 Special woven or tufted fabric, lace, tapestry etc 1.87
'51 Wool, animal hair, horsehair yarn and fabric thereof 1.78
'78 Lead and articles thereof 1.58
'14 Vegetable plaiting materials, vegetable products nes 1.40
'39 Plastics and articles thereof 1.07
'18 Cocoa and cocoa preparations 1.04
'73 Articles of iron or steel 1.00

43
Annex – IV
Chapters having RRCA value greater than 1 in post period
Code Product label Average RRCA
(2007-09)
'52 Cotton 48.26
'93 Arms and ammunition, parts and accessories thereof 41.93
'63 Other made textile articles, sets, worn clothing etc 18.40
'03 Fish, crustaceans, molluscs, aquatic invertebrates nes 17.45
'41 Raw hides and skins (other than furskins) and leather 12.13
'08 Edible fruit, nuts, peel of citrus fruit, melons 11.70
'20 Vegetable, fruit, nut, etc food preparations 8.64
'61 Articles of apparel, accessories, knit or crochet 8.15
'10 Cereals 7.96
'11 Milling products, malt, starches, inulin, wheat gluten 7.16
'22 Beverages, spirits and vinegar 6.79
'60 Knitted or crocheted fabric 6.41
'78 Lead and articles thereof 6.40
'12 Oil seed, oleagic fruits, grain, seed, fruit, etc, nes 6.06
'25 Salt, sulphur, earth, stone, plaster, lime and cement 6.05
'43 Furskins and artificial fur, manufactures thereof 5.63
'17 Sugars and sugar confectionery 5.29
'09 Coffee, tea, mate and spices 4.44
'55 Manmade staple fibres 3.19
'51 Wool, animal hair, horsehair yarn and fabric thereof 3.16
'30 Pharmaceutical products 2.84
'62 Articles of apparel, accessories, not knit or crochet 2.67
'57 Carpets and other textile floor coverings 2.56
'07 Edible vegetables and certain roots and tubers 2.46
'70 Glass and glassware 1.92
'42 Articles of leather, animal gut, harness, travel goods 1.81
'05 Products of animal origin, nes 1.56
'64 Footwear, gaiters and the like, parts thereof 1.42
'16 Meat, fish and seafood food preparations nes 1.39
'95 Toys, games, sports requisites 1.34
'54 Manmade filaments 1.26
'24 Tobacco and manufactured tobacco substitutes 1.19
'34 Soaps, lubricants, waxes, candles, modelling pastes 1.13
'56 Wadding, felt, nonwovens, yarns, twine, cordage, etc 1.12
'74 Copper and articles thereof 1.10
'14 Vegetable plaiting materials, vegetable products nes 1.06
'21 Miscellaneous edible preparations 1.03
Annex – V
Chapters having RMA value greater than 1 in pre period
Code Product label Average RMA

44
(2003-06)
'97 Works of art, collectors pieces and antiques 104.06
'87 Vehicles other than railway, tramway 25.55
'18 Cocoa and cocoa preparations 21.74
'30 Pharmaceutical products 17.79
'19 Cereal, flour, starch, milk preparations and products 15.14
'03 Fish, crustaceans, molluscs, aquatic invertebrates nes 12.59
'20 Vegetable, fruit, nut, etc food preparations 11.07
'91 Clocks and watches and parts thereof 10.09
'80 Tin and articles thereof 9.16
'12 Oil seed, oleagic fruits, grain, seed, fruit, etc, nes 8.26
'08 Edible fruit, nuts, peel of citrus fruit, melons 6.82
'07 Edible vegetables and certain roots and tubers 6.43
'51 Wool, animal hair, horsehair yarn and fabric thereof 6.09
'09 Coffee, tea, mate and spices 4.44
'79 Zinc and articles thereof 4.27
'70 Glass and glassware 3.95
'73 Articles of iron or steel 3.75
'33 Essential oils, perfumes, cosmetics, toiletries 3.48
'83 Miscellaneous articles of base metal 3.28
'37 Photographic or cinematographic goods 3.25
'21 Miscellaneous edible preparations 3.18
'84 Machinery, nuclear reactors, boilers, etc 3.16
'75 Nickel and articles thereof 3.09
'29 Organic chemicals 3.09
'06 Live trees, plants, bulbs, roots, cut flowers etc 2.90
'34 Soaps, lubricants, waxes, candles, modelling pastes 2.78
'38 Miscellaneous chemical products 2.72
'39 Plastics and articles thereof 2.54
'32 Tanning, dyeing extracts, tannins, derivs, pigments etc 2.47
'99 Commodities not elsewhere specified 2.24
'78 Lead and articles thereof 2.24
'24 Tobacco and manufactured tobacco substitutes 2.13
'48 Paper & paperboard, articles of pulp, paper and board 1.94
'28 Inorganic chemicals, precious metal compound, isotopes 1.93
'74 Copper and articles thereof 1.82
'27 Mineral fuels, oils, distillation products, etc 1.76
'43 Furskins and artificial fur, manufactures thereof 1.73
'93 Arms and ammunition, parts and accessories thereof 1.69
'49 Printed books, newspapers, pictures etc 1.68
'64 Footwear, gaiters and the like, parts thereof 1.62
'35 Albuminoids, modified starches, glues, enzymes 1.58
'94 Furniture, lighting, signs, prefabricated buildings 1.39
'85 Electrical, electronic equipment 1.35
'17 Sugars and sugar confectionery 1.33

45
'72 Iron and steel 1.28
'81 Other base metals, cermets, articles thereof 1.24
'60 Knitted or crocheted fabric 1.11
'76 Aluminium and articles thereof 1.05
Annex – VI
Chapters having RMA value greater than 1 in post period
Code Product label Average RMA
(2007-09)
'43 Furskins and artificial fur, manufactures thereof 202.07
'93 Arms and ammunition, parts and accessories thereof 71.45
'06 Live trees, plants, bulbs, roots, cut flowers etc 22.41
'20 Vegetable, fruit, nut, etc food preparations 22.10
'87 Vehicles other than railway, tramway 11.76
'30 Pharmaceutical products 11.47
'80 Tin and articles thereof 10.99
'51 Wool, animal hair, horsehair yarn and fabric thereof 9.45
'03 Fish, crustaceans, molluscs, aquatic invertebrates nes 8.75
'12 Oil seed, oleagic fruits, grain, seed, fruit, etc, nes 8.51
'75 Nickel and articles thereof 7.75
'70 Glass and glassware 7.13
'18 Cocoa and cocoa preparations 6.92
'08 Edible fruit, nuts, peel of citrus fruit, melons 6.69
'79 Zinc and articles thereof 6.54
'29 Organic chemicals 5.87
'38 Miscellaneous chemical products 5.76
'97 Works of art, collectors pieces and antiques 5.59
'09 Coffee, tea, mate and spices 5.48
'24 Tobacco and manufactured tobacco substitutes 5.24
'22 Beverages, spirits and vinegar 4.75
'33 Essential oils, perfumes, cosmetics, toiletries 4.62
'21 Miscellaneous edible preparations 4.39
'78 Lead and articles thereof 3.91
'34 Soaps, lubricants, waxes, candles, modelling pastes 3.84
'74 Copper and articles thereof 3.80
'32 Tanning, dyeing extracts, tannins, derivs, pigments etc 3.73
'11 Milling products, malt, starches, inulin, wheat gluten 3.30
'28 Inorganic chemicals, precious metal compound, isotopes 3.26
'48 Paper & paperboard, articles of pulp, paper and board 3.13
'60 Knitted or crocheted fabric 3.07
'73 Articles of iron or steel 2.93
'16 Meat, fish and seafood food preparations nes 2.54
'07 Edible vegetables and certain roots and tubers 2.41
'83 Miscellaneous articles of base metal 2.12
'49 Printed books, newspapers, pictures etc 1.96

46
'35 Albuminoids, modified starches, glues, enzymes 1.91
'84 Machinery, nuclear reactors, boilers, etc 1.91
'46 Manufactures of plaiting material, basketwork, etc. 1.81
'76 Aluminium and articles thereof 1.69
'39 Plastics and articles thereof 1.46
'37 Photographic or cinematographic goods 1.43
'64 Footwear, gaiters and the like, parts thereof 1.42
'88 Aircraft, spacecraft, and parts thereof 1.28
'41 Raw hides and skins (other than furskins) and leather 1.25
'23 Residues, wastes of food industry, animal fodder 1.25
'85 Electrical, electronic equipment 1.10
'92 Musical instruments, parts and accessories 1.09
'59 Impregnated, coated or laminated textile fabric 1.09
'19 Cereal, flour, starch, milk preparations and products 1.09
'17 Sugars and sugar confectionery 1.08
'56 Wadding, felt, nonwovens, yarns, twine, cordage, etc 1.07
'72 Iron and steel 1.06
'61 Articles of apparel, accessories, knit or crochet 1.01

47
8. REFERENCES:
Baysan, T., Panagariya, A., and Pitigala,N. 2006, „Preferential Trading in South Asia‟, World
Bank Policy Research Working Paper 3813. Washington DC: The World Bank.
Das, D. K. 2007, „South Asian Free Trade Agreement: Prospects of Shallow Regional
Integration‟, CSGR Working Paper 218/07.Coventry, University of Warwick.
Derosa, Dean A. and Govindan, Kumaresan 1996, „Agriculture, Trade, and Regionalism in
South Asia‟, Journal of Asian Economics, 7 (2), pp. 293-316.
Dhungel, D. 2004, „South Asian Association for Regional Cooperation (SAARC): Prospect
for
Development‟, The Pakistan Development Review, 43 (4 Part II): 933-941.
Jhamb, S. 2006, „India‟s Regional Trading Agreements‟, South Asian Journal, 11(January-
March 2006).
Krueger, Rossana Cecilia, Valerie Thomas, Tristan To (2004), „Impacts of the South Asia
Free Trade Agreement‟, Policy Analysis Workshop, Public Affairs 869, Spring 2004.
Kumar, Saini 2007, ‟Economic Co operation in South Asia: The Dilemma of SAFTA and
Beyond‟, Working Paper No. 2007-017, Indira Gandhi Institute of Development Research,
Mumbai, October.
Mehta, S. P., and Kumar, P. 2004, „RTAs and South Asia: Option in the Wake of Cancun
Fiasco‟. ASARC Working Paper 2004-11, Canberra, The Australian National University.
Newfarmer, R., and Pierola, M. D. 2007, „SAFTA: Promise and Pitfalls of Preferential Trade
Agreements, In the Challenges and Potential of Pakistan-India Trade, edited by Z. F. Naqvi
and P. Schuler, Washington DC: The World Bank.
Pigato, M., C. Farah, K. Itakura, K. Jun, W. Martin, K. Murrell and T.G. Srinivasan 1997,
„South Asia‟s Integration into the World Economy‟, World Bank, Washington DC.
Pitigala, Nihal 2005,‟What Does Regional Trade in South Asia Reveal about Future Trade
Liberalization?‟ Policy Research Working Paper No. 3497, Washington DC: The World
Bank, February.
Rahman, M., Shadat,W. B. and Das N. C. 2006, „Trade Potential in SAFTA: An Application
of Augmented Gravity Model‟, Dhaka, Centre for Policy Dialogue.
Raihan, A. and A. Razzaque 2007, „Welfare Effects of South Asia Free Trade Area
(SAFTA), Regional Trading Arrangements (RTAs) in South Asia: Implications for the
Bangladesh Economy‟, Paper prepared for the UNDP Regional Centre Colombo, January.
i “Competitiveness and Complementarities” ADB (2008)