Embed Size (px)
Citation preview

Panel Discussion Arizona GFOA
October 21, 2011

Operating Budget Budget-balancing Worksheet -- Interactive Detailed Budget Reduction Prioritization – Interactive
Capital Budget Project Prioritization & Asset Management Property Tax Stabilization Policy

2008-09 2009-10 2010-11 2011-12 2012-13Number of FT permanent positions eliminated -- first half of the fiscal year 60 - Number of FT permanent positions eliminated last half of the fiscal year 50 69 - - Changes to salary/benefit policies (annualized reductions -- recurring) 1,000,000 6,000,000 6,000,000 6,000,000 Reductions of PT positions, contracted svcs. and non-personnel costs 10.0% 8.0% 0.0%Revenue increases (annualized estimate -- recurring) 1,000,000 1,000,000 500,000 Annual Appropriations to fund the OPEB liability 2,000,000 4,000,000 6,600,000 6,600,000 Non-recurring (one-time) additions to revenue - Non-recurring (one-time) expenditure reductions - -
2008-09 2009-10 2010-11 2011-12 2012-13Revenues 171,202,000 163,897,000 174,426,000 181,673,000 187,597,000
Expenditures 183,130,000 181,938,385 175,754,282 178,511,672 184,107,382 Surplus (Deficit) Prior to Use of Fund Balance (11,928,000) (18,041,385) (1,328,282) 3,161,328 3,489,618
Unreserved/Undesignated Fund Balance After Balancing Budget 42,683,435 41,642,050 40,313,768 43,475,096 46,964,714 2008-09 2009-10 2010-11 2011-12 2012-13Unreserved Fund Balance as a Percentage of Revenues 24.93% 25.41% 23.11% 23.93% 25.03%Minimum Targeted Unreserved Fund Balance 24% 23% 22% 21% 20%Targeted Unreserved Fund Balance Range 26% 27% 28% 29% 30%
BUDGET-BALANCING WORKSHEETEffects of Potential Changes to the General Fund Budget
150,000,000
155,000,000
160,000,000
165,000,000
170,000,000
175,000,000
180,000,000
185,000,000
190,000,000
2008-09 2009-10 2010-11 2011-12 2012-13
Projected Revenues and Expenditures
Revenues
Expenditures
20%
22%
24%
26%
28%
30%
2008-09 2009-10 2010-11 2011-12 2012-13
Unreserved Fund Balance as a Percentage of Revenues
Targeted Unreserved Fund Balance Range Outside of Targeted Range Unreserved Fund Balance as a Percentage of Revenues
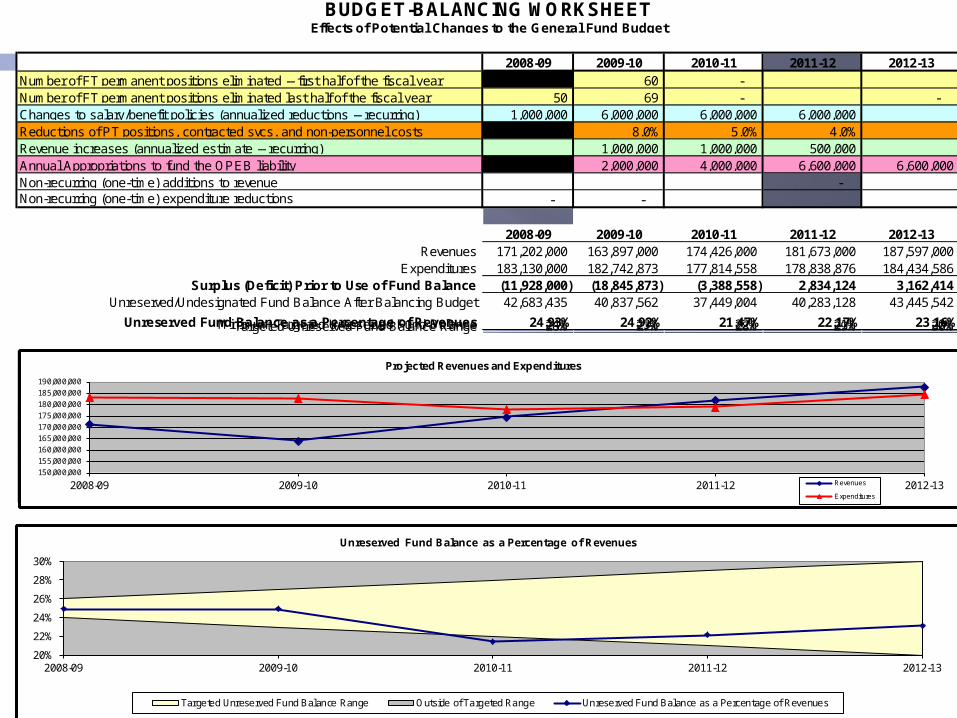
2008-09 2009-10 2010-11 2011-12 2012-13Number of FT permanent positions eliminated -- first half of the fiscal year 60 - Number of FT permanent positions eliminated last half of the fiscal year 50 69 - - Changes to salary/benefit policies (annualized reductions -- recurring) 1,000,000 6,000,000 6,000,000 6,000,000 Reductions of PT positions, contracted svcs. and non-personnel costs 8.0% 5.0% 4.0%Revenue increases (annualized estimate -- recurring) 1,000,000 1,000,000 500,000 Annual Appropriations to fund the OPEB liability 2,000,000 4,000,000 6,600,000 6,600,000 Non-recurring (one-time) additions to revenue - Non-recurring (one-time) expenditure reductions - -
2008-09 2009-10 2010-11 2011-12 2012-13Revenues 171,202,000 163,897,000 174,426,000 181,673,000 187,597,000
Expenditures 183,130,000 182,742,873 177,814,558 178,838,876 184,434,586 Surplus (Deficit) Prior to Use of Fund Balance (11,928,000) (18,845,873) (3,388,558) 2,834,124 3,162,414
Unreserved/Undesignated Fund Balance After Balancing Budget 42,683,435 40,837,562 37,449,004 40,283,128 43,445,542 2008-09 2009-10 2010-11 2011-12 2012-13Unreserved Fund Balance as a Percentage of Revenues 24.93% 24.92% 21.47% 22.17% 23.16%Minimum Targeted Unreserved Fund Balance 24% 23% 22% 21% 20%Targeted Unreserved Fund Balance Range 26% 27% 28% 29% 30%
BUDGET-BALANCING WORKSHEETEffects of Potential Changes to the General Fund Budget
150,000,000
155,000,000
160,000,000
165,000,000
170,000,000
175,000,000
180,000,000
185,000,000
190,000,000
2008-09 2009-10 2010-11 2011-12 2012-13
Projected Revenues and Expenditures
Revenues
Expenditures
20%
22%
24%
26%
28%
30%
2008-09 2009-10 2010-11 2011-12 2012-13
Unreserved Fund Balance as a Percentage of Revenues
Targeted Unreserved Fund Balance Range Outside of Targeted Range Unreserved Fund Balance as a Percentage of Revenues

Number of Positions Eliminated
Amounts entered represent the number of full-time positions to be eliminated during the first and/or last halves of each fiscal year. The calculations include the elimination of all pay and benefits for full-time, permanent positions, and assume that positions will be eliminated evenly throughout the six-month periods to which they apply.
Recurring Savings from Changes to Payroll/Benefits Policies (annualized estimate)
Amounts entered represent reductions from budgeted expenditures for each fiscal year, which assume the continuation of all current payroll & benefits policies. Therefore, the amounts entered do not represent year-to-year reductions in pay and benefits, but reductions to the budgeted year-to-year increases . Since entries are annualized, any amount entered for 2008-09 will result in savings of half that amount in the last half of 2008-09 and full recurring savings in subsequent years. Current General Fund salaries and benefits total approximately $150 million. Therefore a $1 million reduction would represent approximately six-tenths of one percent of total General Fund Personal Service Costs.
Reductions of PT positions, contracted services and non-personnel costs
Costs related to part-time employees, contracted services and other non-personnel line-items account for approximately 20% of the GF budget. Therefore, a 5% reduction to these costs would represent a 1% reduction to the total General Fund appropriation. Every 1% entered in the Worksheet represents approximately $400,000 in recurring General Fund budget reductions. It is anticipated that the cuts would be made in departments where reductions occur; not "accross-the-board."
Recurring Revenue Increases (annualized estimate)
These entries represent increased revenues, resulting from policy changes to existing programs or new revenue-producing policies/programs. Projected increases in the volume of existing programs should not be entered here; those increases should be contained in the existing budget. Since entries are annualized, any amount entered for 2008-09 will result in revenue of half that amount in the last half of 2008-09 and full recurring savings in subsequent years.
Appropriations to Fund the OPEB Liability
If the "No" option is selected for un-reserving the OPEB reserve, the Worksheet applies the existing $10 million OPEB Reserve to the first $10 million budgeted expenditure for OPEB. Therefore, there is no impact to the General Fund for the first $10 million entered on the Worksheet. Conversely, budgeting less than $10 million for OPEB will not provide additional money to balance the budget, because unspent money will remain in the OPEB Reserve. If the "Yes" option is selected, the existing $10 million OPEB reserve is added to the unreserved/undesignated fund balance.
Information Needed to Adjust Variables in the Budget Balancing Worksheet


Project Prioritization -- expand the application of formal asset management plans focusing on maintenance and replacement of existing assets
Project Funding -- Develop stable and predictable capital funding streams
Sustainable Policies -- Stabilize taxpayers’ property tax bills and minimize the amount of taxpayer funds held in fund balances

Cummulative5-year Page # Project Name 2012-13 2013-14 2014-15 2015-16 PHS AP Total
2,090,000 27 Fire Apparatus Replacement 590,000 500,000 500,000 500,000 - 2,090,000 5 4 9
47,499,380 21Town Lake Downstream Dam Replacement - 1,379,780 424,000 43,605,600 - 45,409,380 3 5 9 1
55,072,427 23City Regional Radio System Maintenance and Replacement 1,914,834 1,125,848 1,526,824 1,472,777 1,532,764 7,573,047 4 4 8
103,399,345 62Elliot, Guadalupe and Warner ITS Improvements** - - 164,286 - - 164,286 3 2 6 1.0
109,864,599 30 Fire Station 7 for Southeast Quadrant 60,000 1,396,000 5,009,254 - 6,465,254 4 1 5
110,164,599 36 Clark Park Swimming Pool Renovation - - - - 300,000 300,000 2 5 5 -2
110,974,599 38 Diablo Stadium Improvement - - 270,000 270,000 270,000 810,000 2 3 5
111,384,599 41 KRC Pool Renovation - - 410,000 - - 410,000 2 3 5
171,978,653 37 Development of ADOT Property - - - - 750,000 750,000 2 1 3
173,478,653 45 Rio Salado Athletic Field Development - - - - 1,500,000 1,500,000 2 1 3
174,368,653 40Kiwanis Recreation Center Energy Efficiency Improvements - - - - 890,000 890,000 1 2 3
174,508,653 51 Energy Conservation Program - 35,000 35,000 35,000 35,000 140,000 1 2 3
174,618,653 46Water Conservation - Park Improvement 110,000 - - - - 110,000 1 1 2
175,114,065 24 Intercept Project 495,412 - - - - 495,412 0 0 0
Total Request 12,858,750 25,305,547 29,748,534 65,154,716 42,046,518 175,114,065 2.63 3.05 5.77
2011-12 CIP G.O. Bond Funding Project Prioritization (for discussion)
Prioritization ScoresAdditional Projected Needs Total 5-Year Program O
pera
ting
Impa
ct
Pub
lic O
pini
on
Gra
nt F
undi
ng
Leg
al/c
ontr
actu
al
RO
I
2011-12 Requested Program

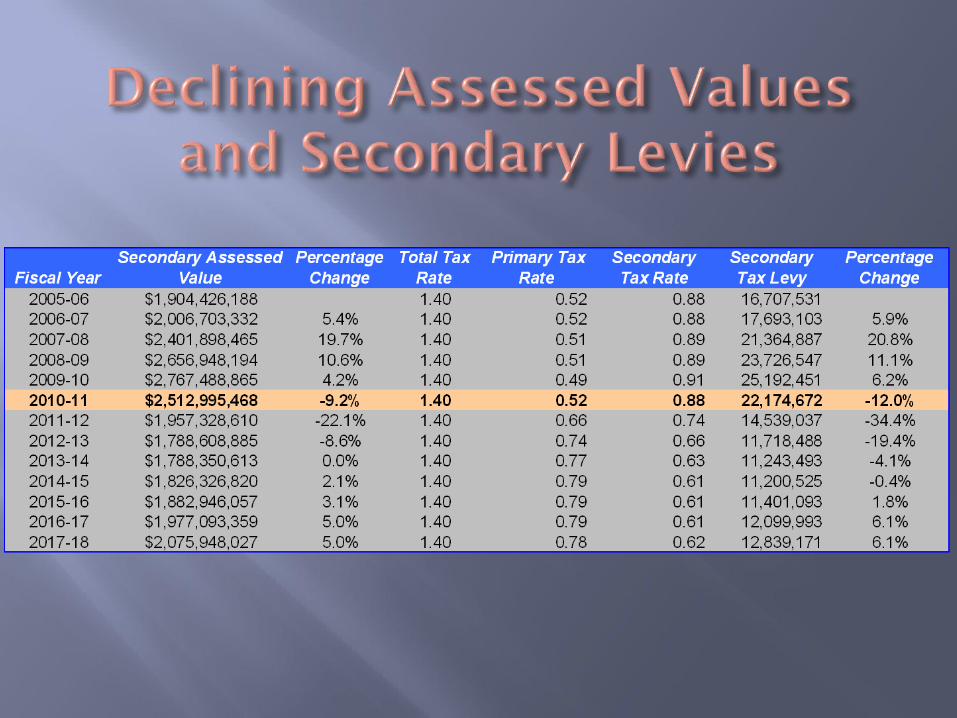
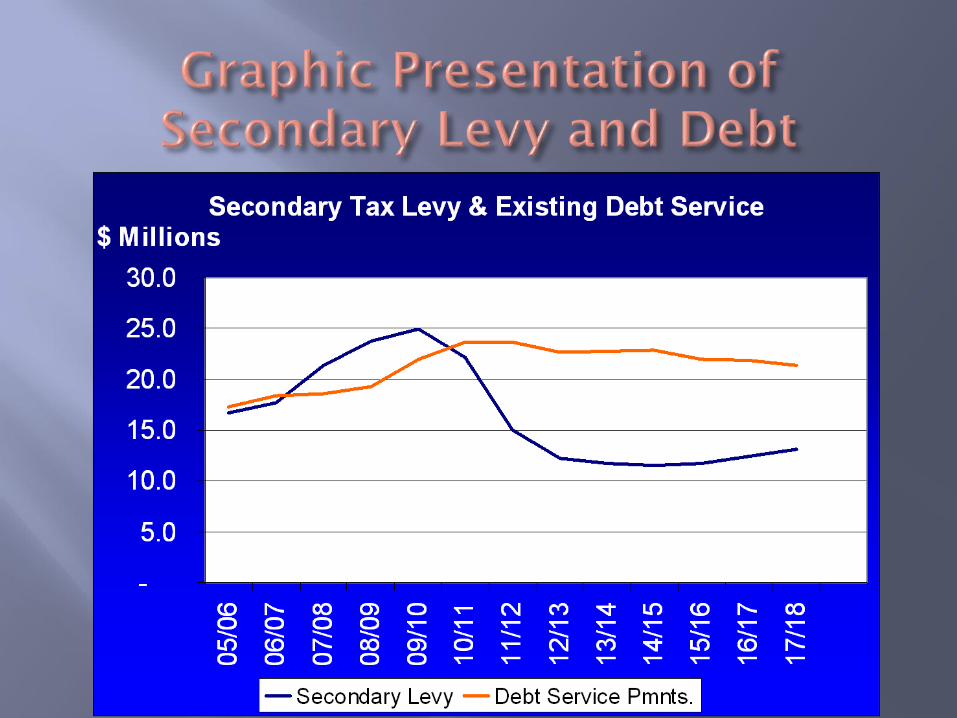

Primary levy on existing properties is limited by statutory 2% annual increases
Secondary levy on existing properties will increase by Western States CPI, not to exceed 3.3% annually
Debt Service Fund balance will be maintained between 4% and 8% of tax-supported debt throughout the 20-year forecast
The tax impact of new projects will be provided during the annual CIP process