Embed Size (px)
Citation preview
Send your completed paper to Sandy Rutter at [email protected] by 13 April 2007 to be included in the ASABE Online Technical Library.
If you can't use this Word document and you'd like a PDF cover sheet please contact Sandy.
Please have Word's AutoFormat features turned OFF and do not include live hyperlinks. Your paper should be no longer than 12 pages. For general information on writing style, please see http://www.asabe.org/pubs/authguide.html.
This page is for online indexing purposes and should not be included in your printed version.
Author(s)
First Name Middle Name Surname Role Email
Mirwan Ushada Graduate Student, ASABE Member No: 1027757
Affiliation
Organization Address Country
Osaka Prefecture University, Graduate School of Life and Environmental Sciences, Department of Applied Life Sciences, Laboratory of Bioinstrumentation, Control and Systems (BICS) Engineering
1-1, Gakuen-cho, Naka-ku, Sakai Japan ZIP 599-8531
Japan
Author(s) – repeat Author and Affiliation boxes as needed--
First Name Middle Name Surname Role Email
Haruhiko Murase Professor, ASABE Member No: 9349
The authors are solely responsible for the content of this technical presentation. The technical presentation does not necessarily reflect the official position of the American Society of Agricultural and Biological Engineers (ASABE), and its printing and distribution does not constitute an endorsement of views which may be expressed. Technical presentations are not subject to the formal peer review process by ASABE editorial committees; therefore, they are not to be presented as refereed publications. Citation of this work should state that it is from an ASABE meeting paper. EXAMPLE: Author's Last Name, Initials. 2007. Title of Presentation. ASABE Paper No. 07xxxx. St. Joseph, Mich.: ASABE. For information about securing permission to reprint or reproduce a technical presentation, please contact ASABE at [email protected] or 269-429-0300 (2950 Niles Road, St. Joseph, MI 49085-9659 USA).
Affiliation
Organization Address Country
Osaka Prefecture University, Graduate School of Life and Environmental Sciences, Department of Applied Life Sciences, Laboratory of Bioinstrumentation, Control and Systems (BICS) Engineering
1-1, Gakuen-cho, Naka-ku, Sakai Japan ZIP 599-8531
Japan
Publication Information
Pub ID Pub Date
073104 2007 ASABE Annual Meeting Paper
The authors are solely responsible for the content of this technical presentation. The technical presentation does not necessarily reflect the official position of the American Society of Agricultural and Biological Engineers (ASABE), and its printing and distribution does not constitute an endorsement of views which may be expressed. Technical presentations are not subject to the formal peer review process by ASABE editorial committees; therefore, they are not to be presented as refereed publications. Citation of this work should state that it is from an ASABE meeting paper. EXAMPLE: Author's Last Name, Initials. 2007. Title of Presentation. ASABE Paper No. 07xxxx. St. Joseph, Mich.: ASABE. For information about securing permission to reprint or reproduce a technical presentation, please contact ASABE at [email protected] or 269-429-0300 (2950 Niles Road, St. Joseph, MI 49085-9659 USA).
An ASABE Meeting Presentation
Paper Number: 073104
Development of an Intelligent Quality Control Model Based on Speaking Plant Approach and Kansei
Information for Moss Greening Product
Mirwan Ushada, Graduate Student, ASABE MemberOsaka Prefecture University, Graduate School of Life and Environmental Sciences, Department of Applied Life Sciences, Laboratory of Bioinstrumentation, Control and System (BICS) Engineering, 1-1 Gakuen-cho Naka-ku, Sakai Japan ZIP 599-8531, [email protected]
Haruhiko Murase, Professor, ASABE MemberOsaka Prefecture University, Graduate School of Life and Environmental Sciences, Department of Applied Life Sciences, Laboratory of Bioinstrumentation, Control and System (BICS) Engineering, 1-1 Gakuen-cho Naka-ku, Sakai Japan ZIP 599-8531, [email protected]
Written for presentation at the2007 ASABE Annual International Meeting
Sponsored by ASABEMinneapolis Convention Center
Minneapolis, Minnesota17 - 20 June 2007
Abstract. In this study, sub-systems of intelligent quality control based on speaking plant approach and kansei information were proposed. It consists of quality and quantity (growth) model. It utilizes Artificial Neural Network (ANN), plant response, kansei index and texture analysis. The first ANN model for quality is proposed to define the relationship between textural features and kansei index. Kansei index is measured using visual appearances as the representation of plant factory owner. The target point of the model is customer of moss product. The second ANN model for growth is proposed to define the relationship among plant response, textural features and temperature. Plant response is measured by using wet weight. The target point of the model is plant factory parameter.
Four cycles of re-watering treatment were done based on two different local environments inside the same optimum environmental set point (global). Temperature of 100C and RH of 75% was
The authors are solely responsible for the content of this technical presentation. The technical presentation does not necessarily reflect the official position of the American Society of Agricultural and Biological Engineers (ASABE), and its printing and distribution does not constitute an endorsement of views which may be expressed. Technical presentations are not subject to the formal peer review process by ASABE editorial committees; therefore, they are not to be presented as refereed publications. Citation of this work should state that it is from an ASABE meeting paper. EXAMPLE: Author's Last Name, Initials. 2007. Title of Presentation. ASABE Paper No. 07xxxx. St. Joseph, Mich.: ASABE. For information about securing permission to reprint or reproduce a technical presentation, please contact ASABE at [email protected] or 269-429-0300 (2950 Niles Road, St. Joseph, MI 49085-9659 USA).
considered as the optimum environment for the moss. The textural features have shown the various pattern compared with the changes of wet weight. It shows the difference pattern with our previous research (Ushada et al., 2006a) due to occurrence of growth.
The research result shows that texture analysis is possible to be used as pattern recognition tool not only for quality but also for growth model. The first ANN model with satisfied inspection error can be used to predict the customer preferences while the second ANN model with satisfied inspection error can be used to predict the optimum local temperature.
Keywords. Artificial neural network, Kansei index, Local environment, Textural features, Wet weight
(The ASABE disclaimer is on a footer on this page, and will show in Print Preview or Page Layout view.)
The authors are solely responsible for the content of this technical presentation. The technical presentation does not necessarily reflect the official position of the American Society of Agricultural and Biological Engineers (ASABE), and its printing and distribution does not constitute an endorsement of views which may be expressed. Technical presentations are not subject to the formal peer review process by ASABE editorial committees; therefore, they are not to be presented as refereed publications. Citation of this work should state that it is from an ASABE meeting paper. EXAMPLE: Author's Last Name, Initials. 2007. Title of Presentation. ASABE Paper No. 07xxxx. St. Joseph, Mich.: ASABE. For information about securing permission to reprint or reproduce a technical presentation, please contact ASABE at [email protected] or 269-429-0300 (2950 Niles Road, St. Joseph, MI 49085-9659 USA).
IntroductionRecently in Japan, mass bio-production of moss plant has been expected because of the huge demand of roof top and wall greening for buildings. It has a function to ease the urban heat island effect. In order to fulfill the customer demand on quantity and quality, Murase (2004) has developed a new technology which grows the cultured moss in one to two months compared to the three years in natural growth. It has been produced from plant factory.
Increasing consumer wealth comes with increasing consumer demand for better quality agricultural products. In order to yield better quality plants for this market, advanced control techniques is needed (Hashimoto et al., 2006). Hashimoto et al. (1985) has highlighted the control system named as Speaking Plant Approach (SPA) based on physiological responses to determine the physiological status, and then use the information for environmental control for optimization.
In other side, Ujita and Murase (2006) have highlighted the importance of Profile of Mood Status (POMS) to attract the customer to buy a product from psychological aspect. Agricultural industry such as plant factory has realized the importance to understanding customer preferences and incorporates them into production system. When asked to describe preferences from greening material product, costumer will frequently include a mixture of functional features and descriptions relating to how the design appeals to them on a more subjective emotional level (for example, eye catching, free maintenance and physiological status). Ushada et al. (2006b) has highlighted the possibility to detect the water status using visual appearance as representation of plant factory owner. The methods which were performed by Ujita and Murase (2006) and Ushada et al. (2006b) can be categorized as Kansei engineering. It is a technique aimed at translating subjective requirements in to design features and incorporating preferences into the product design process.
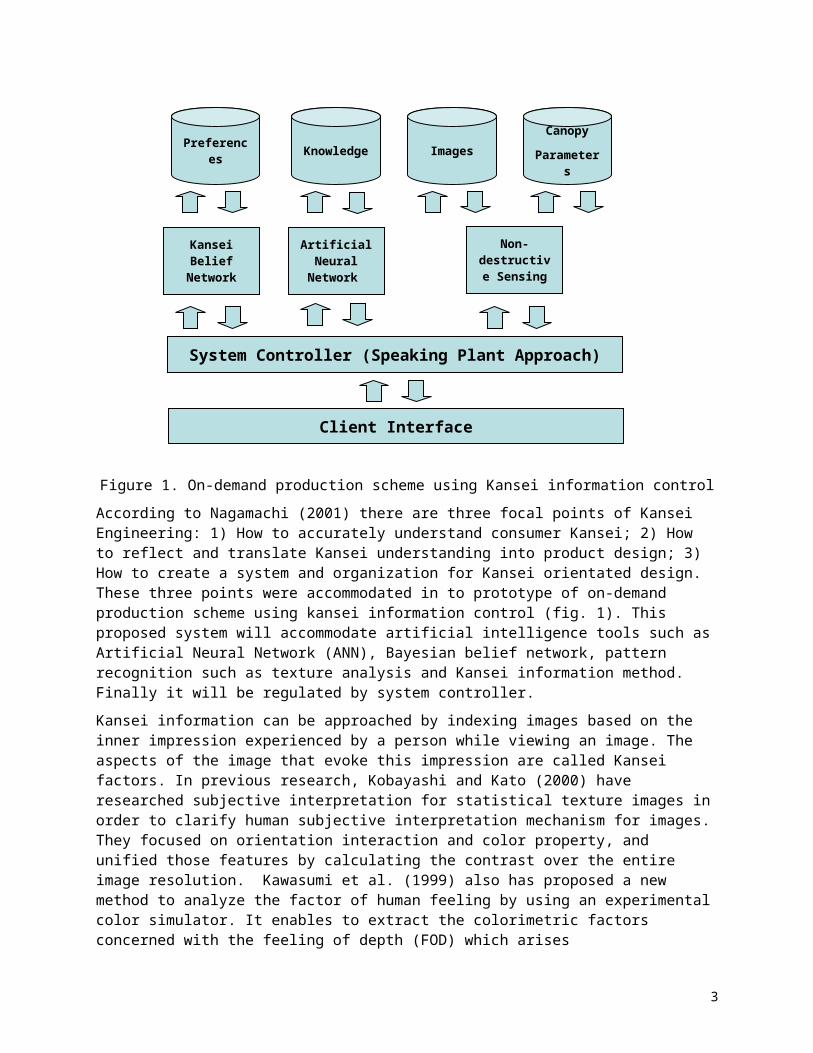
Figure 1. On-demand production scheme using Kansei information control
2
Preferences ImagesKnowledgeCanopy
Parameters
Kansei Belief Network
Artificial Neural
Network
System Controller (Speaking Plant Approach)
Client Interface
Non-destructive
Sensing
According to Nagamachi (2001) there are three focal points of Kansei Engineering: 1) How to accurately understand consumer Kansei; 2) How to reflect and translate Kansei understanding into product design; 3) How to create a system and organization for Kansei orientated design. These three points were accommodated in to prototype of on-demand production scheme using kansei information control (fig. 1). This proposed system will accommodate artificial intelligence tools such as Artificial Neural Network (ANN), Bayesian belief network, pattern recognition such as texture analysis and Kansei information method. Finally it will be regulated by system controller.
Kansei information can be approached by indexing images based on the inner impression experienced by a person while viewing an image. The aspects of the image that evoke this impression are called Kansei factors. In previous research, Kobayashi and Kato (2000) have researched subjective interpretation for statistical texture images in order to clarify human subjective interpretation mechanism for images. They focused on orientation interaction and color property, and unified those features by calculating the contrast over the entire image resolution. Kawasumi et al. (1999) also has proposed a new method to analyze the factor of human feeling by using an experimental color simulator. It enables to extract the colorimetric factors concerned with the feeling of depth (FOD) which arises psychophysically when we look into a painted automobile panel. In this study, kansei information was approached using the kansei index combining visual appearances and textural features.
System controller of fig.1 can be approached by using SPA. Ushada et al. (2007) has developed the first two sub-systems of Intelligent Quality Control (IQC) for SPA covering non-destructive sensing and its inverse model using texture analysis and artificial neural network.
In this study, the second two sub-systems of IQC based on speaking plant approach and kansei information were proposed. It consists of quality and quantity (growth) model. It utilizes ANN, plant response, kansei index and texture analysis. The first ANN model for quality is proposed to define the relationship between textural features and kansei index by extracting the information from the both models for canopy parameters in Ushada et al. (2007). Kansei index is measured using visual appearances as the representation of plant factory owner. The target point of the model is customer of moss product. The second ANN model for growth is proposed to define the relationship among plant response, textural features and temperature. Plant response is measured by using wet weight. The target point of the model is plant factory parameter. The purpose of our study is to construct a prototype of on-demand production system using kansei information control. The specific objective is to identify the relationship between plant response and textural features on the different environment.
Materials and Methods
Greening material
Set samples of high density and immature colony-based type of cultured sunagoke moss (Rhacomitrium canescens) used in roof top greening were monitored in growth chamber, Biotron NK-50. The moss was placed in plastic case anti static. The optimum growth chamber set point of temperature of 100C-relative humidity of 75% was identified. Two different locations inside growth chamber which has different local temperature of 140C and 15.90C were used.
Kansei indexing factors
The focus of kansei indexing methods is on the viewer, rather than on the image, and similarity measures derived from kansei indexing represent similarities in inner experience, rather than
3
visual similarity. It is now widely acknowledged that image contain multiple levels of visual content. For example, luminance, and color are regarded as low-level content, and physical objects are regarded as high level content, while textures and patterns are often regarded as mid-level content (Black et al., 2004).
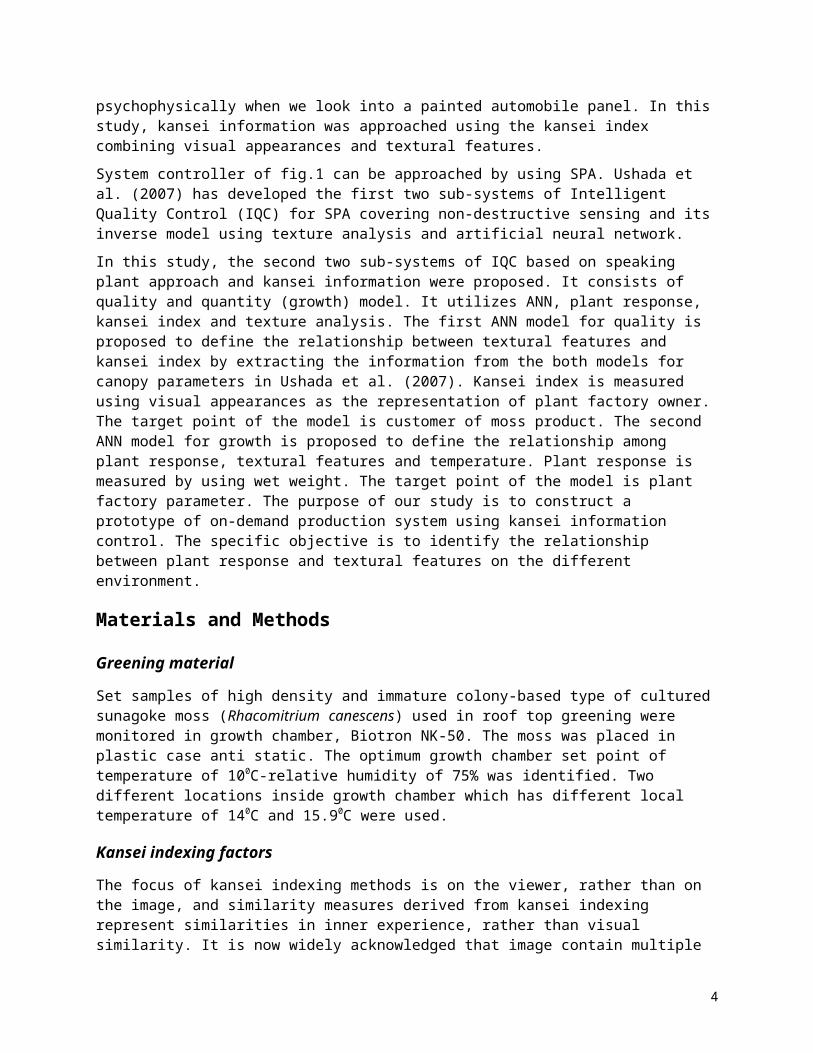
In this paper while watching images of moss canopy, the writer was assumed as a representation of plant factory to evaluate comprehensively each canopy considering 4 (four) levels (Soak, Wet, Semi-Dry and Dry) using 1 (one) visual information that is canopy appearance based on texture analysis.
The classification scale is usually consisting of discrete values of assessment such as excellent, very good, good, bad, very bad, high quality, medium, low quality and dry. As shown in Table 1, in the textural classification, the class is varied from soak, wet, semi-dry and dry status. The requirement on these statuses is based on the water status response to the environment in speaking plant approach method. The class will be one of parameters whether the environment is fit to the growth of moss. The class is indexed in to the value between 0 and 1 in order to fit the sigmoid function of the proposed ANN
Table 1 Classification on water status of moss
No Status Scale
1 Soak 1
2 Wet 0.75
3 Semi-Dry 0.25
4 Dry 0
Texture analysis
The co-occurrence matrix or known as grey tone spatial dependence matrix is a second order image variation. It can provide a basis for a number of textural features of image (Haralick et al., 1973; Murase et al., 1994).
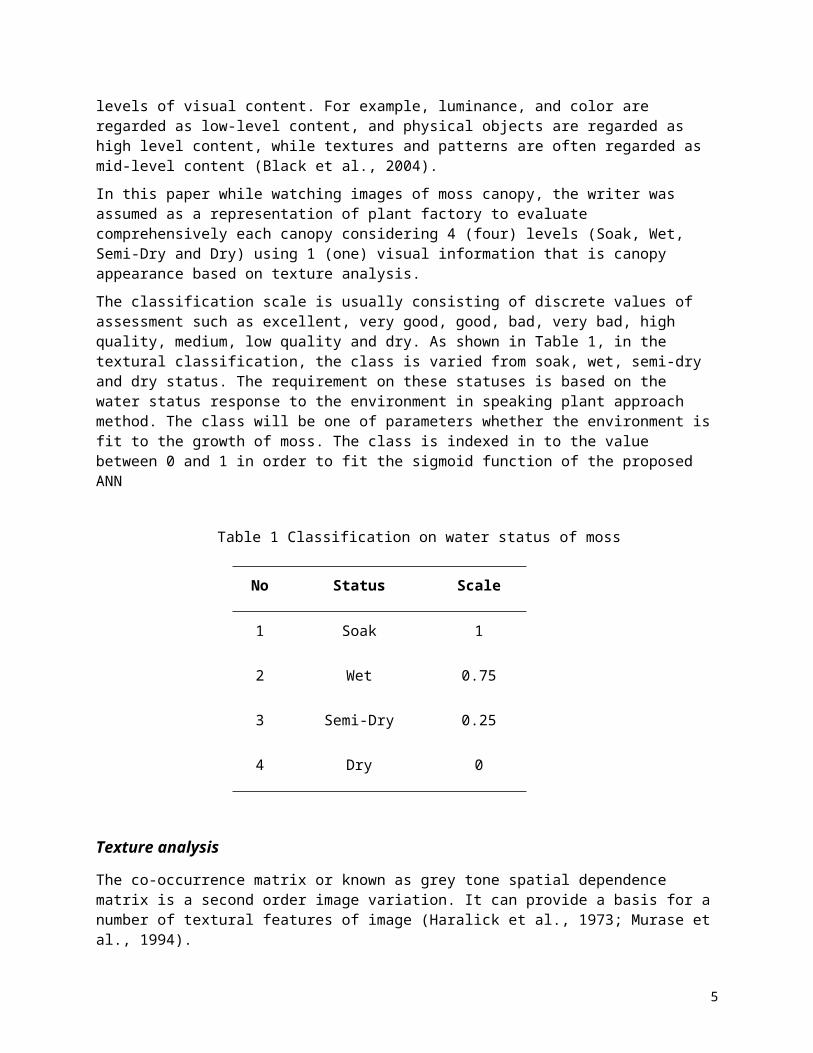
The following textural features are the most critical to plant growth indices (Murase, et al., 1997):
(a) Energy:
(1)
4
(b) Contrast:
(2)
(c) Local Homogeneity (LH):
(3)
where :
d = distance between two neighbouring resolution cells
q = angle between two neighbouring cells
P(1,0)(i,j) = joint probability density function at d = 1 and q =0
i, j = notation for grey tone
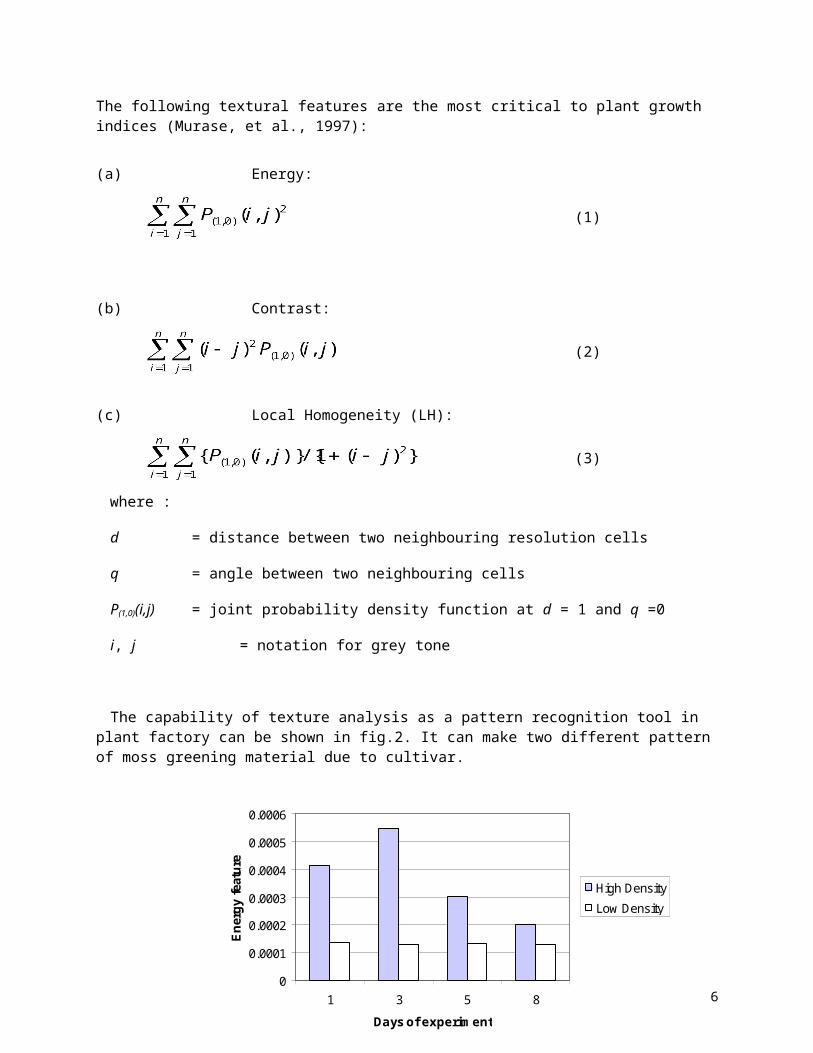
The capability of texture analysis as a pattern recognition tool in plant factory can be shown in fig.2. It can make two different pattern of moss greening material due to cultivar.
Figure 2. Detecting different cultivar using textural features
5
0
0.0001
0.0002
0.0003
0.0004
0.0005
0.0006
1 3 5 8
Days of experiment
Ener
gy fe
atur
e
High Density
Low Density
Results and Discussion
Quality model
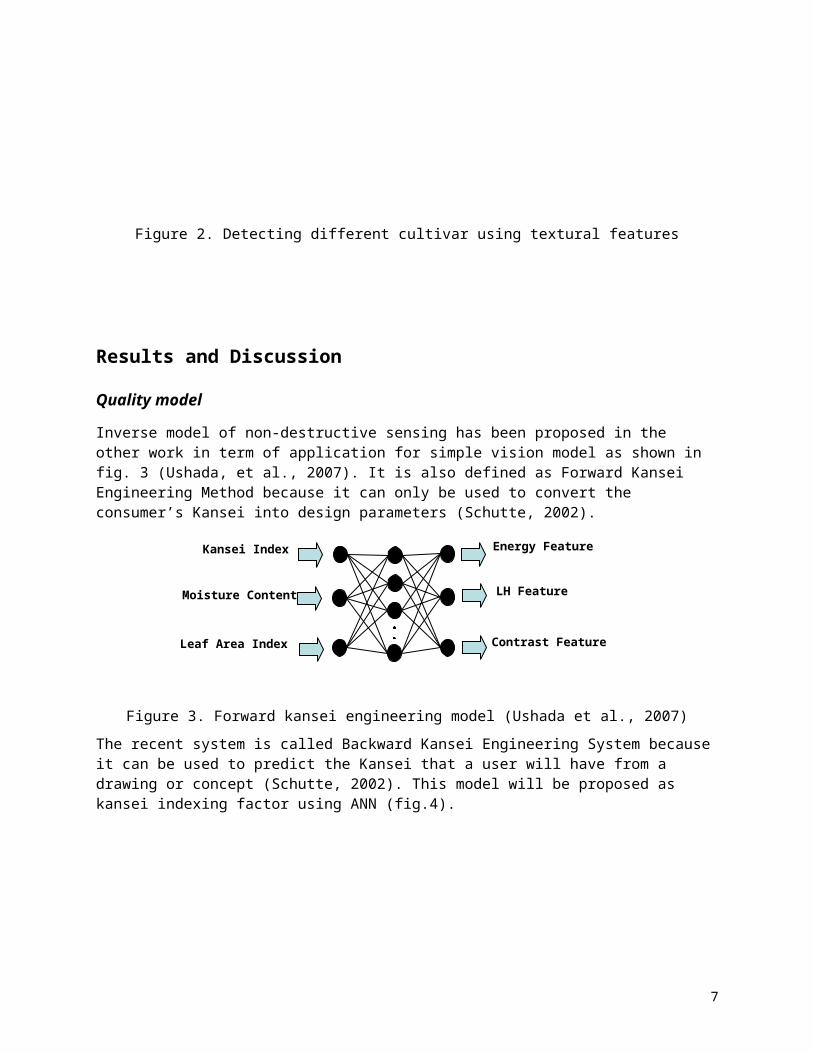
Inverse model of non-destructive sensing has been proposed in the other work in term of application for simple vision model as shown in fig. 3 (Ushada, et al., 2007). It is also defined as Forward Kansei Engineering Method because it can only be used to convert the consumer’s Kansei into design parameters (Schutte, 2002).
Figure 3. Forward kansei engineering model (Ushada et al., 2007)
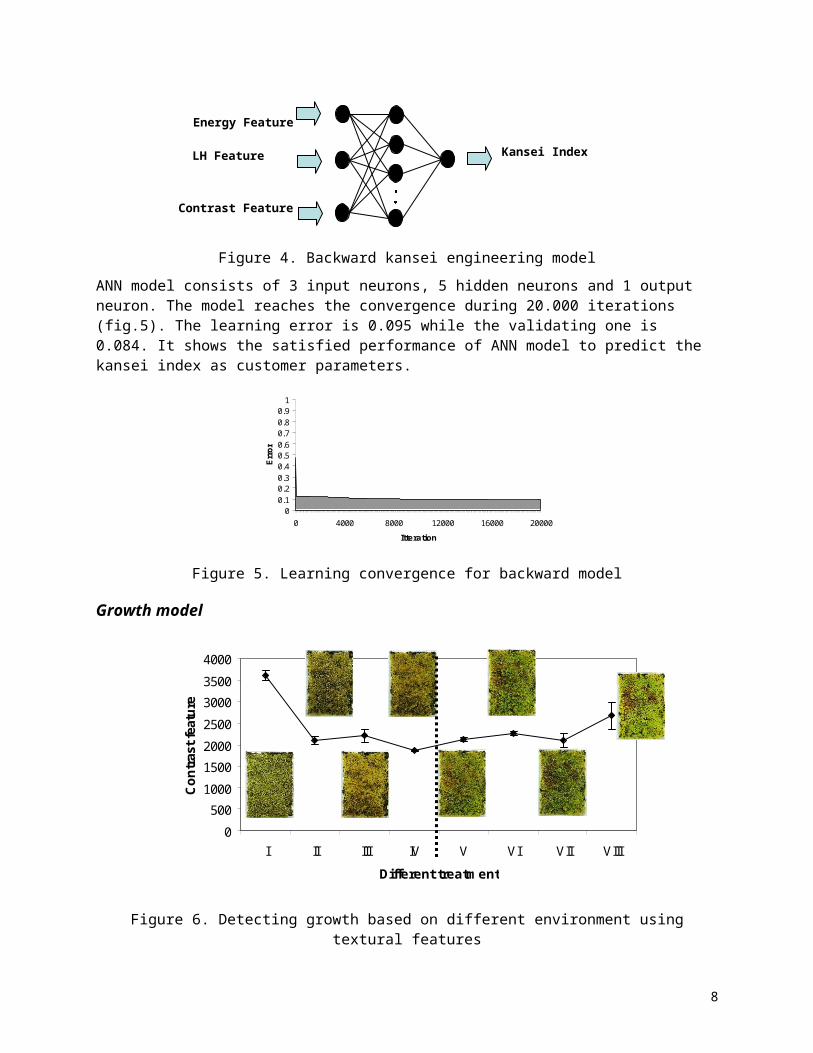
The recent system is called Backward Kansei Engineering System because it can be used to predict the Kansei that a user will have from a drawing or concept (Schutte, 2002). This model will be proposed as kansei indexing factor using ANN (fig.4).
Figure 4. Backward kansei engineering model
ANN model consists of 3 input neurons, 5 hidden neurons and 1 output neuron. The model reaches the convergence during 20.000 iterations (fig.5). The learning error is 0.095 while the validating one is 0.084. It shows the satisfied performance of ANN model to predict the kansei index as customer parameters.
00.10.20.30.40.50.60.70.80.9
1
0 4000 8000 12000 16000 20000
Itteration
Erro
r
Figure 5. Learning convergence for backward model
6
Energy Feature
LH Feature
Contrast Feature
Kansei Index
Moisture Content
Leaf Area Index
LH Feature
Contrast Feature
Kansei Index
Energy Feature
Growth model
0
5001000
1500
2000
2500
30003500
4000
I II III IV V VI VII VIII
Different treatment
Cont
rast
feat
ure
Figure 6. Detecting growth based on different environment using textural features
Notes:
I = Raw material V = Recovery I
II = Wilting I VI = Recovery II
III = Wilting II VII = Recovery III
IV = Wilting III VIII = Recovery IV
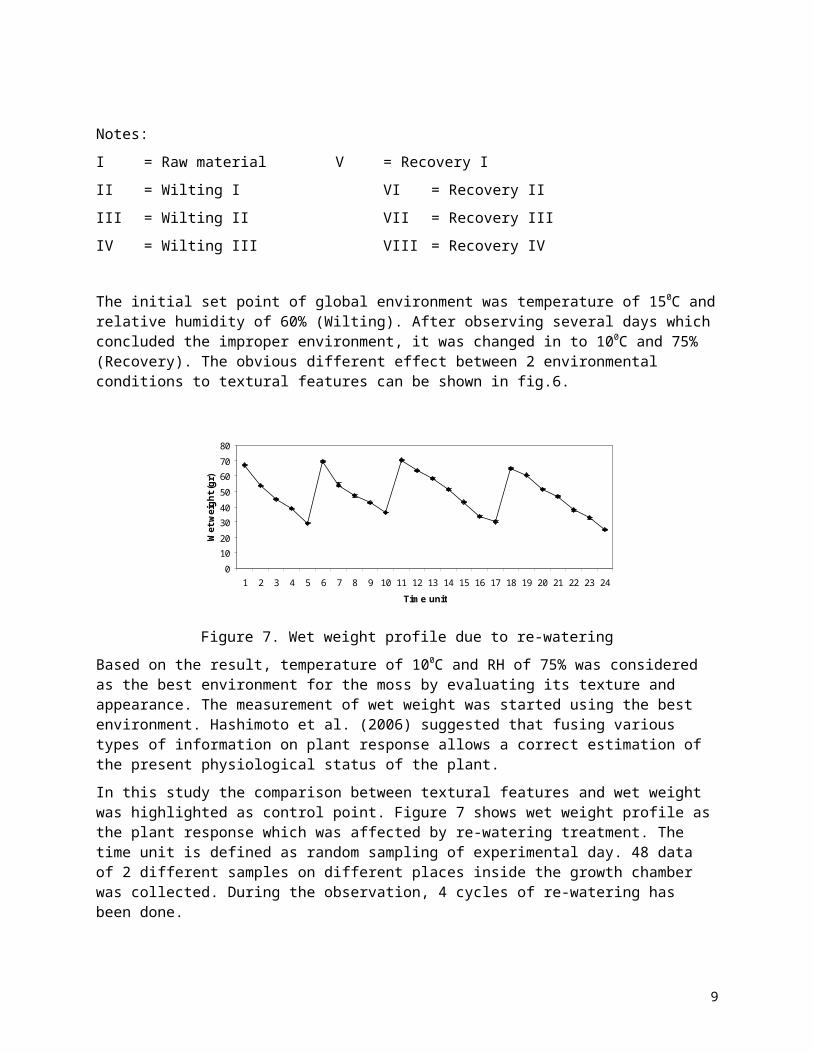
The initial set point of global environment was temperature of 150C and relative humidity of 60% (Wilting). After observing several days which concluded the improper environment, it was changed in to 100C and 75% (Recovery). The obvious different effect between 2 environmental conditions to textural features can be shown in fig.6.
0
10
20
30
40
50
6070
80
1 2 3 4 5 6 7 8 9 10 11 12 13 14 15 16 17 18 19 20 21 22 23 24
Time unit
Wet
wei
ght (
gr)
Figure 7. Wet weight profile due to re-watering
7
Based on the result, temperature of 100C and RH of 75% was considered as the best environment for the moss by evaluating its texture and appearance. The measurement of wet weight was started using the best environment. Hashimoto et al. (2006) suggested that fusing various types of information on plant response allows a correct estimation of the present physiological status of the plant.
In this study the comparison between textural features and wet weight was highlighted as control point. Figure 7 shows wet weight profile as the plant response which was affected by re-watering treatment. The time unit is defined as random sampling of experimental day. 48 data of 2 different samples on different places inside the growth chamber was collected. During the observation, 4 cycles of re-watering has been done.
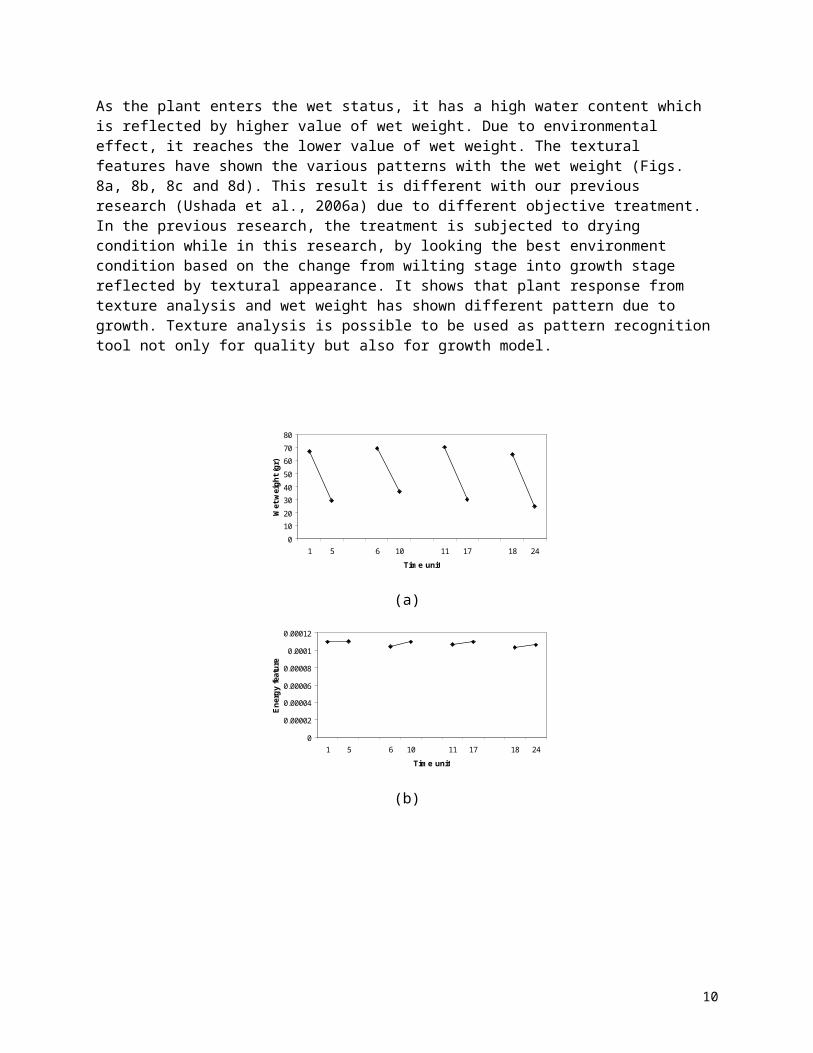
As the plant enters the wet status, it has a high water content which is reflected by higher value of wet weight. Due to environmental effect, it reaches the lower value of wet weight. The textural features have shown the various patterns with the wet weight (Figs. 8a, 8b, 8c and 8d). This result is different with our previous research (Ushada et al., 2006a) due to different objective treatment. In the previous research, the treatment is subjected to drying condition while in this research, by looking the best environment condition based on the change from wilting stage into growth stage reflected by textural appearance. It shows that plant response from texture analysis and wet weight has shown different pattern due to growth. Texture analysis is possible to be used as pattern recognition tool not only for quality but also for growth model.
0
10
20
30
40
50
60
70
80
1 5 6 10 11 17 18 24
Time unit
Wet
wei
ght (
gr)
(a)
0
0.00002
0.00004
0.00006
0.00008
0.0001
0.00012
1 5 6 10 11 17 18 24
Time unit
Ener
gy fe
atur
e
(b)
8
00.0050.01
0.0150.02
0.0250.03
0.0350.04
0.045
1 5 6 10 11 17 18 24
Time unit
LH fe
atur
e(c)
0
500
1000
1500
2000
2500
3000
1 5 6 10 11 17 18 24
Time unit
Cont
rast
feat
ure
(d)
Figure 8. Comparison of parameters control point: (a) Wet weight in gram; (b) Energy feature; (c) LH feature; (d) Contrast feature
After observing the changes of textural features and wet weight based on the different temperature of local environment, the data was ready to be modeled in ANN. The inputs were wet weight, energy, LH and contrast feature. The output is temperature. Figure 9 show the ANN model. It is trained using architecture of feed-forward and back-propagation learning algorithm.
Figure 9. ANN model for growth environment
ANN model consists of 4 input neurons, 6 hidden neurons and 1 output neuron. The model reaches the convergence during 20.000 iterations (fig.10). The learning error is 0.073 while the validating one is 0.057. It shows the satisfied performance of ANN model to predict the different local environment temperature as factory parameters.
9
Wet weight
Energy Feature
LH Feature
Contrast Feature
Temperature
00.10.20.30.40.50.60.70.80.9
1
0 4000 8000 12000 16000 20000
Iterations
Erro
r
Figure 10. Learning convergence for growth model
ConclusionTwo sub-systems of Intelligent Quality Control using speaking plant approach and kansei information have been built covering quality and growth model. It utilizes texture analysis, ANN, kansei index and plant responses. The first ANN model for quality can define the relationship between textural features and kansei index with satisfied inspection error. The second ANN model for growth can define the relationship among plant response, textural features and temperature with satisfied inspection error.
The textural features have shown the various pattern compared with the changes of wet weight. This result is different with our previous research (Ushada et al., 2006a) due to occurrence of growth. In the previous research, the treatment is subjected to drying condition while in this study; two different environmental conditions reflected the change from wilting stage into growth stage reflected by textural appearance.
Based on the result, temperature of 100C and RH of 75% was considered the best environment for the moss by evaluating its texture and appearance. Texture analysis is possible to be used as pattern recognition tool not only for quality but also for growth model. The first ANN model can be used to predict the customer preferences using texture analysis and kansei index. The second ANN model can be used to predict the optimum local temperature inside the same initial environmental set point.
Acknowledgements
Mirwan Ushada would like to thank to Hitachi Scholarship Foundation Japan for supporting and funding Doctoral degree program in Osaka Prefecture University and on the same line to Gadjah Mada University, Indonesia, Faculty of Agricultural Technology, and Department of Agroindustrial Engineering for giving an opportunity to continue study.
ReferencesBlack, J. A., K. Kahol, P. Tripathi, P. Kuchi and S. Panchanathan. 2004. Indexing natural images
for retrieval based on Kansei factors. Proceedings-SPIE the International Society for Optical Engineering.
Haralick, R. M., I. Dinstein and K. Shanmugam. 1973. Textural features for image classification, IEEE Trans. On Syst., Man, and Cybernetics. SMC 3(6): 610-621.
10
Hashimoto, Y., T. Morimoto, and J. D. Baerdemaeker. 2006. Speaking plant/speaking fruit approaches. In CIGR Handbook of Agricultural Engineering Volume VI Information Technology. (Eds by A. Munack). 244-259 of Chapter 5 Precision Agriculture. St. Joseph, Michigan, USA: ASABE.
Hashimoto, Y., T. Morimoto and T. Fukuyama. 1985. Some speaking plant approach to the synthesis of control system in the greenhouse, Acta Hort. 174:219-226.
Kawasumi, M, H. Tsuji, Y. Uchiyama and T. Ishihara. 1999. Analysis of colorimetric factors related to “feeling of depth” of painted automobile panels by using color simulator. IEEE International Conference on Systems, Man and Cybernetics Vol 2.
Kobayashi, Y. and T. Kato. 2000. Multi contrast based texture model for understanding human subjectivity. 15th International conference of pattern recognition. ICPR.
Murase, H. 2004. An active greening technology using moss. The Japan Times Article on March 2000.
Murase, H., Y. Nishiura and N. Honami. 1994. Textural features/neural network for plant growth monitoring. ASAE Paper. No. 944016. St. Joseph, Mich: ASABE.
Murase, H., A. Tani, Y. Nishiura and M. Kiyota. 1997. Growth monitoring of green vegetables cultured in a centrifuge phytotron. In Plant Production in Closed Ecosystems (Eds by E. Goto, K. Kurata, M. Hayashi and S. Sase). 305-319. Netherlands: Kluwer Academic Publishers.
Nagamachi, M. 2001. Workshop 2 on kansei engineering. International Conference on Affective Human Design. Singapore.
Schutte, S. 2002. Designing feeling in to products (Integrating kansei engineering methodology in product development). Linkoping Studies in Science and Technology. Thesis No: 946.
Ujita, Y. and H. Murase. 2006. Profile of mood status (POMS) software for application of baum test characteristics. In the proceeding of 3rd International Symposium on Machinery and Mechatronics for Agriculture and Biosystems Engineering (ISMAB) 2006.
Ushada, M, H. Murase and H. Fukuda. 2006a. Non-destructive method for measuring water status using texture analysis and artificial neural network. ASABE Paper No. 061109. St. Joseph. Mich: ASABE.
Ushada, M., H. Murase and H. Fukuda. 2006b. Development of intelligent diagnostic for moss quality in plant factory. 2006 World Congress Paper No. 440119580849 (Grantee of Armand Blanc Prize). Bonn. Germany: CIGR.
Ushada, M., H. Murase and H. Fukuda. 2007. Non-destructive sensing and its inverse model for canopy parameters using texture analysis and artificial neural network. Comput. Electron. Agric. In Press.
11