Embed Size (px)
Citation preview

Paper CS-053
SAS® Add in to MS Office – A Tutorial Angela Hall, Zencos Consulting, Cary, NC
ABSTRACT Business folks use Excel and have no desire to learn SAS Enterprise Guide? MS PowerPoint presentations prevail in displaying charts and summarizing results? SAS® Add in to MS Office is a perfect fit for these scenarios. Users have the ability to open huge datasets in MS Excel and run SAS analytics via a simple interface. From PowerPoint, users can create charts and quickly update them in future meetings with new data.
INTRODUCTION The purpose of this paper is to provide examples of functionality from within SAS® Add in to MS Office in a manner that is easy to follow and replicate. SAS® Add in to MS Office provides the user a very familiar interface to experience the SAS Power to Know. This also provides SAS programmers another avenue to surface SAS Stored Processes to business users.
SYSTEM REQUIREMENTS The following examples require the use of SAS v9 BI or EBI Server. Clients also are required to download MS .Net Framework, SAS Add in to MS Office and utilize MS Office.
SETTING UP ACCESS TO THE SAS BI/EBI SERVER From the SAS Menu, Select Tools->Server Connections to set up a direct link to the Metadata Server. The three screen shots below detail this. Note: if the SAS BI/EBI plan file is setup correctly for client deployments, this step should be seamless.
Change Connections
Enter Machine Information
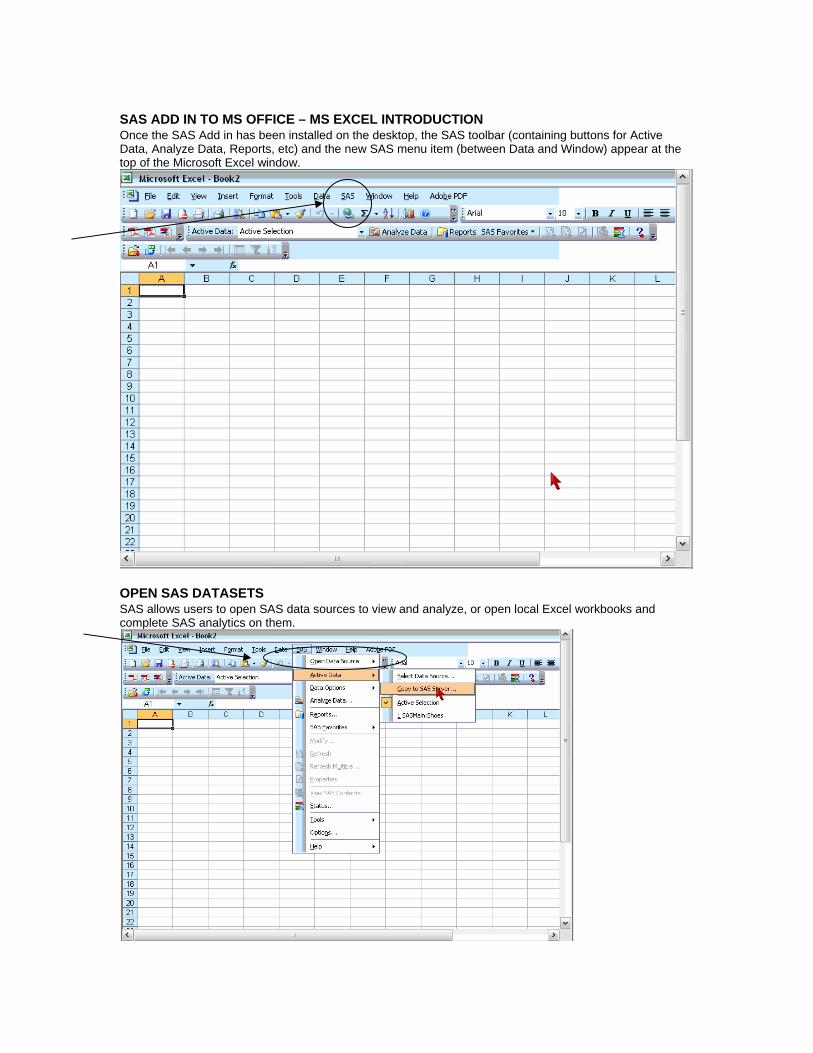
SAS ADD IN TO MS OFFICE – MS EXCEL INTRODUCTION Once the SAS Add in has been installed on the desktop, the SAS toolbar (containing buttons for Active Data, Analyze Data, Reports, etc) and the new SAS menu item (between Data and Window) appear at the top of the Microsoft Excel window.
OPEN SAS DATASETS SAS allows users to open SAS data sources to view and analyze, or open local Excel workbooks and complete SAS analytics on them.

DATA SOURCE OPTIONS When Selecting Data Sources either for use during the Analyze Data task or by selecting SAS->Open Data Source, you have the ability to click ‘Servers’ to connect to the available metadata repository, you can click ‘Information Maps’, you can open native SAS data sets or click ‘Excel’ to open active excel workbooks.

QUERYING DATA TABLES As an example, when you open the data source SASHELP.SHOES after choosing Analyze Data, the following screen will appear:
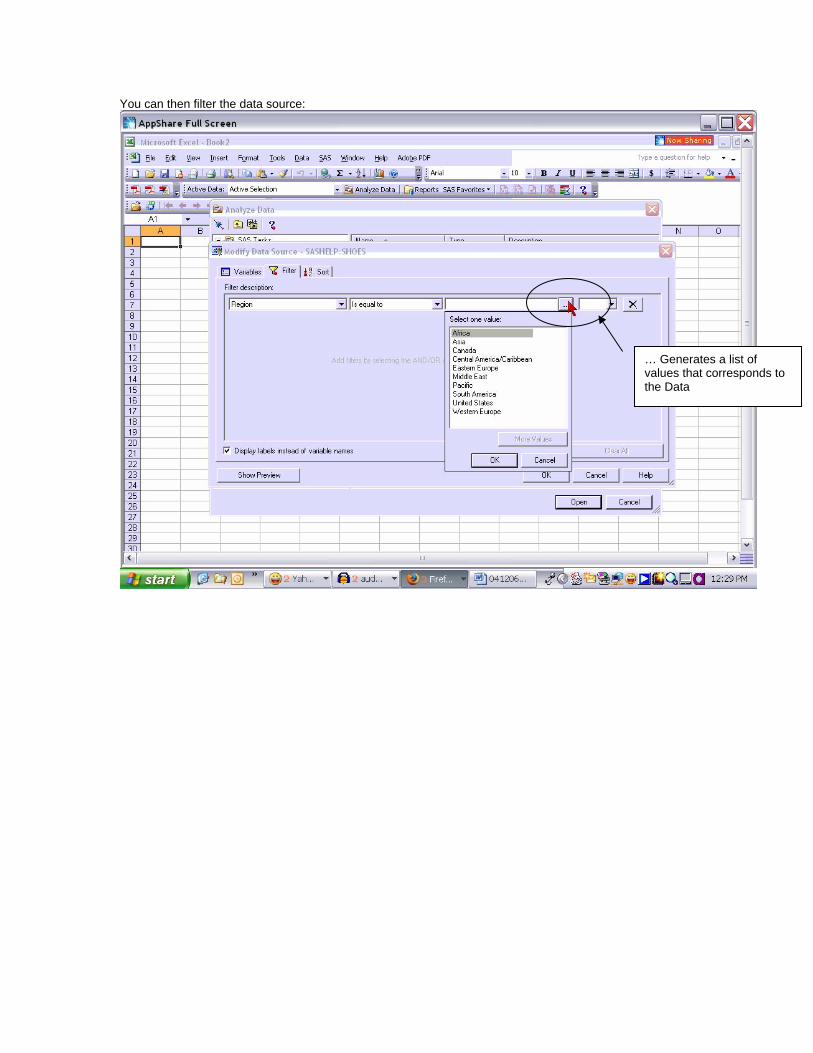
You can then filter the data source:
… Generates a list of values that corresponds to the Data
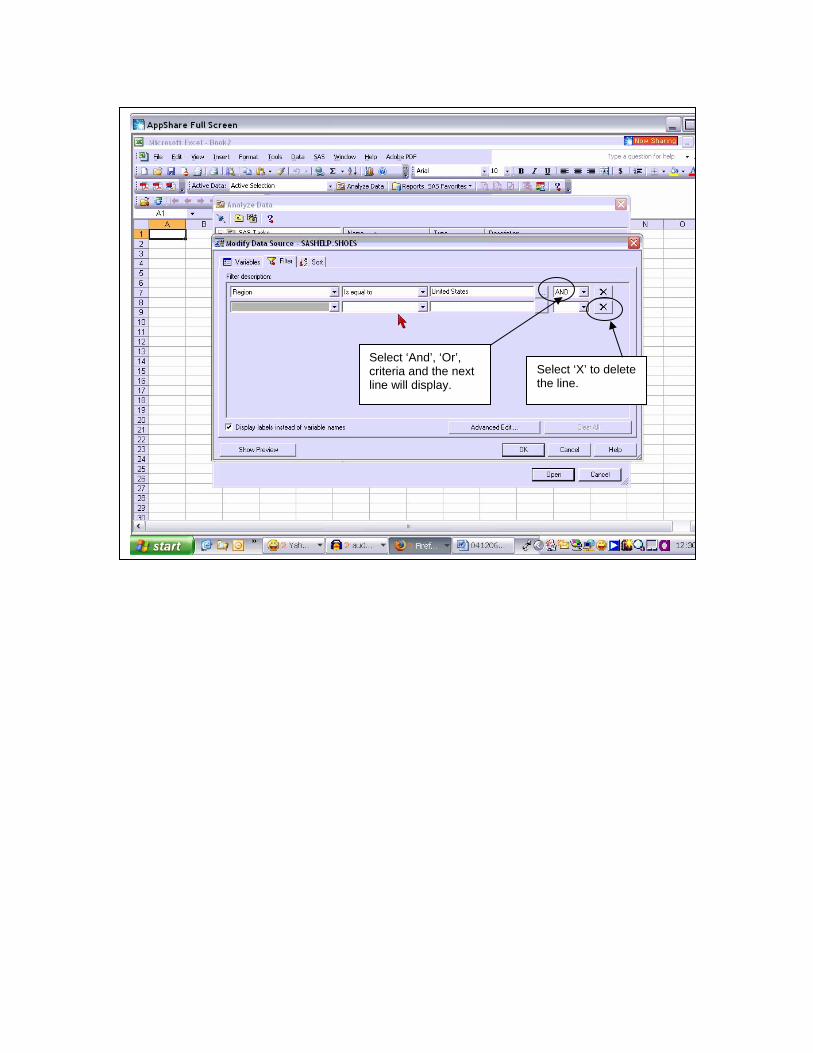
Select ‘And’, ‘Or’, criteria and the next line will display.
Select ‘X’ to delete the line.
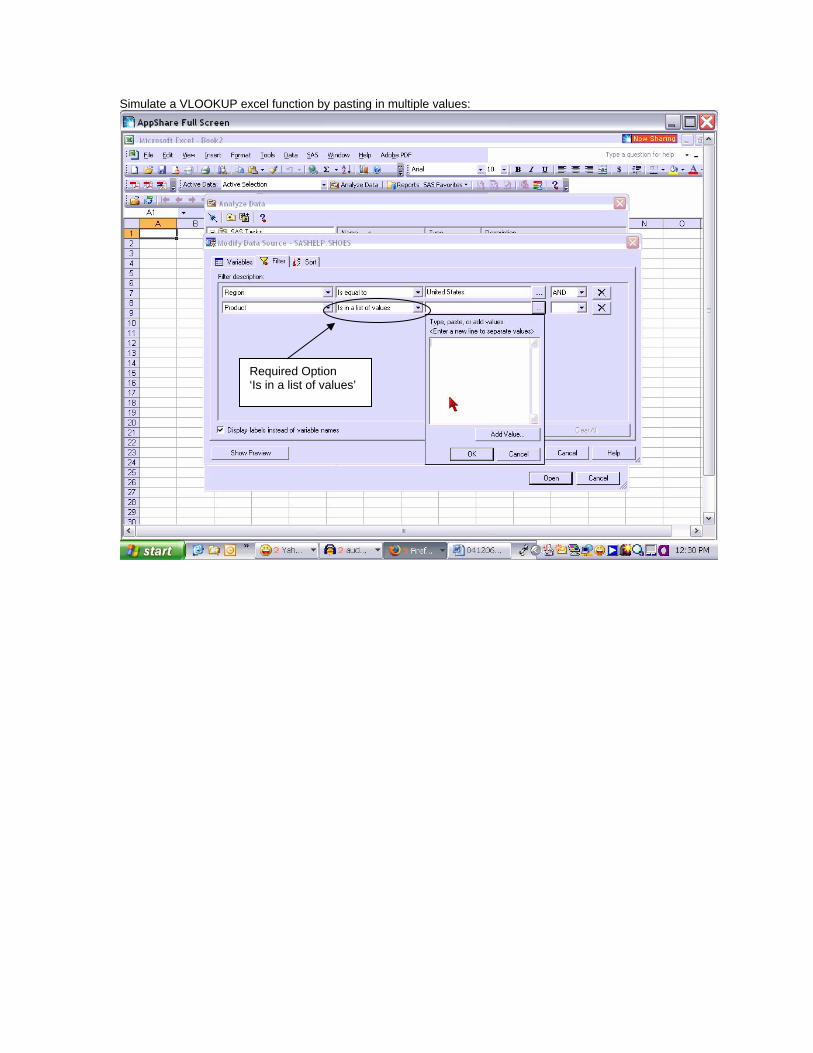
Simulate a VLOOKUP excel function by pasting in multiple values:
Required Option ‘Is in a list of values’

ANALYZE DATA The Analyze Data tab goes to a list of SAS Tasks, similar to SAS Enterprise Guide’s Task Menu Bar. Some items will not run if the connecting BI Server doesn’t have the appropriate license (such as the Pareto Task, as this requires SAS/QC). These tasks can be removed by manually removing the associated .dll from the installation. Additional Custom Tasks can be added, this is discussed in more detail in the Advanced Topics section.

Analyze data tasks are very easy to use, included is an example for generating a BAR Chart. First you select the display type, these are similar to Excel Bar Charts.
Next, you move to ‘Task Roles’ and select the required columns to produce the chart and the optional values to include.
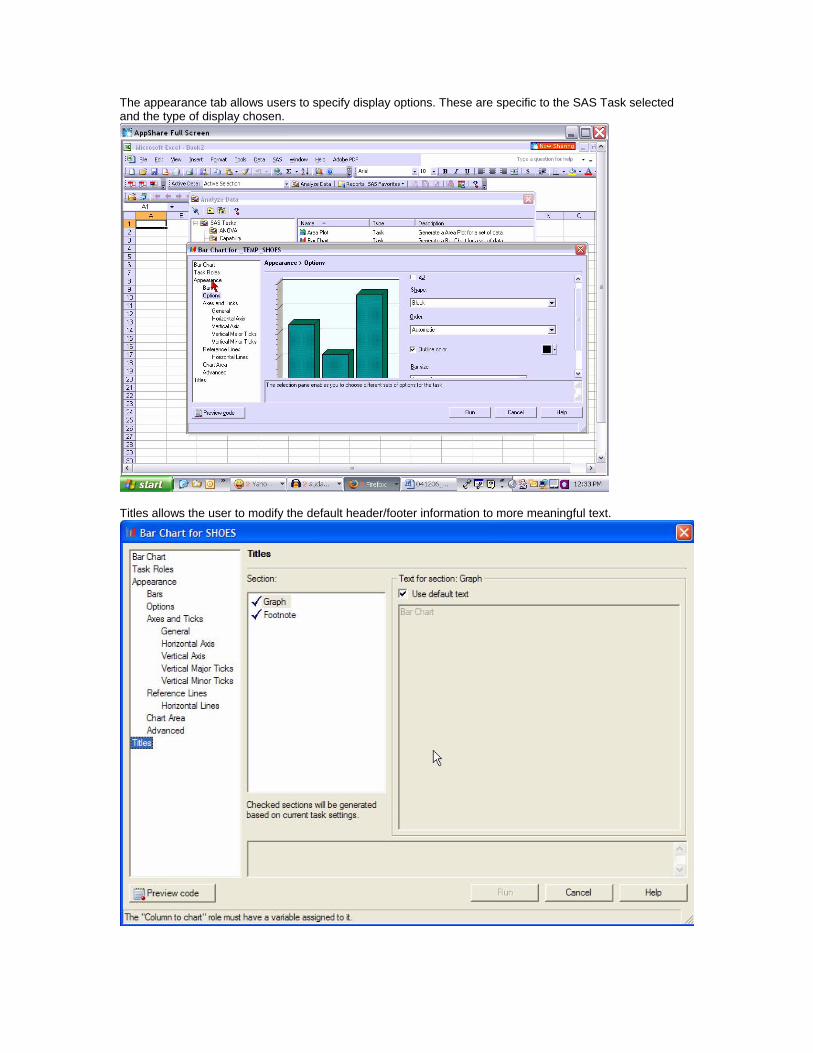
The appearance tab allows users to specify display options. These are specific to the SAS Task selected and the type of display chosen.
Titles allows the user to modify the default header/footer information to more meaningful text.
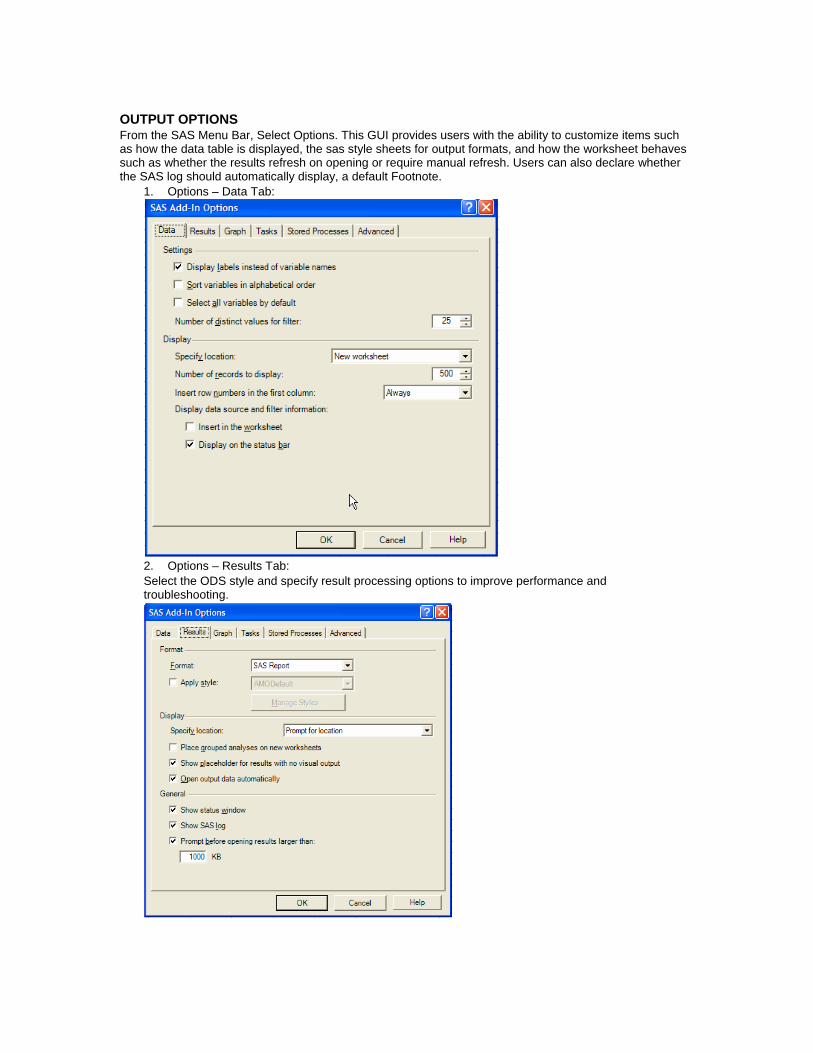
OUTPUT OPTIONS From the SAS Menu Bar, Select Options. This GUI provides users with the ability to customize items such as how the data table is displayed, the sas style sheets for output formats, and how the worksheet behaves such as whether the results refresh on opening or require manual refresh. Users can also declare whether the SAS log should automatically display, a default Footnote.
1. Options – Data Tab:
2. Options – Results Tab: Select the ODS style and specify result processing options to improve performance and troubleshooting.

3. Options – Graph Tab Choose the type and size of display image produced.
4. Options – Task Tab Modify the default footnote.
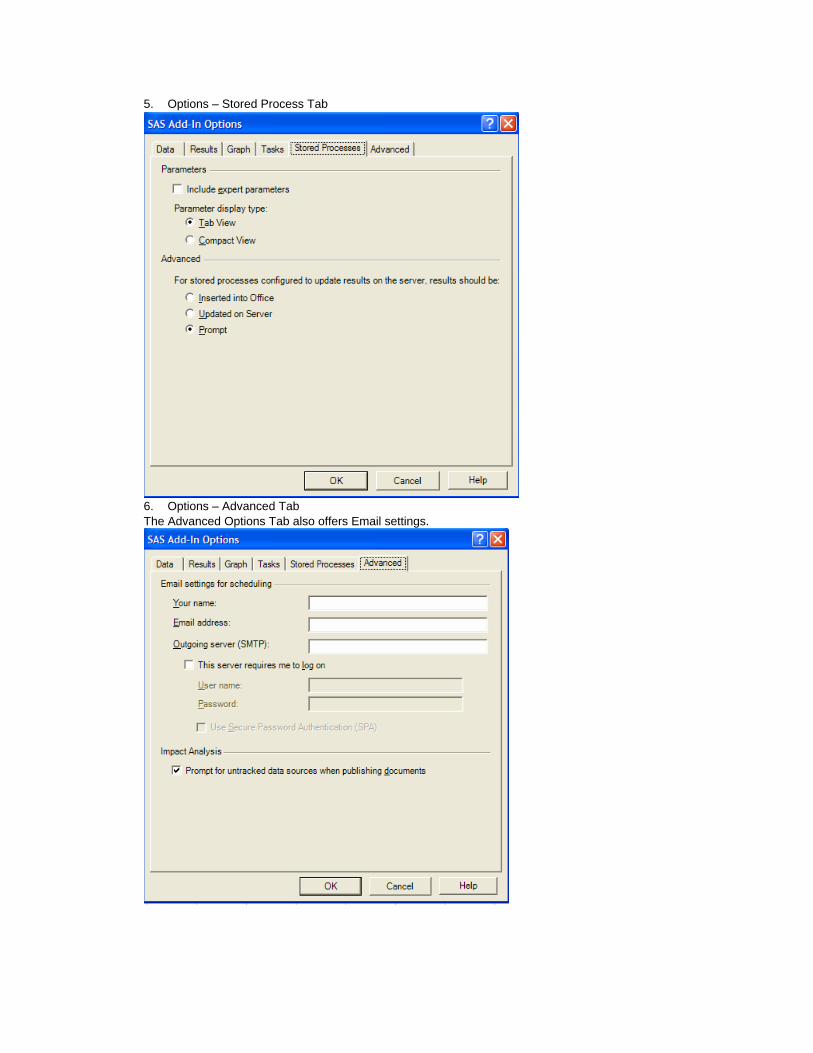
5. Options – Stored Process Tab
6. Options – Advanced Tab The Advanced Options Tab also offers Email settings.

INTERACTING WITH OUTPUT By right-clicking on the graph, you can (if using ActiveX or JAVA graphics device driver) do the same tasks as you would with SAS ODS Output to HTML.
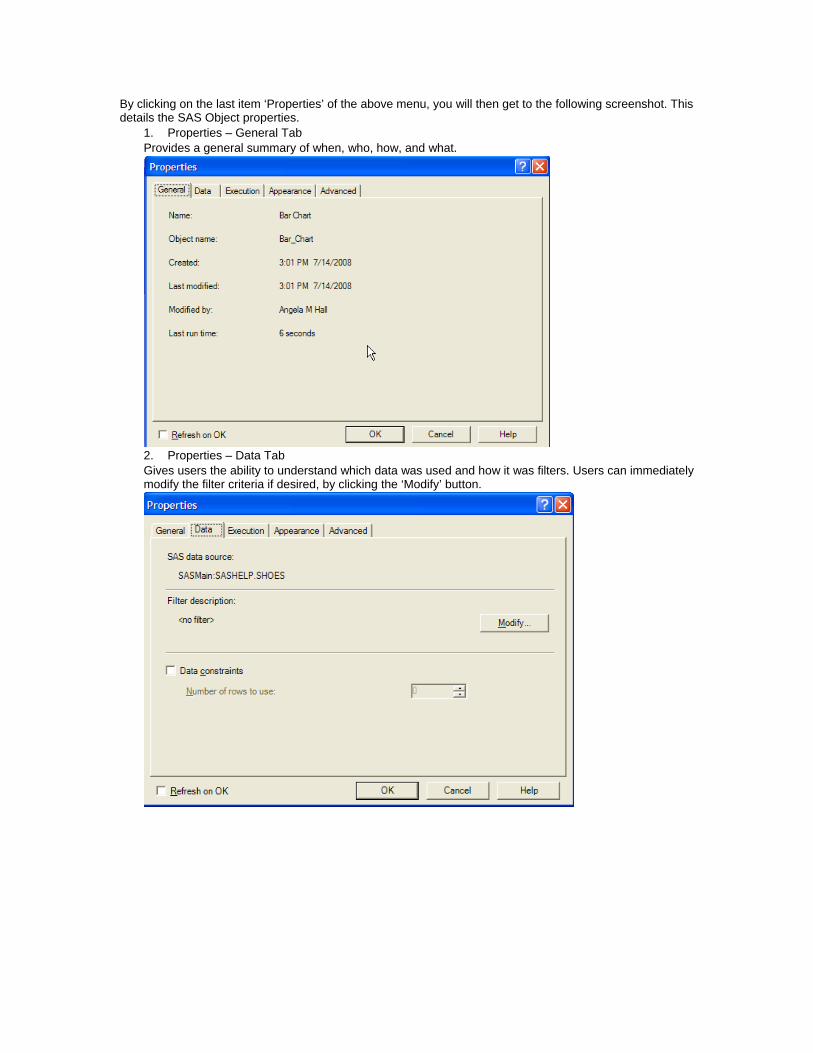
By clicking on the last item ‘Properties’ of the above menu, you will then get to the following screenshot. This details the SAS Object properties.
1. Properties – General Tab Provides a general summary of when, who, how, and what.
2. Properties – Data Tab Gives users the ability to understand which data was used and how it was filters. Users can immediately modify the filter criteria if desired, by clicking the ‘Modify’ button.
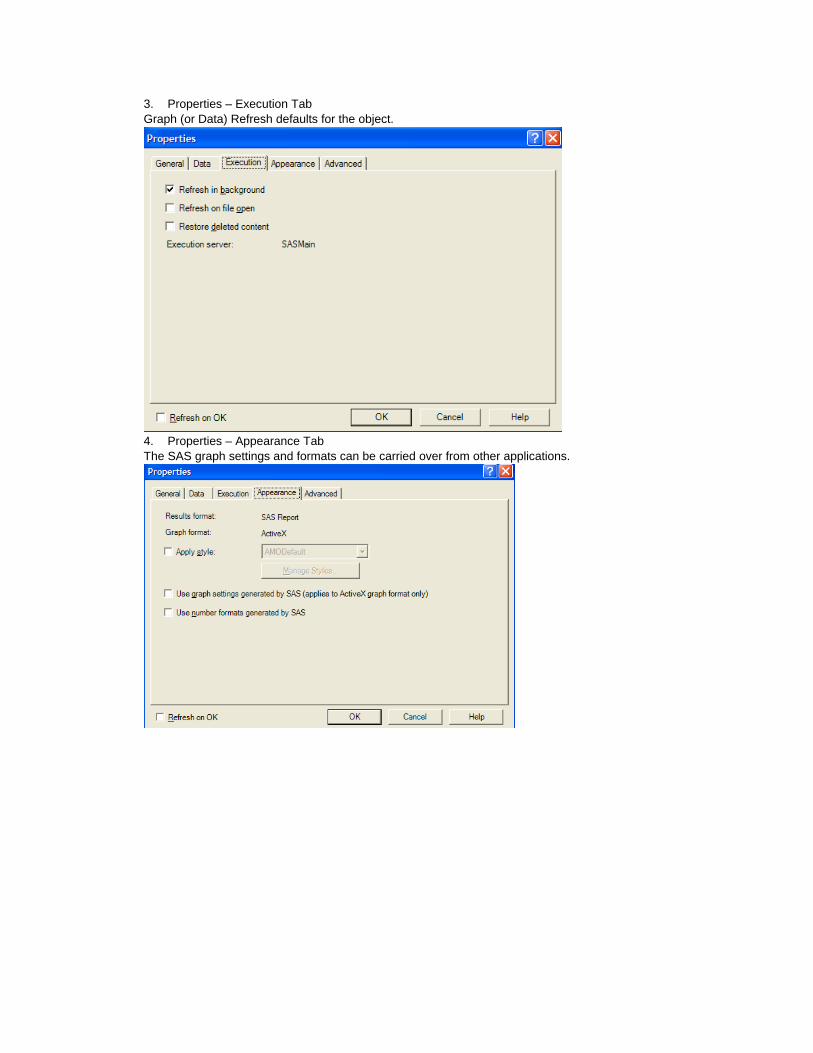
3. Properties – Execution Tab Graph (or Data) Refresh defaults for the object.
4. Properties – Appearance Tab The SAS graph settings and formats can be carried over from other applications.

5. Properties – Advanced Tab Additional properties users can adjust.
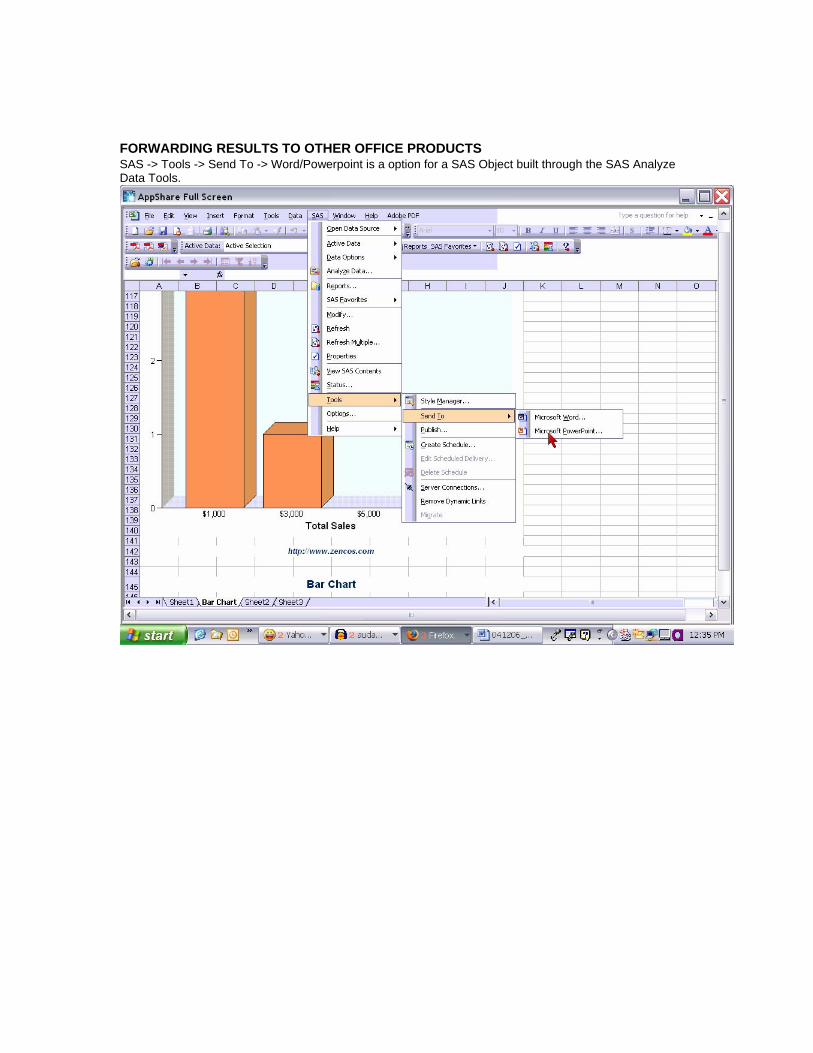
FORWARDING RESULTS TO OTHER OFFICE PRODUCTS SAS -> Tools -> Send To -> Word/Powerpoint is a option for a SAS Object built through the SAS Analyze Data Tools.

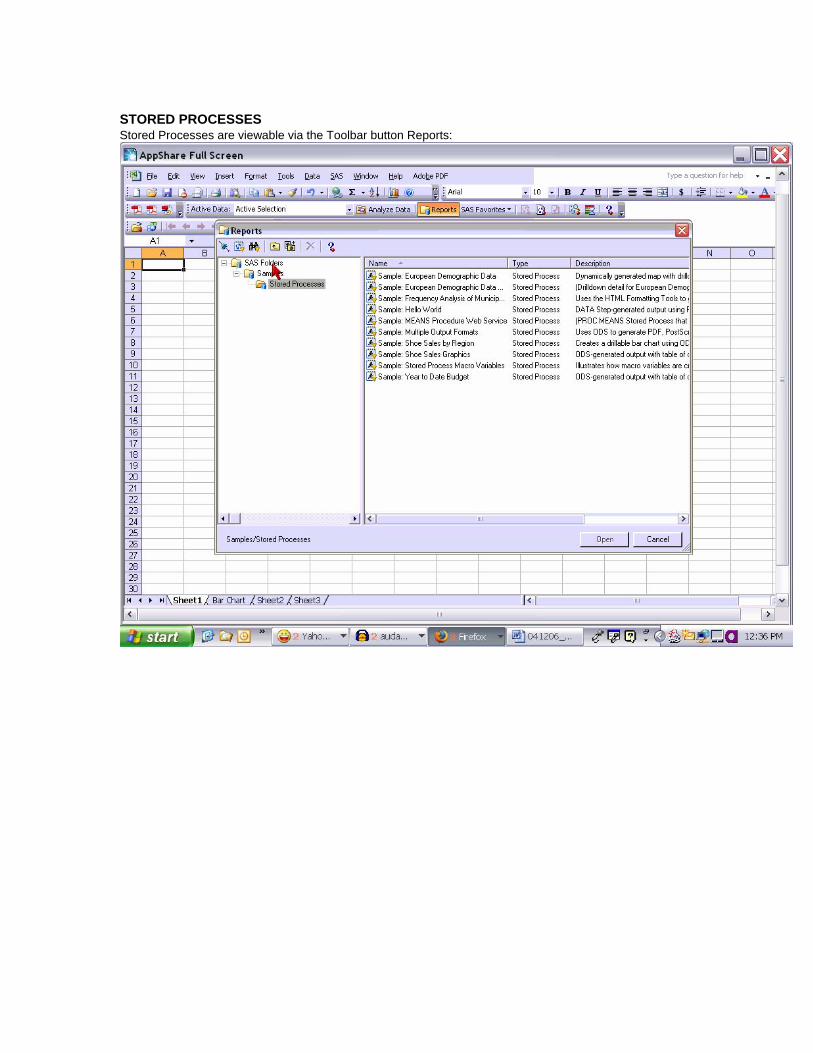
STORED PROCESSES Stored Processes are viewable via the Toolbar button Reports:
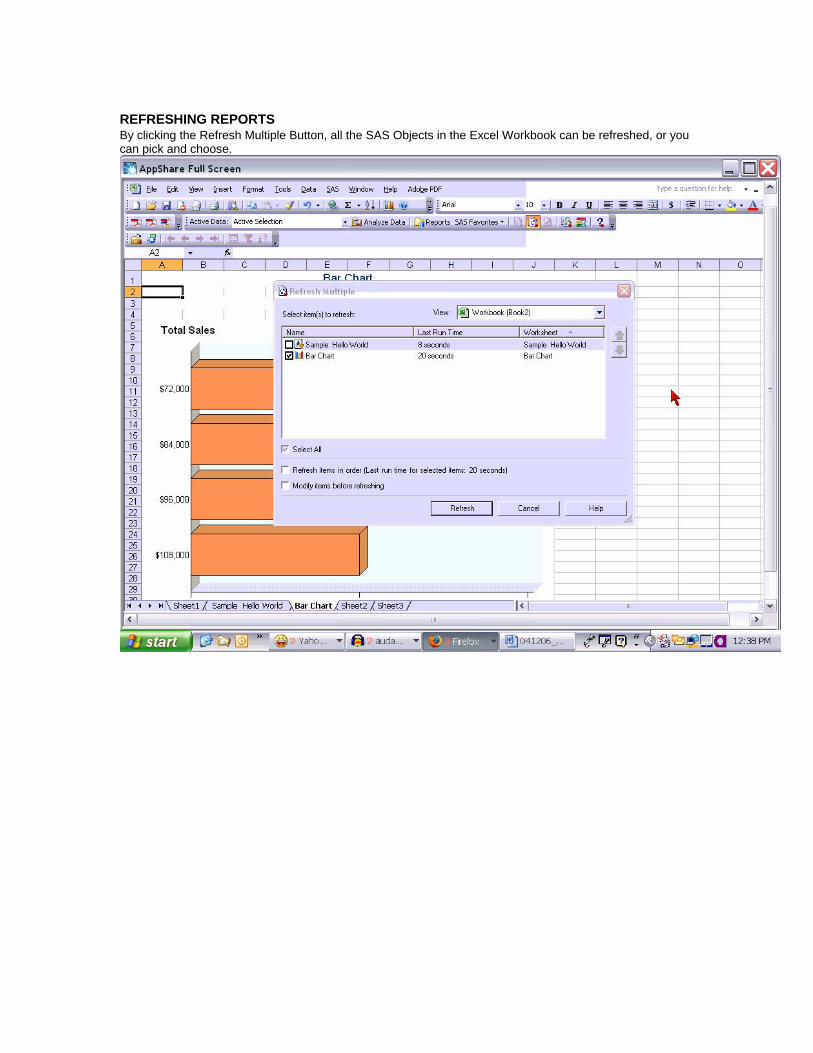
REFRESHING REPORTS By clicking the Refresh Multiple Button, all the SAS Objects in the Excel Workbook can be refreshed, or you can pick and choose.
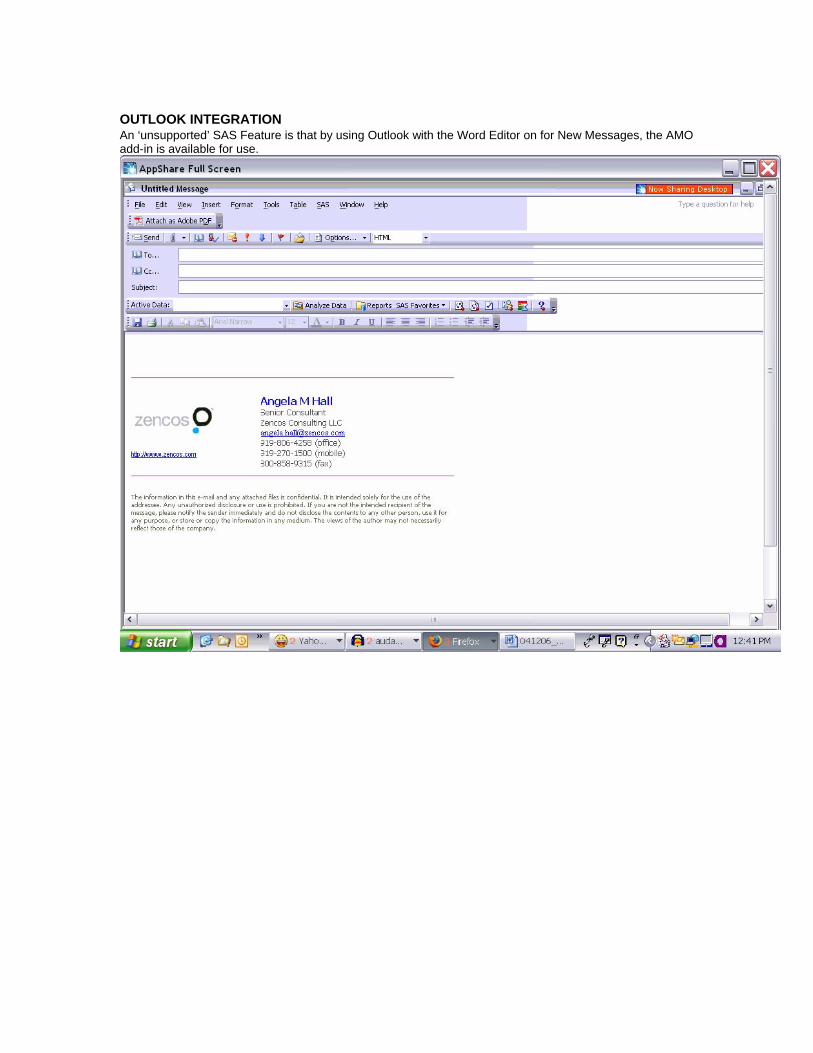
OUTLOOK INTEGRATION An ‘unsupported’ SAS Feature is that by using Outlook with the Word Editor on for New Messages, the AMO add-in is available for use.
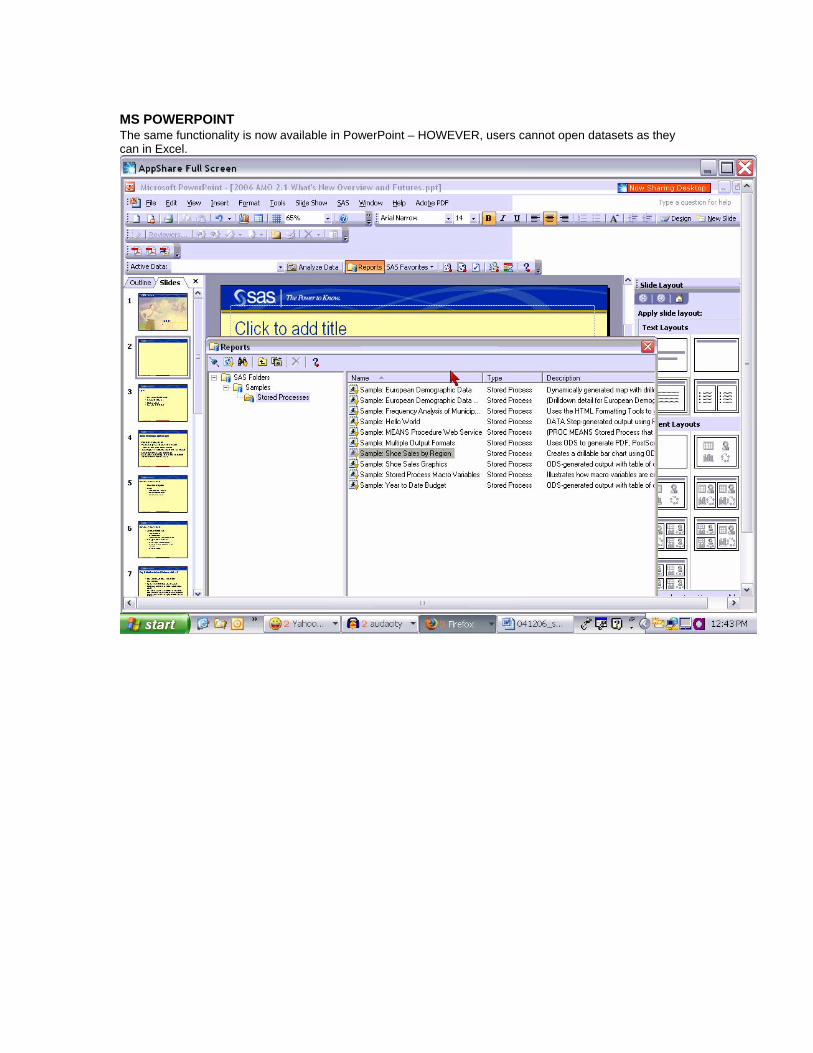
MS POWERPOINT The same functionality is now available in PowerPoint – HOWEVER, users cannot open datasets as they can in Excel.

ADVANCED TOPICS An extension to SAS Stored Process Tasks, Visual Basic programmers can add custom tasks to the Analyze Data Screen. These custom tasks are interfaces that are not limited by the SAS Stored Process interfaces. Visual Basic programmers can create dynamic drop down boxes, customize the layout of the UI and then kickoff the stored process. An example of a custom interface is below. This initially appears as an listed option in the SAS Task (or Analyze Data) interface. (Note: Each of these boxes is populated from SAS datasets. Some options are cascading – meaning they are dependant on selections from other boxes listed.)
Visual Basic Studio or some other VB/C# compiler is required to develop a custom add in. Moderate experience in Visual Basic is also a requirement of the developer. Additional information on how to accomplish this is available from SAS at: http://support.sas.com/documentation/onlinedoc/guide/release30/addins/index.htm

CONTACT INFORMATION Your comments and questions are valued and encouraged. Contact the author at:
Angela Hall Zencos Consulting LLC 100 Regency Forest Dr, Suite 130 Cary, NC 27518 Work Phone: 919-459-4600 [email protected] http://www.zencos.com
SAS and all other SAS Institute Inc. product or service names are registered trademarks or trademarks of SAS Institute Inc. in the USA and other countries. ® indicates USA registration. Other brand and product names are trademarks of their respective companies.