Embed Size (px)
Citation preview
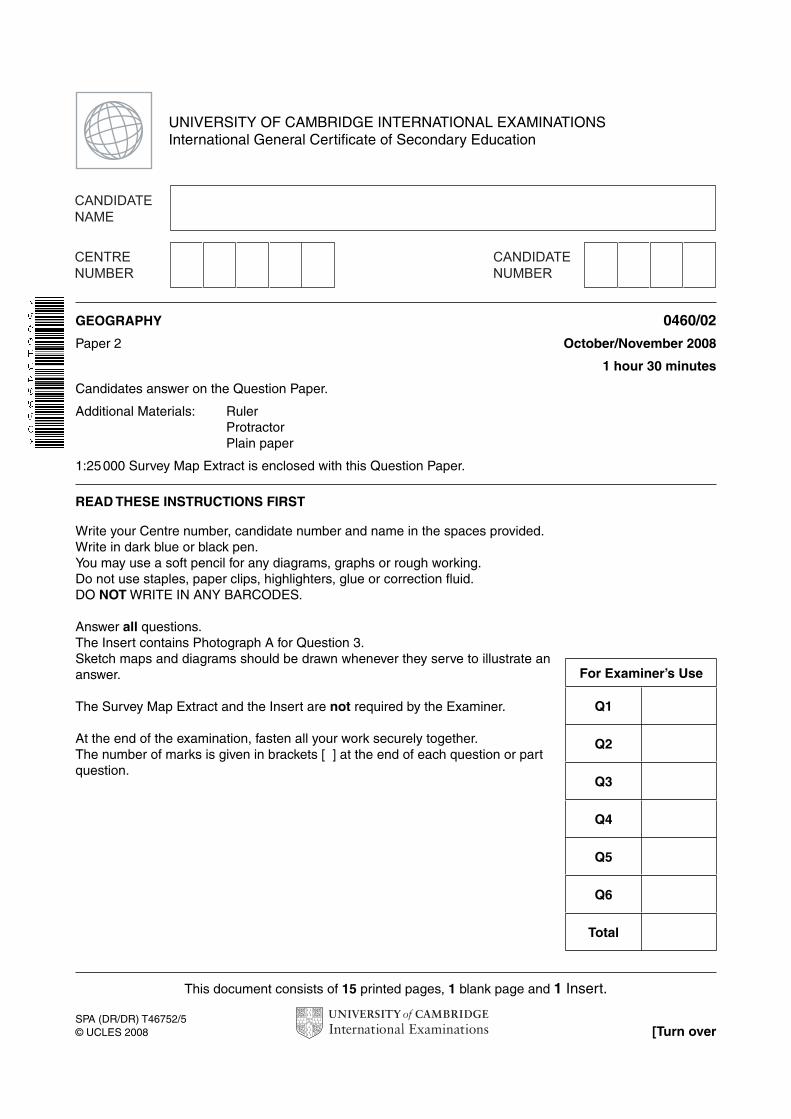
This document consists of 15 printed pages, 1 blank page and 1 Insert.
SPA (DR/DR) T46752/5© UCLES 2008 [Turn over
UNIVERSITY OF CAMBRIDGE INTERNATIONAL EXAMINATIONSInternational General Certificate of Secondary Education
READ THESE INSTRUCTIONS FIRST
Write your Centre number, candidate number and name in the spaces provided.Write in dark blue or black pen.You may use a soft pencil for any diagrams, graphs or rough working.Do not use staples, paper clips, highlighters, glue or correction fluid.DO NOT WRITE IN ANY BARCODES.
Answer all questions.The Insert contains Photograph A for Question 3.Sketch maps and diagrams should be drawn whenever they serve to illustrate an answer.
The Survey Map Extract and the Insert are not required by the Examiner.
At the end of the examination, fasten all your work securely together.The number of marks is given in brackets [ ] at the end of each question or partquestion.
GEOGRAPHY 0460/02
Paper 2 October/November 2008
1 hour 30 minutes
Candidates answer on the Question Paper.
Additional Materials: Ruler Protractor Plain paper
1:25 000 Survey Map Extract is enclosed with this Question Paper.
For Examiner’s Use
Q1
Q2
Q3
Q4
Q5
Q6
Total
2
0460/02/O/N/08
ForExaminer’s
Use
© UCLES 2008
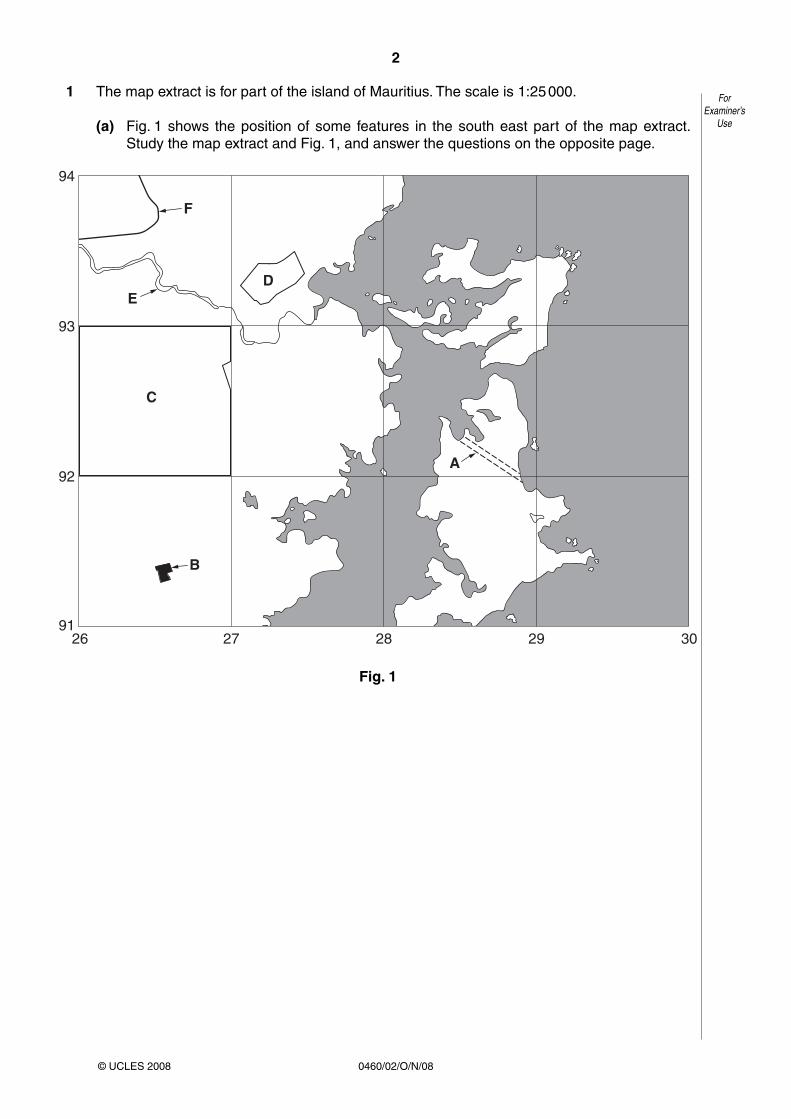
1 The map extract is for part of the island of Mauritius. The scale is 1:25 000.
(a) Fig. 1 shows the position of some features in the south east part of the map extract. Study the map extract and Fig. 1, and answer the questions on the opposite page.
F
ED
C
B
A
94
93
92
9126 27 28 29 30
Fig. 1
3
0460/02/O/N/08 [Turn over
ForExaminer’s
Use
© UCLES 2008
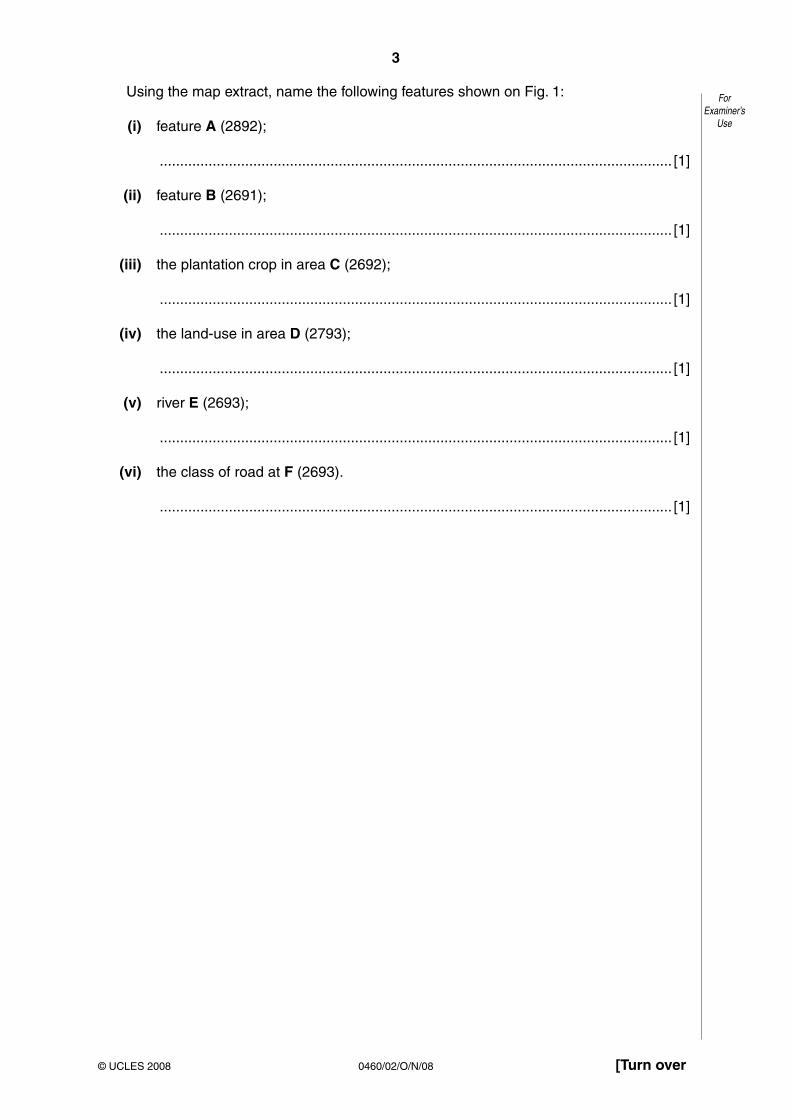
Using the map extract, name the following features shown on Fig. 1:
(i) feature A (2892);
.............................................................................................................................. [1]
(ii) feature B (2691);
.............................................................................................................................. [1]
(iii) the plantation crop in area C (2692);
.............................................................................................................................. [1]
(iv) the land-use in area D (2793);
.............................................................................................................................. [1]
(v) river E (2693);
.............................................................................................................................. [1]
(vi) the class of road at F (2693).
.............................................................................................................................. [1]
4
0460/02/O/N/08
ForExaminer’s
Use
© UCLES 2008
(b) Study the River Sèche from the western edge of the map (250933) to the sea (275931).
(i) In which general direction does the river flow? Circle the correct answer.
east to west
north east to south west
north to south
west to east [1]
(ii) Describe the shape of the river’s course.
.............................................................................................................................. [1]
(iii) Measure the distance along the river, from the western edge of the map (250933) to the Hatchery (275931). Give your answer in metres.
................................................metres [1]
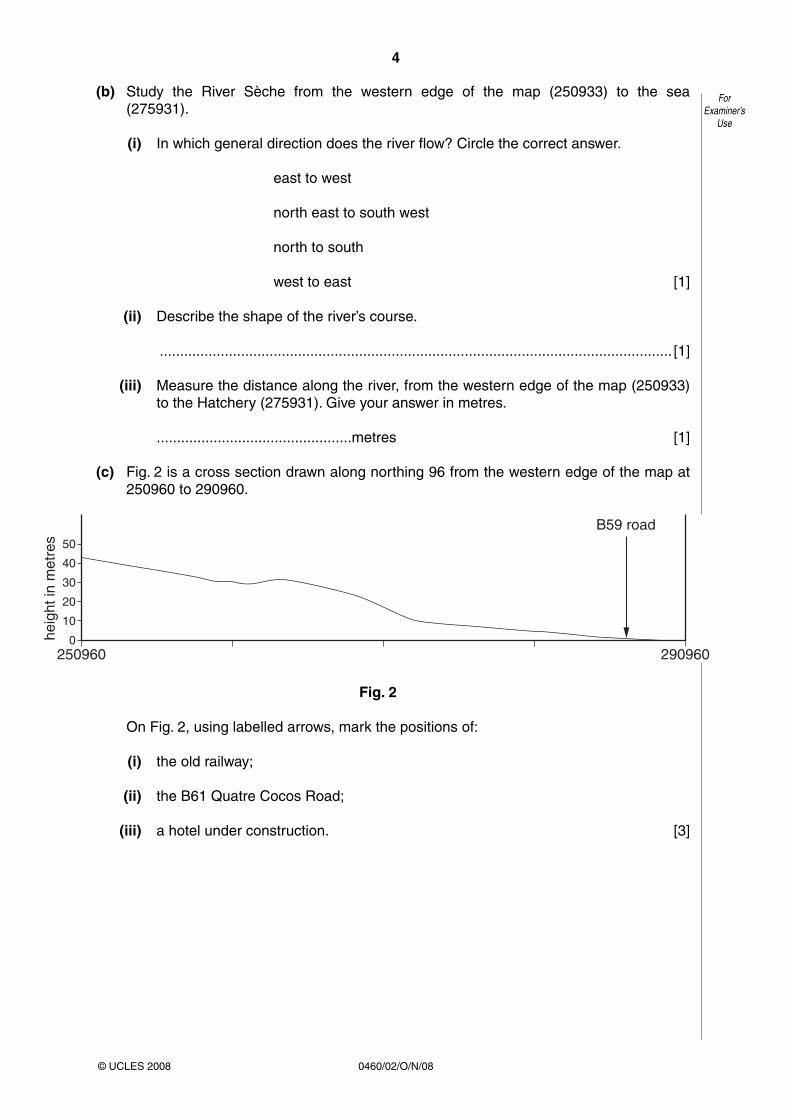
(c) Fig. 2 is a cross section drawn along northing 96 from the western edge of the map at 250960 to 290960.
250960 2909600
10
20
30
40
50
heig
ht in
met
res
B59 road
Fig. 2
On Fig. 2, using labelled arrows, mark the positions of:
(i) the old railway;
(ii) the B61 Quatre Cocos Road;
(iii) a hotel under construction. [3]
5
0460/02/O/N/08 [Turn over
ForExaminer’s
Use
© UCLES 2008
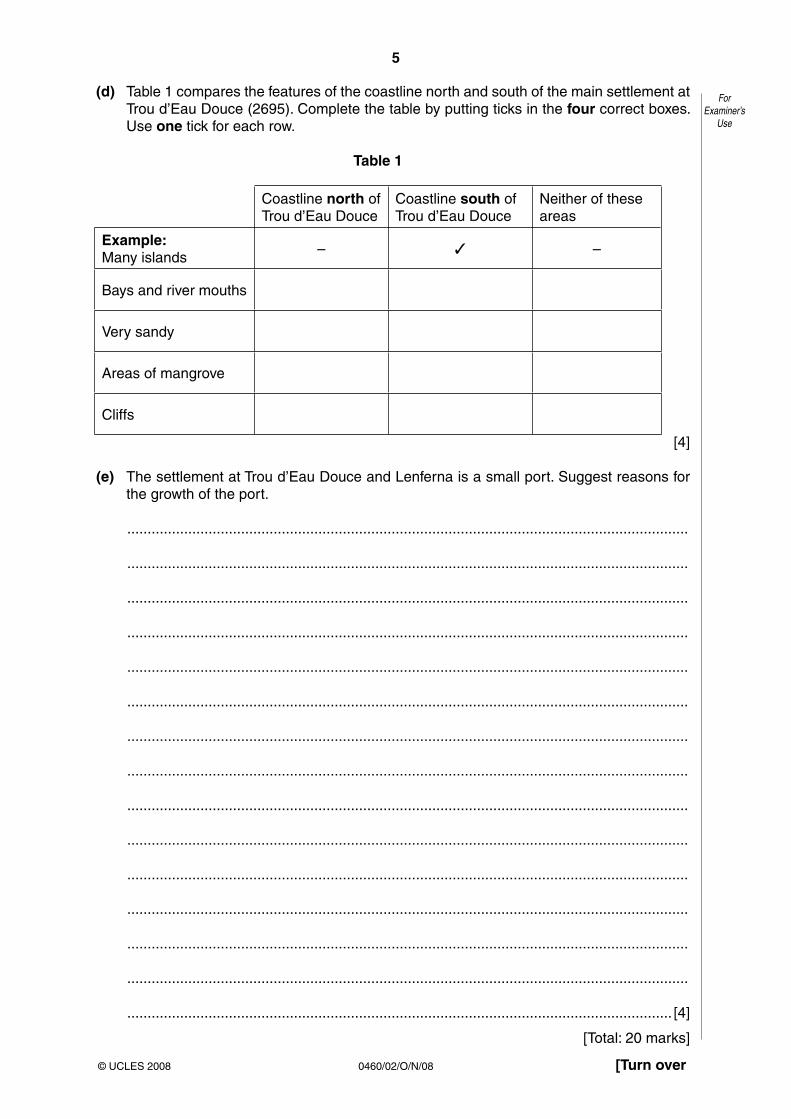
(d) Table 1 compares the features of the coastline north and south of the main settlement at Trou d’Eau Douce (2695). Complete the table by putting ticks in the four correct boxes. Use one tick for each row.
Table 1
Coastline north of Trou d’Eau Douce
Coastline south of Trou d’Eau Douce
Neither of these areas
Example: Many islands
– ✓ –
Bays and river mouths
Very sandy
Areas of mangrove
Cliffs
[4]
(e) The settlement at Trou d’Eau Douce and Lenferna is a small port. Suggest reasons for the growth of the port.
..........................................................................................................................................
..........................................................................................................................................
..........................................................................................................................................
..........................................................................................................................................
..........................................................................................................................................
..........................................................................................................................................
..........................................................................................................................................
..........................................................................................................................................
..........................................................................................................................................
..........................................................................................................................................
..........................................................................................................................................
..........................................................................................................................................
..........................................................................................................................................
..........................................................................................................................................
...................................................................................................................................... [4]
[Total: 20 marks]
6
0460/02/O/N/08
ForExaminer’s
Use
© UCLES 2008
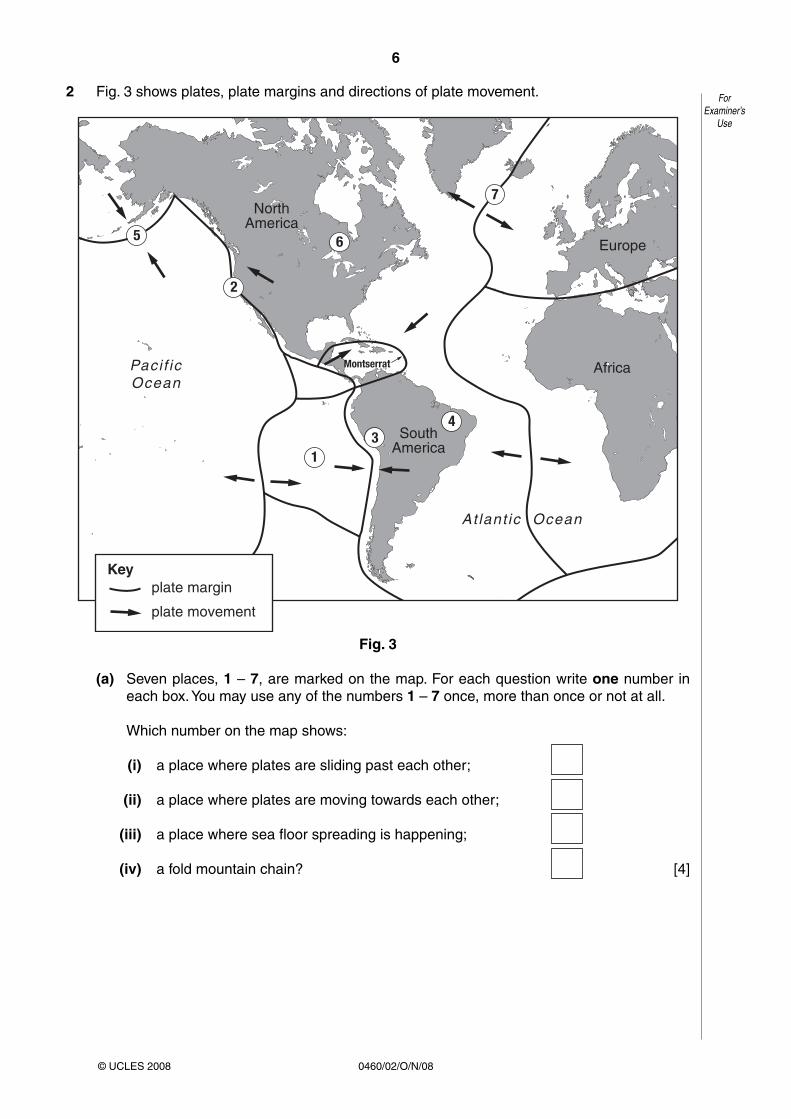
2 Fig. 3 shows plates, plate margins and directions of plate movement.
Pacif ic Ocean
At lant ic Ocean
North America
South America
Africa
Europe
Montserrat
7
6
1 3
4
5
2
Keyplate margin
plate movement
Fig. 3
(a) Seven places, 1 – 7, are marked on the map. For each question write one number in each box. You may use any of the numbers 1 – 7 once, more than once or not at all.
Which number on the map shows:
(i) a place where plates are sliding past each other;
(ii) a place where plates are moving towards each other;
(iii) a place where sea floor spreading is happening;
(iv) a fold mountain chain? [4]
7
0460/02/O/N/08 [Turn over
ForExaminer’s
Use
© UCLES 2008
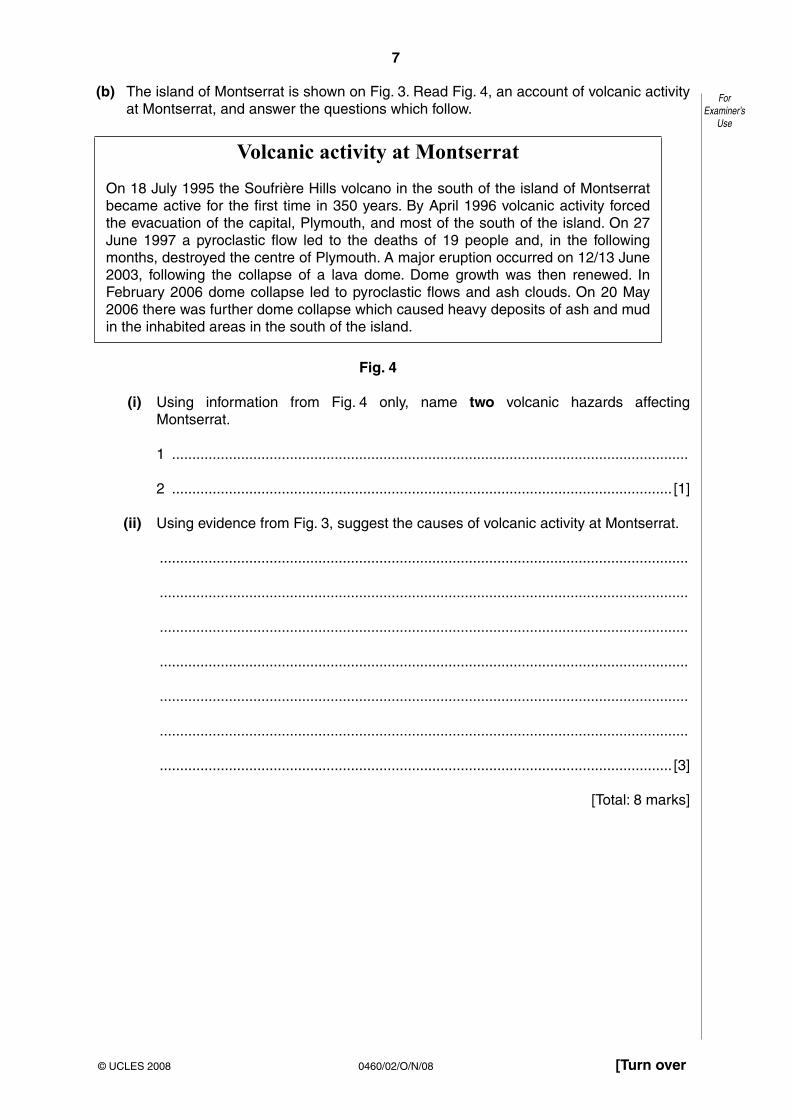
(b) The island of Montserrat is shown on Fig. 3. Read Fig. 4, an account of volcanic activity at Montserrat, and answer the questions which follow.
Volcanic activity at Montserrat
On 18 July 1995 the Soufrière Hills volcano in the south of the island of Montserrat became active for the first time in 350 years. By April 1996 volcanic activity forced the evacuation of the capital, Plymouth, and most of the south of the island. On 27 June 1997 a pyroclastic flow led to the deaths of 19 people and, in the following months, destroyed the centre of Plymouth. A major eruption occurred on 12/13 June 2003, following the collapse of a lava dome. Dome growth was then renewed. In February 2006 dome collapse led to pyroclastic flows and ash clouds. On 20 May 2006 there was further dome collapse which caused heavy deposits of ash and mud in the inhabited areas in the south of the island.
Fig. 4
(i) Using information from Fig. 4 only, name two volcanic hazards affecting Montserrat.
1 ...............................................................................................................................
2 ........................................................................................................................... [1]
(ii) Using evidence from Fig. 3, suggest the causes of volcanic activity at Montserrat.
..................................................................................................................................
..................................................................................................................................
..................................................................................................................................
..................................................................................................................................
..................................................................................................................................
..................................................................................................................................
.............................................................................................................................. [3]
[Total: 8 marks]
8
0460/02/O/N/08
ForExaminer’s
Use
© UCLES 2008
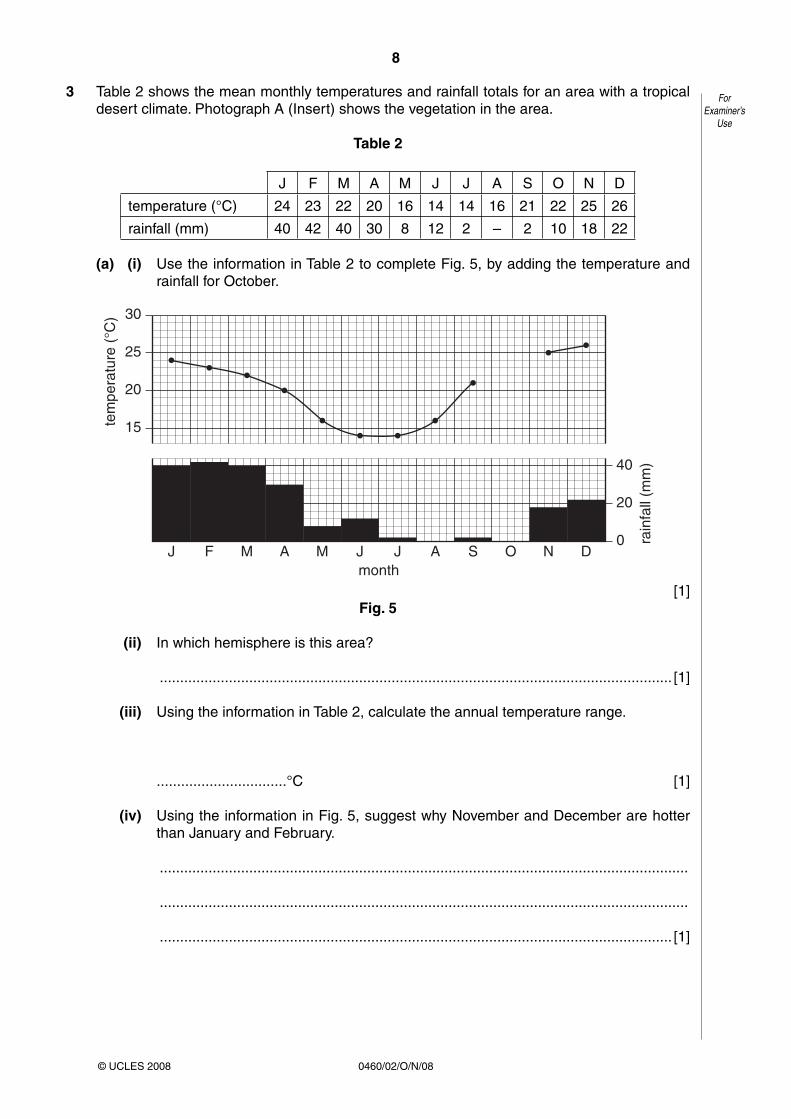
3 Table 2 shows the mean monthly temperatures and rainfall totals for an area with a tropical desert climate. Photograph A (Insert) shows the vegetation in the area.
Table 2
J F M A M J J A S O N D
temperature (°C) 24 23 22 20 16 14 14 16 21 22 25 26
rainfall (mm) 40 42 40 30 8 12 2 – 2 10 18 22
(a) (i) Use the information in Table 2 to complete Fig. 5, by adding the temperature and rainfall for October.
15
20
25
30
40
20
0J F M A M J J A S O N D
month
tem
pera
ture
(°C
)
rain
fall
(mm
)
[1]Fig. 5
(ii) In which hemisphere is this area?
.............................................................................................................................. [1]
(iii) Using the information in Table 2, calculate the annual temperature range.
................................°C [1]
(iv) Using the information in Fig. 5, suggest why November and December are hotter than January and February.
..................................................................................................................................
..................................................................................................................................
.............................................................................................................................. [1]

9
0460/02/O/N/08 [Turn over
ForExaminer’s
Use
© UCLES 2008
(b) Describe the vegetation in Photograph A (Insert). You should refer only to features seen in the photograph.
..........................................................................................................................................
..........................................................................................................................................
..........................................................................................................................................
..........................................................................................................................................
..........................................................................................................................................
..........................................................................................................................................
..........................................................................................................................................
..........................................................................................................................................
..........................................................................................................................................
..........................................................................................................................................
..........................................................................................................................................
..........................................................................................................................................
..........................................................................................................................................
..........................................................................................................................................
..........................................................................................................................................
..........................................................................................................................................
...................................................................................................................................... [4]
[Total: 8 marks]
10
0460/02/O/N/08
ForExaminer’s
Use
© UCLES 2008
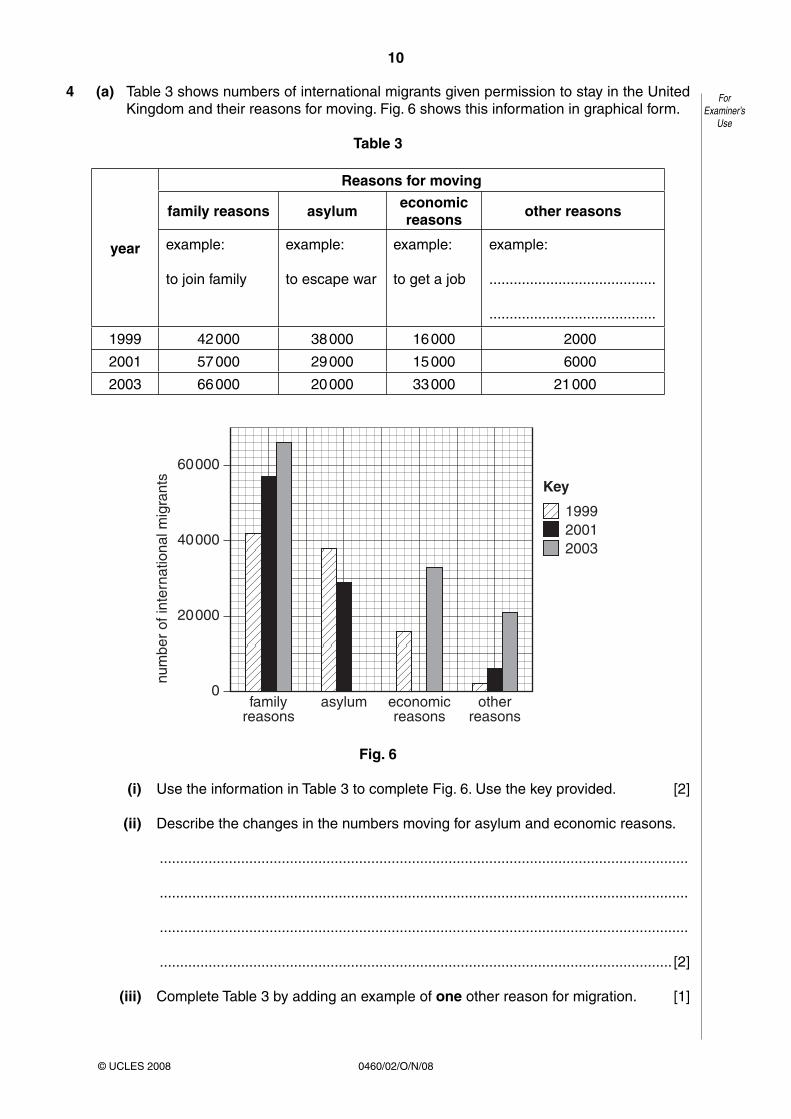
4 (a) Table 3 shows numbers of international migrants given permission to stay in the United Kingdom and their reasons for moving. Fig. 6 shows this information in graphical form.
Table 3
year
Reasons for moving
family reasons asylum economic reasons other reasons
example:
to join family
example:
to escape war
example:
to get a job
example:
.........................................
.........................................
1999 42 000 38 000 16 000 2000
2001 57 000 29 000 15 000 6000
2003 66 000 20 000 33 000 21 000
0
20000
40000
60000
family reasons
asylum economic reasons
other reasons
1999 2001 2003
Key
num
ber
of in
tern
atio
nal m
igra
nts
Fig. 6
(i) Use the information in Table 3 to complete Fig. 6. Use the key provided. [2]
(ii) Describe the changes in the numbers moving for asylum and economic reasons.
..................................................................................................................................
..................................................................................................................................
..................................................................................................................................
.............................................................................................................................. [2]
(iii) Complete Table 3 by adding an example of one other reason for migration. [1]
11
0460/02/O/N/08 [Turn over
ForExaminer’s
Use
© UCLES 2008
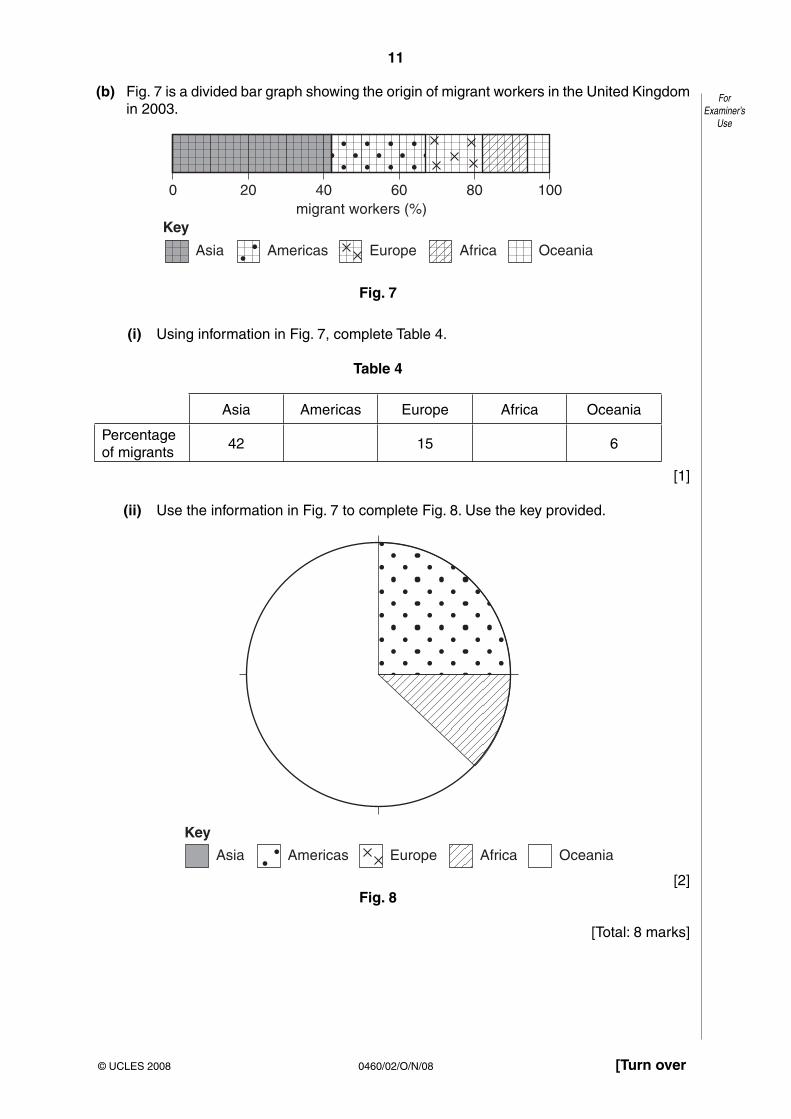
(b) Fig. 7 is a divided bar graph showing the origin of migrant workers in the United Kingdom in 2003.
Key
Asia Americas Africa OceaniaEurope
0 20 40 60 80 100 migrant workers (%)
Fig. 7
(i) Using information in Fig. 7, complete Table 4.
Table 4
Asia Americas Europe Africa Oceania
Percentage of migrants
42 15 6
[1]
(ii) Use the information in Fig. 7 to complete Fig. 8. Use the key provided.
Key
Asia Americas Africa OceaniaEurope
[2]Fig. 8
[Total: 8 marks]
12
0460/02/O/N/08
ForExaminer’s
Use
© UCLES 2008
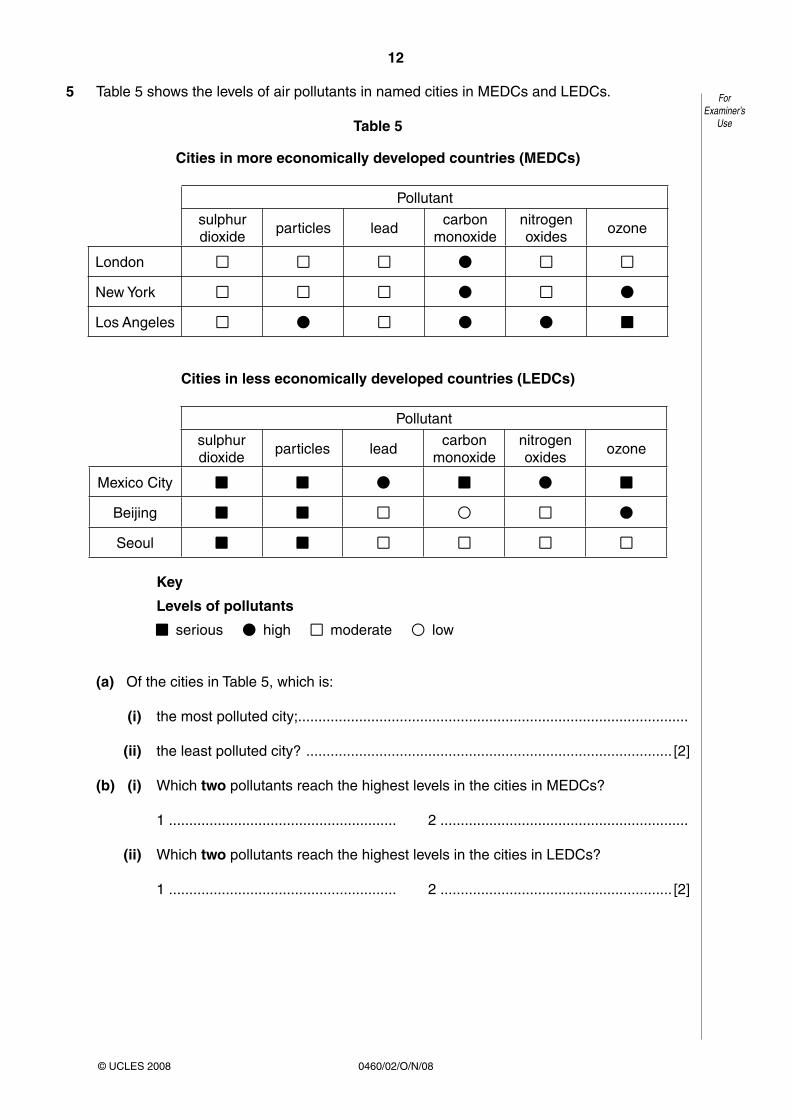
5 Table 5 shows the levels of air pollutants in named cities in MEDCs and LEDCs.
Table 5
Cities in more economically developed countries (MEDCs)
Pollutant
sulphur dioxide
particles leadcarbon
monoxidenitrogen oxides
ozone
London ■■ ■■ ■■ ● ■■ ■■
New York ■■ ■■ ■■ ● ■■ ●
Los Angeles ■■ ● ■■ ● ● ■
Cities in less economically developed countries (LEDCs)
Pollutant
sulphur dioxide
particles leadcarbon
monoxidenitrogen oxides
ozone
Mexico City ■ ■ ● ■ ● ■
Beijing ■ ■ ■■ ●● ■■ ●
Seoul ■ ■ ■■ ■■ ■■ ■■
Key
Levels of pollutants
■ ■ serious ● ● high ■ ■ moderate ● ● low
(a) Of the cities in Table 5, which is:
(i) the most polluted city; ................................................................................................
(ii) the least polluted city? .......................................................................................... [2]
(b) (i) Which two pollutants reach the highest levels in the cities in MEDCs?
1 ........................................................ 2 .............................................................
(ii) Which two pollutants reach the highest levels in the cities in LEDCs?
1 ........................................................ 2 ......................................................... [2]
13
0460/02/O/N/08 [Turn over
ForExaminer’s
Use
© UCLES 2008
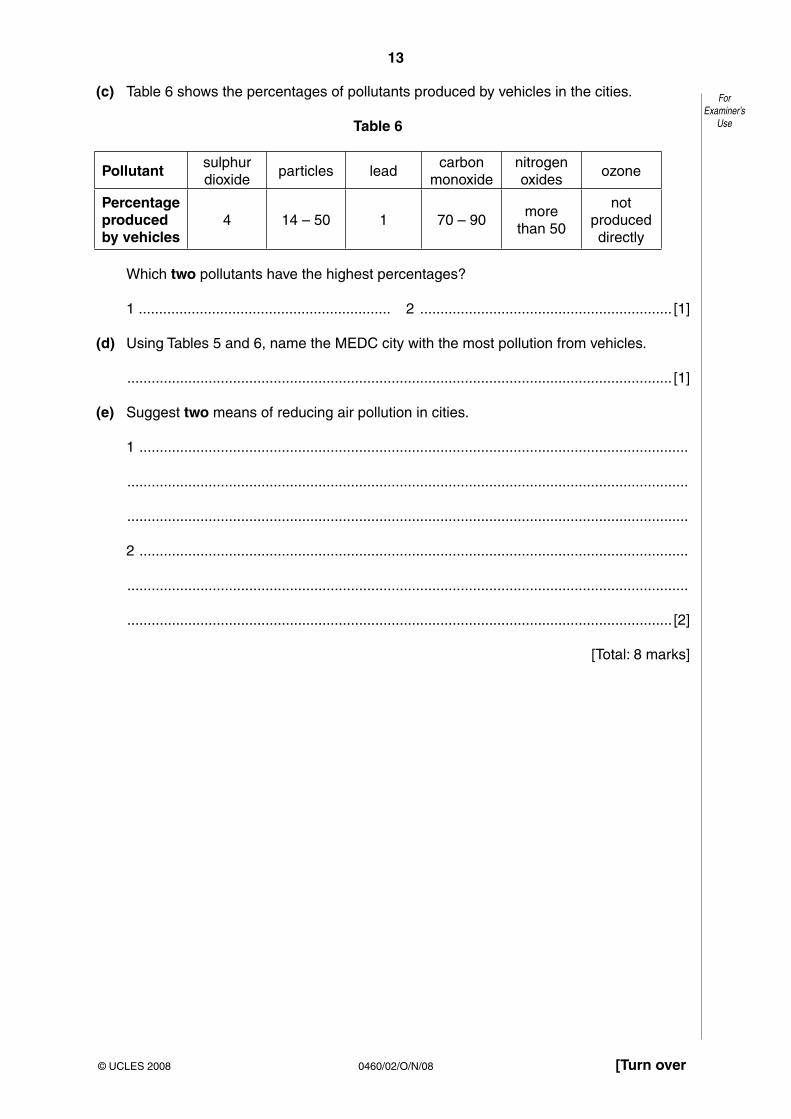
(c) Table 6 shows the percentages of pollutants produced by vehicles in the cities.
Table 6
Pollutant sulphur dioxide
particles leadcarbon
monoxidenitrogen oxides
ozone
Percentage produced by vehicles
4 14 – 50 1 70 – 90more
than 50
not produced directly
Which two pollutants have the highest percentages?
1 .............................................................. 2 .............................................................. [1]
(d) Using Tables 5 and 6, name the MEDC city with the most pollution from vehicles.
...................................................................................................................................... [1]
(e) Suggest two means of reducing air pollution in cities.
1 .......................................................................................................................................
..........................................................................................................................................
..........................................................................................................................................
2 .......................................................................................................................................
..........................................................................................................................................
...................................................................................................................................... [2]
[Total: 8 marks]
14
0460/02/O/N/08
ForExaminer’s
Use
© UCLES 2008
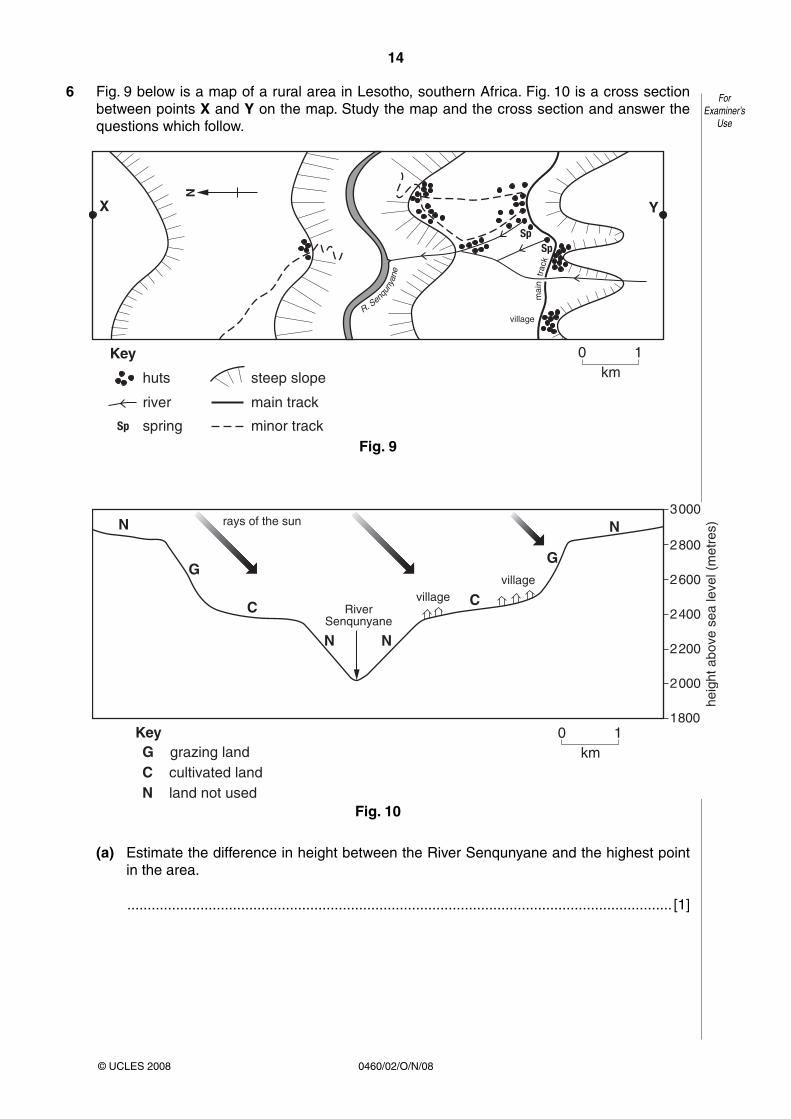
6 Fig. 9 below is a map of a rural area in Lesotho, southern Africa. Fig. 10 is a cross section between points X and Y on the map. Study the map and the cross section and answer the questions which follow.
X Y
R. Senq
unya
ne
mai
n tr
ack
Sp
Sp
Sp
village
N
0 1 km
Key
huts
river
steep slope
spring
main track
minor trackFig. 9
N
G
C
N N
C
G
N rays of the sun
River Senqunyane
village village
1800
2000
2200
2400
2600
2800
3000
heig
ht a
bove
sea
leve
l (m
etre
s)
KeyG grazing landC cultivated landN land not used
0 1 km
Fig. 10
(a) Estimate the difference in height between the River Senqunyane and the highest point in the area.
...................................................................................................................................... [1]
15
0460/02/O/N/08
ForExaminer’s
Use
© UCLES 2008
(b) Using information on Figs 9 and 10, describe and suggest reasons for the location of the villages.
..........................................................................................................................................
..........................................................................................................................................
..........................................................................................................................................
..........................................................................................................................................
..........................................................................................................................................
..........................................................................................................................................
..........................................................................................................................................
..........................................................................................................................................
..........................................................................................................................................
..........................................................................................................................................
..........................................................................................................................................
..........................................................................................................................................
..........................................................................................................................................
..........................................................................................................................................
..........................................................................................................................................
..........................................................................................................................................
..........................................................................................................................................
...................................................................................................................................... [5]
(c) Using evidence from Figs 9 and 10 only, suggest two reasons why some of the land is not used for cultivation or grazing.
1 .......................................................................................................................................
..........................................................................................................................................
2 .......................................................................................................................................
...................................................................................................................................... [2]
[Total: 8 marks]

16
0460/02/O/N/08
BLANK PAGE
© UCLES 2008
Copyright Acknowledgements:
Map Reproduced by permission of Ordnance Survey on behalf of HMSO © Crown copyright (2007). All rights reserved. Ordnance Survey Licence number 100046560.Question 3 Photograph A D. A. Kelly © UCLES.
Permission to reproduce items where third-party owned material protected by copyright is included has been sought and cleared where possible. Every reasonable effort has been made by the publisher (UCLES) to trace copyright holders, but if any items requiring clearance have unwittingly been included, the publisher will be pleased to make amends at the earliest possible opportunity.
University of Cambridge International Examinations is part of the Cambridge Assessment Group. Cambridge Assessment is the brand name of University of Cambridge Local Examinations Syndicate (UCLES), which is itself a department of the University of Cambridge.