Embed Size (px)
Citation preview

Closing the CircleSome comments on design procedures for tunnel supports in rock
C. Fairhurst 1
C. Carranza-Torres 2
Preamble
This overview has been prepared specifically for presentation at the 50th AnnualMeeting of the Minnesota Geotechnical Society. Tunnel support design has been asubject of research at the University of Minnesota since the 1960’s. It is also nearlyhalf a century since Terzaghi (1946) proposed his method for tunnel support design inrock that was widely adopted in the United States. This paper provides an opportunityto illustrate the goal of rock mechanics research at ‘Minnesota’, that involves arrivingat practical procedures through understanding of the basic physical principles thatcontrol the mechanical behavior of rock. Given the variability and unpredictabilityof geological materials, the ‘numbers’ resulting from calculations are considered tobe of value primarily to the extent that they help elucidate these basic principles.
Introduction
The ancient art of tunnelling has evolved throughout history with occasional periodsof impressive development, as in the Roman era and during the Industrial Revolution.At no time, however, have the demands on tunnelling developed as rapidly as duringthe last half century. Population growth, rapid urbanization, development of nationaland international rapid transportation networks, and a growing realization that manyfacilities built traditionally above ground can be located to advantage underground allcombine to stimulate demand for tunnelling and underground excavation. Projectsbecome more and more ambitious and important new problems appear, challengingthe capabilities of the geotechnical engineer.
1 Senior Consultant, Itasca Consulting Group, Inc. Minneapolis, Minnesota.Professor Emeritus, University of Minnesota.
2 Consulting Engineer, Itasca Consulting Group, Inc.
1 Fairhurst and Carranza-Torres

The advent of the high-speed computer and rapid developments in computingtechniques over the past two to three decades together provide a potentially powerfultool to help the geotechnical engineer respond to this challenge. To use this tool ef-fectively, however, it is essential to recognize the special characteristics of geologicalmaterials and the constraints imposed on design compared, for example, to problemsinvolving fabricated materials. In the latter case, the mechanical response of the full-scale structure can be determined reliably from tests on small laboratory specimens.By contrast, a rock mass may contain joints, fractures, folds and other geologically-induced features such that the mechanical response of the full-scale structure maybear little or no relationship to the response of small scale specimens taken from thesame mass. Further, the rock properties may vary considerably throughout a rockmass in a manner that, in many cases, cannot be determined from advance geologicalexploration.
In the case of tunnelling, concern is focused on the region affected by exca-vation of the tunnel face. Rock mass properties may change unexpectedly with eachincrement of tunnel advance. Narrow gouge-filled faults and comparable conditions,undetected in geological exploration, can produce dramatic changes in excavationstability. Less dramatic effects arise routinely as conditions change from those as-sumed in support design calculations. Labasse (1949), in discussing supports fortunnels in mines, summarized the situation as follows:
‘First, the types of support to be used [in the mine] must be limitedto one or two in order not to disrupt the material supply operations un-derground. This standardization makes precise calculation of a supportfor each section [of tunnel advance] useless. Further, the need to installthe support immediately after excavation does not allow time to makecalculations and fabricate the support. In order to arrive at a precisedetermination it would be necessary, in fact, to study each section sepa-rately because it would differ from neighboring sections with respect tothe rock layers encountered, their dip and their disposition. It would benecessary to take a test specimen from each layer, determine its prop-erties and the influence of these properties on neighboring layers. Thiswould require a series of experiments and mathematical analyses whosesolution, assuming that a solution is possible, would take up precioustime during which the excavation would certainly have collapsed.’
Thus, a good support design is one that (i) will stabilize the excavation forthe conditions to be expected, and (ii) is capable of being adapted to deal withchanges from these conditions as they are revealed at the face during excavation.[Note also that time is mentioned as a factor.] The terms design as you go and theobservational approach are sometimes used to describe this method of design. Forthis approach to be successful, it is essential that the tunnel engineer know how torespond appropriately and quickly when the actual conditions are revealed —i.e. howto modify the design on-site, and how to establish that the changes have achieved
2 Fairhurst and Carranza-Torres

the desired effect. Thus, it is at least as important for the engineer to understand thegeneral physics and nature of the mechanical changes produced in the rock in thevicinity of an excavation, as it is to know how to make the design calculations.
How, then, can numerical modelling techniques be used to best advantageto assist in tunnel support design? There appear to be several possibilities. In thispaper, the authors examine two:
1. to assess the validity of current design approaches, most of which predate the‘computer age’; and
2. to extend the general insights on tunnel response, gained from classical analysis,to ‘more practical’ tunnelling situations.
The paper concludes with suggestions for further studies where numerical modellingcould advance the ‘state of the art’ of tunnel support design.
Historical developments in mechanics relevant to tunnel support design
It is useful at the outset to review briefly the history of development of computationaltools and solutions in mechanics, since tunnel support design has been guided inconsiderable measure by these developments.
The discovery of calculus in the second half of the 17th century by Newtonand Leibnitz provided the direct stimulus for the development of continuum mechan-ics and the theory of elasticity. At the time, considerable attention was focused onattempting to arrive at the macroscopic behavior of materials by, in effect, the integra-tion of interactions at the molecular scale. There was doubt and considerable debateas to the applicability of the continuum hypothesis, since it required the materials tohave no discrete structure at the molecular level1.
1 One must mention the great difficulty in its development. Mathematical analysis in those dayswas built on the concept of continuous geometrical space in which it was possible to considerindividual segments and to introduce the processes of differentiation and integration on this basis.The universally recognized Newtonian molecular theory of structure of bodies, on the other hand,represented them as discrete media composed of individual particles that are connected with eachother by the forces of mutual attraction and repulsion. It proved to be very difficult to justifythe applicability to such media of the apparatus of mathematical analysis, which was essentiallyconnected with the concept of continuous functions capable of receiving indefinitely small (i.e.infinitesimal) increments, and with the possibility of passing to the limit in their summation(i.e., in their integration). On account of this, the first works on the mathematical theory ofelasticity gave rise to much discussion; their validity was questioned. However, the fact thateven an extremely small volume, presumably isolated from a body, contains a great number ofmolecules prompted investigators to appeal to the law of large numbers and to apply the methodwhich was subsequently called statistical; this made it possible to bridge the gap between thecontinuous space of mathematical analysis and the solid body as a discrete medium. It became pos-sible to apply the powerful apparatus of mathematics to the development of the new branch of physics.
‘. . . doubts concerning the physical justification of the method of elasticity dealing,as it were, with a continuous solid medium, gradually disappeared. From this point
3 Fairhurst and Carranza-Torres

By the second half of the 18th century, however, continuum mechanics wasestablished, together with the theory of elasticity and a number of important analyticalelastic solutions had been obtained.
Solutions of particular relevance to tunnel support design are the Lame (1852)solution for the stress distribution around a cylindrical or spherical cavity in an elasticmedium subjected to uniform internal and external pressure and the Kirsch (1898)solution for stresses around a circular hole in an elastic plate subjected to biaxialloading. Inglis (1913) effectively extended the Kirsch result to consideration of anelliptical hole in an elastic plate. Figure 1 summarizes these results.
A very important feature of all of these analytical or closed form solutionsis that the results are expressed in dimensionless form. Thus, the stresses are seento vary as the square of the dimensionless ratio of the ‘tunnel’ radius [a] dividedby the radial distance [r] —or as the cube of this ratio in the case of a sphericalcavity— while the deformations are proportional to the ratio of the applied stress [σ ]to the elastic modulus [E] of the medium. In the case of non-circular openings it isuseful to recognize that the stress concentrations will tend to extend further behindthe opening as the local radius of curvature increases2. These general results remainof significant value in current design, as will be noted below.
Many excavations in rock have profiles that deviate considerably from thesimple geometries that are amenable to closed form analysis3 ;4. The developmentof Photoelasticity [Coker and Filon (1931); Frocht (1941)] provided an experimen-tal technique to obtain very good estimates of the influence of complex excavationshapes on the stress distributions (Figure 2). Although two-dimensional photoelas-ticity was more common, three-dimensional analysis was also possible. As seen
of view, it is sometimes said that the theory of elasticity is based on the hypothesisof the continuous structure of solids. It must be borne in mind, of course, that thishypothesis is but a working hypothesis; it is dictated by the adopted mathematicalmethod of investigation and does not intrude into the branches of physics that aredirectly concerned with the problems of body structure.’ (Filonenko-Borodich, ca1960).
‘In the field of geomechanics, granular media and block-jointed rock masses areobvious examples where the concept of the ideal physical continuum —one in whichno gaps are formed— cannot be expected to apply.’ (Trollope, 1968, p. 275)
2 This can be seen well in the photoelastic diagram of the stresses around the underground powerhousesin Figure 2b. The (shear) stress contours are very concentrated in the low radius regions (corners) andmore extended in the high radius sections (walls).3 With the development of the Tunnel Boring Machine (TBM) the circular tunnel is now less of anidealization than in the past. The first TBM that successfully completed a tunnel was the Mitri Mole,used to excavate tunnels in the Pierre shale at the Oahe Dam site in 1955. A leading proponent ofthe TBM project at Oahe was the late Kenneth S. Lane, U.S. Army Corps of Engineers. The designerof the mole machine was J.S. Robbins, then a resident of St. Paul, Minnesota, who subsequentlydeveloped many TBMs for projects around the world, including the Channel Tunnel.4 Application of complex analysis allows some geometries other than circular to be studied (see forexample, Savin 1961)
4 Fairhurst and Carranza-Torres

from Figure 2, the technique provided excellent graphical visualization of the stressdistribution in the solid body. Obert and Duvall (1967) made extensive use of thistechnique to determine (and tabulate) stress concentrations around a variety of ex-cavation shapes and the influence of adjacent excavations on the stress distributions.With the rapid increase in the power of computers and numerical techniques, suchas the finite element method, interest in the photoelastic technique, which requiredcareful experimental and interpretation procedures, declined. It is rarely used today.
Today numerical analysis is applied ubiquitously in engineering. In exca-vation problems analysis of realistic excavation shapes, including three-dimensionaleffects (e.g., the influence of the tunnel face on stability) and inelastic deformationof the rock mass can be performed readily. Frequently, however, these analyses areperformed on a problem-by-problem basis, using the specific dimensions of the ex-cavation and specific rock mass properties, with results listed in direct dimensionalvalues. Although applicable to the particular situation considered, the general insightsgained from the analytical approaches tend to be obscured. The authors believe thatthere is considerable merit in using numerical analysis to extend the analytical re-sults in general form to explore practically interesting situations for which analyticalresults are not available. Some examples of this approach are presented below.
Several of the support design procedures developed in ‘pre-numerical’ timesare still in use today. This paper comments briefly on five such methods5:
• Elastic Analysis;• Terzaghi’s Rock Load;• Lang’s Reinforced Rock Unit;• Einstein-Schwarz’s Flexibility/Stiffness Ratio;• Convergence Confinement Method or
New Austrian Tunneling Method (NATM)
Elastic Analysis
Clearly, if an excavation requires support, then the rock behavior does not remainelastic. While this is true, elastic analysis can provide considerable insight intosupport design. The expressions for elastic stress distribution in Figure 1, for example,show that the stress concentrations in the medium decrease as the ratio (a/r)2 [wherea is the tunnel radius, r is the radial distance] in the case of a cylindrical tunnel, and as(a/r)3 in the case of a spherical cavity. This implies that the stress ‘disturbance’aheadof the elastic front of a tunnel (assuming that it can be considered to approximate ahemisphere) will be limited to the order of 1.0 ∼ 1.5 tunnel radii ahead of the face6
—i.e. 12% ∼ 4% change in stress. Similarly, the effect of a cylindrical tunnel on
5 Several empirical systems have also been developed, based on review and assembly of design datafrom a large number of completed tunnels, as design guides (e.g., Barton et al. 1974; Bieniawski1976). These are not reviewed here.6 Note that the center of the hemisphere incorporating the tunnel face would be at a distance of oneradius into the tunnel behind the face.
5 Fairhurst and Carranza-Torres

Figure 1. Some classical solutions for holes in elastic medium.
6 Fairhurst and Carranza-Torres

Figure 2. a) Stress patterns obtained from uniaxial tension of a plate cointaining acircular hole (after Frocht, 1941). b) Photoelastic model of excavations for a powerhouse (after Lang, 1962).
7 Fairhurst and Carranza-Torres

changing the pre-existing state of stress in the vicinity of the tunnel will be minimal( 11% ∼ 6%) beyond 3 ∼ 4 tunnel radii from the axis of the tunnel. Thus the loadsimposed on two parallel tunnels of the same diameter placed with their centers sayseveral tunnel radii apart can be considered to be independent of each other.
Figure 3 is a section showing the two main rail tunnels under the EnglishChannel, with the smaller service tunnel parallel to and midway between them. Itis possible to say at a glance that stresses around each of the main tunnels, spaced[30/4.2 �] 7 tunnel radii apart will not be significantly different [(1/7)2 � 2%] thanthe stresses around a single tunnel in the same rock. The service tunnel, distanceabout [15/4.2 �] 3.6 large tunnel radii from the center of the large tunnels, will besubjected to an increase in loading of roughly (1/3.6)2 � 8% due to each largertunnel —i.e. approximately 16% total increase in applied stress (the error in usingsuperposition here is negligible).
Figure 3. Typical cross-section of the railway tunnel system below the EnglishChannel.
Elastic analysis (including photoelasticity) has been used to attempt to op-timize the profile of excavations in competent rock. In the Kolar gold mines, nearBangalore, India, for example, an elliptical opening in which the major:minor axisratio was the same as the major:minor stress ratio was considered to be the moststable shape [Isaacson (1958)], since the tangential stress was constant around thetunnel wall (Figure 1c). While this is true, examination of the stress distributionbehind the periphery (Figure 5) reveals that the region of high stress is not constant[Carranza-Torres (1998)]. Thus, if the rock mass strength is lower than anticipatedso that inelastic deformation develops, then the region of failure will not be uniform.As seen in Figure 5, analysis of the region of inelastic deformation indicates thatrotation of the ellipse by 90◦ to the original orientation would result in a reductionof the inelastic region.
Analysis of the elastic stress distribution behind the tunnel periphery canprovide a reasonable indication of where inelastic deformation is likely to develop in
8 Fairhurst and Carranza-Torres

Figure 4. Damage to steel-setted drives due to rockburst in Champion Reef Mine(about 87 level), Kolar Gold Field, India (photographs reproduced from Caw, 1956).
9 Fairhurst and Carranza-Torres

Figure 5. a) Boundary of inelastic region for the ‘harmonic hole’ [case b/a = σ1/σ3
considered in Figure 1c]. b) Failure pattern for the same elliptical opening rotated90◦.
10 Fairhurst and Carranza-Torres

the event that failure does occur. Elastic analysis is frequently used in this mannerto provide a simple and informative ‘first estimate’ of the high stress regions wherepotential inelastic deformation may occur around excavations.
In the case of the excavations at Kolar, stress waves produced by rock burstingelsewhere in the mine resulted in overstressing and collapse of the excavations. Asseen in Figure 4, the extent of collapse is consistent with the shape of the high stressregion behind the periphery. [Note that the same shape of tunnel is being used torehabilitate the tunnels; this is permissible, since the region behind the tunnel is nowprotected from future overloading by a destressed region.]
Elliptical tunnels designed on the same principle, termed the ‘harmonic hole’concept, were also proposed when the BWIP (Basalt Waste Isolation Project) site,now abandoned, in highly stressed basalt in Washington State was being consideredby the U.S. Department of Energy as a potential repository for high-level waste. Theeffect of heat generated by the waste is an additional source of overstressing of therock around repository excavations. Figure 6 shows the extent of the inelastic regiondue to heating of an harmonic hole that initially was in elastic state due to far-fieldstresses. It is seen that the inelastic region develops in a pattern similar to that inFigure 5a.
Figure 6. Inelastic region due to heating of an harmonic hole. Note that before heatis applied the problem is fully elastic; thereafter, the inelastic region develops as inFigure 5a.
11 Fairhurst and Carranza-Torres

Figure 7. Inelastic zone around a circular tunnel for the case of non-uniform far-fieldstresses (after Detournay, 1983).
Elasto-Plastic Analysis
Analytical extensions of Lame’s elastic solution to include plastic deformation aroundthe cavity have been worked out by numerous authors for a variety of assumedmodels (e.g., Tresca, Mohr- Coulomb, dilatational and non-dilational models) of theplastic behavior of the material. Probably one of the most elegant and comprehensiveanalyses is that by presented by Salencon (1969). Most (pre-numerical) discussionsof inelastic deformation around tunnels start from these solutions, all of which, ofcourse, are restricted to the special case of uniform far-field stresses (i.e., the Lame’scase of Figure 1a).
12 Fairhurst and Carranza-Torres
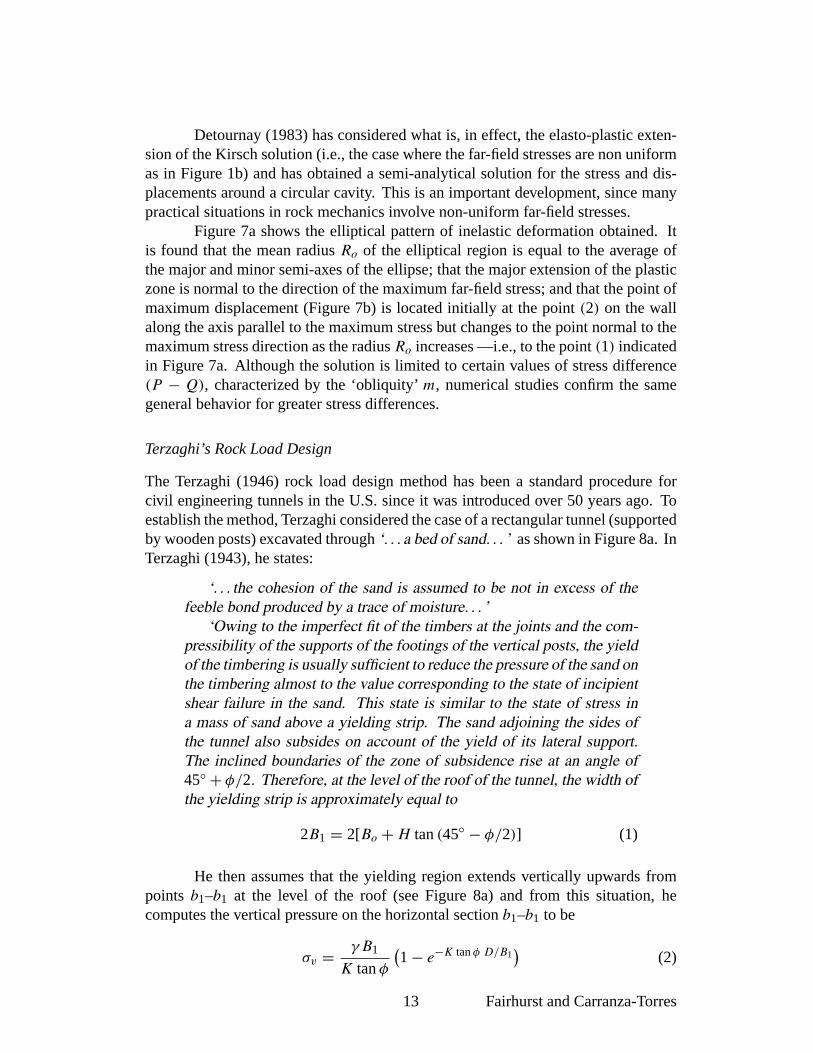
Detournay (1983) has considered what is, in effect, the elasto-plastic exten-sion of the Kirsch solution (i.e., the case where the far-field stresses are non uniformas in Figure 1b) and has obtained a semi-analytical solution for the stress and dis-placements around a circular cavity. This is an important development, since manypractical situations in rock mechanics involve non-uniform far-field stresses.
Figure 7a shows the elliptical pattern of inelastic deformation obtained. Itis found that the mean radius Ro of the elliptical region is equal to the average ofthe major and minor semi-axes of the ellipse; that the major extension of the plasticzone is normal to the direction of the maximum far-field stress; and that the point ofmaximum displacement (Figure 7b) is located initially at the point (2) on the wallalong the axis parallel to the maximum stress but changes to the point normal to themaximum stress direction as the radius Ro increases —i.e., to the point (1) indicatedin Figure 7a. Although the solution is limited to certain values of stress difference(P − Q), characterized by the ‘obliquity’ m, numerical studies confirm the samegeneral behavior for greater stress differences.
Terzaghi’s Rock Load Design
The Terzaghi (1946) rock load design method has been a standard procedure forcivil engineering tunnels in the U.S. since it was introduced over 50 years ago. Toestablish the method, Terzaghi considered the case of a rectangular tunnel (supportedby wooden posts) excavated through ‘. . . a bed of sand. . . ’ as shown in Figure 8a. InTerzaghi (1943), he states:
‘. . . the cohesion of the sand is assumed to be not in excess of thefeeble bond produced by a trace of moisture. . . ’
‘Owing to the imperfect fit of the timbers at the joints and the com-pressibility of the supports of the footings of the vertical posts, the yieldof the timbering is usually sufficient to reduce the pressure of the sand onthe timbering almost to the value corresponding to the state of incipientshear failure in the sand. This state is similar to the state of stress ina mass of sand above a yielding strip. The sand adjoining the sides ofthe tunnel also subsides on account of the yield of its lateral support.The inclined boundaries of the zone of subsidence rise at an angle of45◦ + φ/2. Therefore, at the level of the roof of the tunnel, the width ofthe yielding strip is approximately equal to
2B1 = 2[Bo + H tan (45◦ − φ/2)] (1)
He then assumes that the yielding region extends vertically upwards frompoints b1–b1 at the level of the roof (see Figure 8a) and from this situation, hecomputes the vertical pressure on the horizontal section b1–b1 to be
σv = γB1
K tan φ
(1 − e−K tan φ D/B1
)(2)
13 Fairhurst and Carranza-Torres
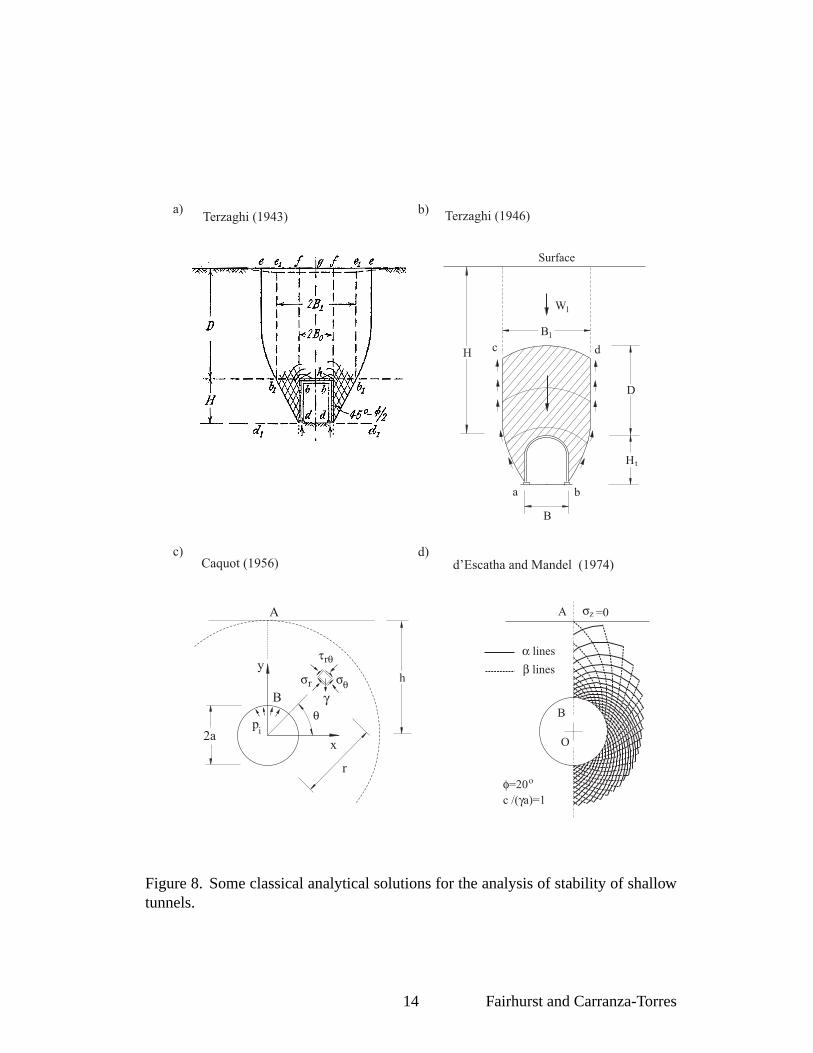
Figure 8. Some classical analytical solutions for the analysis of stability of shallowtunnels.
14 Fairhurst and Carranza-Torres
where K is an empirical coefficient he founds to be close to one7.
Caquot (1956) and d’Escatha and Mandel (1974) have analyzed essentiallythe same problem studied by Terzaghi, using more rigorous upper bound analyses.In this approach statically admissible stress fields are constructed to establish a valueof the support pressure that must be applied to the periphery of the (circular) tunnel toensure that it will remain in static equilibrium —i.e., the actual pressure at which thetunnel would collapse will be lower than the upper bound value calculated from thistheory. The two situations are illustrated in Figures 8c and 8d. [Note that d’Escathaand Mandel (1974) present the upper bound pressure values (for various friction andcohesion values) in graphical form only; Caquot (1956), on the other hand, providesclosed-form expressions to compute these values.]
A comparison of the predicted tunnel support pressure required for tunnelsof different depth (and similar soil conditions) for each of the methods discussed inFigure 8 is shown in Figure 9a. It is seen that the values predicted by the Terzaghimethod are considerably higher than the other two.
As noted above, the upper bound estimates should result in a pressure abovethe value at which the tunnel would start to fail. To check this, the finite differencenumerical code FLAC was used to simulate the effect of progressively reducing thesupport pressure on the wall of the circular tunnel until failure was induced. Theprocedure is summarized in Figure 9b. The figure shows the model corresponding toa circular tunnel located at a depth equal to three times the radius of the tunnel. Theinternal pressure is decreased in steps from the upper bound value given by d’Escathaand Mandel, until equilibrium of the model is not possible anymore.
For example, Figure 10 shows several stages during failure development asthe support pressure is reduced. It is to be noted that failure did not start until thepressure was reduced to [0.55/0.7 �] 80% the upper bound value calculated byCaquot and d’ Escatha and Mandel solutions.
It is perhaps worth noting that the classical manual ‘Rock Tunneling withSteel Supports’ (Terzaghi 1946) provided a table of estimated dimensions of ‘brokenground’ above the tunnel for various rock conditions —the shape of the broken zoneis the one shown in Figure 8b and it is similar to the one obtained with numericalmodels in Figure 10. The values were apparently based on observations of the degreeof crushing of wood blocking above steel supports in a number of tunnels. The tablehas since been modified to reduce the load values by Deere et al. (1969).
Lang’s Reinforced Rock Arch Design (1961)
Lang questioned the logic of installing a concrete arch lining in underground exca-vations for underground hydroelectric power plants, when the strength of the rockbeing excavated was comparable to that of the concrete. The reason was, of course,the probable existence of joints and fractures in the rock mass that may reduce the
7 Equation (2) is derived on essentially the same basis as that used by Lang in determining the effectof bolts in creating his Rock Reinforcement Units (RRU’s) —see equation (A-5) in Appendix A.
15 Fairhurst and Carranza-Torres

Figure 9. a) Comparison of the required support pressure obtained with the differentmodels in Figure 8. b) Numerical model used to determine the ‘actual’ value ofinternal pressure required for equilibrium.
16 Fairhurst and Carranza-Torres

Figure 10. Sequence of decreasing internal pressure that leads to the ‘collapse’ ofthe tunnel in Figure 9b (results obtained with FLAC).
17 Fairhurst and Carranza-Torres

strength considerably. These fractures do not exist in the concrete. Lang proposedto overcome this problem by creating, in the roof of the excavation, an arch regionwithin which any fractures would be ‘locked together’ sufficiently so that the archwould be stable. Locking would be obtained through a system of rock bolts in theroof. Although rock bolts were in use for temporary support of mine roadways, Langpioneered their use in large civil excavations.
Lang’s design seeks to create a system of reinforced rock units (RRU’s) inthe roof (see Figure A-1 in the Appendix A), creating an arch that is assumed to befree-standing and capable of supporting a region of ‘distressed rock’ above the arch(the weight of the arch is included as part of the total load to be supported by thearch). Lang used the Terzaghi Rock Load approach (Figure 8a) to determine themagnitude of the load to be transmitted to the bolt.
Figure 11. ‘Voussoir’ arch formed by reinforced rock units (after Lang, 1961).
The principle of the RRU is illustrated in Appendix A where the calculationfor an unreinforced rock unit (i.e., no rock bolt is installed as shown in Figure A-1b) is presented in detail. In this case, the calculation determines the minimumsupport needed at the lower face of the unit to prevent collapse/fallout of the unit.This passive support could be provided, for example, by a simple prop. Lang thencalculates the effectiveness of a simply anchored bolt (Figure A-1c) in providing therequired passive support. The paper Lang and Bischoff (1984) contains a detaileddiscussion of this method, including analysis of grouted and pretensioned bolts. It isshown, for example, that the optimum reinforcement is achieved with a bolt length[L] that is not more than three times the bolt spacing.
18 Fairhurst and Carranza-Torres

Bolting across the roof of an excavation in accordance with these rules, hecreates a reinforced arch. Each of the RRU’s is considered to act in a manner analo-gous to the masonry voussoirs in classical masonry arch construction (as representedschematically in Figure 11). Invoking design rules established by Coulomb (1776)—see Heyman (1972)— Pippard et al. (1939a, 1939b, 1941) and Kooharian (1952),Lang defines a zone of uniform lateral compression (developed by the bolting) inthe central region of the arch. Under an (assumed) uniformly distributed load ofdistressed rock above the arch, the thrust line is parabolic. Figure 11 shows the RRUvoussoir arch and the limiting parabolic thrust lines [DEFG; ABC]. Provided thethrust line is fully contained within the reinforced voussoir ring, the actual (parabolic)arch is everywhere in compression and will be stable (details of the computationalprocedure are described in Lang and Bischoff 1984).
Although the authors have not yet completed a numerical analysis of Lang’smethod, it appears that it has a number of conservative features in common withTerzaghi’s method. The rock mass is not a free standing arch, and hinge failure(the reason for restriction of the thrust line location) is not likely in the rock mass.Study of the Lang method and comparison with the convergence-confinement loadprediction for the same reinforcement system is continuing.
Einstein-Schwartz Flexibility/Stiffness Design (1979)
The design procedure proposed by Einstein and Schwartz (1979) is very similar to theRanken and Ghaboussi (1975) method described in the ASCE Guidelines for TunnelLining Design (see American Society of Civil Engineering 1984).
The problem examined is that of support design for a circular tunnel in rocksubjected to unequal principal in-situ stresses in the plane perpendicular to the axisof the tunnel (Figure 12a) —i.e., the problem is similar to that considered by Kirsch(1898), but in this case deformation of the hole is constrained by an elastic annularring representing a liner.
Einstein and Schwartz assume, in essence, that the circular support is installedin intimate contact with the rock before the in-situ stresses are relaxed (i.e., beforethe tunnel is excavated, and that the full in situ stresses are applied to the support).Several situations are examined, e.g., conditions of i) a smooth (frictionless) or full-slip interface; ii) a rough, or no-slip, rock-support interface. The real situation willlie between the two, so that examination of the two extremes should serve to boundthe loads on the support8.
8 The assumption that the support is subject to the effect of the full in situ stresses would appear, atfirst sight, to be conservative since, in reality, some initial deformation of the rock will occur beforethe support can be installed.
The above situation is, however, oversimplified since rock, when exposed to the tunnel environ-ment (e.g., stress concentrations, air, moisture, etc.), tends to degrade progressively with time. Theempirical Stand-Up Time rule (Lauffer 1958), for example, provides estimates of the length of timethat an excavation can stand unsupported before collapse —depending on rock type, jointing, sizeof excavation, groundwater conditions, etc. The degradation processes will occur, at least to some
19 Fairhurst and Carranza-Torres

Figure 12. Rock-support elastic interaction problem considered by Einstein andSchwartz (1979).
20 Fairhurst and Carranza-Torres

In the Einstein and Schwartz solution, the variation in thrust and bendingmoment on the support is expressed in terms of two dimensionless parameters, theCompressibility ratio [C∗] and the Flexibility ratio [F ∗] —see Figures 12b and 12c.For a given support, these ratios are determined essentially by the stiffness (or de-formability) ratio of the rock mass and the support [Er/Es] —which has been usedin our study as the basis for comparison of results.
In our study we have examined the implications of inelastic deformationproduced by the applied stresses on the predictions of the Einstein and Schwartzsupport design. The problem is formulated in terms of dimensionless variables similarto those used by Einstein and Schwartz in order to retain the valuable attribute ofease of assessment of the effect of variability (uncertainty) in rock properties. Sincewe now consider inelastic deformation of the rock-mass, we need also to define acriterion of failure for the rock-mass. This was not required in the original analysisby Einstein and Schwartz, since the rock-mass was assumed not to fail.
The problem considered in our analysis is shown in Figure 13a. The figurerepresents a section of circular tunnel of radius R lined with a closed annular supportof thickness ts —the support is considered to be elastic with a Young’s modulusEs and a Poisson’s ratio νs . The rock-mass is assumed to satisfy the Hoek-Brownfailure criterion (the ‘failure zone’ indicated in Figure 13a corresponds to rock thathas undergone plastic deformation according to this criterion). In particular we haveused a scaled form of the Hoek-Brown failure criterion originally proposed by Londe(1988). [A detailed discussion of the Hoek-Brown failure criterion and this particularform of scaling is included in Appendix B.]
The tunnel is assumed to be deep enough that variation of vertical loadingacross the height of the excavation can be ignored. The far-field stresses are definedby the principal stresses σh in the horizontal direction and σv in the vertical direction.The stress state is characterized by a mean stress σo and a horizontal-to-vertical stressratio k,
σo = σh + σv
2k = σh
σv(4)
extent, even in the presence of support, so loading of the support will occur with time.An approach sometimes used in support design to account for this degradation process is to define
a long-term modulus of the rock, Etr , by the empirical expression
Etr = Ei
r
1 + F(t)(3)
whereF(t) is some arbitrary function that results in a specified reduction of the instantaneous modulusover the long term. Thus, Et
r may be taken as some fraction (say 0.1 ∼ 0.3) of Eir depending on
the rock and the judgment of the designer. This approach has been discussed by Muir Wood (1975).Thus, a ‘pseudo-elastic’ loading after installation of the support can be postulated as appropriatefor use in the Einstein and Schwartz method. In reality, however, this progressive rock degradationimplies irreversible or inelastic degradation. Given that the Einstein and Schwartz method considersthe situation in which the applied (in-situ) rock stresses are unequal (i.e., non-hydrostatic), it seemsprobable that the degradation would also vary with angular orientation around the support. The loadsimposed on the support due to the degradation would thus be similarly non-uniform.
21 Fairhurst and Carranza-Torres

Figure 13. a) Section of lined tunnel in inelastic material, subject to non-uniformfar-field stresses. b) Comparison of thrust distribution on the lining as obtainedwith Einstein and Schwartz (1979) elastic solution and with elasto-plastic numericalmodels.
22 Fairhurst and Carranza-Torres
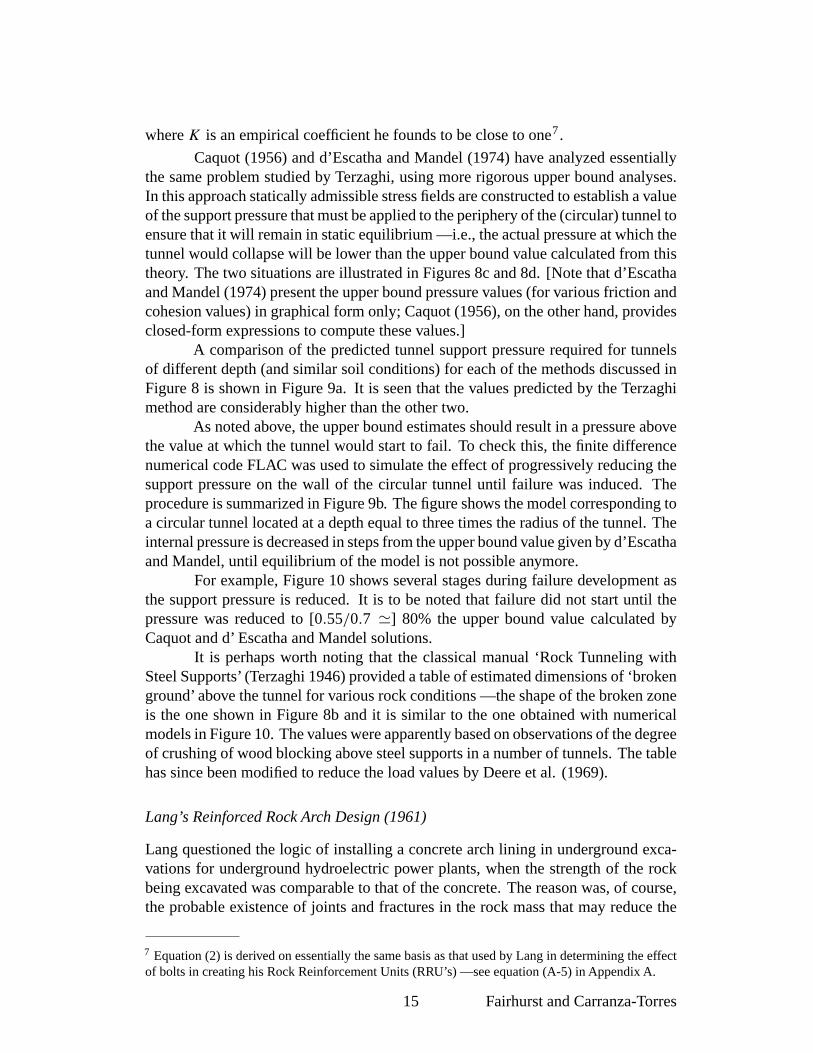
Figure 14. Comparison of a) bending moment and b) radial displacement of thethe lining as obtained with Einstein and Schwartz (1979) elastic solution and withelasto-plastic numerical models.
23 Fairhurst and Carranza-Torres

Note that, from equation (4), the far-field stresses are uniform (or hydrostatic) ifk = 1 and, non-uniform (or non-hydrostatic) if k = 1.
The goal of the analysis is to determine the distribution of thrust Ts , bendingmoment Ms and radial displacement us on a section of support of unit length asa function of the angle θ (see the sketch on the right in Figure 13a) for the casesin which i) the rock-mass remains elastic and ii) the rock-mass fails (i.e., deformselasto-plastically).
Considering the symmetry of the problem with respect to horizontal andvertical planes containing the axis of the tunnel, the loads and displacements arerecorded at three sections of the support, indicated as ‘R’, ‘D’ and ‘W’ in Figure 13a(corresponding to ‘Roof’, ‘Diagonal’ and ‘Wall’ respectively).
The support is assumed to be connected rigidly to the surface of the rock-mass(i.e., it is assumed that no slip occurs at the rock-support interface). The analysis alsoconsiders an ‘instant’ transfer of loads from the rock-mass to the support. Since thisimplies that the beneficial effect of the position of the face is not taken into account,the calculated loads on the support are sometimes assumed to be overestimated by this(Einstein and Schwartz) method —see, for example Panet (1995). [The discussionin footnote 8, page 19, on long-term degradation suggests that this overestimate maybe less than indicated.]
Figures 13b and 14 show results obtained with FLAC comparing the Einsteinand Schwartz elastic predictions with those for the case where inelastic deformationoccurred with significant (30°) dilation.
It is seen that, i) for cases in which the Rock Mass Rating RMR (Bieniawski1976) or GSI (Hoek and Brown 1997) characterizes a rock-mass as ‘Poor’ to ‘VeryGood’ (e.g., values of rock-support deformability ratio Er/Es ranging from 10−2
to 10 —see Appendix B) the design of tunnel supports based on the assumptionof elastic behavior as described by Einstein and Schwartz can lead to significantunderestimation of the loads and deformations induced on the support (Figures 13band 14). ii) For rock-masses characterized as ‘Very Poor’(e.g., values of rock-supportdeformability ratio Er/Es below 10−2) the Einstein and Schwartz design approachcan lead to overestimation of the loads and deformations on the support —i.e., theapproach is conservative.
A full discussion of the consequences of inelastic deformation on the Einstein-Schwartz method is given in Carranza-Torres and Fairhurst (2000a).
Convergence-Confinement Design and the New Austrian Tunneling Method
The so-called New Austrian Tunneling Method (NATM) evolved during the 1950’sand early 1960’s, stimulated by the work of the Austrian civil engineers Rabcewicz,Muller, Pacher, Golser and colleagues involved in driving of transportation tunnelsthrough the Austrian Alps. The NATM differs from the methods discussed above inthat the support load required to stabilize the excavation is considered to vary withinward convergence of the tunnel, and is not prescribed in advance; rather the supportis varied on site as required to ensure that the excavation is stable. Calculation of the
24 Fairhurst and Carranza-Torres

required support is a statically indeterminate problem, and is assessed by examinationof the rock-support interaction as described by convergence-confinement curves.
The theoretical basis of convergence-confinement analysis has been describedand used in tunnel support design well before the NATM was introduced —e.g.,Fenner (1938), Labasse (1949), Talobre (1957), Kastner (1962). The contributionof the NATM was to develop practical tunneling support procedures, based on theconvergence-confinement principle, which allowed the support to be optimized onsite.
Figure 15. Forces acting on an elementary wedge in the vicinity of an excavation.
The convergence-confinement philosophy can be illustrated by consideringthe simple case of a circular excavation in a homogeneous rock subject to uniformin situ stress —as in the case of Lame’s solution in Figure 1a. A uniform radialpressure (the support) is applied at the wall of the tunnel. Consider a wedge-shapedelement of the rock bounded by two lines radiating from the center of the tunnel andtwo circumferential lines, in the vicinity of the excavation, as shown in Figure 15.Prior to excavation, each face of the wedge will be subject to the same uniform forceacting normal to the face. Excavation of the tunnel will reduce the force acting radiallyoutward on the inner face. The force on the outer face will be reduced also, but lessso than on the inner face. The unbalanced radial force will cause the element to moveradially towards the excavation. This will ‘tighten the wedge’ —i.e., the tangentialforce acting on the sides of the wedge will increase. A (small) component of thetangential force is directed radially outward, tending to reduce the net inward radialforce. The wedge will tighten (i.e., displace towards the center of the tunnel), and thetangential stress will increase correspondingly until the wedge comes to equilibriumwith the radial (support) pressure on the wall of the excavation. If the support pressureis reduced, the wedge will displace further towards the tunnel until the forces are againin equilibrium. As long as the tangential stress continues to increase as the wedge
25 Fairhurst and Carranza-Torres
displaces radially inwards, then the tunnel will find an equilibrium position as thesupport pressure is decreased. Note that this may be true whether the rock deformselastically or inelastically. A lower rate of tangential stress increase with deformationsimply implies that the radial displacement (convergence) will be greater before anequilibrium condition is reached. In some cases the tangential stress may reach anupper limit beyond which the wedge may ‘fail’. This may cause various results suchas pore collapse in the case of a porous rock —e.g., reaching the shear strength ofthe material, slip along a joint traversing the wedge, etc. In such cases, the supportpressure must be increased if stability of the excavation is to be maintained.
[Readers familiar with continuum mechanics will be aware that the above (lengthy)description can be summarized in a single line by the equation of radial equilibrium,used, for example, to derive the Lamé solution for an elastic medium (see Figure1a).]
Figure 16a shows the typical form of the convergence–confinement diagram,which is usually derived for the case of a circular tunnel in homogeneous isotropicrock under uniform insitu stress [po]. Curve PB, often referred to as the Ground Re-action Curve, or GRC, indicates the radial deformation [ur ] that would develop whenthe tunnel came to equilibrium with a radial support pressure [pi]. The initial segmentPA indicates elastic deformation; AB corresponds to stable inelastic deformation; BCindicates the onset of unstable deformation (referred to by Austrian designers as theregion of ‘loosening pressure’). Kovari (2000) has argued recently that there is nofundamental justification for this loosening regime. It is easily shown, however, thatan ascending portion of the curve at larger convergence is entirely possible, espe-cially in the roof of a tunnel if the rock cohesion declines with deformation, andgravitational loads begin to dominate in determining the required support pressure[Daemen (1975)].
The shape and magnitude of the Support Characteristic (SC) —see the threecurves indicated as SC in Figure 16a— varies considerably depending on the type ofsupport and the amount of convergence that has occurred prior to support installation.In the simplest case, of a uniform elastic ring installed around the tunnel periphery,the SC is a straight line as determined from the expression for the radial deformation[ur ] of a thin shell loaded externally (i.e., at the rock-support interface) by the radialpressure [pi].
Figure 16b shows a series of support characteristics for circular steel supportswith various spacings of wood blocking between the rock and the steel ring. Thecharacteristic for a thin layer of shotcrete is included for comparison (Daemen 1975).The relatively low stiffness of the steel/wood block combinations arises due to thedominance of the low stiffness of the wood blocking in determining the overallSupport Characteristic. Hoek and Brown (1980) discuss the procedure to estimatethe stiffness. Although the intrinsic stiffness of the shotcrete is much lower than thatof the steel, the fact that it is applied directly to the rock, (i.e., with no interveningblocking) results in a stiffer overall support.
Figure 17 shows a series of Ground Reaction Curves [Daemen (1975); Fairhurst
26 Fairhurst and Carranza-Torres

Figure 16. a) Interaction between ground reaction curve (GRC) and support charac-teristic (SC) around underground excavations. b) Support characteristics for varioussupport systems.
27 Fairhurst and Carranza-Torres
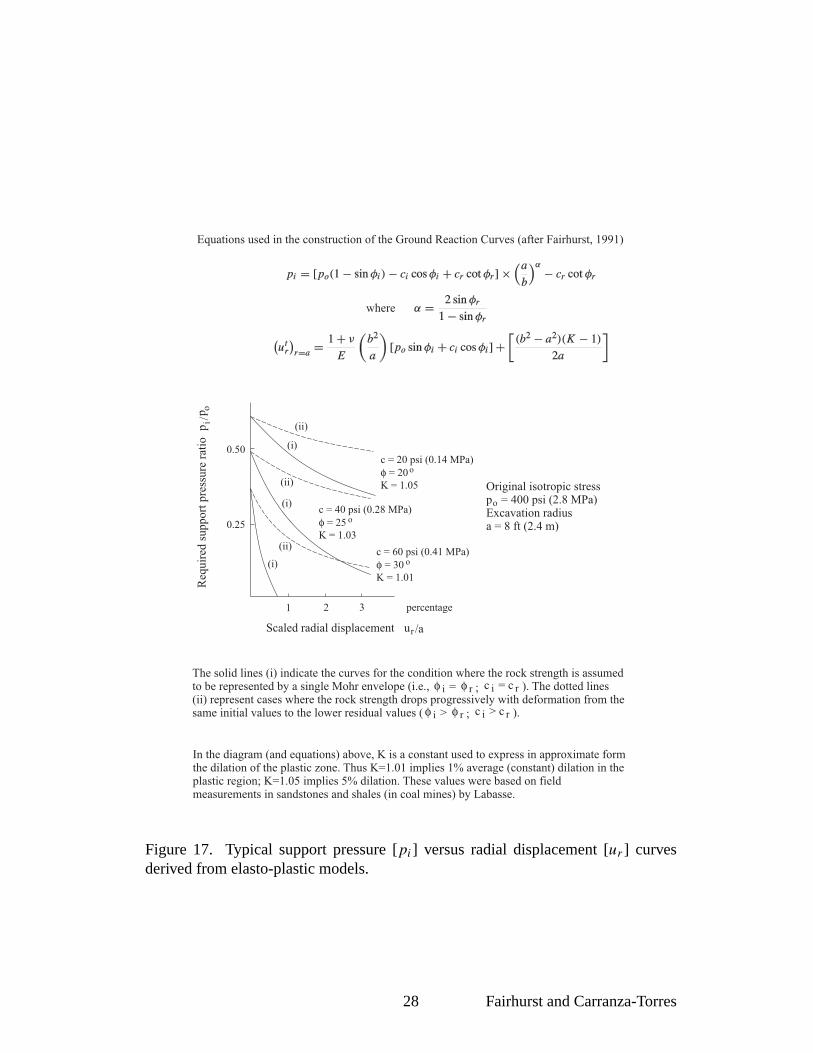
Figure 17. Typical support pressure [pi] versus radial displacement [ur ] curvesderived from elasto-plastic models.
28 Fairhurst and Carranza-Torres

Figure 18. Ground reaction curves as the basis for observation and assessment of thestability of a tunnel.
(1991)] calculated for circular excavations in several hypothetical rock types underuniform loading conditions. Two conditions are shown: (i) where the rock cohesionis constant, independent of deformation; and (ii) where the cohesion decreases lin-early with deformation beyond the peak strength of the rock to a residual cohesion.It is seen that the support pressure required for equilibrium can increase considerablywhere cohesion decreases; or, equivalently, the amount of convergence may increaseconsiderably if the support pressure is small. Loss of cohesion with inelastic defor-mation can be gradual in softer rocks (clays and some sedimentary species) or abruptin more brittle rocks. It is also clear that, if the cohesion of the rock decreases to zero(this will occur first at the tunnel periphery), then the tunnel will inevitably collapse9.
9 Consider a small annulus %r around the tunnel periphery where the cohesion has declined to zero(see, for example, Figure 15). In a cohesionless material, the tangential stress will be proportionalto the radial stress. If the radial stress is zero —i.e., the tunnel is unsupported— then the tangentialstress will also be zero. This annulus carries no load. It corresponds, in effect, to an enlargement ofthe tunnel. Since the tunnel is in an infinite medium, the stress distribution around the tunnel, now ofradius, r +%r , will be the same as for the tunnel radius r . A new annulus will fail-and the process is
29 Fairhurst and Carranza-Torres

Consider the GRC and SC represented in Figure 18a. The support starts toabsorve load (i.e., it is installed in place) when the element of tunnel at the peripheryhas undergone a radial deformation, (ur)C . The rate at which the convergence willincrease will be proportional to the difference in pressure (force) between the GRCand the SC. This rate will decline as the equilibrium convergence is approached. Inthe case of an inadequate support (the case of the ‘unstable’ GRC in Figure 18a), therate will tend to increase beyond the minimum of the GRC. Regular monitoring ofconvergence rates will thus allow the engineer to assess the adequacy of the supporton site, even though the actual magnitudes of the GRC and SC may not be known!
If a condition of impending instability is detected (Figure 18b), then addi-tional support, such as an additional layer of shotcrete, can be applied to ‘stiffen’(i.e., increase the slope of) the SC, in order to achieve stability. Thus, successfulapplication of the convergence-confinement method implies a support system that iscapable of adapting quickly to rock conditions as they are revealed at the tunnel face,awareness of the importance of maintaining the integrity of the tunnel periphery, andregular monitoring of the convergence rate to ensure that stability is assured —eitherpermanently or, in poor conditions, long enough to allow the installation of morerobust permanent support. Although loads on the supports are estimated to guide inthe selection of the support system, on site control of deformation (convergence) isthe focal point of the method.
Another application of the convergence-confinement method to the assess-ment of tunnel stability conditions is presented by Hoek in his recent Terzaghi lecture[Hoek (2001)]. Figure 19 —reproduced from the article— shows a classification ofthe degree of difficulty associated with tunnelling through difficult ground conditionsconstructed, effectively, in terms of ground reaction curves. An interesting aspectof this classification is that ‘squeezing problems’ for tunnels are predicted in termsof dimensionless groups of variables (the ratio of far-field stress and strength of therock and a dimensionless measure of the closure of the tunnel —i.e., the ratio of wallconvergence and tunnel radius, referred to as the strain).
The construction of the ground reaction curves in Figures 16 through 18requires the consideration of a ‘failure’ model for the material. In particular, theground reaction curves of Figure 17 assume a linear Mohr-Coulomb failure criterionlike the one represented in Figure 20a.
Non-linear models describing the failure of the rock are commonly usedin tunnel engineering practice. Among them, the Hoek-Brown failure criterion is
repeated without limit —i.e., the tunnel collapses totally. If, however, the annulus around the originaltunnel retains some cohesion, albeit small, then a tangential stress will develop and the tunnel willbe stable (although in some cases the convergence may be more than is acceptable). This illustratesthe importance of maintaining some integrity of the tunnel wall. This is especially true when rockbolts are the primary support. Special attention must be paid to prevention of fallout and ‘unraveling’(e.g., by use of wire mesh between the bolts) especially in broken rock, prior to placing of additionalsupport such as shotcrete.
30 Fairhurst and Carranza-Torres

Figure 19. Tunnelling problems associated with different levels of strain (after Hoek,2001).
31 Fairhurst and Carranza-Torres

Figure 20. a) Linear Mohr-Coulomb and b) Non-linear (parabolic) Hoek-Brownfailure criteria.
32 Fairhurst and Carranza-Torres

the most widely known. Figure 20b represents the parabolic relationship betweenprincipal stresses defined by this criterion. The fundamental parameters describingthe strength of rock are the unconfined compression strength σci of the intact rock,and the parameters mb, s and a. [Appendix B presents a detailed discussion on theHoek-Brown failure criterion.]
Construction of the ground reaction curves for rock masses that satify theHoek-Brown failure criterion can be conveniently simplified by application of adimensionless transformation proposed by Londe (1988) (see Appendix B).
A dimensionless solution for the construction of the ground reaction curvesusing Londe’s transformation has been presented in Carranza-Torres and Fairhurst(1999). The solution will be briefly discussed here together with a practical example.
Consider the section of a cylindrical tunnel of radius R subject to uniformfar-field stress σo and internal pressure pi shown in Figure 21a. The rock mass isassumed to satisfy the Hoek-Brown failure criterion represented in Figure 20b.
The uniform internal pressure pi and far-field stress σo are scaled accordingto Londe’s transformation (equation B-8), to give the scaled internal pressure Pi andthe scaled far-field stress So respectively,
Pi = pi
mbσci+ s
m2b
(5)
So = σo
mbσci+ s
m2b
(6)
The pressure pcri marks the transition from elastic to plastic behavior of the
rock mass —i.e., for an internal pressure pi > pcri the rock remains elastic, and for
pi < pcri a plastic region of radius Rpl develops around the tunnel. [Note that the
pressure pcri defines the point A in the GRC of Figure 16a.]
The transformed critical (internal) pressure P cri for which the elastic limit is
achieved is given by the following expression,
P cri = 1
16
[1 − √
1 + 16So]2
(7)
The actual (i.e., non-scaled) critical pressure is found from the inverse of equation(5), i.e.,
pcri =
[P cri − s
m2b
]mbσci (8)
Provided pi > pcri , the relationship between wall displacement uwall
r and theinternal pressure pi in the elastic part of the GRC (i.e., segment AP in Figure 16a) isgiven by the equation,
uwallr = σo − pi
2Grm
R (9)
where Grm is the shear modulus of the rock-mass defined by equation (B-10).For values of internal pressure pi < pcr
i , the extent of the plastic region Rpl
33 Fairhurst and Carranza-Torres

Figure 21. a) Tunnel excavated in a Hoek-Brown material. b) Scaled critical pressureP cri as a function of the scaled far-field stress So —the critical pressure P cr
i corre-sponds to the pressure for which the plastic region of radius Rpl starts to developaround the tunnel.
34 Fairhurst and Carranza-Torres

that develops around the tunnel is
Rpl = R exp[2
(√P cri − √
Pi
)](10)
To define the plastic part of the Ground Reaction Curve (i.e., the curve AB inFigure 16a) a flow rule for the material is needed. The flow rule defines the relation-ship between the strains that produce distortion and those that produce volumetricchanges, as plastic deformation occurs in the material —see for example Atkinson(1993). In underground excavation practice, the flow rule is usually assumed to belinear, with the magnitude of volumetric change characterized by a ‘dilation’ angleψ , such that, if ψ = 0◦, the material undergoes no change in volume during plasticdeformation; if ψ > 0◦, the volume increases during plastic deformation.
In the solution described here, the flow rule will be characterized by a dila-tion coefficient Kψ , that is computed from the dilation angle, ψ , according to theexpression Kψ = [1 + sinψ] / [1 − sinψ]. [Note, for example, that for ψ = 0◦ thedilation coefficient is Kψ = 1 and for ψ = 30◦, the coefficient is Kψ = 3.]
With the flow rule characterized by the dilation coefficient Kψ , the plasticpart of the GRC —i.e., the segment AB in Figure 16a, is given by
uwallr
R
2Grm
σo − pcri
= Kψ − 1
Kψ + 1+ 2
Kψ + 1
(Rpl
R
)Kψ+1
(11)
+ 1 − 2ν
4(So − P cri )
[ln
(Rpl
R
)]2
−[
1 − 2ν
Kψ + 1
√P cri
So − P cri
+ 1 − ν
2
Kψ − 1(Kψ + 1
)2
1
So − P cri
]
×[(Kψ + 1) ln
(Rpl
R
)−
(Rpl
R
)Kψ+1
+ 1
]
where ν is the Poisson’s ratio for the rock mass.[A full discussion, with derivations, of equations (5) through (11) is contained inCarranza-Torres and Fairhurst (1999). The equations have been presented here with-out details in order to focus on their use in obtaining ground reaction curves for theHoek-Brown failure criterion.]
The dimensionless solution presented above can be conveniently summarizedin dimensionless charts. For example, Figure 21b defines the transformed criticalinternal pressure P cr
i as a function of the transformed far-field stress So. Figures 22aand 22b define the extent of the failure region and the scaled convergence at the wallin terms of So. The use of these dimensionless relationships will be illustrated withthe following practical example.
Consider the tunnel of radius R = 3.82 m exacavated at a depth of ∼ 1200 min a rock mass of mean unit weight γ = 25 KN/m3 (Figure 23a). The far-field stress
35 Fairhurst and Carranza-Torres

Figure 22. Dimensionless charts for the determination of a) radius Rpl of the plasticzone and b) radial convergence uwall
r of wall.
36 Fairhurst and Carranza-Torres
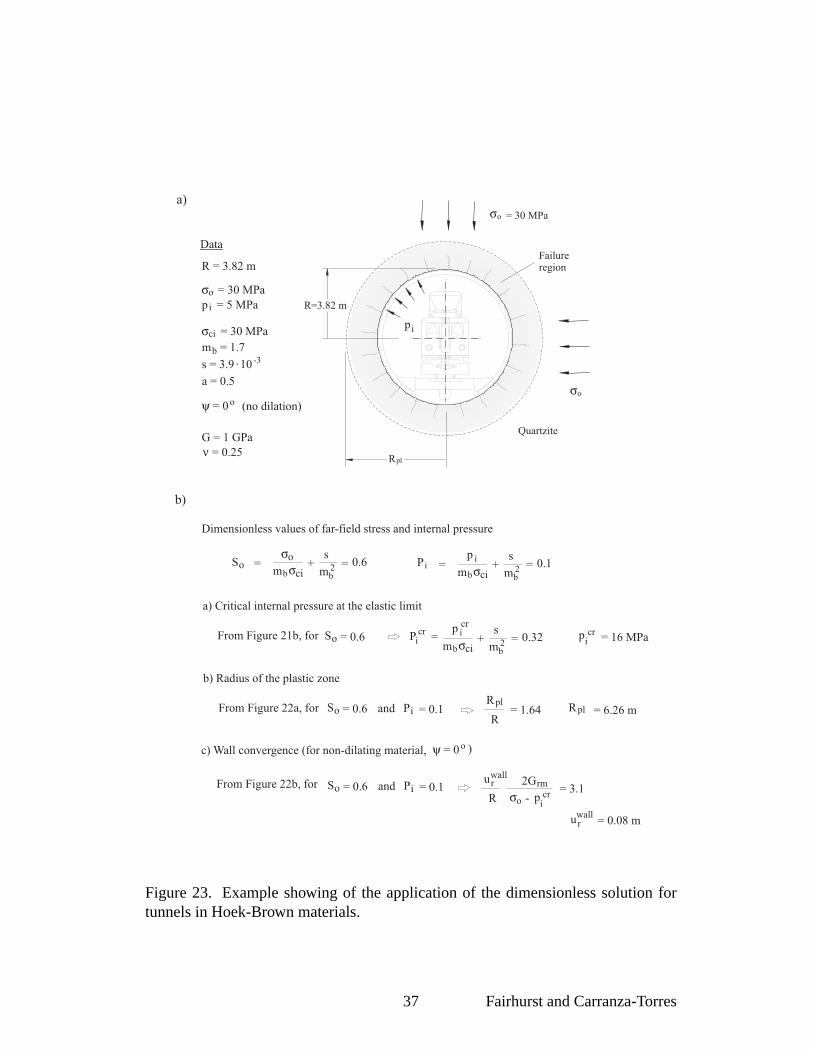
Figure 23. Example showing of the application of the dimensionless solution fortunnels in Hoek-Brown materials.
37 Fairhurst and Carranza-Torres

at that depth is σo = 30 MPa. We wish to determine the extent of the failure zoneRpl
and the convergence for a value of internal pressure pi = 5 MPa. The rock mass hasbeen classified in terms of the Hoek-Brown parameters σci = 30 MPa, mb = 1.7,s = 3.9 × 10⁻³, a = 0.5, ψ = 0◦, Grm = 1 GPa and ν = 0.25 (see Figure 23a).
For the given data, the scaled far-field stress and internal pressure are
So = σo
mbσci+ s
m2b
= 0.6
Pi = pi
mbσci+ s
m2b
= 0.1
The scaled critical internal pressure P cri at which the elastic limit of the rock
mass is reached, can be read from Figure 21b (see equation 7),
P cri = 1
16
[1 − √
1 + 16So]2 = 0.32
From this expression, the critical internal pressure pcri is found to be pcr
i =16 MPa. Since the internal pressure for this problem is pi = 5 MPa [< 16 MPa], aplastic region will develop around the tunnel.
The scaled extension Rpl/R of failure region can be read from Figure 22a(see equation 10),
Rpl
R= 1.64
Since the tunnel has a radius R = 3.82 m, the radius of the failure zone isRpl = 6.26 m.
The scaled radial displacement at the wall of the tunnel can be obtained fromFigure 22b (see equation 11), and it results to be,
uwallr
R
2Grm
σo − pcri
= 3.1
Replacing the (known) values of the variables on the left side of the expressionabove, the wall convergence is finally found to be uwall
r = 0.08 m.
In the example just discussed, we have considered the particular case of internalpressure pi = 5 MPa. To construct a full ground reaction curve —e.g., the curve PBin Figure 16a— the same procedure is applied for decreasing values of pi , rangingfrom σo to zero. Examples of construction of ground reactions curves for tunnels inHoek-Brown materials are presented in Carranza-Torres and Fairhurst (2000b).
“Closing the Circle” (1)
The discussion above has emphasized the importance of continuity of the tangentialstress around an excavation to ensure stability (see footnote 9 on page 29).
Frequently, in poor quality rock, the excavation may be carried out in sev-
38 Fairhurst and Carranza-Torres

eral stages —e.g., heading and bench or several smaller profiles are excavated andsupported separately before being connected to form the final section.
A central rule of NATM, espoused by Rabcewicz and his colleagues was ‘closethe circle’ as soon as possible. Often this referred to early placement of the invertsection of a lining to provide lateral stability to the vertical legs of the support. In allcases, however the message was, in effect, ‘ensure continuity of tangential stressesin the rock and/or in the supports around the excavation’. Loss of this continuityrisks the onset of instability. This simple practical guide is entirely consistent withthe principles of the Convergence-Confinement method.
Discrete or discontinuum mechanics
The period of 1950 ∼ 1960 saw considerable activity worldwide in large-scale civilengineering projects, particularly in dams and hydropower development, and in deepopen-pit mining. Stability of large slopes in jointed rock was a prime concern, andclassical soil mechanics analyses were not appropriate. The possibilities of usingnuclear explosives in major civilian earth-moving projects (e.g., excavation of a newPanama canal) was also under consideration. The mechanics of deformation ofassemblages of large discrete blocks was an important concern for these and similarproblems.
The growing power of computers suggested that ‘tracking’ the large numberof interactions between individual blocks and the resulting motion and deformationof the block assemblies might be possible. Discrete or discontinuum codes weredeveloped and discontinuum mechanics is now a vital field of study. Two —andthree— dimensional numerical codes such as UDEC (Universal Distinct ElementCode) and its three-dimensional counterpart 3DEC [Cundall (1988); Hart, Cundall,and Lemos (1988)] are commercially available and widely used for study of thedeformation of blocky and jointed rock. They complement a large number of powerfulcontinuum codes.
Interactions between assemblies of discrete solids are also of considerablesignificance on the small scale. Computational schemes similar to those for largeblocks assemblages can be used, and microparticulate codes such as the ParticleFlow Code (PFC), and its three-dimensional counterpart PFC3D [Cundall and Strack(1979); Cundall (1987)], are now providing valuable new insights to problems in rockmechanics where continuum mechanics has been of limited utility.
The ‘microparticle’codes assume that forces and deformations are transmittedthrough the solid via particle to particle interface contacts. Frictional slip and tensionscan occur, and cementitious bonding around the contacts can be included. Theappropriate properties of the contacts are deduced by calibrating the response of asimulated particulate specimen against laboratory compression tests results.
The power of PFC analysis is well illustrated by the results of simulation ofthe rock breakout in drifts of the Underground Research Laboratory (URL) ofAtomicEnergy of Canada Limited at Pinawa, Manitoba, Canada [Cundall (1998); Potyondy
39 Fairhurst and Carranza-Torres

Figure 24. Discrete particle modeling of the Mine-by Tunnel (URL) showing: (topleft) view of the mine-by tunnel after excavation; (top right) microcracks that haveformed in a very fine resolution PFC2D simulation after 2 months of stress corrosion—i.e., time dependent degradation of rock strength; (bottom left) seismicity recordedduring excavation of round 7; (bottom right) seismicity ‘recorded’ in a coarse reso-lution PFC2D simulation. (Courtesy of Atomic Energy Canada Ltd.)
40 Fairhurst and Carranza-Torres

Figure 25. Discrete particle modelling of the impact forces generated by a block ofrock that detaches from the roof and falls into a radioactive waste package.
41 Fairhurst and Carranza-Torres

and Cundall (1998)].The drift is excavated in the Lac du Bonnet granite and used to assess the
suitability of granite as a high level nuclear waste repository. Due to the high stressenvironment, the drift, originally circular, fractured extensively in the roof and flooras seen in the top photographs in Figure 24. Such fracturing is of concern since afractured region adjacent to the tunnels could provide a high permeability pathway forwater to come into contact with the waste. Continuum analyses were unsuccessful inpredicting the zone of fracturing accurately, and PFC analyses was introduced. Figure24 summarizes the results. PFC code is a dynamic code —as are FLAC/FLAC3D andUDEC/3DEC— so that it is possible to compute the microseismic energy released dueto breakage of interparticle bonds during the loading process. The lower diagrams inFigure 24 show a comparison between the predicted and observed microseismicity,for the predicted and observed damage zone. The agreement is very encouraging.
Figure 25 shows the result of using PFC to examine the impact forces gener-ated on a nuclear waste canister in an open drift (the design proposed for a repositoryat Yucca Mountain, Nevada), due to a block of rock falling from the roof [Hart andFairhurst (2000)]. In the initial PFC model, the rock block was deformable, but couldnot break. The resulting impulse on the canister is shown in the diagram of Figure25. The peak force is approximately 14 kN. This is high enough to cause concernthat the canister could sustain serious damage. In the second model, the same blockconsists of an assemblage of particles with bond properties selected to provide therock modulus and strength properties appropriate to the tuff at Yucca Mountain. Inthis case the rock breaks upon impact. A significant fraction of the initial momentumof the falling block is ‘trapped’ in the fragments of broken rock and hence the peakforce on the canister is reduced by a factor of almost 4. In this case, the canister isable to withstand the impact without serious damage.
“Closing the Circle” (2)
Apparently, a major obstacle to the extension and application of Newtonian moleculartheory of structure of bodies in the 17th century was the impossibility of summing theforce interactions between the host of individual pairs of molecules in order to arriveat the overall mechanical behavior of the body. While this cannot be achieved eventoday, the micro-interactions of significance in rocks occur at a substantially largerscale. Already, valuable insights have been obtained from the numerical code PFC,and further developments are underway. Other groups in various countries are alsopursuing similar modelling and experimental studies of particulate mechanics. Ascan be expected, the computational requirements to carry out studies of large numbersof interacting particles are not trivial, especially if one wishes to solve problems inthree dimensions. Efforts are now underway to address this issue.
Continuum mechanics has contributed enormously to the development ofrock mechanics, as it has in other branches of science and engineering. The ability toobtain rigorous analytical solutions is an invaluable asset, one that allows confidence
42 Fairhurst and Carranza-Torres

to be placed in the validity of approximate numerical solutions —especially whenthe latter are shown to be in agreement with the analytical results. Some importantapplications of rock mechanics involve situations where the continuum hypothesisbreaks down, and where disintegration or discontinuum behavior must be dealt with.In some cases it is the dominant concern. The development of discontinuum codes,both for large scale and microparticulate problems, provide us with an additional toolto supplement the continuum approach.
It would seem that the computer and these numerical developments have‘closed the circle’ for us in another way —one that the eminent scholars of the 17th
and 18th centuries would appreciate greatly. We now have complementary toolsthat can eliminate gaps, allowing us to explore ranges of material behavior beyondthose possible hitherto, and to examine a given problem from ‘different directions’to increase confidence in the validity of the results obtained by one technique alone.It is a time of opportunity for rock mechanics.
Challenges
Civil Engineering, with its close relation to public works and service to the public,has traditionally relied more heavily on universities for many of its research anddevelopment efforts than other branches of engineering. Universities have also beena focal point for research in mining engineering. Several decades ago there werenumerous excellent industrial research laboratories in civil, mining and petroleumengineering both in the U.S and abroad. Most of these have since disappeared orcontracted considerably in size. These are the three professions where rock mechanicsissues are a primary concern.
Thus, if the discipline is to advance, universities must take the lead in rockmechanics research. A great deal of effort in university research over the past twodecades or so has been dedicated to development of numerical modelling proce-dures. These procedures are now sufficiently mature that we are in a position tobegin addressing important gaps in the application of rock mechanics to engineeringproblems.
As noted earlier in this paper, the Hoek-Brown criterion for predicting rockmass strength is probably the most widely accepted internationally. It is thus salutaryto read the following comments on this criterion, extracted from a Letter to theEditor10, submitted by one of the authors of this criterion, Dr. Evert Hoek:
‘In writing “Underground Excavations in Rock” almost 15 years ago,Professor E.T. Brown and I developed the Hoek-Brown failure criterionto fill a vacuum which we saw in the process of designing undergroundexcavations. Our approach was entirely empirical and we worked fromvery limited data of rather poor quality. Our empirical criterion and our
10 The letter was published in the News Journal of the International Society for Rock Mechanics,Volume 2, Number 2, 1994.
43 Fairhurst and Carranza-Torres

estimates of the input parameters were offered as a temporary solutionto an urgent problem.
In retrospect it is clear that wewere naive in believing that our “emer-gency” criterion would soon be replaced by a set of well-researched pre-dictive tools which were adequately substantiated by field studies andback analyses of real rock engineering case histories. In fact the reversehas happened and I am alarmed to see the Hoek-Brown criterion beingapplied to problems which we did not even dream about when we madethose desperate estimates 15 years ago.
The fact that the criterion works, more by good fortune than becauseof its inherent scientific merits, is no excuse for the current lack of effortor even apparent desire to find a better way. It is my hope that this shortnote may catch the eye of someone who has the skill and the motivationto pick up the challenge and to lead in the development of better toolsfor providing us with the input data which we need for rock engineeringdesigns of the future.
Since testing of in-situ rockmasses on a realistic scale is not practical,we have only two avenues open to us to remedy this data deficiency. Thefirst is to develop a better understanding of how the component piecesof the rock mass interact to produce the overall behavior which we needto understand in order to use it as input for our analyses. The secondis to use back analysis of the observed performance or rock engineeringstructures to deduce what rock mass properties exist in these structures.’
We now have the analytical and numerical tools to address this problem andothers like it. It is not necessary for university researchers to await the arrival offield data. There are several well established empirical ‘classification systems’ andtabulations, built up over several decades, to allow the design and/or performanceof an underground structure to be assessed on the basis of the performance of many‘similar’ structures.
We now have the analytical/numerical tools to begin to establish the frame-work upon which to arrange these data bases into more rational systems. [Fakhimi(1992) took a step in this direction with respect to Lauffer’s (1958) Stand-Up TimeClassification.]
These new systems will have the added merit of allowing a more reliableextrapolation beyond the ‘experience limits’ of the current systems. This is espe-cially needed now when so many projects are moving beyond the limits of currentexperience.
Universities need to respond to Dr. Hoek’s message, and to other field scaleproblems that we are now in a position to address.
44 Fairhurst and Carranza-Torres

Conclusions
1. Analytical and numerical studies indicate that the Terzaghi Rock Load approachto support design is very conservative.
2. Although no numerical studies have been completed to date, it would appearthat Lang’s design approach is likely to be conservative (see also conclusion 5below).
3. Numerical analysis indicates that the Einstein–Schwartz design procedure isconservative in higher quality ‘good’ to ‘very good’ rock masses, but can benon-conservative in ‘poor quality’ rock. It seems to be a useful approach tosupport design if these limitations are recognized and taken into account.
4. The convergence-confinement method of analysis of the interaction between atunnel support and the rock mass is the most rational procedure and has beenadopted in many countries as the standard.
The method is entirely consistent with the so called New Austrian TunnellingMethod. In this method an initial support-system is selected, one that can bereadily modified as tunnel closure measurements indicate to be required.
5. Although the function of rock bolts in tunnel support has been examined bynumerous investigators, further study is still required to establish the reinforce-ment mechanisms of grouted bolts in weak rock.
6. Extension of convergence-confinement procedure to the non-uniform loadingcase provides valuable insights into behavior of supports under realistic (i.e.,non-uniform) loading.
7. University geomechanics research groups have a particular opportunity to ad-vance tunnel support design procedures by using analytical and numericalanalysis to establish rational foundations for estimating the deformability andstrength of rock masses. This will require special attention to the deformationof joints and joint systems. A larger body of empirical data to test these ‘foun-dations’ has been gathered under the general title of ‘classification systems’.
Acknowledgment
As noted in the Preamble to this paper, tunnel support design has been a subject ofresearch at the University of Minnesota for almost four decades.
This started with a chance meeting between the Senior Author and KennethS. Lane, a senior engineer staff member with the U.S. Army Corps of Engineers,Missouri River Division, in 1957 at the Second U.S. Rock Mechanics Symposiumin Golden, Colorado. Ken Lane was a prime mover in the development of the firstTunnel Boring Machine (see footnote 3 on page 4) and an indefatigable campaignerfor improvements in geotechnical engineering.
45 Fairhurst and Carranza-Torres

It was Ken Lane who proposed the topic, Rational Design of Tunnel Supports,feeling that U.S. tunnel support design procedures at that time could be improved.The research project Rational Design of Tunnel Supports was started under the spon-sorship of the Missouri River Division. This project supported the thesis researchof several Ph.D students, including Jaak J.K. Daemen (1975), Michael D. Voegele(1978) and Emmanuel Detournay (1983).
Dr. Peter A. Cundall, then a post-doctoral Research Associate, submitted aresearch proposal to the National Science Foundation for research to develop an earlyversion of his discontinuum code. The proposal was declined, a decision influencedapparently by a reviewer’s opinion that the proposal goal was overly ambitious andunlikely to succeed. Ken Lane and his colleagues recognized the potential of theresearch and were able to provide sufficient funding to carry forward Dr. Cundall’swork. The results were presented as a Corps of Engineers Report in 1974 [Cundall(1974)]. This initial stimulus led to the development of the discontinuum code UDEC,now used internationally for analysis of deformations in blocky and jointed rock. Drs.Don Banks and Jim Drake of the Waterways Experiment Station U.S. Army Corpsof Engineers Vicksburg, Mississippi, were also strong supporters.
It is a privilege for the senior author to have been associated with theseengineers and many others, including students and faculty, an exceptional group—including my co-author— from whom much has been learned over the past (al-most) fifty years.
We hope that this review, albeit personal, will be of interest to participants inthis 50th Minnesota Conference on Geotechnical Engineering.
References
American Society of Civil Engineering (1984). Guidelines for tunnel lining design.Edited by T. D. O’Rourke. ASCE Technical Council on Research. TechnicalCommittee on Tunnel Lining Design.
Atkinson, J. (1993). An Introduction to the Mechanics of Soils and Foundations.Mc Graw–Hill Book Company.
Barton, N., R. Lien, and J. Lunde (1974). Engineering classification of rock massesfor the design of tunnel support. Rock Mechanics and Rock Engineering 6(4),189–236.
Bieniawski, Z. T. (1976). Rock mass classification in rock engineering. In Z. T.Bieniawski (Ed.), Proc. of the Symp. in Exploration for Rock Engineering.Cape Town, pp. 97–106. Balkema.
Caquot, A. and J. Kerisel (1956). Traite de Mecanique des Sols. Paris: Gauthier-Villars.
Carranza-Torres, C. (1998). Self-Similarity Analysis of the Elasto-Plastic Re-sponse of Underground Openings in Rock and Effects of Practical Variables.Ph. D. thesis, University of Minnesota.
46 Fairhurst and Carranza-Torres

Carranza-Torres, C. and C. Fairhurst (1999). The elasto-plastic response of un-derground excavations in rock masses that satisfy the Hoek-Brown failure cri-terion. International Journal of Rock Mechanics and Mining Sciences 36(6),777–809.
Carranza-Torres, C. and C. Fairhurst (2000b). Application of the convergence-confinement method of tunnel design to rock-masses that satisfy the Hoek-Brown failure criterion. Tunnelling and Underground Space Technology, 187–213. Vol. 15, No. 2. Pergamon.
Carranza-Torres, C. and C. Fairhurst (2000a). Some consequences of inelasticrock mass deformation on the tunnel support loads predicted by the Einsteinand Schwartz approach. In J. F. Labuz, S. D. Glaser, and E. Dawson (Eds.),Trends in Rock Mechanics. Geo Institute. American Society of Civil Engineers,pp. 16–49.
Caw, J. M. (1956). The Kolar Gold Field. Mine and Quarry Engineering 22,306–316. London.
Coker, E. G. and L. N. G. Filon (1931). A Treatise on Photoelasticity. CambridgeUniversity Press.
Coulomb, C. A. (1776). Essai sur une application des regles de maximus et min-imus a quelques problemes de statique relatifs a l’architecture. Memoires demathematique et de physique. L’Academie Royale des Sciences. Paris.
Cundall, P. (1974). Rational design of tunnel supports: A computer model for rockmass behavior using interactive graphics for the input and output of geometricaldata. Technical report, U.S.Army Corps of Engineers. Missouri River Division.
Cundall, P. (1987). Distinct element models of rock and soil structure. In E.T.Brown (Ed.), Analytical and Computational Methods in Engineering RockMechanics, pp. 164–202. Allen & Unwin. London.
Cundall, P. (1988). Formulation of Three-Dimensional Distinct Element Model—Part 1: A Scheme to Detect and Represent Contacts in a System Composedof Many Polyhedral Blocks. Int. J. Rock Mech. Min. Sci. & Geomech. Abstr. 25,107–116.
Cundall, P. (1998). Rock Stability and Long-Term Damage Assessment in theMine-by Tunnel at URL, Canada. In Proceedings of the International Work-shop on Reversibility: Scientific and Technical Bases for the Reversibilityof Geological Disposal. Paris, November 1998. 2nd Session. Paper No. 1.Chatenay-Malabry, France: ANDRA, 1998.
Cundall, P. and O. Strack (1979). A discrete numerical model for granular assem-blies. Geotechnique 29, 47–65.
Daemen, J. J. K. (1975). Tunnel Support Loading Caused by Rock Failure. Ph. D.thesis, University of Minnesota.
47 Fairhurst and Carranza-Torres

Deere, D. U. (1968). Geological considerations. In K. G. Stagg and O. C.Zienkiewic (Eds.), Rock Mechanics in Engineering Practice, pp. 1–20. JohnWiley & Sons.
Deere, D. U., R. B. Peck, J. E. Monsees, and B. Schmidt (1969). Design of tun-nel and support systems. Technical report, Department of Civil Engineering.University of Illinois. Contract No. 3-0152 from the U.S. Department of Trans-portation.
d’Escatha, J. and J. Mandel (1974). Stabilite d’une galerie peu profunde en terrainmeuble. Industrie Minerale 6, 1–9.
d’Escatha,Y. and J. Mandel (1971). Profondeur critique d’eboulement d’un souter-rain. C.R. Acad. Sc. 273, 470–473.
Detournay, E. (1983). Two-Dimensional Elastoplastic Analysis of a Long, Cylin-drical Cavity under Non-Hydrostatic Loading. Ph. D. thesis, University ofMinnesota.
Einstein, H. H. and C. W. Schwartz (1979). Simplified analysis for tunnel supports.ASCE J. Geotech. Eng. Div. 105(4), 449–518.
Fairhurst, C. (1991). General philosophy of support design for underground struc-tures in hard rock. In R. S. Sinha (Ed.), Underground Structures. Design andConstruction, pp. 1–55. Elsevier.
Fakhimi, A. A. (1992). The Influence of Time Dependent Deformation of Rock onthe Stability of Underground Excavations. Ph. D. thesis, University of Min-nesota.
Fenner, R. (1938). Untersuchungen zur erkenntnis des gebirgsdruckes.Gluckauf 74, 681–695 and 705–715.
Franklin, J. A. and E. Hoek (1970). Developments in triaxial testing technique.Rock Mechanics and Rock Engineering 2, 223–228.
Frocht, M. M. (1941). Photoelasticity. John Wiley & Sons, Inc.
Goodman, R. E. (1980). Introduction to Rock Mechanics. New York: Wiley andSons.
Hart, R., P. Cundall, and J. Lemos (1988). Formulation of Three-DimensionalDistinct Element Model —Part 2: Mechanical Calculations for Motion andInteraction of a System Composed of Many Polyhedral Blocks. Int. J. RockMech. Min. Sci. & Geomech. Abstr. 25, 117–126.
Hart, R. and C. Fairhurst (2000). Application of discontinuum modeling ingeotechnical studies for nuclear waste isolation. In S. A.Yufin (Ed.), Geoecol-ogy and Computers, pp. 15–28. Balkema. Rotterdam.
Heyman, J. (1972). Coulomb’s Memoir on Statics. An Essay in the History of CivilEngineering. London: Imperial College Press.
48 Fairhurst and Carranza-Torres

Hoek, E. (1983). Strength of jointed rock masses. Rankine Lecture. Geotech-nique 33(3), 187–223.
Hoek, E. (1994). The challenge of input data for rock engineering. News Journalof the International Society for Rock Mechanics 2(2), 4–16.
Hoek, E. (2001). Big Tunnels in Bad Rock. ASCE J. Geotechnical and Geoenviron-mental Engineering 127(9), 726–740. The Thirty-Six Karl Terzaghi Lecture.
Hoek, E. and E. T. Brown (1980). Underground Excavations in Rock. London:The Institute of Mining and Metallurgy.
Hoek, E. and E. T. Brown (1997). Practical estimates of rock mass strength. Int.J. Rock Mech. Min. Sci. & Geomech. Abstr. 34(8), 1165–1186.
Hoek, E., P. K. Kaiser, and W. F. Bawden (1995). Support of Underground Exca-vations in Hard Rock. Rotterdam: Balkema.
Inglis, C. E. (1913). Stresses in a plate due to the presence of cracks and sharpcorners. Trans. Instn. Nav. Archit. 55, 219–241. London.
Isaacson, E. (1958). Rock pressure in mines. Mining Publications 212, 31–34.London.
Kastner (1962). Statik des Tunnel und Stollenbaues. Springer Verlag.
Kirsch, G. (1898). Die Theorie der Elastizitat und die Bedurinisse der Festigkeit-slehre. V.D.J. 42(29).
Kooharian, A. (1952). Limit analysis of voissoir (segmental) and concrete arches.J. American Concrete Inst. 24(4), 317–328. Dec. 1952.
Kovari, K. (2000). Personal Communication. Article submitted to Felsbau. Rockand Soil Engineering. Verlag Gluckauf GmbH.
Labasse, H. (1949). Les pressions de terrains dans les mines de huiles. RevueUniverselle des Mines. Liege, Belgium, Series 9, Vol. 5, No. 3, 78-88.
Lama, R. D. and V. S. Vutukuri (1978). Handbook of Mechanical Properties ofRocks. Testing Techniques and Results. Volume II. Trans Tech Publications.
Lame, G. (1852). Lecons sur la theorie de l’elasticite. Paris: Gauthier-Villars.
Lang, T. A. (1961). Theory and practice of rock bolting. Trans. Soc. Min. Engrs,Am. Inst. Min. Metall. Petrolm Engrs. 220, 333–348.
Lang, T. A. (1962). Notes on Rock Mechanics and Engineering for Rock Construc-tion. Berkeley. 1962–1964. Volumes I and II.
Lang, T. A. and J. A. Bischoff (1984). Stability of reinforced rock structures. InJ. A. Hudson and E. T. Brown (Eds.), Design and performance of undergroundexcavations, pp. 11–18. ISRM Symposium–Cambridege, UK.
Lauffer, H. (1958). Gebirgsklassiferung fur den Stollenbau. Geologie und Bauwe-sen 24, 46–51.
49 Fairhurst and Carranza-Torres
Londe, P. (1988). Discussion on the determination of the shear stress failure inrock masses. ASCE J. Geotech. Eng. Div. 114(3), 374–376.
Marinos, P. and E. Hoek (2000). GSI: A geologically friendly tool for rock massstrength estimation. In Proceedings of GeoEng2000, An International Con-ference on Geological and Geotechnical Engineering. November 2000, Mel-bourne, Australia.
Muir Wood, A. M. (1975). The circular tunnel in elastic ground. Geotech-nique 25(1), 115–127.
Obert, L. and W. I. Duvall (1967). Rock Mechanics and the Design of Structuresin Rock. New York: John Wiley & Sons, Inc.
Panet, M. (1995). Calcul des Tunnels par la Methode de Convergence-Confinement. Press de l’ecole Nationale des Ponts et Chaussees.
Pippard, A. and R. Ashby (1939a). An experimental study of the voussoir arch. J.Inst’n. of Civil Engineers 10. Jan. 1939.
Pippard, A. and R. Ashby (1939b). An experimental study of the voussoir Arch. J.Inst’n. of Civil Engineers 11–12.
Pippard, A. and L. Chitty (1941). Repeated load tests on a voussoir arch. J. Inst’n.of Civil Engineers 17, 79–86. Nov. 1941.
Potyondy, D. and P. A. Cundall (1998). Modeling Notch-Formation Mechanismsin the URL Mine-by Test Tunnel Using Bonded Assemblies of Circular Par-ticles. In Proceedings of NARMS’98, 3rd North American Rock MechanicsSymposium. Paper No. 067. Abstracts included in the Special Issue of the Int.J. Rock Mech. & Min. Sci., 35 (4-5), 1998.
Rabcewicz, L. V. (1964). The New Austrian Tunnelling Method. Water Power,453–515. November 1964.
Ranken, R. E. and J. Ghaboussi (1975). Tunnel design considerations: Analysis ofstresses and displacements around advancing tunnels.Technical report, FederalRailroad Administration, United States Department of Transportation. ReportNo. FRA-ORD 75-84. Washington D.C., Aug. 1975.
Salencon, J. (1969). Contraction quasi-statique d’une cavite a symetrie spheriqueou cylindrique dans un milieu elastoplastique. Annales des Ponts etChaussees. IV, 231–236.
Savin, G. N. (1961). Stress Concentration Around Holes. London: PergamonPress.
Serafim, J. L. and J. P. Pereira (1983). Consideration of the geomechanical clas-sification of Bieniawski. In Proc. Int. Symp. on Engineering Geology andUnderground Construction. Lisbon, Volume 1(II), pp. 33–44.
Talobre, J. (1957). La Mecanique des Roches. Paris: Dunod.
50 Fairhurst and Carranza-Torres

Terzaghi, K. (1943). Theoretical Soil Mechanics. John Wiley & Sons, Inc. NewYork.
Terzaghi, K. (1946). Rock defects and loads on tunnel supports. In R.V. Proctor andT. L. White (Eds.), Rock tunneling with steel supports, pp. 17–99. CommercialShearing and Stamping Company. Youngstown, OH.
Trollope, D. H. (1968). The mechanics of discontinua or clastic mechanics in rockproblems. In K. G. Stagg and O. C. Zienkiewic (Eds.), Rock Mechanics inEngineering Practice, pp. 275–320. John Wiley & Sons.
U.S.Army Corps fo Engineers (1978). Tunnels and shafts in rock. Technical report,Washington. Dept. of Defense. Dept. of the Army, Corps of Engineers. Gov.Doc. No. D103.6/3:1110-2-2901.
Voegele, M. (1978). Design of Tunnel Support: An Interactive Based Analysisof the Support Requirements of Excavations in Jointed Rock Masses. Ph. D.thesis, University of Minnesota.
Voegele, M. and C. Fairhurst (1978). Analysis of tunnel support loads using thedistinct block model. In Storage in Excavated Rock Caverns, pp. 247–252.Pergamon Press.
Appendix A: Lang’s Reinforced Rock Units (RRU’s)
a) Definition of variables
The reinforced rock units (RRU) constitute the reinforced zone of the roof of anunderground excavation [Lang (1961)]. The factors that contribute to the stabilityof these units so that they are stable relative to one another and act together as astructural member are (Figure A-1):
T : Bolt tension
t : Average bolting stress (t = T/A)
α: Factor depending on time of installation of bolts after excavation(probable variation 0.5 to 1.0)
γ : Unit weight of the rock
c: Apparent cohesion of the rock mass (i.e., intrinsic strength at zeronormal stress)
φ: Angle of internal friction of the rock mass
µ: Tangent of the friction angle (i.e., µ = tan φ)
k: Ratio of average horizontal to average vertical stresses
A: Area of reinforced rock unit (i.e., A = s2 for a bolt pattern with s× s
spacing)
51 Fairhurst and Carranza-Torres

Figure A-1. Rock Reinforced Units (after Lang, 1961).
P : Shear perimeter of reinforced rock unit (i.e.,P = 4s for a bolt patternwith s × s spacing)
R: Shear radius (i.e.,R = A/P and thereforeR = s/4 for a bolt patternwith s × s spacing)
h: In situ horizontal stress
L: Length of rock bolts
D: Height of distressed rock above the surface of the opening
b) Equilibrium analysis of the Rock Unit
We will consider first the stability of the unreinforced rock unit CDGH, shown inFigure A-1b, relative to its neighbors.
52 Fairhurst and Carranza-Torres
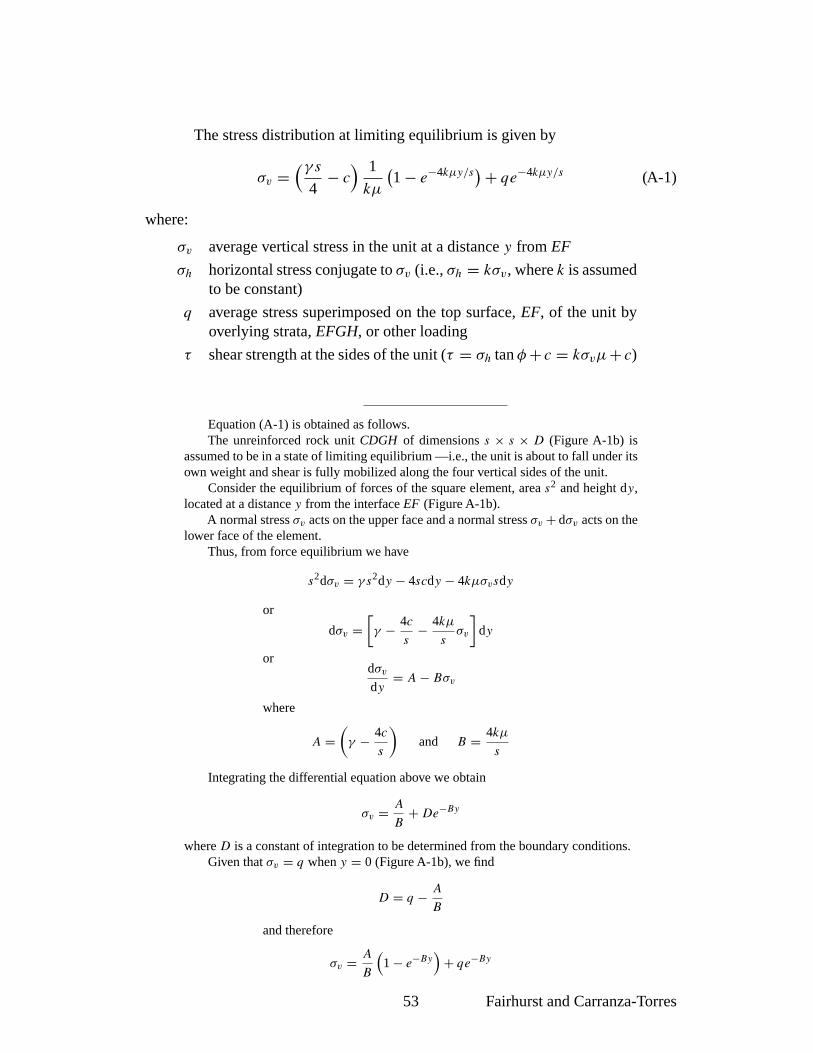
The stress distribution at limiting equilibrium is given by
σv =(γ s
4− c
) 1
kµ
(1 − e−4kµy/s) + qe−4kµy/s (A-1)
where:
σv average vertical stress in the unit at a distance y from EF
σh horizontal stress conjugate to σv (i.e., σh = kσv, where k is assumedto be constant)
q average stress superimposed on the top surface, EF, of the unit byoverlying strata, EFGH, or other loading
τ shear strength at the sides of the unit (τ = σh tan φ+ c = kσvµ+ c)
Equation (A-1) is obtained as follows.The unreinforced rock unit CDGH of dimensions s × s × D (Figure A-1b) is
assumed to be in a state of limiting equilibrium —i.e., the unit is about to fall under itsown weight and shear is fully mobilized along the four vertical sides of the unit.
Consider the equilibrium of forces of the square element, area s2 and height dy,located at a distance y from the interface EF (Figure A-1b).
A normal stress σv acts on the upper face and a normal stress σv + dσv acts on thelower face of the element.
Thus, from force equilibrium we have
s2dσv = γ s2dy − 4scdy − 4kµσvsdy
or
dσv =[γ − 4c
s− 4kµ
sσv
]dy
ordσvdy
= A − Bσv
where
A =(γ − 4c
s
)and B = 4kµ
s
Integrating the differential equation above we obtain
σv = A
B+ De−By
where D is a constant of integration to be determined from the boundary conditions.Given that σv = q when y = 0 (Figure A-1b), we find
D = q − A
B
and therefore
σv = A
B
(1 − e−By
)+ qe−By
53 Fairhurst and Carranza-Torres

Substituting for A and B, we finally obtain the equation (A-1), i.e.,
σv =(γ s
4− c
) 1
kµ
(1 − e−4kµy/s
)+ qe−4kµy/s
For a given value of y, say y = L, the vertical stress, σo, at CD (Figure A-1b),if it was not a free surface, would be
σo =(γ s
4− c
) 1
kµ
(1 − e−4kµL/s) + qe−4kµL/s (A-2)
c) Equilibrium analysis of the Reinforced Rock Unit
The basic element of a rock reinforcement system is the reinforced rock unit (RRU),which consists of an individual bolt and the rock immediately surrounding and adja-cent to it (Figure A-1c).
Now if the rock EFGH above the unit CDEF is behaving in a similar mannerto that within CDEF —i.e., shear is fully developed along its periphery, then q canbe expressed as follows
q =(γ s
4− c
) 1
kµ
(1 − e−4kµz/s) (A-3)
and substituting this value in equation (A-2) and letting D = z + L gives
σo =(γ s
4− c
) 1
kµ
(1 − e−4kµD/s
)(A-4)
or substituting R = s/4
σo = (γR − c)1
kµ
(1 − e−kµD/R
)(A-5)
In effect, (γR−c) is the passive direct support that a prop under the rock unitwould have to provide to prevent fallout of the unit relative to the surrounding rock.However, if (γR− c) is zero or negative, then σo becomes zero and theoretically, nosupport is required.
The Reinforced Rock Unit theory is based on the assumption that, providingfallout of the rock material has been prevented, the rock unit CDGH has deformedto the extent that failure in accordance with Coulomb’s criterion is imminent alongthe sides of the unit.
Note that equation (A-5) is identical to equation (2) in page 13 when R = B1
and c = 0 (see Figure 8a).
d) Force carried by the bolts in the Reinforced Rock Unit
54 Fairhurst and Carranza-Torres

If a stabilizing pressure, t , equal to σo is provided by a rock bolt installed at the centerof the rock unit (see Figure A-1c) then the total tensile load, T , in the rock bolt willbe
T = ts2 (A-6)
Assuming that the bolt load T is distributed as an average stress over thesection of the rock unit and that the effective length of the rock bolt is equal to L, therock bolt supplies a passive support pressure, t , at CD and an equal stress is added atEF.
Under these conditions, it can be shown that, for equilibrium of the unitCDEF, the passive pressure applied by the bolt at CD, t , must equal σo. Thereforetaking D = (z + L) and R = s/4, we have
t(1 − e−kµL/R
) = α1
kµ(γR − c − hµ)
(1 − e−kµD/R
)(A-7)
or
t = tA = αγAR
kµ
(1 − c
γR− hµ
γR
) [1 − e−kµD/R
1 − e−kµL/R
](A-8)
In the above equations, it is assumed that the downward deformation of therock unit has proceeded to the stage where the full shear strength of the rock hasbeen developed on the sides of the unit. In other words, the bolt is applying a passivepressure at point A, Figure A-1c, which is just adequate to provide support of thatportion of the total weight of distressed rock, D, which is not carried by shear on thesides of the unit. For these conditions, α = 1.
If the bolts are installed and tensioned either before or immediately after ex-cavation exposes the surface CD in Figure A-1c —i.e., before significant deformationhas taken place— then the bolts will apply a pressure at CD that ‘actively’ retardsdeformation of the unit and ‘actively’ contributes to its stability. Under these condi-tions, the bolts are described as providing ‘active’ reinforcement and it can be shownthat α = 0.5.
In practice, the time of installation of the bolts will be intermediate betweenthese two extremes and, conservatively, α = 1.0 has been used throughout thesestudies. It may be noted that the use of fully grouted but untensioned rock reinforce-ment, where the tension in the bolts is developed by the rock deformation, wouldalso be intermediate between the ‘active’ and ‘passive’ conditions defined above.
Appendix B: The strength and deformability of rock masses according tothe Hoek-Brown failure criterion
The Hoek-Brown criterion has found wide practical application as a methodof defining the stress conditions under which a rock-mass will deform inelasticallyand, if not supported adequately, collapse.
The parameters defining the Hoek-Brown criterion can be estimated from a
55 Fairhurst and Carranza-Torres

combination of laboratory tests on intact rock cores and an empirical ‘adjustment’ toaccount for the reduced strength of the rock-mass due to the presence of weaknessesand jointing.
It must be noted that this criterion assumes continuum-isotropic behaviorfor the rock-mass and should not be applied to cases in which there is a preferredorientation of jointing, such that the mass would not behave as an isotropic continuum.
Testing of rock specimens under triaxial conditions of loading allows thecombination of stresses that lead to failure (or collapse) of the specimen to be deter-mined. According to Hoek and Brown, the failure condition of intact rock samplesis given by the following parabolic law [(Hoek and Brown 1980)],
σ1 = σ3 + σci
√mi
σ3
σci+ 1 (B-1)
where
σ3 is the confining stress applied to the sample
σ1 is the axial stress that produces failure of the sample
σci is the unconfined compression strength of the intact rock
mi is a dimensionless parameter, the value of which depends on the typeof rock being tested.
In order to characterize the intact rock in terms of equation (B-1), it is nec-essary to determine the parameters σci and mi . This is done by statistical analysisof strength (σ1) observed for various values of confining stress (σ3) in triaxial tests[(Hoek 1983)].
To illustrate the application of equation (B-1) let us consider the triaxial testresults shown in Figure B-1 obtained by Franklin and Hoek (1970) for samples ofdifferent rock types: i) granite, ii) quartz dolerite and iii) marble (details of the testscan be found in the original paper). The horizontal and vertical axes in the diagramcorrespond, respectively, to the confining stress σ3 and the axial stress at failure σ1
divided by the unconfined compression strength σci for each rock type. The dotsrepresent the pairs (σ3, σ1) obtained from the triaxial tests. The solid lines are thecorresponding failure envelopes defined by equation (B-1) with the parameters σciand mi computed from regression analysis [see Hoek (1983) for details]. It can beseen that, although there is some dispersion in the results, the general trend is for thescattered points to align to the parabolas defined by equation (B-1)11.
Triaxial testing of rock samples is an expensive procedure and, in most cases,results of the extensive tests needed to determine the parameters σci and mi in therelationship (B-1) are not available. In this case, when information on the unconfinedcompressive strength is available (e.g., from UCS tests or, indirectly, from point load
11 The observed dispersion appears to be proportional to the number of specimens tested, with thehighest dispersion for the 48 samples of granite and the lowest for the 14 samples of marble —seeFranklin and Hoek (1970).
56 Fairhurst and Carranza-Torres

Figure B-1. Failure envelopes obtained from triaxial tests of samples of different rocktypes (after Franklin and Hoek, 1970). The horizontal and vertical axes representthe confining stress σ3 and the maximum axial stress σ1 respectively divided by theunconfined compressive strength σci of the sample.
57 Fairhurst and Carranza-Torres

tests), the parameter mi may be estimated from empirical charts or tables (Hoek et al.1995).
Table B-1 and Figure B-2, adapted from Lama andVutukuri (1978), Goodman(1980) and Hoek and Brown (1997) respectively, show typical values of σci and mi
for different rock types that could be taken as a reference for use in equation (B-1).
Table B-1. Reference values for the unconfined compressive strength σci , Poisson’sratio ν, Young’s Modulus E, Shear Modulus G and unit weight γ for intact rock[adapted from Lama and Vutukuri (1978) and Goodman (1980)].
Rock type σci [MPa] ν E [MPa] G [MPa] γ [MN/m3]
1) Andesite 130.6 0.16 44.3 × 10³ 19.1 × 10³ 25.2 × 10⁻³
2) Basalt 148.0 0.32 33.9 × 10³ 12.8 × 10³ 27.8 × 10⁻³
3) Conglomerate 30.3 0.12 1.3 × 10³ 0.6 × 10³ 24.2 × 10⁻³
4) Diabase 321.3 0.28 95.8 × 10³ 37.4 × 10³ 28.8 × 10⁻³
5) Dolomite 46.9 0.29 29.0 × 10³ 11.2 × 10³ 24.5 × 10⁻³
6) Gneiss 165.0 0.27 76.3 × 10³ 30.0 × 10³ 26.8 × 10⁻³
7) Granite 141.1 0.22 73.8 × 10³ 30.3 × 10³ 26.4 × 10⁻³
8) Limestone 51.0 0.29 28.5 × 10³ 11.1 × 10³ 23.3 × 10⁻³
9) Quartzite 320.1 0.11 88.4 × 10³ 39.8 × 10³ 25.7 × 10⁻³
10) Sandstone 73.8 0.38 18.3 × 10³ 6.6 × 10³ 21.4 × 10⁻³
11) Siltstone 122.7 0.22 26.2 × 10³ 10.7 × 10³ 25.4 × 10⁻³
12) Tuff 11.3 0.19 3.7 × 10³ 1.5 × 10³ 23.5 × 10⁻³
Origin of the samples: 1) Palisades Dam, Idaho, USA; 2) Nevada Test Site, USA; 3) Mc DowellDam, Arizona, USA; 4) NewYork, USA; 5) Minneapolis, Minnesota, USA; 6) Graminha Dam,Brazil; 7) Nevada Test Site, USA; 8) Bedford, Indiana, USA; 9) Baraboo, Wisconsin, USA;10) Amherst, Ohio, USA; 11) Hackensack, N.Y., USA; 12) Nevada Test Site, USA.
As noted earlier, joints and defects in a rock-mass reduce the strength of themass below the strength of an intact specimen of the same rock type. By using the so-called Geological Strength Index (or GSI) as a scaling parameter, the failure criteriondefined by equation (B-1) can be adjusted to provide an estimate of the decreasedstrength of the rock-mass in the field.
According to Hoek and Brown (1997) the GSI is an empirically derivednumber that varies over a range between 10 and 100 (the GSI is dimensionless),and can be estimated by examination of the quality of the rock-mass in situ —by direct inspection of an outcrop, for example. By definition, GSI values closeto 10 correspond to very poor quality rock-masses, while GSI values close to 100correspond to excellent quality rock-masses.
Figure B-3 [adapted from Hoek and Brown (1997) and Marinos and Hoek(2000)] shows how the GSI can be estimated from the structure and surface conditionsof the rock-mass (for example, a rock-mass with Blocky/Disturbed structure and Poorsurface condition will have a GSI close to 30).
58 Fairhurst and Carranza-Torres

Figure B-2. Reference values for the coefficient mi for different rock types (adaptedfrom Hoek and Brown 1997). The value of mi is shown in parentheses below thename of the rock.
The value GSI= 25, indicated by a discontinuous line in Figure B-3, issignificant in that it defines the limit between rock-masses of very poor quality (GSI<25) and those of good to reasonable quality (GSI> 25). For rock-masses of goodto reasonable quality (i.e., GSI> 25) the Geological Strength Index is equivalent tothe Rock Mass Rating (RMR) introduced by Bieniawski (1976) when the rating forGroundwater is assessed as ‘dry’ and the rating for Joint Orientation as ‘favorable’.
When the scaling factor GSI is introduced, the Hoek-Brown failure criterionfor the rock-mass is given by the following relationship [Hoek and Brown (1997)]
σ1 = σ3 + σci
(mb
σ3
σci+ s
)a
(B-2)
The parameter mb in equation (B-2) depends on both the intact rock parameter mi ,
59 Fairhurst and Carranza-Torres

Figure B-3. Empirical chart for the estimation of the Geological Strength Index (GSI)based on the characteristics of the rock-mass [adapted from Hoek and Brown (1997)and Marinos and Hoek (2000)].
60 Fairhurst and Carranza-Torres

of equation (B-1), and the value of GSI, as defined by the equation
mb = mi exp
(GSI − 100
28
)(B-3)
The parameters s and a also depend empirically on the value of GSI as follows,
for GSI≥ 25,
s = exp
(GSI − 100
9
)(B-4)
a = 0.5
and for GSI< 25,
s = 0 (B-5)
a = 0.65 − GSI
200
Table B-2 lists the values of mb, s and a obtained from equations (B-3), (B-4) and(B-5) for different values of GSI. It can be seen that when GSI= 100 (the hypotheticalcase in which the rock-mass has the same strength as the intact rock sample), theparameters are mb = mi , s = 1 and a = 0.5. With these values, the yield conditionfor the rock-mass, equation (B-2), and for the intact rock, equation (B-1), are thesame.
GSI mb/mi s a
100 1.00 1.00 0.575 40.95 × 10⁻² 621.77 × 10⁻⁴ 0.5050 16.77 × 10⁻² 38.66 × 10⁻⁴ 0.50
25+ 6.87 × 10⁻² 2.40 × 10⁻⁴ 0.5025− 6.87 × 10⁻² 0.00 0.5310 4.02 × 10⁻² 0.00 0.60
Table B-2. Values of coefficients mb, s and a as a function of the Geological StrengthIndex (GSI), computed from equations (B-3), (B-4) and (B-5) respectively. [Notethat the second column represents ratio mb/mi ; values of mi for different rock typesare given in Figure B-2.]
Londe (1988) showed that the Hoek-Brown failure criterion defined by equa-tion (B-2) can be transformed into a ‘general’ failure envelope that is independent ofthe parameters σci , mb and s.
The transformation suggested by Londe applies to the particular case a = 0.5
61 Fairhurst and Carranza-Torres
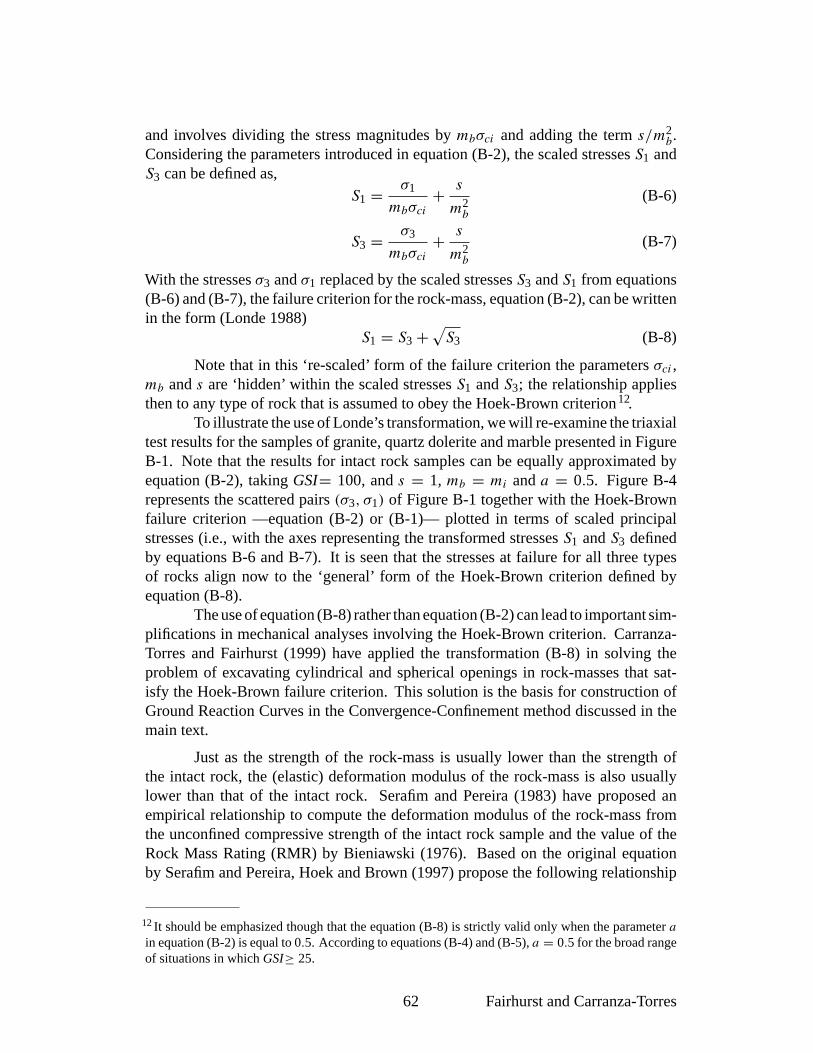
and involves dividing the stress magnitudes by mbσci and adding the term s/m2b.
Considering the parameters introduced in equation (B-2), the scaled stresses S1 andS3 can be defined as,
S1 = σ1
mbσci+ s
m2b
(B-6)
S3 = σ3
mbσci+ s
m2b
(B-7)
With the stresses σ3 and σ1 replaced by the scaled stresses S3 and S1 from equations(B-6) and (B-7), the failure criterion for the rock-mass, equation (B-2), can be writtenin the form (Londe 1988)
S1 = S3 + √S3 (B-8)
Note that in this ‘re-scaled’ form of the failure criterion the parameters σci ,mb and s are ‘hidden’ within the scaled stresses S1 and S3; the relationship appliesthen to any type of rock that is assumed to obey the Hoek-Brown criterion12.
To illustrate the use of Londe’s transformation, we will re-examine the triaxialtest results for the samples of granite, quartz dolerite and marble presented in FigureB-1. Note that the results for intact rock samples can be equally approximated byequation (B-2), taking GSI= 100, and s = 1, mb = mi and a = 0.5. Figure B-4represents the scattered pairs (σ3, σ1) of Figure B-1 together with the Hoek-Brownfailure criterion —equation (B-2) or (B-1)— plotted in terms of scaled principalstresses (i.e., with the axes representing the transformed stresses S1 and S3 definedby equations B-6 and B-7). It is seen that the stresses at failure for all three typesof rocks align now to the ‘general’ form of the Hoek-Brown criterion defined byequation (B-8).
The use of equation (B-8) rather than equation (B-2) can lead to important sim-plifications in mechanical analyses involving the Hoek-Brown criterion. Carranza-Torres and Fairhurst (1999) have applied the transformation (B-8) in solving theproblem of excavating cylindrical and spherical openings in rock-masses that sat-isfy the Hoek-Brown failure criterion. This solution is the basis for construction ofGround Reaction Curves in the Convergence-Confinement method discussed in themain text.
Just as the strength of the rock-mass is usually lower than the strength ofthe intact rock, the (elastic) deformation modulus of the rock-mass is also usuallylower than that of the intact rock. Serafim and Pereira (1983) have proposed anempirical relationship to compute the deformation modulus of the rock-mass fromthe unconfined compressive strength of the intact rock sample and the value of theRock Mass Rating (RMR) by Bieniawski (1976). Based on the original equationby Serafim and Pereira, Hoek and Brown (1997) propose the following relationship
12 It should be emphasized though that the equation (B-8) is strictly valid only when the parameter ain equation (B-2) is equal to 0.5. According to equations (B-4) and (B-5), a = 0.5 for the broad rangeof situations in which GSI≥ 25.
62 Fairhurst and Carranza-Torres

Figure B-4. Results from triaxial tests shown in Figure B-1 with the principal stressaxes σ1 and σ3 normalized according to transformations (B-6) and (B-7). Note thatin this reference system results for all three rock types fall on the ‘general’ failureenvelope given by equation (B-8) [Londe (1988)].
63 Fairhurst and Carranza-Torres

between the rock-mass modulus Erm and the Geological Strength Index GSI,
Erm = 1000 C (σci) 10GSI−10
40 (B-9)
where
C (σci) = 1 if σci ≥ 100MPa
=√
σci
100if σci < 100MPa
In equation (B-9), both the unconfined compressive strength σci and the rock-mass modulus Erm are expressed in MPa.
In elasto-plastic analyses of deformations —such as the one presented in themain text— the rock-mass shear modulus Grm is used rather than the deformationmodulus Erm given by equation (B-9). The shear modulus of the rock-mass can beestimated from the deformation modulus using the classic relationship from isotropicelasticity,
Grm = Erm
2(1 + ν)(B-10)
In equation (B-10), ν is Poisson’s ratio for the rock-mass, and is usuallyconsidered to vary between 0.1 and 0.3.
To illustrate the application of equations (B-9) and (B-10), let us considerthe properties of the granite sample listed in Table B-1. The unconfined compressivestrength of the intact rock is approximatelyσci = 141 MPa; if the Geological StrengthIndex of the rock-mass is GSI= 50, then the deformation modulus of the rock-massis, from equation (B-9), Erm = 1187 MPa. If Poisson’s ratio for the intact rock androck-mass are both assumed to be equal to 0.22 then, from equation (B-10), the shearmodulus of the rock-mass is Grm = 486 MPa. The elastic constants Erm and Grm
for the rock-mass are seen to be significantly lower than the corresponding constantsE and G for the intact rock sample listed in Table B-1.
64 Fairhurst and Carranza-Torres


![CroniconFerrara ring (Ferrara Ophthalmics Ltd.), and Keraring (Mediphacos Ltd.). A complete intrastromal ring, called MyoRing (Dioptex, GmbH, ... safely and ef-fectively [2]. Rings](https://img.pdfslide.net/doc/110x75/5ff89fdfa0afaa37877179e6/cronicon-ferrara-ring-ferrara-ophthalmics-ltd-and-keraring-mediphacos-ltd.jpg)