Embed Size (px)
Citation preview

253
Animal Science Papers and Reports vol. 35 (2017) no. 3, 253-263 Institute of Genetics and Animal Breeding, Jastrzębiec, Poland
Parameters of variability and diversity of tetrameric STRs for practical use in Zlotnicka White and Zlotnicka Spotted pigs*
Irena Vrtková1**, Andrzej Filistowicz2, Janusz T. Buczyński3, Štěpán Vrtek4, Lenka Falková1
1 Mendel University in Brno, Department of Morphology, Physiology and Animal Genetics, Zemedelská 1, 613 00 Brno, Czech Republic
2 Wroclaw University of Environmental and Life Sciences, Institute of Animal Breeding, Chelmonskiego 38c, 51-630 Wroclaw, Poland
3 Poznan University of Life Sciences, Faculty of Animal Breeding and Biology, Wojska Polskiego 28, 60-637 Poznan
4 Masaryk University, Department of Mathematics and Statistics, Msaryk University, Kotlarska 2, 611 37 Brno, Czech Republic
(Accepted July 28, 2017)
As a goal of this paper, the assessment of genetic variability of Zlotnicka White (ZW) and Zlotnicka Spotted (ZS), was chosen in order to verify the appropriateness of 11 tetrameric Short Tandem Repeats (STRs) panel for use in genetic resources of pigs. Analyses were carried out in sets of 91 ZW and 250 ZS pigs. Seventy-one alleles in ZW and 85 alleles in ZS were detected at all 11 STRs loci. An average number of alleles at locus (MNA) was 6.455 in ZW and 7.727 in ZS. An average number of effective alleles (MNe) was 3.532 in ZW and 3.431 in ZS. Observed heterozygosity Ho was 0.659 in ZW and 0.637 in ZS. On average, polymorphism information content (PIC) reached 0.639 and 0.619 per locus in ZW and ZS. The probability of identity of two independent samples PI using all 11 STRs loci in ZW amounted to 3.118 x 10⁻¹⁰ and to 5.921 x 10⁻¹⁰ in ZS while the probability of identity related individuals PISibs was 1.331 x 10⁻⁴ and 1.749 x 10⁻⁴ in ZW and ZS. The power of exclusion for loci combinations when both parents are known, when only one of the parent is known and for
*This work was supported by the project of Ministry of Agriculture of the Czech Republic No.QJ1210253. *Corresponding author: [email protected]
254
two putative parents P1, P2 and P3 were in ZW versus ZS 0.99903 v. 0.99887, 0.97998 v. 0.97654 and 0.99999 v. 0.99998, respectively. Identified estimates of stated parameters illustrate suitability of tetrameric STRs for practical application in the management of genetic resources, verification of parentage and traceability in ZW and ZS. Based on the results, we recommend the panel of tetrameric STRs loci as suitable for parentage, traceability and differentiation of subpopulations in genetic pig resources of similar history. He.
KEYWORDS: diversity / pigs / tetrameric STRs / Zlotnicka White / Zlotnicka Spotted
Small closed pig populations, which are bred as genetic resources, require specific management for their sustainability. Different molecular genetic markers are helpful for deciding on the breeding procedure. Predominantly, Short Tandem Repeats (microsatellite sequences) are used. However, different loci and different numbers of STRs are used in different countries.
Majority of the reports regard the Spanish genetic resource – the Iberian pig [Martínez et al. 2000, 2012, Toro et al. 2002, Fabuel et al. 2004, Alves et al. 2006, Gama et al. 2013].
Scarce knowledge about microsatellites has been made available regarding other genetic resources and local breeds [Berthouly-Salazar et al. 2012, Guastella et al. 2010, Herrero-Medrano et al. 2012, 2013]. Microsatellite data are also used for different studies in commercial breeds [Wilkinson et al. 2011, Li et al. 2014, Szmatola et al. 2016].
The use of tetrameric STRs from the commercial panel at genetic resources has not been met in the available literature. Vrtková [2015] and Vrtková et al. [2016] published results of the first large analysis with the panel of 11 tetrameric microsatellites in pig genetic resources in Central Europe. Prestice Black-Pied Pig breed, the genetic resource in CZ, was the object of the study. Tetrameric STRs proved to be very handy. In order to acknowledge that, observations of other genetic resources were necessary to be made. We chose Polish Zlotnicka pigs because of the similarities in the development and the fact that it is kept as a closed population [Szulc, Buczynski 2012].
The fact that a detailed microsatellite structure has not been studied yet in the Polish genetic resources of Zlotnicka White and Zlotnicka Spotted, was another reason to work with Polish Zlotnicka. Kurył et al. [1997] described only the genetic structure of immunogenic, biochemical and some single nucleotide polymorphism (SNP) markers.
The goal of our study was the estimation of parameters important for breeding management and the demonstration of suitability of tetrameric STRs for the Polish genetic resource of Zlotnicka pigs.
Material and methods
Sample collection and DNA extraction
A total of 341 boars and sows of Zlotnicka pigs were analysed, which included 91 Zlotnicka White and 250 of Zlotnicka Spotted pigs. DNA for the analysis was isolated from hair samples, using Genomic DNA Mini Tissue Kit (Geneaid).
I Vrtková et al.

255
Microsatellite, PCR amplification
Microsatellites were analysed by the Animaltype Pig PCR Amplification Kit (Biotype Diagnostic Gmbh), which allows for specification of 12 tetrameric microsatellites (SBH2, SBH18, SBH4, S0655, SBH23, SBH20, SBH1, SBH10, SBH13, 387A12F, SBH22, SBH19), including the sex specific marker for Amelogenin (SBH23), which was not used for the variability assessment. Multiplex PCR amplification of microsatellite markers was carried out using the Animaltype Pig PCR amplification kit, following the manufacturer’s recommendations. The Animaltype Pig kit is a PCR test specifically developed for the genotyping of breeding livestock samples for proof-of-origin in meat products and generally for quality management in the food industry. The test kit is recommended for the following applications: Proof of origin according the EU-Directive, Kinship testing in the context of breeding control, Status of inbreeding for herd book populations.
Microsatellites markers were separated by fragment analysis on genetic analyser ABI PRISM 310 (Applied Biosystems, Foster City, USA). The fragment analysis was carried out using the GeneScan 3.7 and Genotyper 3.7 software.
Statistical analysis
The Genalex v. 6.5. software (Peakall, Smouse, 2012) was used to calculate the number of alleles per locus (Na), the number of effective alleles per locus (Ne), observed heterozygosity (Ho), expected heterozygosity (He), the fixation index (F), the deviations from Hardy Weinberg equilibrium proportions (HWE), the probability of identity of two independent samples (PI), the probability among siblings (PISibs) and the power of exclusions when both parents are known, when only one of the parent is known and for two putative parents (P1, P2, P3). The polymorphism information content (PIC) was obtained across different loci using the Excel Microsatellite Toolkit v. 3.1.1. [Park 2001].
Genetic differentiation and population subdivision were tested with the algorithm of Pritchard et al. [2000], implemented in the Structure v. 2.2 software. Individual animals were assigned to two or more subpopulations based on their microsatellite genotypes. The Structure is able to determine for each pig the proportion of genes originating from the “K” potential clusters. The Structure algorithm based on the Markov chain Monte Carlo method was used to define the natural algorithm of the probability that a given genotype belongs to the assumed K clusters. The run length was set to burn-in period of 105 interactions followed by 105 interactions suggested by authors. The program was tested for a range of possible cluster numbers (K) from 2 to 5.
Results and disscusion
Genetic variability of Zlotnicka pigs
The primary parameters of genetic variability of Zlotnicka pigs such as allele frequencies of the 11 STRs loci, exact test of HWE and genetic variation such as allele
Variability and diversity of tetrameric STRs for practical use in ZW and ZS pigs

256
number (Na), number of effective alleles (Ne), observed and expected heterozygosity (Ho and He), fixation index (F) and polymorphism information content (PIC) are summarized in Table 1 and 2.
I Vrtková et al.
Table 1. Genetic variability at microsatellite loci in Zlotnicka White
Locus Na Ne Ho He PIC F HWE
387A12F 11.000 4.951 0.711 0.802 0.777 0.109 nsS0655 4.000 2.492 0.596 0.602 0.526 0.005 nsSBH1 5.000 1.899 0.495 0.476 0.434 -0.044 nsSBH2 6.000 2.658 0.648 0.627 0.566 -0.039 nsSBH4 8.000 4.690 0.753 0.791 0.754 0.043 sSBH10 8.000 2.747 0.584 0.640 0.606 0.081 nsSBH13 5.000 2.597 0.733 0.618 0.538 -0.193 nsSBH18 7.000 3.813 0.429 0.743 0.697 0.419 s
SBH19 4.000 3.369 0.636 0.707 0.649 0.095 nsSBH20 10.000 6.722 0.901 0.856 0.833 -0.059 nsSBH22 3.000 2.912 0.767 0.660 0.642 -0.168 ns
Mean 6.455 3.532 0.659 0.684 0.638 0.023 -
Na – number of alleles, Ne – number of effective alleles, Ho – observed heterozygosity, He –expected heterozygosity, HWE (ns = not significant, s = significant p – value lower than0.1% level), F – fixation index, PIC – polymorphism information content
Table 2. Genetic variability at microsatellite loci at Zlotnicka Spotted
Locus Na Ne Ho He PIC F HWE
387A12F 7.000 1.451 0.300 0.311 0.301 0.035 nsS0655 10.000 4.229 0.753 0.765 0.724 0.014 sSBH1 8.000 5.996 0.864 0.835 0.811 -0.037 nsSBH2 10.000 5.264 0.876 0.812 0.783 -0.081 nsSBH4 6.000 2.276 0.528 0.562 0.520 0.057 sSBH10 9.000 3.609 0.688 0.725 0.682 0.048 nsSBH13 7.000 3.632 0.750 0.726 0.680 -0.035 nsSBH18 9.000 2.675 0.569 0.627 0.554 0.092 nsSBH19 5.000 3.983 0.713 0.750 0.705 0.049 nsSBH20 8.000 2.353 0.586 0.576 0.523 -0.020 nsSBH22 6.000 2.274 0.380 0.561 0.525 0.322 s
Mean 7.727 3.431 0.637 0.659 0.619 0.040 -
Na – number of alleles, Ne – number of effective alleles, Ho – observed heterozygosity, He –expected heterozygosity, HWE (ns = not significant, s = significant p – value lower than0.1% level), F – fixation index, PIC – polymorphism information content

257
We detected overall 71 alleles in 11 STR tetrameric loci in the ZW pigs. Although the average number of alleles per locus was 6.46, the number of effective alleles had an average of 3.53. Number of alleles per locus was in the range from 3 (SBH22) to 11 (387A12F). The expected heterozygosity (0.684) was close to the observed one at 0.659. The He for the individual markers varied between 0.856 (SBH20) and 0.476 (SBH1). The lowest Ho was found at the SBH18 (0.429) and SBH1 (0.495) loci whereas the highest Ho was at locus SBH20 (0.901). A negative fixation index was found at five loci. These negative values indicate an excess of heterozygotes. Highest F value (0.419) was found for the SBH18 locus. PIC was increasing from 0.434 (SBH1) to 0.833 (SBH20). We found 2 STRs loci significantly deviating from Hardy-Weinberg equilibrium (p<0.001).
In the ZS pigs, we detected overall 85 alleles. Average number of alleles per locus was 7.73, the number of effective alleles averaged to 3.43. The number of alleles per locus ranged from 5 (SBH19) to 10 (S0655, SBH2). He was 0.659, Ho was 0.637. The He for individual markers varied between 0.311 (387A12F) and 0.835 (SBH1). The lowest Ho was found in loci 387A12F (0.300) and SBH22 (0.380), the highest Ho in locus SBH2 (0.876) and SBH1 (0.864). The negative fixation index was found at four loci. Higher F values were recorded for locus SBH22 (0.322); PIC increased from 0.301 (387A12F) to 0.811 (SBH1).
There were 3 STRs loci significantly deviating from Hardy-Weinberg equilibrium (p<0.001). As presented in Tables 1 and 2, there is a difference among populations of the Zlotnicka pigs. The difference is in the number of alleles found at each locus, in the number of effective alleles, expected and observed heterozygosity and in PIC. For Na, Ho, He, and PIC the differences are as follows at particular loci (ZW vs. ZS) – Na: S0655 (4 vs. 10), Ho: 387A12F (0.711 vs. 0.300), SBH1 (0.495 vs. 0.864), He: 387A12F (0.802 vs. 0.311), SBH1 (0.476 vs. 0.835), PIC 387A12F (0.777 vs. 0.301), SBH1 (0.434 vs. 0.811). The difference in the number of effective alleles is of special interest. At SBH20, Na differs by two (10 vs. 8), whereas Ne differs by more than 4 (6.72 vs. 2.35).
The SBH4 locus significantly deviated from HWE, in both populations. Negative fixation index, which was identified in ZS, was found at same loci in ZW, as well.
The average number of alleles in ZS is by 1.272 higher than in ZW. However, the average number of effective alleles is the same (3.532 – ZW, 3.431 – ZS). Similar estimates in each of the populations were found for the other variables. Both populations are heterozygous, He and Ho are above 0.5 for the whole panel of 11 STRs.
The specific to Zlotnicka breed alleles 22 and 23 at the 387A12F locus were found at frequencies of 0.061 vs. 0.826 and 0.105 vs. 0.016, respectively. These alleles have not been found in commercial breeds that we have analysed with the panel, nor in the breeds included in Biotype Diagnostic GmbH worked out population study. The 22 allele was detected in the genetic resource in CZ (PC pig) at the frequency of 0.005 [Vrtková et al. 2016]. The 19.1 allele of the 387A12F locus was found only in ZS at frequency of 0.024. The rate difference of alleles was recorded between ZW and ZS
Variability and diversity of tetrameric STRs for practical use in ZW and ZS pigs
258
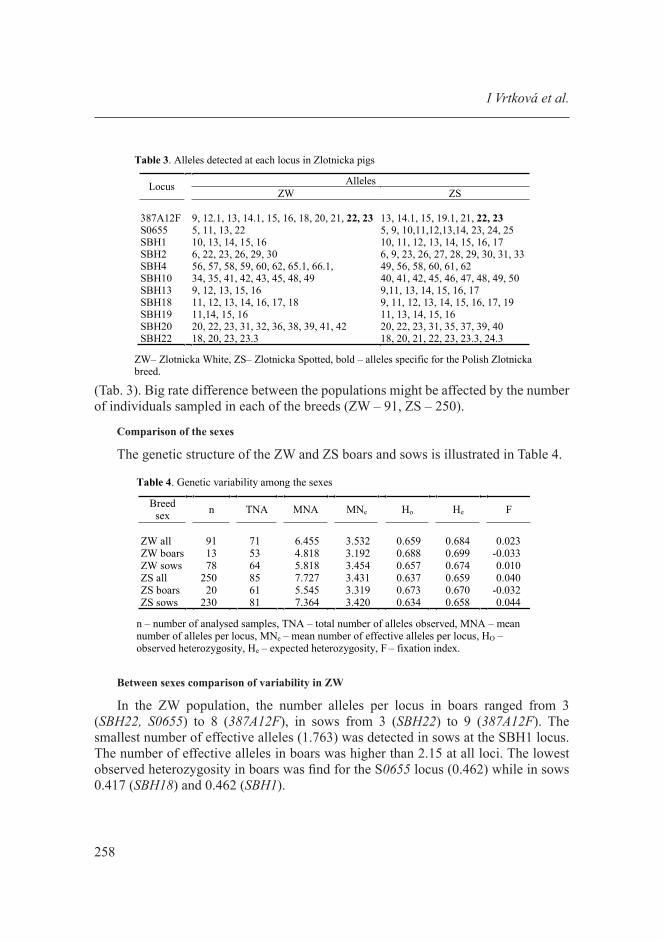
(Tab. 3). Big rate difference between the populations might be affected by the number of individuals sampled in each of the breeds (ZW – 91, ZS – 250).
Comparison of the sexes
The genetic structure of the ZW and ZS boars and sows is illustrated in Table 4.
I Vrtková et al.
Table 4. Genetic variability among the sexes
Breedsex n TNA MNA MNe Ho He F
ZW all 91 71 6.455 3.532 0.659 0.684 0.023ZW boars 13 53 4.818 3.192 0.688 0.699 -0.033ZW sows 78 64 5.818 3.454 0.657 0.674 0.010ZS all 250 85 7.727 3.431 0.637 0.659 0.040ZS boars 20 61 5.545 3.319 0.673 0.670 -0.032ZS sows 230 81 7.364 3.420 0.634 0.658 0.044
n – number of analysed samples, TNA – total number of alleles observed, MNA – meannumber of alleles per locus, MNe – mean number of effective alleles per locus, HO –observed heterozygosity, He – expected heterozygosity, F – fixation index.
Between sexes comparison of variability in ZW
In the ZW population, the number alleles per locus in boars ranged from 3 (SBH22, S0655) to 8 (387A12F), in sows from 3 (SBH22) to 9 (387A12F). The smallest number of effective alleles (1.763) was detected in sows at the SBH1 locus. The number of effective alleles in boars was higher than 2.15 at all loci. The lowest observed heterozygosity in boars was find for the S0655 locus (0.462) while in sows 0.417 (SBH18) and 0.462 (SBH1).
Table 3. Alleles detected at each locus in Zlotnicka pigs
AllelesLocus ZW ZS
387A12F 9, 12.1, 13, 14.1, 15, 16, 18, 20, 21, 22, 23 13, 14.1, 15, 19.1, 21, 22, 23S0655 5, 11, 13, 22 5, 9, 10,11,12,13,14, 23, 24, 25SBH1 10, 13, 14, 15, 16 10, 11, 12, 13, 14, 15, 16, 17SBH2 6, 22, 23, 26, 29, 30 6, 9, 23, 26, 27, 28, 29, 30, 31, 33SBH4 56, 57, 58, 59, 60, 62, 65.1, 66.1, 49, 56, 58, 60, 61, 62SBH10 34, 35, 41, 42, 43, 45, 48, 49 40, 41, 42, 45, 46, 47, 48, 49, 50SBH13 9, 12, 13, 15, 16 9,11, 13, 14, 15, 16, 17SBH18 11, 12, 13, 14, 16, 17, 18 9, 11, 12, 13, 14, 15, 16, 17, 19SBH19 11,14, 15, 16 11, 13, 14, 15, 16SBH20 20, 22, 23, 31, 32, 36, 38, 39, 41, 42 20, 22, 23, 31, 35, 37, 39, 40SBH22 18, 20, 23, 23.3 18, 20, 21, 22, 23, 23.3, 24.3
ZW– Zlotnicka White, ZS– Zlotnicka Spotted, bold – alleles specific for the Polish Zlotnickabreed.
259
Between sexes comparison of variability in ZS
In the ZS population, the number alleles per locus in boars ranged from 4 (SBH22, SBH18) to 8 (SBH1) and in sows from 5 (SBH19) to 10 (SBH2). At the 387A12F locus, low number of effective alleles was determined in both sexes (1.818, 1.422). Low Ne was detected in sows at locus SBH4 (1.786). The lowest observed heterozygosity in boars – 0.450 – was found for the SHB4 and SBH22 loci. Very low heterozygosity was observed in sows at loci 387A12F (0.283) and SBH22 (0.373).
For all other loci, in both subpopulations, the observed heterozygosity was higher than 0.5. Higher numbers of alleles per locus detected in sows was apparently caused by higher number of sows included in the data sets, which increased the probability of sampling more alleles from the pool of the alleles present in the population. Negative fixation index means surplus of heterozygotes, therefore, boars are heterozygous (even though there are just few of them) which is beneficial for sustainability of the breed. A lesser number of effective alleles in sows, is a prove of higher heterozygosity of boars, especially with regard to the numbers of animals of both sex (Tab. 4).
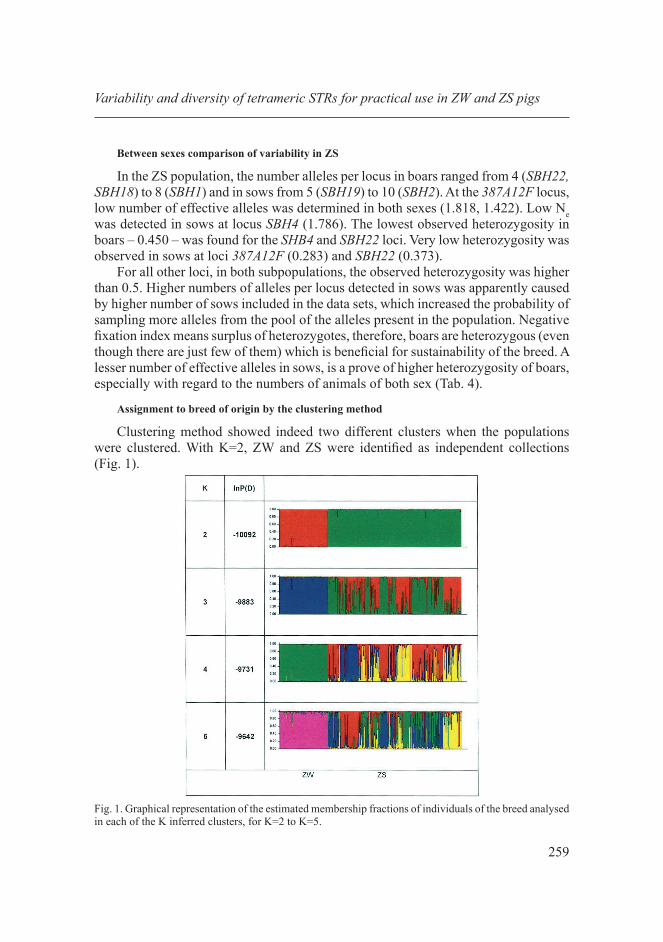
Assignment to breed of origin by the clustering method
Clustering method showed indeed two different clusters when the populations were clustered. With K=2, ZW and ZS were identified as independent collections (Fig. 1).
Variability and diversity of tetrameric STRs for practical use in ZW and ZS pigs
Fig. 1. Graphical representation of the estimated membership fractions of individuals of the breed analysed in each of the K inferred clusters, for K=2 to K=5.
260
For K=2, ZW (red) and ZS (green) were identified as separate populations. While the ZS population was further splitting up with the presumed K higher number, ZW remained unchanged up until K=5. Population ZW seems to be highly closed, separate population unless the smaller number of sampled animals had not limited the number of sampled alleles.
I Vrtková et al.
Tabl
e5.
Prob
abili
tyof
iden
tity
bylo
cus
Prob
abili
tyM
icro
sate
llite
/Loc
iZW
SBH
1S0
655
SBH
13SB
H2
SBH
22SB
H10
SBH
19SB
H18
SBH
438
7A12
FSB
H20
PI0.
316
0.23
30.
225
0.19
90.
192
0.16
20.
142
0.11
00.
078
0.06
10.
040
PISi
bs0.
592
0.50
90.
499
0.48
80.
470
0.47
30.
434
0.40
90.
376
0.36
60.
334
ZS38
7A12
FSB
H4
SBH
20SB
H22
SBH
18SB
H13
SBH
10SB
H19
S065
5SB
H2
SBH
1PI
0.48
50.
233
0.23
20.
232
0.21
20.
120
0.11
70.
107
0.09
60.
063
0.05
0PI
Sibs
0.71
60.
528
0.52
10.
528
0.49
00.
418
0.41
80.
402
0.39
20.
361
0.34
6
PI–
prob
abili
tyof
iden
tity
ofin
depe
nden
tsam
ples
,PIS
ibs–
prob
abili
tyof
iden
tity
amon
gsi
blin
gs.
Tabl
e6.
Prob
abili
tyof
excl
usio
nby
locu
s
Prob
abili
tyM
icro
sate
llite
/Loc
iZW
SBH
2038
7A12
FSB
H4
SBH
18SB
H19
SBH
10SB
H2
SBH
22SB
H13
S065
5SB
H1
P10.
699
0.62
80.
582
0.51
00.
446
0.42
70.
367
0.36
20.
336
0.32
20.
262
P20.
533
0.44
50.
404
0.33
30.
277
0.24
40.
211
0.21
60.
199
0.18
20.
116
P30.
867
0.82
00.
764
0.69
60.
619
0.63
10.
540
0.51
10.
493
0.47
40.
418
ZSSB
H1
SBH
2S0
655
SBH
19SB
H13
SBH
10SB
H18
SBH
20SB
H22
SBH
438
7A12
FP1
0.66
30.
623
0.53
80.
512
0.49
50.
492
0.35
50.
339
0.33
70.
336
0.17
9P2
0.49
10.
446
0.36
10.
335
0.31
80.
316
0.21
10.
181
0.17
20.
172
0.05
2P3
0.83
60.
802
0.71
90.
690
0.67
80.
682
0.51
80.
510
0.51
90.
516
0.31
6
P1–
prob
abili
tyof
excl
usio
nw
hen
both
pare
nts
are
know
nan
don
epa
rent
isw
rong
lyid
entif
ied,
P2–
prob
abili
tyof
excl
usio
nw
hen
only
one
pare
ntis
know
n,P3
–pr
obab
ility
ofex
clus
ion
fort
wo
puta
tive
pare
nts(
excl
udin
ga
puta
tive
pare
ntpa
ir),b
oth
pare
ntsa
rew
rong
lyid
entif
ied.

261
Traceability
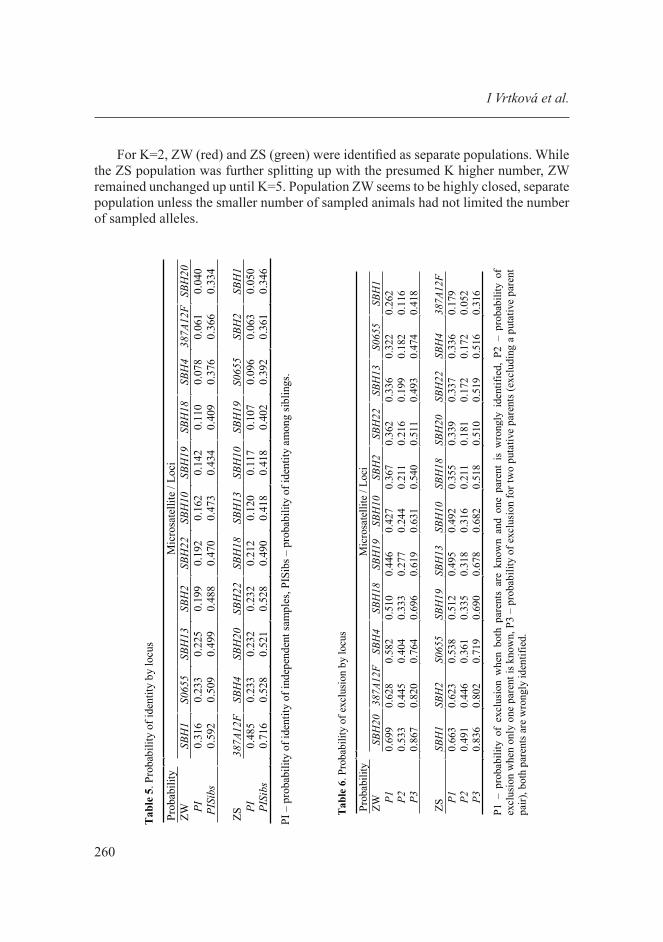
The estimates of probability of identity and probability of exclusions are important for the usability of microsatellites as identity and parentage testers. Probability of identity determination and power of exclusion varied across the loci. The estimates are shown in Tables 5 and 6.
Evaluation of effectiveness of the tetrameric STRs for traceability in ZW Markers SBH1, S0655 and SBH13 (from the least efficient) were identified as
markers of the smallest informative value and, therefore, the least suitable. SBH4, 387A12F a SBH20 (from the least efficient) are the best markers in terms of suitability for identity and parentage testing. The probability of appearance of identical genotypes (PI) at locus SBH20 in ZW is 4%. Compared to that, PI at locus SBH1 is 31.7%.
In the case of recognition of siblings in the population, the probability of appearance of identical genotypes (PISibs) is 33.5% and 59.2% for the SBH20 and SBH1 loci, respectively.
In parentage testing for P1, when we have genotypes of both parents and one of them is given incorrectly, the effectiveness is higher than 50% for four loci (SBH20 69.9%, 387A12F 62.8%, SBH4 58.2%, SBH18 51.1%). The effectiveness of these loci for P2 (when we have genotype of one parent only and this is wrongly identified) is from 53 to 33%. In the case that both presumed genotypes are known but parents are wrongly identified, the effectiveness is in range from 86.7 to 69.6%.
Evaluation of effectiveness of the tetrameric STRs for traceability in ZS
A smaller than 10 % probability of appearance of identical genotypes (PI) in ZS for loci SBH1, SBH2 a S0655 (5%, 6.3% and 9.6%) was recorded. The highest PI was found at locus 387A12F – 48.5%. For all other loci, the probability of appearance of identical genotypes in population was below 24%. Higher than 50% probability of appearance of identical genotypes in siblings in the population was detected for four loci: SBH4, SBH22, SBH10 (52%) and for the marker 387A12F, in which it reached the level of 72%.
For P1, the effectiveness is higher than 50 % for four loci (SBH1, SBH2, S0655, SBH19; descending). The effectiveness for these loci and P2 is in range from 49.1 to 33.6 %. In the case that both presumed genotypes are given but parents are wrongly identified, the effectiveness is in range from 83.6 to 69.0%. The overall effectiveness of the panel of all 11 STRs loci is listed in table 7 for both breeds.
The probability of appearance of identical genotypes PI, PISibs using complete panel of 11 STR loci varies in similar way in both populations, however, more substantial assumption of appearance of identical genotypes exists for population ZS (Tab. 7). Vrtková et al. (2016) estimated in the PC breed PI and PISibs, using all 11 loci, at 4.037.10-11 and 8.315. 10-5, respectively.
The probability of exclusion of wrong parents under P1, P2, and P3, using the whole panel of 11 loci are above 97 % in both breeds. The estimates for ZW vs. ZS are: P1 – 0.999028 vs. 0.998867; P2 – 0.979980 vs. 0.976544; and P3 – 0.999991 vs. 0.999989.
Variability and diversity of tetrameric STRs for practical use in ZW and ZS pigs

262
In PC, Vrtková et al. (2016) report exclusion probabilities for loci combinations under P1, P2, and P3 as 0.999635, 0.989994, and 0.999998, respectively.
The 11 tetrameric Short Tandem Repeats panel proved to be useful for evaluation of diversity of the ZW and ZS breeds. The important practical finding is a detection of specific alleles at locus 387A12F at high frequency in each population of Zlotnicka breed. The alleles 22 and 23 do not occur in commercial breeds, which were analysed with this panel, nor occurred in breeds included in the Biotype Diagnostic GmbH worked out population study. Allele 19.1 of the 387A12F locus was found only in ZW. The studied subpopulations of the Zlotnicka pigs differ clearly as illustrated by clustering them based on the 11 tetrameric Short Tandem Repeats panel. ZW seems to be more unified within the subpopulation, compared to ZS, hence, it is possible to correctly assign individuals to adequate breed, with the use of tetrameric STRs.
On the basis of information obtained about Prestice Black Pied pigs and the results of the present paper we suggest using the panel of tetrameric STRs loci for parentage, traceability and differentiation of subpopulations studies in pigs of similar history (genetic resources closed in the second half of the 20th century).
REFERENCES
ALVES E., FERNáNDEZ A., BARRAGáN C., OVILO C., RODRíGUEZ C., SILIó L., 2006 –Inference of hidden population substructure of the Iberian pig breed using multilocus microsatellite data. Spanish Journal of Agricultural Research 4 (1), 37-46.ANONyM 2007 – Manual. Animaltype Pig kit, [Online] Available at: http://www.biotype.de//en/products/veterinary-medicine/animaltype.html. Accessed: December 2007.BERTHOULy-SALAZAR C., THéVON S., NHU VAN T., NGUyEN B.T., PHAM L.D., VU CHU C., MAILLARD J.CH., 2012 – Uncontrolled admixture and loss of genetic diversity in a local Vietnamese pig breed. Ecol. Evol. 2(5), 962-975.FABUEL E., BARRAGAN C., SILIO L., RODRIGUEZ M.C., TORO M.A., 2004 – Analysis of genetic diversity and conservation priorities in Iberian pigs based on microsatellite markers. Heredity 93,104-113.
1.
2.
3.
4.
I Vrtková et al.
Table 7. Probability of identity and probability of exclusions forcombinations of 11 loci
Probability ZW ZS
PI 3.11777366480468 E-10 5.92143369493599 E-10PISibs 1.33129593261900 E-4 1.74908996887315 E-4P1 0.999028028006014 0.998866849228872P2 0.979979763364943 0.976543972604964P3 0.999991499126711 0.999989110205454
P1 – probability of exclusion when both parents are known and oneparent is wrongly identified, P2 – probability of exclusion when onlyone parent is known, P3 – probability of exclusion for two putativeparents (excluding a putative parent pair), both parents are wronglyidentified.
263
GUASTELLA A.M., CRISCIONE A., MARLETTA D., ZUCCARO A., CHIES L., BORDANO S., 2010 – Molecular characterization and genetic structure of the Nero Siciliano pig breed. Genet. Mol. Biol. 33 (4), 650–656.HERRERO-MEDRANO J.M., MEGENS H.J., CROOIJMANS R.P., ABELLANEDA J.M., RAMIS G., 2012 – Farm-by-farm analysis of microsatellite, mtDNA and SNP genotype data reveals inbreeding and crossbreeding as threats to the survival of a native Spanish pig breed. Animal Genet., 44(3), 259-266.HERRERO-MEDRANO J.M., MEGENS H.J., CROOIJMANS R.P., ABELLANEDA J.M., RAMIS G. (2013): Farm-by-farm analysis of microsatellite, mtDNA and SNP genotype data reveals inbreeding and crossbreeding as threats to the survival of a native Spanish breed. Animal Genetics 44, 259-266.KURył J., JANIK A., KAMyCZEK M., BUCZyńSKI J.T., – 1997 – Genetic structure of Zlotnicka White and Zlotnicka Spotted pig as defined on the basis of the polymorphism of blood groups, serum proteins and lipoprotein allotype – a review. Animal Science Papers and Reports 15(3), 163-171.LI y.H., CHU, H.P., JIANG y.N., LIN C.y., LI S.H., LI K.T., WENG G.J., CHENG C.C., LU D.J., JU y.T., 2014 – Empirical Selection of Informative Microsatellite Markers within Co-ancestry Pig Populations Is Required for Improving the Individual Assignment Efficiency. Asian-Australas Journal of Animal Sci.ence 27(5), 616-627.MARTíNEZ A.M., DELGADO J.V., RODERO A., VEGA-PLA J.L., 2000 – Genetic structure of the Iberian pig breed using microsatellites. Animal Genetics 31(5), 295-301.MARTíNEZ A.M., LANDI V.P., MARTíNEZ M.D., POTO A.R., PEINADO B.R., PONS A., BARBA C.C., CARRIL GONZáLEZ-BARROS J.A., MéNDEZ TUR y., VEGA-PLA J.L., DELGADO J.V., 2012 – Genetic characterization of autochthonous pig breeds from Spain with microsatellite markers. In: De Pedro E.J. (ed.), Cabezas A.B. (ed.). 7th International Symposium on the Mediterranean Pig. Zaragoza: CIHEAM, 2012. p. 31-37. (Options Méditerranéennes: Série A. Séminaires Méditerranéens; n. 101). 7. International Symposium on the Mediterranean Pig, 2010/10/14-16, Córdoba (Spain). PARK S.D.E., 2001 – Trypanotolerance in West African Cattle and the Population Genetic Effects of Selection. [ Ph.D. thesis] University of Dublin.PEAKALL R., SMOUSE P.E., 2012 – Genalex 6.5: genetic analysis in Excel. Population genetic software for teaching and research-an update. Bioinformatics 28, 2537–2539.PRITCHARD JK, STEPHENS M, AND DONNELLy P., 2000 – Inference of population structure using multilocus genotype data. Genetics 155:945-959.SZMATOLA T., ROPKA-MOLIK K., TyRA M., PIóRKOWSKA K., ŻUKOWSKI K., OCZKOWICZ M., BLICHARSKI T., 2016 – The genetic structure of five pig breeds maintained in Poland. Annals of Animals Science 16, 4, 1019-1026. SZULC K., BUCZyńSKI J.T., 2012 – Stare europejskie rasy świń. Poznań 2012, 124-127.ISBN 978-83-929756-5-6.TORO M., BARRAGáN C., óVILO C., RODRIGANéZ J., RODRIGUEZ C., SILIó L., 2002 – Estimation of coancestry in Iberian pigs using molecular markers. Conservation Genetics 3(3), 309-320.VRTKOVá, I., 2015 – Genetic admixture analysis in Prestice Black-Pied pigs. Arch. Anim. Breed., 58, 115-121.VRTKOVá I., VRTEK Š., FALKOVá L., 2016 – Efficiency of Tetrameric Short Tandem Repaets in Prestice Black Pied Pig for Traceability and Parentity Testing. Acta Universitatis Agriculturae et Silviculturae Mendelianae Brunensis 64,2,557-565. WILKINSON S., HALEy C., ALDERSON L., WIENER P., 2011 – An empirical assessment of individual-based population genetic statistical techniques: application to British pig breeds. Heredity, 106 (2), 261-269.
5.
6.
7.
8.
9.
10.
11.
12.
13.
14.
15.
16.
17.
18.
19.
20.
Variability and diversity of tetrameric STRs for practical use in ZW and ZS pigs