Embed Size (px)
Citation preview

Temperature: Preparation ExerciseBecca Walker and Leigh Stearns
Part 1: Air Temperature mapsUse the two maps below to answer the questions below.
DJF 2000 DJF 2010
(1) Which colors on the map represent the lowest temperatures? Which colors on the map represent the highest temperatures?
(2) Look at the 2000 map and focus your attention only on Greenland.
(a) Which range of air temperatures do you observe?
(b) Describe where you observe the highest air temperatures. (In coastal areas or inland? North/south/east/west?)
Questions/comments: education_AT_unavco.org, stearns_AT_ku.edu, or rwalker_AT_mtsac.edu Page 1Version 07/24/2015
Figure 1: Average winter air temperatures over Greenland in 2000 (Left) and 2010 (right), as derived from the University of Maine Climate Re-Analyzer (http://cci-reanalyzer.org/). The map on the left shows average air temperature in December/January/February 2000. The map on the right shows average air temperature in December/January/February 2010.

Temperature: Preparation Exercise
(c) Describe where you observe the lowest air temperatures. (In coastal areas or inland? North/south/east/west?)
(3) Look at the 2010 map and focus your attention only on Greenland.
(a) Which range of air temperatures do you observe?
(b) Describe where you observe the highest air temperatures. (In coastal areas or inland? North/south/east/west?)
(c) Describe where you observe the lowest air temperatures. (In coastal areas or inland? North/south/east/west?)
(4) With respect to color, how does the 2010 Greenland map look different from the 2000 Greenland map? Do not mention anything about temperature in this question—just describe how the colors are different.
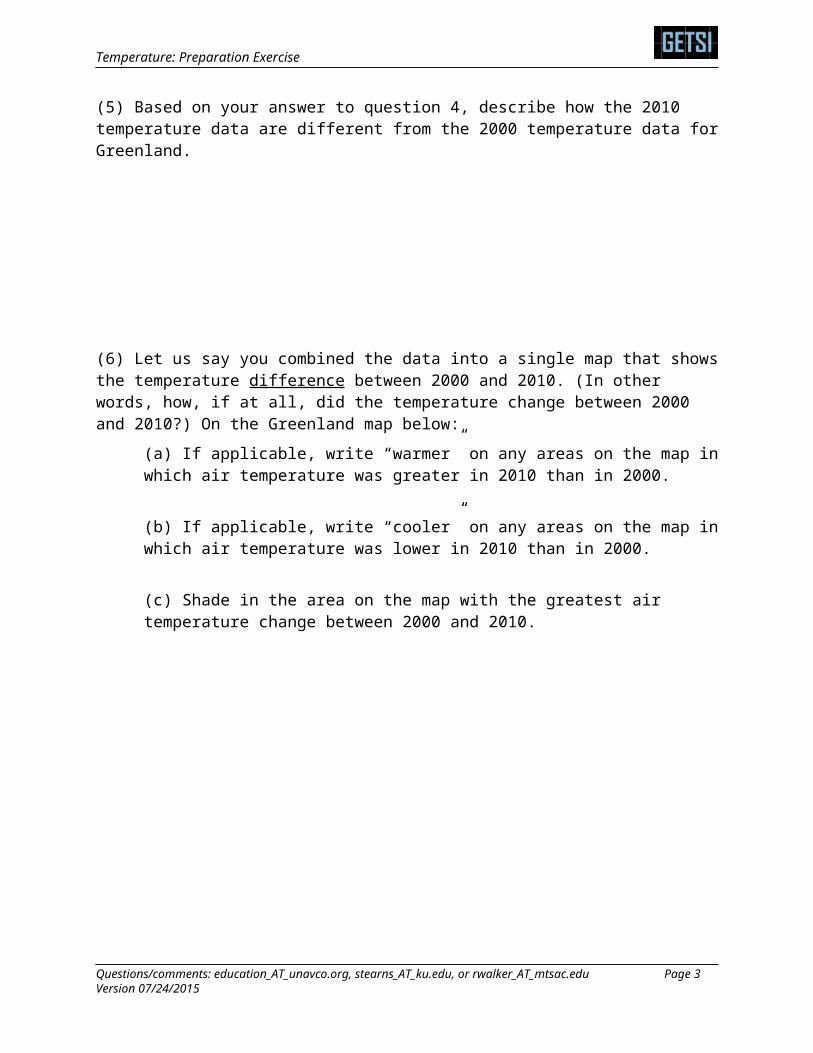
(5) Based on your answer to question 4, describe how the 2010 temperature data are different from the 2000 temperature data for Greenland.
(6) Let us say you combined the data into a single map that shows the temperature difference between 2000 and 2010. (In other words, how, if at all, did the temperature change between 2000 and 2010?) On the Greenland map below:
Questions/comments: education_AT_unavco.org, stearns_AT_ku.edu, or rwalker_AT_mtsac.edu Page 2Version 07/24/2015
Temperature: Preparation Exercise
(a) If applicable, write “warmer” on any areas on the map in which air temperature was greater in 2010 than in 2000.
(b) If applicable, write “cooler” on any areas on the map in which air temperature was lower in 2010 than in 2000.
(c) Shade in the area on the map with the greatest air temperature change between 2000 and 2010.
Questions/comments: education_AT_unavco.org, stearns_AT_ku.edu, or rwalker_AT_mtsac.edu Page 3Version 07/24/2015