Embed Size (px)
Citation preview
OECD-FAO Agricultural Outlook 2016-2025
© OECD/FAO 2016
97
PART IPART I
Chapter 3
Commodity snapshots
This chapter describes the market situation and highlights of the latest set ofquantitative medium-term projections for world and national agricultural markets,for the ten-year period 2016-25. It provides information on prices, production,consumption, trade and main uncertainties for cereals, oilseeds, sugar, meat, dairyproducts, fish, biofuels and cotton. The quantitative projections are developed withthe aid of the partial equilibrium Aglink-Cosimo model of world agriculture. Theprinted version of this chapter only includes the projection highlights for eachcommodity whereas further details and an extensive statistical annex are availableon line.
3. COMMODITY SNAPSHOTS
OECD-FAO AGRICULTURAL OUTLOOK 2016-2025 © OECD/FAO 201698
CEREALS
Market situationGlobal cereal markets have been characterised over the past few years by abundant
supplies amid slower demand growth. As a result, world inventories have increased and
international prices of all cereals have fallen to relatively low levels compared to the
previous decade. Even the decline in world cereal production in 2015, following the 2014
record harvest, could not reverse this downward pressure, leading to further declines in
international prices during the 2015 marketing year (see glossary for a definition of
marketing year). Given the early prospects in world cereal output for this season, weak
demand and large inventories in 2016, global markets are likely to experience relatively low
prices. Against this background, only radical or sudden changes in demand or supply are
likely to alter the short-term outlook.
Projection highlightsStarting with relatively low prices during the base period (2013-15), the prevailing
sluggish economic growth conditions, large stocks, low oil prices and a strong US dollar are
likely to keep prices under pressure in the short run. Over the course of the medium-term,
however, prices of wheat and coarse grains (in nominal terms) are projected to be primarily
cost driven, increasing in nominal terms but not by enough to keep pace with inflation,
implying slight declines in real terms. However, prices of all cereals even in nominal terms
are projected to be lower on average than in the previous decade, although well above the
levels of the decade before.
Global cereal production is projected to expand by 12% by 2025 from the base period,
mainly driven by yield improvements, with limited area expansion. Compared with the
base period, production of wheat in 2025 is projected to increase by 10% (71 Mt), with India
producing 10 Mt more, the People’s Republic of China (hereafter “China”) 7.9 Mt Argentina
5.6 Mt, Ukraine 5 Mt, the Islamic Republic of Iran 4.7 Mt, Turkey 4.2 Mt, the European Union
3.5 Mt, the Russian Federation 3.1 Mt, Canada 1.9 Mt1 and the United States 1.7 Mt. Rice
production is set to increase by 14% (69 Mt), with most of the increase (59 Mt) concentrated
in Asian countries, led by India (20 Mt), Indonesia (8.1 Mt), Viet Nam (6 Mt), Bangladesh and
China (4 Mt each), as well as Thailand (2.8 Mt). Maize production is projected to rise by 13%
(131 Mt), led by the United States (27 Mt), Brazil (21.5 Mt), China (21 Mt), Argentina (6 Mt),
the European Union (5.6 Mt), and Indonesia (4 Mt). Production of other coarse grains is
projected to increase by 8%, or 25 Mt, with the biggest increases in Ethiopia (5.5 Mt),
Argentina (3.1 Mt) and India (2.9 Mt), followed closely by Nigeria (1.9 Mt).
Global cereal use is projected to grow by 14% or 340 Mt, to reach 2 818 Mt by 2025.
Wheat consumption is expected to increase by 11% compared to the base period and
continues to be largely used for human consumption (69% of total use throughout the
projection period). The use of wheat for feed is projected to increase, mostly in China,
the Russian Federation and the European Union, while biofuel use of wheat only accounts
for 1.2% of global use in 2025. Maize use for animal feed is projected to increase its overall
share over total use from 56% in the base period to 60% in 2025. The projected increase in
total maize utilisation (157 Mt), is mainly driven by higher feed use (127 Mt) – mostly on
3. COMMODITY SNAPSHOTS
OECD-FAO AGRICULTURAL OUTLOOK 2016-2025 © OECD/FAO 2016 99
account of fast expanding livestock sectors in developing countries. Maize for human
consumption is projected to grow by 21% (28 Mt), mainly in developing countries,
especially those in Africa where white maize is a main staple in several countries. The use
of other coarse grains is also set to grow, by 11% (31 Mt), driven mainly by food demand
(16 Mt) followed closely by feed demand (14 Mt). The expansion of food use mainly comes
from Sub-Saharan Africa (13 Mt), while China accounts for most of the expansion for feed.
Direct human consumption remains the main end-use of rice, as a major staple food in
large parts of Asia, Africa, Latin America and the Caribbean. Total consumption is
predicted to rise to 563 Mt by 2025, sustained principally by population growth. Given the
expected demographic changes, Asian countries are anticipated to account for more than
80% of the projected increase in global rice consumption.
World trade in cereals by 2025 is projected to increase to 417 Mt, up 10% from the base
period. At this projected level, global trade would be expanding at a slightly faster rate than
production (1.6% p.a. vs. 1.2% p.a.), keeping the share of global production that is traded at
15%. For wheat, this share is expected to reach 22% by 2025, compared with 12% for maize
and 15% for other coarse grains. Continuing historical trends, developed countries are
expected to remain as the main exporters of wheat and coarse grains to developing
countries, while rice is mostly traded between developing countries. The global players on
international rice markets are expected to remain consistent, although exporters such as
Cambodia and Myanmar are projected to increase their shares of the international market
over the decade.
The anticipated continuation of lower cereal prices compared to the previous decade
will impact on planting decisions and hence supply responses. Relative prices to other
crops like oilseeds are therefore an important factor over the next decade which might lead
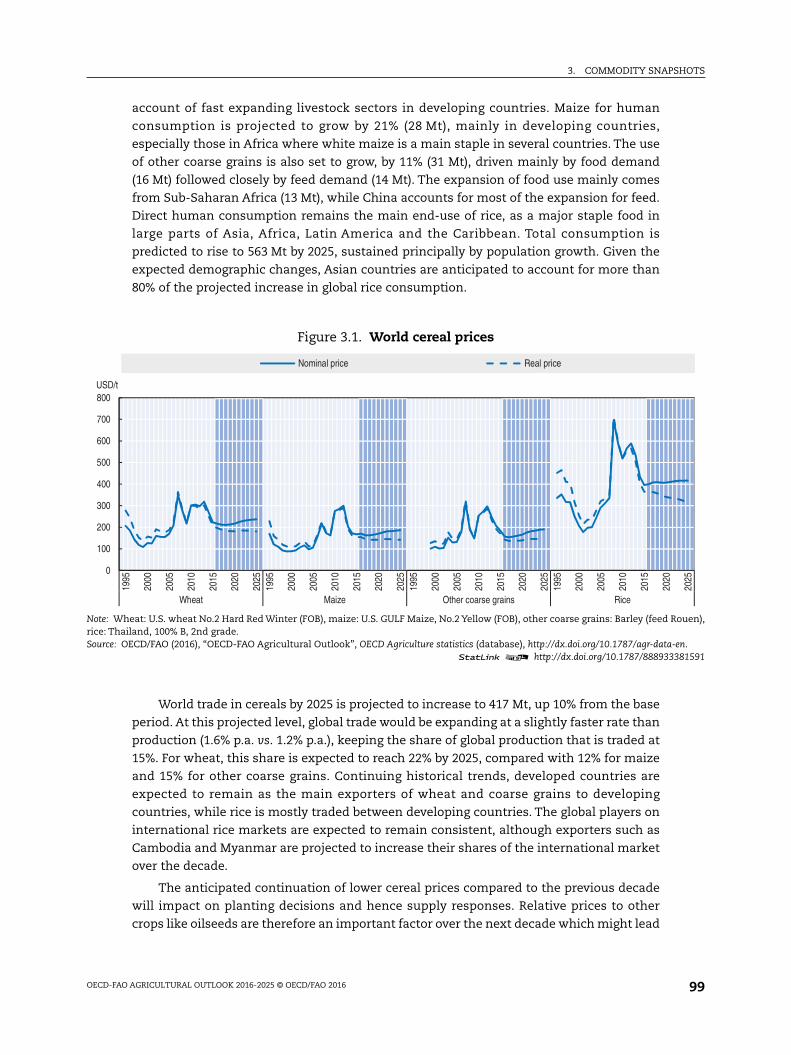
Figure 3.1. World cereal prices
Note: Wheat: U.S. wheat No.2 Hard Red Winter (FOB), maize: U.S. GULF Maize, No.2 Yellow (FOB), other coarse grains: Barley (feed Rouen),rice: Thailand, 100% B, 2nd grade.Source: OECD/FAO (2016), “OECD-FAO Agricultural Outlook”, OECD Agriculture statistics (database), http://dx.doi.org/10.1787/agr-data-en.
1 2 http://dx.doi.org/10.1787/888933381591
0
100
200
300
400
500
600
700
800
1995
2000
2005
2010
2015
2020
2025
1995
2000
2005
2010
2015
2020
2025
1995
2000
2005
2010
2015
2020
2025
1995
2000
2005
2010
2015
2020
2025
Wheat Maize Other coarse grains Rice
USD/t
Nominal price Real price
3. COMMODITY SNAPSHOTS
OECD-FAO AGRICULTURAL OUTLOOK 2016-2025 © OECD/FAO 2016100
to stronger reallocation of crops. On the demand side, developments in the fastest growing
economies will have more profound implications for trade. Demand changes in China and
their timing of releasing maize stocks are main uncertainties during the projection period.
The expanded cereals chapter is available athttp://dx.doi.org/10.1787/agr_outlook-2016-7-en
3. COMMODITY SNAPSHOTS
OECD-FAO AGRICULTURAL OUTLOOK 2016-2025 © OECD/FAO 2016 101
OILSEEDS AND OILSEED PRODUCTS
Market situationGlobal soybean production for the 2015 marketing year (see glossary for a definition of
marketing year) continued to increase, whereas production of other oilseeds (rapeseed,
sunflower seed and groundnuts) declined relative to 2014. Low crude oil and cereal prices
put additional pressure on oilseed prices.
Vegetable oil production increased more slowly than oilseed production for two
reasons. First, palm oil yields decreased in Southeast Asia due to El Niño and, second, the
slow production growth of oilseed oils due to an increased share of soybeans (containing
less oil than other oilseeds) in the oilseeds market. However, growth in vegetable oil
demand has slowed recently due to contracting biodiesel production from vegetable oils
in 2015 in several developed and developing countries. Vegetable oil prices are expected to
recover first within the oilseed complex due to currently stagnating production.
The continuously growing demand for protein meals has been the main driver behind
the expansion of oilseed production in recent years. This has increased the share of protein
meals in the returns from the crushing of oilseeds, and more so for soybeans over other
oilseeds due to its higher protein content. Compared with coarse grains and other feed
ingredients, protein meal prices have declined recently to historically average levels,
meaning that protein meal prices are about 1.5 to 2 times those of maize.
Projection highlightsIn nominal terms all oilseeds and oilseed product prices are projected to increase over
the outlook period. The price relationships within the sector will shift slightly in favour of
the meal component. Due to saturation in per capita food demand in many emerging
economies and reduced growth in biodiesel production from vegetable oils, vegetable oil
prices will decline whereas protein meal prices will increase slightly in real terms during
the outlook period.
During the outlook period, global soybean production is expected to continue its
expansion, yet at 2.4%, below the annual growth rate of 4.2% experienced during the last
decade. Production of other oilseeds increases by 1.2% p.a. over the next decade,
considerably below the growth rate of 3.6% p.a. in the previous decade. Globally, crushing
soybean and other oilseeds into meal (cake) and oil dominates total usage and it increases
slightly faster than other uses, notably direct food consumption of soybeans, groundnuts
and sunflower seed. Overall, 91% of world soybean production and 84% of world production
of other oilseeds will be crushed in 2025.
Vegetable oil includes oil from the crushing of soybeans and other oilseeds (around
55% of production), palm (36%), as well as palm kernel, coconut and cottonseed oils. World
vegetable oil production will remain concentrated among a few countries in the coming
decade. Despite a slowdown in area expansion, significant production growth still occurs
in the main palm oil producing countries: Indonesia (2.5% p.a. vs. 8.1% p.a. in the previous
decade) and Malaysia (2.1% p.a. vs. 2.4% p.a.). The other source of growth is soybean oil
produced from the increased production and crushing of soybeans. Demand growth for
vegetable oil is expected to slow down in the coming decade due to: a) reduced growth in
3. COMMODITY SNAPSHOTS
OECD-FAO AGRICULTURAL OUTLOOK 2016-2025 © OECD/FAO 2016102
per capita food use in developing countries, at 1.5% p.a. compared to 3.0% in the previous
decade; and b) only slight increases in biodiesel production from vegetable oils at 1.5% p.a.,
due to the gradual fulfilment of biodiesel mandates.
Protein meal production and consumption is dominated by soybean meal. Compared
to the past decade, consumption growth of protein meal slows down (2.2% p.a. vs. 3.9%
p.a.), reflecting both slower growth in global livestock production and saturated levels of
protein meal in Chinese feed rations. Chinese consumption of protein meal is projected to
grow by 2.7% p.a. compared to 7.9% p.a. in the previous decade, still exceeding the growth
rate of animal production however.
Growth in the world trade of soybeans is expected to slow down considerably in the
next decade, compared to the previous decade. This development is directly linked to the
projected slower growth in soybean crushing in the People’s Republic of China (hereafter
“China”). Because the growth in livestock production is expected to be concentrated in the
main protein meal producing countries, domestic use of protein meal increases while trade
will only expand slightly in the coming decade, resulting in a declining share of trade in
world production.
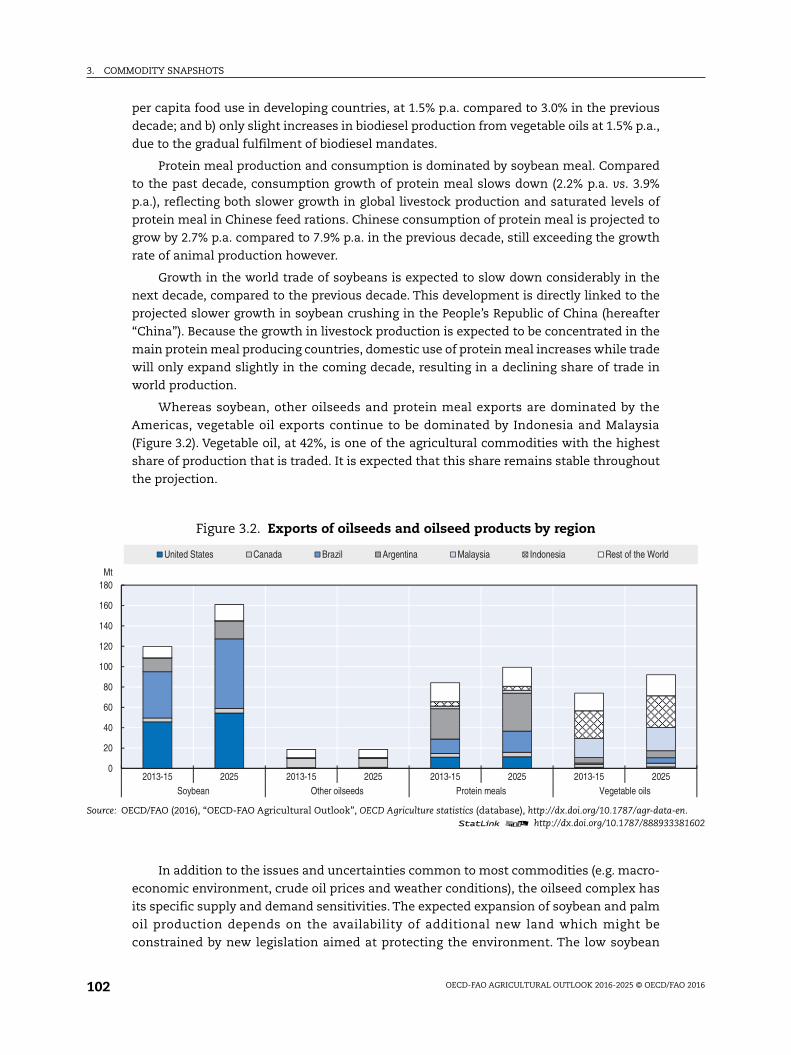
Whereas soybean, other oilseeds and protein meal exports are dominated by the
Americas, vegetable oil exports continue to be dominated by Indonesia and Malaysia
(Figure 3.2). Vegetable oil, at 42%, is one of the agricultural commodities with the highest
share of production that is traded. It is expected that this share remains stable throughout
the projection.
In addition to the issues and uncertainties common to most commodities (e.g. macro-
economic environment, crude oil prices and weather conditions), the oilseed complex has
its specific supply and demand sensitivities. The expected expansion of soybean and palm
oil production depends on the availability of additional new land which might be
constrained by new legislation aimed at protecting the environment. The low soybean
Figure 3.2. Exports of oilseeds and oilseed products by region
Source: OECD/FAO (2016), “OECD-FAO Agricultural Outlook”, OECD Agriculture statistics (database), http://dx.doi.org/10.1787/agr-data-en.1 2 http://dx.doi.org/10.1787/888933381602
0
20
40
60
80
100
120
140
160
180
2013-15 2025 2013-15 2025 2013-15 2025 2013-15 2025Soybean Other oilseeds Protein meals Vegetable oils
Mt
United States Canada Brazil Argentina Malaysia Indonesia Rest of the World
3. COMMODITY SNAPSHOTS
OECD-FAO AGRICULTURAL OUTLOOK 2016-2025 © OECD/FAO 2016 103
stock-to-use level projected for the end of the outlook period is a source of uncertainty for
the stability of prices if the sector is affected by adverse weather events. Biofuel policies in
the United States, the European Union and Indonesia are also a source of major
uncertainties in the vegetable oil sector because they have an impact on a considerable
share of the demand in these countries.
The expanded oilseeds and oilseed products chapter is available athttp://dx.doi.org/10.1787/agr_outlook-2016-8-en
3. COMMODITY SNAPSHOTS
OECD-FAO AGRICULTURAL OUTLOOK 2016-2025 © OECD/FAO 2016104
SUGAR
Market situationInternational sugar prices fell by more than 30% in 2014. The prospect of a global sugar
production deficit has led to a price increase at the start of the current season, but with
stocks still at comfortable levels, the price increase is expected to average slightly above 2%
in the 2015 marketing year (see glossary for a definition of marketing year).
Indeed, there has been a slowdown in output growth since 2013, and global sugar
production is expected to fall by about 5 Mt in 2015. Given steady growth in global
consumption, this should put an end to the surplus phase. Increases in sugar production
are foreseen in Brazil (the leading producer and exporter), Australia, the Russian Federation
and Thailand, but two main producers, India and the European Union, will see a decrease.
After four years of replenishing global stocks, the stocks-to-use ratio should begin to
decline at the start of the 2016-25 outlook period.
Projection highlightsThe continuation of in place domestic policy measures as well as Brazil’s sugarcane
production prospects will continue to largely influence the sugar market over the medium-
term. World sugar prices, when denominated in US dollars, are not expected to increase
much as production prospects should be able to satisfy a growing world demand,
notwithstanding WHO recommendations to reduce daily “free” sugar intake to less than
10% of total energy intake.
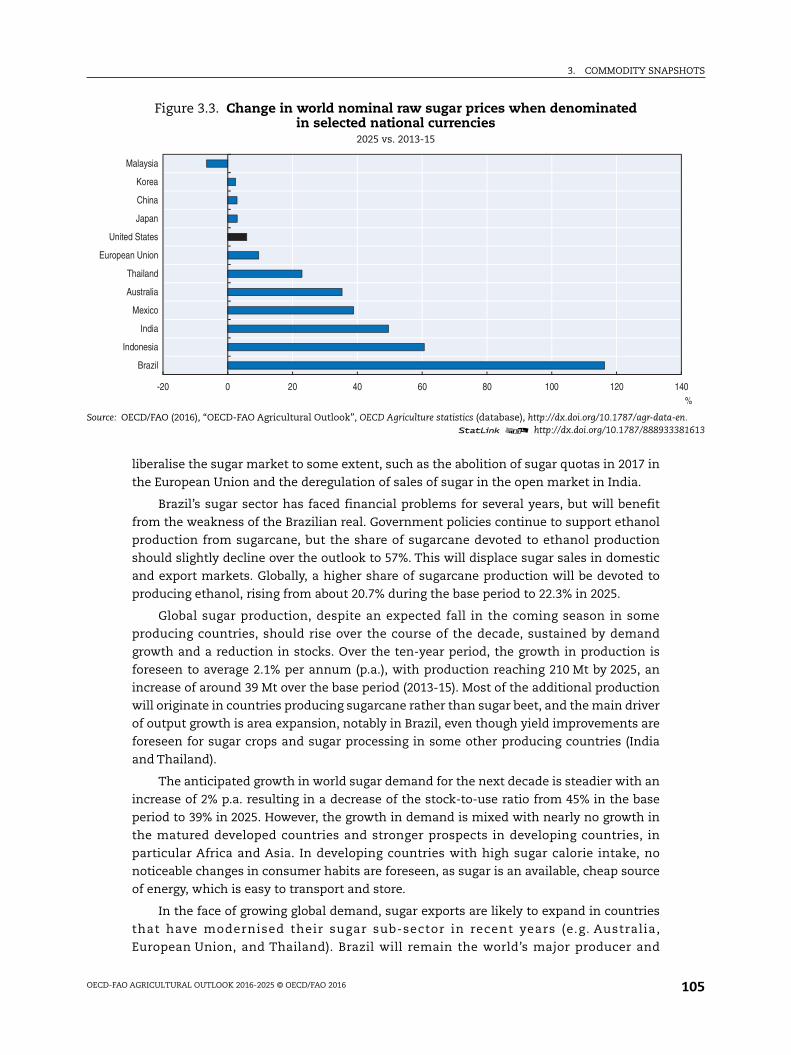
In terms of the macro-economic assumptions underpinning the Outlook, exchange
rates are a key factor affecting the sugar market. Over the forecast period, the USD is
assumed to strengthen against the majority of currencies, enhancing the competitiveness
of major sugar exporters on the world market, especially Brazil. In contrast, a few deficit
countries located mainly in Asia (China, Korea, Japan, Malaysia), will benefit from a firming
of their exchange rates against the USD, making imports less expensive when
denominated in local currencies.
World sugar prices, with the return to a deficit phase, are expected to increase only
slightly for a couple of years as a consequence of high level of stocks and low oil prices.
They are then foreseen to follow a moderate upward trend. The international raw sugar
price (Intercontinental Exchange No. 11 contract nearby futures) is projected to reach
USD 342/t (USD 15.5 cts/lb) in 2025, in nominal terms. Similarly, the indicator world white
sugar price (Euronet, Liffe futures Contract No.407, London) is projected to reach USD 425/t
(USD 19.2 cts/lb) in nominal terms in 2025. The white sugar premium (difference between
white and raw sugar prices) should temporarily decline in 2017 with the decline in the EU
raw sugar imports after quota abolition, before returning to a level close to USD 83/t at the
end of the period.
The sugar sub-sectors in many developed and developing countries will continue to
benefit from domestic policy support measures such as high import tariffs, tariff rate
quotas, and minimum price support. These policies will continue to distort markets and
contribute to the relatively elevated level of market volatility. However, new policies will
3. COMMODITY SNAPSHOTS
OECD-FAO AGRICULTURAL OUTLOOK 2016-2025 © OECD/FAO 2016 105
liberalise the sugar market to some extent, such as the abolition of sugar quotas in 2017 in
the European Union and the deregulation of sales of sugar in the open market in India.
Brazil’s sugar sector has faced financial problems for several years, but will benefit
from the weakness of the Brazilian real. Government policies continue to support ethanol
production from sugarcane, but the share of sugarcane devoted to ethanol production
should slightly decline over the outlook to 57%. This will displace sugar sales in domestic
and export markets. Globally, a higher share of sugarcane production will be devoted to
producing ethanol, rising from about 20.7% during the base period to 22.3% in 2025.
Global sugar production, despite an expected fall in the coming season in some
producing countries, should rise over the course of the decade, sustained by demand
growth and a reduction in stocks. Over the ten-year period, the growth in production is
foreseen to average 2.1% per annum (p.a.), with production reaching 210 Mt by 2025, an
increase of around 39 Mt over the base period (2013-15). Most of the additional production
will originate in countries producing sugarcane rather than sugar beet, and the main driver
of output growth is area expansion, notably in Brazil, even though yield improvements are
foreseen for sugar crops and sugar processing in some other producing countries (India
and Thailand).
The anticipated growth in world sugar demand for the next decade is steadier with an
increase of 2% p.a. resulting in a decrease of the stock-to-use ratio from 45% in the base
period to 39% in 2025. However, the growth in demand is mixed with nearly no growth in
the matured developed countries and stronger prospects in developing countries, in
particular Africa and Asia. In developing countries with high sugar calorie intake, no
noticeable changes in consumer habits are foreseen, as sugar is an available, cheap source
of energy, which is easy to transport and store.
In the face of growing global demand, sugar exports are likely to expand in countries
that have modernised their sugar sub-sector in recent years (e.g. Australia,
European Union, and Thailand). Brazil will remain the world’s major producer and
Figure 3.3. Change in world nominal raw sugar prices when denominatedin selected national currencies
2025 vs. 2013-15
Source: OECD/FAO (2016), “OECD-FAO Agricultural Outlook”, OECD Agriculture statistics (database), http://dx.doi.org/10.1787/agr-data-en.1 2 http://dx.doi.org/10.1787/888933381613
-20 0 20 40 60 80 100 120 140
Brazil
Indonesia
India
Mexico
Australia
Thailand
European Union
United States
Japan
China
Korea
Malaysia
%
3. COMMODITY SNAPSHOTS
OECD-FAO AGRICULTURAL OUTLOOK 2016-2025 © OECD/FAO 2016106
exporter, but lose market share at the start of the period, opting for more profitable ethanol
production in the short-term. Favourable currency terms should encourage investment.
Overall, Brazil’s share of world sugar exports is expected to decline at the start of the
projection period before recovering to a level close to that achieved during the base period
(41%). On the other side, imports will remain diversified, mostly driven by demand from
Africa and Asia.
Over the medium-term, the interaction between the sugar market and other sectors
such as the feed sector, biofuels, and other caloric sweeteners (e.g. isoglucose) will
generate feedback effects. Also, with existing policies and high fixed costs, the sugar sector
should stay volatile. Furthermore, any external shock to one of the related markets, or to
the exogenous assumptions, could alter the results discussed in this report.
The expanded sugar chapter is available athttp://dx.doi.org/10.1787/agr_outlook-2016-9-en
3. COMMODITY SNAPSHOTS
OECD-FAO AGRICULTURAL OUTLOOK 2016-2025 © OECD/FAO 2016 107
MEAT
Market situationWeaker demand for meats by emerging economies and oil exporting countries
throughout 2015 exerted significant downward pressure on meat prices. According to the
FAO Meat Price Index, meat prices in 2015 fell to a level last seen in early 2010. This fall
contrasts with an extended period of continued, though at times volatile, meat price
increases that started back in 2002. Only once during this extended period – during the
aftermath of the 2007-08 financial crisis – have meat prices fallen by such a magnitude.
World trade in 2015 stalled in volume terms. Meat exports from the Americas, the
dominant supplier region, fell in 2015 reflecting weakening supply to the rest of the world.
Lower imports from the Russian Federation, and a net trade loss in North America
estimated at close to one million tonnes, substantially reduced supplies going to other
parts of the world.
Projection highlightsThe Outlook for the meat market remains strong. Feed grain prices are set to remain
low for the projection period, giving stability to a sector that had been operating in an
environment of particularly high and volatile feed costs over most of the past decade. This
is particularly relevant for regions such as the Americas, Australia and Europe, where feed
grains are being used more intensively in the production of meat.
Global meat production is projected to be 16% higher in 2025 than in the base period
(2013-15). This compares with an increase of almost 20% in the previous decade.
Developing countries are projected to account for the vast majority of the total increase,
through a more intensive use of protein meal in feed rations. Poultry meat is the primary
driver of the growth in total meat production in response to expanding global demand for
this more affordable animal protein compared to red meats. Low production costs and
lower product prices have contributed to making poultry the meat of choice both for
producers and consumers in developing countries. In the bovine meat sector, several years
of cow herd liquidation in major producing regions resulted in low beef production in 2015.
However, production is expected to grow from 2016 onwards, with higher carcass weights
more than offsetting the decline in cattle slaughter. Pigmeat production will also grow
after 2016, driven by China, where herd size is expected to stabilise after years of
substantial reductions (a drop of 25 million pigs between 2012 and 2015). Another factor
contributing to China’s output expansion in the coming years is further consolidation of
the pork sector. Production is also expected to increase in the sheepmeat sector with an
expected global growth of 2.1% p.a., a higher rate than the last decade, and led by China,
Pakistan, Sudan and Australia.
Globally 10% of meat output will be traded in 2025, up from 9% in 2015, with most of
the increase coming from poultry meat. Import demand will be weak during the first years
of the outlook period, mainly due to lower imports due to the import ban of
the Russian Federation and slower growth in China, but will strengthen in the second half
of the projection period, due to import growth in the developing world. The most
significant growth in import demand originates from Viet Nam, which captures a large

3. COMMODITY SNAPSHOTS
OECD-FAO AGRICULTURAL OUTLOOK 2016-2025 © OECD/FAO 2016108
share of additional imports for all meat types. Africa is another fast growing meat
importing region albeit from a lower base. Although developed countries are still expected
to account for slightly more than half of global meat exports by 2025, their share is steadily
decreasing relative to the base period. On the other hand, Brazil’s share of global exports is
expected to increase to around 26%, contributing to nearly half of the expected increase in
global meat exports over the projection period.
Nominal meat prices are expected to start at levels similar to those registered in 2010,
and in most cases, trend marginally upwards. By 2025, prices for beef and pigmeat are
projected to increase to around USD 4 497/t carcass weight equivalent (c.w.e.) and
USD 1 580/t c.w.e. respectively, while world sheepmeat and poultry prices are expected to
rise to around USD 3 857/t c.w.e. and USD 1 571/t product weight (p.w.) respectively. In real
terms meat prices are expected to trend down from their recent high levels (Figure 3.4).
Global annual meat consumption per capita is expected to reach 35.3 kg retail weight
equivalent (r.w.e.) by 2025, an increase of 1.3 kg r.w.e. compared to the base period. This
additional consumption will consist mainly of poultry. In absolute terms, total
consumption growth in developed countries over the projection period is expected to
remain small relative to developing regions, where rapid population growth and
urbanisation remains the core drivers. This is particularly true in Sub-Saharan Africa,
where the rate of total consumption growth over the outlook period is faster than any other
region. The composition of growth is also somewhat unique, with the absolute growth in
beef almost matching poultry.
Globally, animal disease outbreaks and trade policies remain among the main factors
driving the evolution and dynamics in world meat markets. The implementation of various
trade agreements, such as the proposed Trans-Pacific Partnership, over the outlook period
could increase and diversify meat trade. An announcement in 2015 by International
Agency for Research on Cancer of the World Health Organization (IARC) classified
Figure 3.4. World meat prices
Note: US Choice steers, 1 100-1 300 lb dressed weight, Nebraska. New Zealand lamb schedule price dressed weight, all grade average. USBarrows and gilts, No. 1-3, 230-250 lb dressed weight, Iowa/South Minnesota. Brazil: Export unit value for chicken (FOB) product weight.Source: OECD/FAO (2016), “OECD-FAO Agricultural Outlook”, OECD Agriculture statistics (database), http://dx.doi.org/10.1787/agr-data-en.
1 2 http://dx.doi.org/10.1787/888933381625
1 000
2 000
3 000
4 000
5 000
6 000
500
1 000
1 500
2 000
2 500
1995
2000
2005
2010
2015
2020
2025
1995
2000
2005
2010
2015
2020
2025
1995
2000
2005
2010
2015
2020
2025
1995
2000
2005
2010
2015
2020
2025
Pork Poultry Beef (right axis) Sheep (right axis)
USD/tUSD/t
Nominal price Real price
3. COMMODITY SNAPSHOTS
OECD-FAO AGRICULTURAL OUTLOOK 2016-2025 © OECD/FAO 2016 109
processed meat2 as carcinogenic. This raised concerns among consumers worldwide and
may impact the projected consumption of countries with high per capita meat
consumption.
The expanded meat chapter is available athttp://dx.doi.org/10.1787/agr_outlook-2016-10-en
3. COMMODITY SNAPSHOTS
OECD-FAO AGRICULTURAL OUTLOOK 2016-2025 © OECD/FAO 2016110
DAIRY AND DAIRY PRODUCTS
Market situationInternational prices of all dairy products continued to decline from their 2013 peak, in
particular for skim milk powder (SMP) and whole milk powder (WMP). A key factor was the
decline in Chinese import demand, with demand for WMP dropping by 34% from 2014
levels. This decrease in Chinese demand for dairy products was coupled with continued
production growth between 2014 and 2015, in key export markets, with total output of
milk increasing in Australia (4%), the European Union (2%), New Zealand (5%) and
the United States (1%).
The Russian Federation’s ban on imports continues to restrict dairy trade. Russian
cheese imports dropped by 62% between 2013 and 2015, which mainly affected exports
from the European Union, the United States and Australia. Conversely, Belarus has greatly
increased cheese exports to the Russian Federation, supplementing demand there. The
ban is assumed to continue until the start of 2017; with imports of cheese expected to
increase sharply as trading resumes, mostly supplied from the European Union and
the United States, albeit at lower levels than prior to the ban.
Production in Oceania is facing challenges, low dairy prices have caused a reduction in
the total dairy herd, which dropped by 2.7% in 2015. Furthermore drought and adverse
weather conditions related to a very strong El Niño have restricted production in Oceania’s
pasture-based systems in 2016; this is expected to reduce production in New Zealand by
6.8% and to stall growth in Australia.
Previously good margins combined with the removal of the EU milk quota as of
April 2015 has promoted growth in total milk production in the European Union. This
growth, however, has been uneven across member states. For example, milk deliveries
from the 2014 to 2015 marketing year (April-March) increased by 18.5% in Ireland, 3.7% in
Germany, 2.9% in the United Kingdom, and 11.9% in the Netherlands. With increased milk
production and limited growth in domestic consumption, EU exports for all major dairy
commodities on aggregate are expected to increase by 58.5% between the 2013-15 base
years and 2025.
Projection highlightsPer capita demand for dairy products in developing countries is expected to grow
consistently over the medium-term, supported by rising incomes and lower dairy prices
relative to their 2013 peak. As seen in previous years there is a continued shift in dietary
patterns away from staples and towards animal products, due to changes in diets. Strong
consumption growth is expected across several markets in the Middle East and Asia,
including Saudi Arabia, Egypt, Iran and Indonesia, with the per capita consumption of
dairy products in developing countries growing between 0.8% and 1.7% p.a., the lowest
growth being for cheese and the highest for fresh dairy products. In addition, per capita
consumption in the developed world is expected to grow between 0.5% for fresh dairy
products and 1.1% p.a. for SMP.
3. COMMODITY SNAPSHOTS
OECD-FAO AGRICULTURAL OUTLOOK 2016-2025 © OECD/FAO 2016 111
World milk production is projected to increase by 177 Mt (23%) by 2025 compared to
the base years (2013-15), corresponding to an average grow rate of 1.8% p.a. which is below
the 2.0% p.a. witnessed in the last decade. The majority of this growth (73%) is anticipated
to come from developing countries, in particular India and Pakistan. This expansion of
production is largely in fresh dairy products, which will grow at 2.9% p.a. in developing
countries, and predominantly supply domestic markets. At the world level, production of
the main dairy products (butter, cheese, SMP and WMP) is increasing at similar pace to milk
production, albeit more slowly than that of fresh dairy products.
As a result of these demand and supply factors, nominal prices of all dairy products
are expected to increase over the medium-term, along with real prices of milk powders,
which recover from their current lows. The real prices of butter and cheese are expected to
decline slightly over the next decade, although this is from a comparatively higher base
level than for milk powders.
The strengthening of both the US Dollar and the euro will put pressure on the growth
of exports from the United States and the European Union, as they become less
competitive on the global market. Conversely, exporters in Argentina, Australia and
New Zealand are projected to become more competitive on the world market due to
relatively weaker currencies.
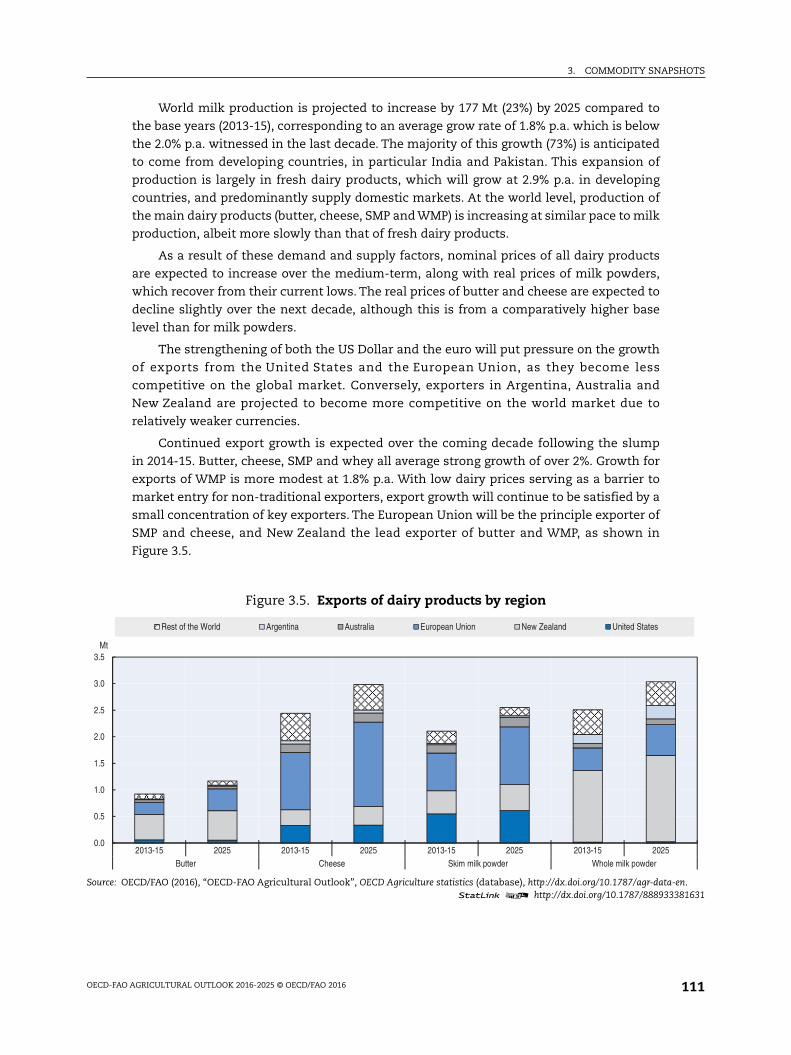
Continued export growth is expected over the coming decade following the slump
in 2014-15. Butter, cheese, SMP and whey all average strong growth of over 2%. Growth for
exports of WMP is more modest at 1.8% p.a. With low dairy prices serving as a barrier to
market entry for non-traditional exporters, export growth will continue to be satisfied by a
small concentration of key exporters. The European Union will be the principle exporter of
SMP and cheese, and New Zealand the lead exporter of butter and WMP, as shown in
Figure 3.5.
Figure 3.5. Exports of dairy products by region
Source: OECD/FAO (2016), “OECD-FAO Agricultural Outlook”, OECD Agriculture statistics (database), http://dx.doi.org/10.1787/agr-data-en.1 2 http://dx.doi.org/10.1787/888933381631
0.0
0.5
1.0
1.5
2.0
2.5
3.0
3.5
2013-15 2025 2013-15 2025 2013-15 2025 2013-15 2025Butter Cheese Skim milk powder Whole milk powder
Mt
Rest of the World Argentina Australia European Union New Zealand United States
3. COMMODITY SNAPSHOTS
OECD-FAO AGRICULTURAL OUTLOOK 2016-2025 © OECD/FAO 2016112
The global dairy commodity market is prone to disturbances from weather variability,
changes in policy, and the opening or closing of trade in key countries. Many of the
developments in the dairy market will stem from import demand in the China and how
quickly producers react to lower prices. The Outlook foresees a strengthening of demand
from developing countries and assumes that while China does not resume importing WMP
and butter at 2014 levels, instead servicing much of its demand internally, SMP and cheese
imports will increase over the outlook period.
The expanded dairy and dairy products chapter is available athttp://dx.doi.org/10.1787/agr_outlook-2016-11-en
3. COMMODITY SNAPSHOTS
OECD-FAO AGRICULTURAL OUTLOOK 2016-2025 © OECD/FAO 2016 113
FISH AND SEAFOOD
Market situationDuring 2015, the global fishery and aquaculture sector showed sustained growth in
overall production and consumption. In 2014, aquaculture’s contribution to total fish
supplied for food overtook that of wild fish for the first time and this trend continued
in 2015. In the same year, after a period of continuous expansion, trade of fish and fishery
products declined in value terms. This slowdown was caused by economic contractions in
key markets, exchange rate developments and lower fish prices. China, the leading
producer, processor and exporter, and the third largest importer of fish and fishery
products entered a period of serious uncertainty, even reducing its fish exports due to a
slowdown in its processing sector. Seafood consumption in the Russian Federation
suffered from the effects of its continuing trade embargo on fish from certain countries.
Norway had record total export values, while in Thailand and other large shrimp supplying
countries lower shrimp prices pushed total export values down significantly. Catches of
anchoveta (mainly used to produce fishmeal and fish oil) were better than expected,
relieving some short-term pressure on fishmeal and fish oil prices.
Prices of wild species increased more than those of farmed seafood in 2015, as
measured by the FAO Fish Price Index (base 2002-04 = 100). Since reaching a peak in
March 2014, with the index at 164, overall fish prices have shown a decreasing trend, with
the index falling to 135 in July 2015 due to reduced consumer demand in key markets and
an increased supply in certain fishery species. During the end of 2015 and early 2016, prices
started to slightly recover.
Projection highlightsThe outlook for the fish sector remains largely positive. In nominal terms, average fish
prices are all expected to decline in the first part of the projection period before recovering
in the last five years of the outlook period. In 2025, average producer prices are projected to
be slightly higher than during the 2013-15 base period, as demand growth is expected to
outpace supply. However, the average prices for traded products for human consumption,
fishmeal and fish oil are projected to be slightly lower in 2025 relative to the base period. In
real terms, however, all prices are expected to decrease over the next decade from the
record highs attained in 2014.
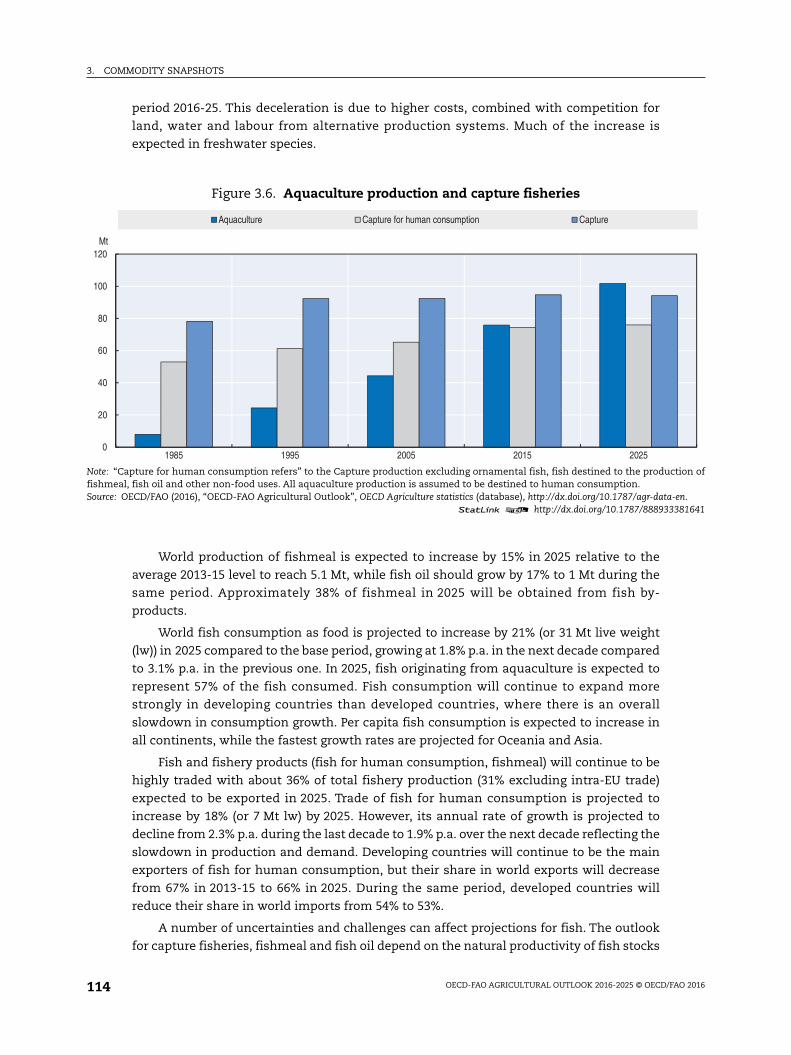
World fish production is projected to grow at 1.5% p.a. during the outlook period, a
slowdown relative to the 2.5% p.a. of the previous decade. Production is expected to reach
196 Mt, with an overall increase of 29 Mt, or 17%, between the base period and 2025. Most
of the production growth for fish will take place in developing countries and in particular
in Asia. As capture fisheries production is expected to increase by only 1%, by 2025, the
majority of growth will come from aquaculture, which will surpass total capture fisheries
in 2021 (Figure 3.6). Despite the increasing role of aquaculture in total fish supply, the
capture sector is expected to remain dominant for a number of species and vital for
domestic and international food security.
Aquaculture will continue to be one of the fastest growing food sectors despite its
average annual growth rate slowing from 5.4% p.a. in the previous decade to 3.0% p.a. in the
3. COMMODITY SNAPSHOTS
OECD-FAO AGRICULTURAL OUTLOOK 2016-2025 © OECD/FAO 2016114
period 2016-25. This deceleration is due to higher costs, combined with competition for
land, water and labour from alternative production systems. Much of the increase is
expected in freshwater species.
World production of fishmeal is expected to increase by 15% in 2025 relative to the
average 2013-15 level to reach 5.1 Mt, while fish oil should grow by 17% to 1 Mt during the
same period. Approximately 38% of fishmeal in 2025 will be obtained from fish by-
products.
World fish consumption as food is projected to increase by 21% (or 31 Mt live weight
(lw)) in 2025 compared to the base period, growing at 1.8% p.a. in the next decade compared
to 3.1% p.a. in the previous one. In 2025, fish originating from aquaculture is expected to
represent 57% of the fish consumed. Fish consumption will continue to expand more
strongly in developing countries than developed countries, where there is an overall
slowdown in consumption growth. Per capita fish consumption is expected to increase in
all continents, while the fastest growth rates are projected for Oceania and Asia.
Fish and fishery products (fish for human consumption, fishmeal) will continue to be
highly traded with about 36% of total fishery production (31% excluding intra-EU trade)
expected to be exported in 2025. Trade of fish for human consumption is projected to
increase by 18% (or 7 Mt lw) by 2025. However, its annual rate of growth is projected to
decline from 2.3% p.a. during the last decade to 1.9% p.a. over the next decade reflecting the
slowdown in production and demand. Developing countries will continue to be the main
exporters of fish for human consumption, but their share in world exports will decrease
from 67% in 2013-15 to 66% in 2025. During the same period, developed countries will
reduce their share in world imports from 54% to 53%.
A number of uncertainties and challenges can affect projections for fish. The outlook
for capture fisheries, fishmeal and fish oil depend on the natural productivity of fish stocks
Figure 3.6. Aquaculture production and capture fisheries
Note: “Capture for human consumption refers” to the Capture production excluding ornamental fish, fish destined to the production offishmeal, fish oil and other non-food uses. All aquaculture production is assumed to be destined to human consumption.Source: OECD/FAO (2016), “OECD-FAO Agricultural Outlook”, OECD Agriculture statistics (database), http://dx.doi.org/10.1787/agr-data-en.
1 2 http://dx.doi.org/10.1787/888933381641
0
20
40
60
80
100
120
1985 1995 2005 2015 2025
Mt
Aquaculture Capture for human consumption Capture
3. COMMODITY SNAPSHOTS
OECD-FAO AGRICULTURAL OUTLOOK 2016-2025 © OECD/FAO 2016 115
and ecosystems, which is uncertain, as well as on variable weather patterns. For
aquaculture, relevant factors are the accessibility and availability of sites and water
resources as well as to technology and finance; the sustainability, availability and cost of
fish seeds (e.g. eggs, spawn, offspring, fry, larvae) and feeds; antibiotic use; assessment of
environmental impacts (including pollution, fish diseases and escapees); and food safety
and traceability issues. Furthermore, trade policies, trade agreements and market access
remain important factors influencing the overall dynamics of world fish markets.
The expanded fish and seafood chapter is available athttp://dx.doi.org/10.1787/agr_outlook-2016-12-en
3. COMMODITY SNAPSHOTS
OECD-FAO AGRICULTURAL OUTLOOK 2016-2025 © OECD/FAO 2016116
BIOFUELS
Market situationSeveral political changes concerning biofuel markets were finalised in the course
of 2015. In Brazil, the taxation system was amended to favour hydrous ethanol rather than
gasohol3 and the mandatory anhydrous ethanol blending ratio was increased from 25% to
27%. In the European Union, revisions to the Renewable Energy Directive (RED) and to the
Fuel Quality Directive were adopted. A 7% cap was introduced on renewable energy coming
from food and feed crops in the transport sector by 2020. After a long delay, the US
Environmental Protection Agency’s (EPA) final rulemaking for the years 2014-16 was issued
in November 2015. The mandates specified are higher than those proposed earlier in the
year, though still considerably lower than the initial levels proposed in 2007.
World ethanol4 and biodiesel5 prices continued to decrease in nominal terms in 2015
due to weak crude oil and biofuel feedstock prices. Demand for bioenergy in the
transportation sector was mostly driven by blending mandates in major economies and by
sustained fuel use around the world.
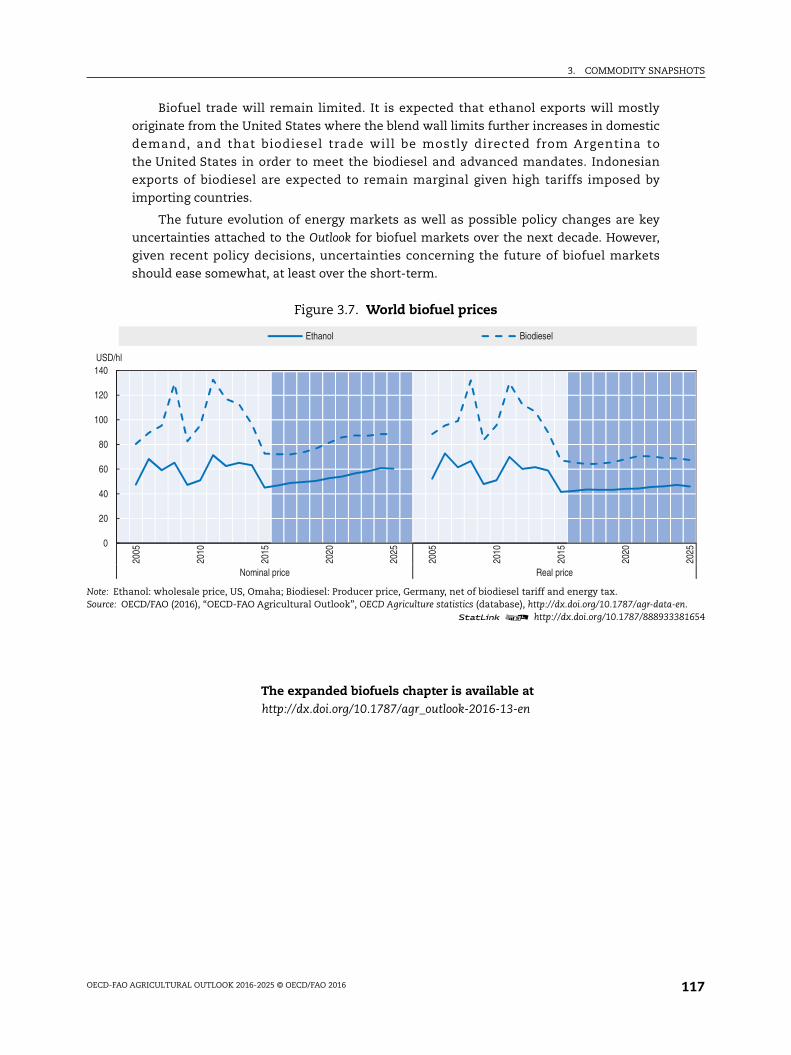
Projection highlightsInternational prices of ethanol and biodiesel are expected to recover in nominal terms
over the outlook period, given developments in crude oil markets and the recovery of prices
of biofuel feedstock (Figure 3.7). Global ethanol production is expected to expand modestly
from 116 Bln L in 2015 to 128.4 Bln L by 2025. Half of this growth will originate from Brazil.
The expansion of global biodiesel production will be driven by policies in place in
the United States, Argentina, Brazil and Indonesia, and to a lesser extent the fulfilment of
the RED target in the European Union. It is expected to increase from 31 Bln L in 2015 to
41.4 Bln L by 2025. Advanced biofuels are not expected to take off over the projection
period.
For the United States, this Outlook assumes that the 10% ethanol blend wall6 will
continue to limit growth in ethanol use, that biodiesel use will expand due to a stronger
advanced mandate and that cellulosic ethanol will not be available on a large scale. The
cellulosic mandate will be mostly met with renewable compressed natural gas and
renewable liquefied natural gas. In the European Union, the proportion of total transport
energy accounted for by biofuels, including double counting for sustainable biofuels is
expected to reach 6.3% by 2020. The remainder of the 10% RED target will be met from other
renewable energy sources such as electric cars.
In Brazil, it is assumed that prices will remain favourable to hydrous ethanol use
rather than gasohol and thus a sustained demand for ethanol, mostly met by domestic
production, will prevail over the outlook period. Indonesian biodiesel production will be
used mainly to meet domestic mandate-driven demand. For India, the new policies aiming
at compensating sugar mills for high sugar prices will encourage ethanol production from
molasses.
Elsewhere in the world, development of the comparatively minor biofuels markets
depends on a mix of effective policy support and price trends, leading to mixed prospects
across countries.
3. COMMODITY SNAPSHOTS
OECD-FAO AGRICULTURAL OUTLOOK 2016-2025 © OECD/FAO 2016 117
Biofuel trade will remain limited. It is expected that ethanol exports will mostly
originate from the United States where the blend wall limits further increases in domestic
demand, and that biodiesel trade will be mostly directed from Argentina to
the United States in order to meet the biodiesel and advanced mandates. Indonesian
exports of biodiesel are expected to remain marginal given high tariffs imposed by
importing countries.
The future evolution of energy markets as well as possible policy changes are key
uncertainties attached to the Outlook for biofuel markets over the next decade. However,
given recent policy decisions, uncertainties concerning the future of biofuel markets
should ease somewhat, at least over the short-term.
The expanded biofuels chapter is available athttp://dx.doi.org/10.1787/agr_outlook-2016-13-en
Figure 3.7. World biofuel prices
Note: Ethanol: wholesale price, US, Omaha; Biodiesel: Producer price, Germany, net of biodiesel tariff and energy tax.Source: OECD/FAO (2016), “OECD-FAO Agricultural Outlook”, OECD Agriculture statistics (database), http://dx.doi.org/10.1787/agr-data-en.
1 2 http://dx.doi.org/10.1787/888933381654
0
20
40
60
80
100
120
140
2005
2010
2015
2020
2025
2005
2010
2015
2020
2025
Nominal price Real price
USD/hl
Ethanol Biodiesel
3. COMMODITY SNAPSHOTS
OECD-FAO AGRICULTURAL OUTLOOK 2016-2025 © OECD/FAO 2016118
COTTON
Market situationThe world cotton market experienced dramatic developments in the first half of the 2015
marketing year (see glossary for a definition of marketing year) caused by an acute drop in
production – about 9% – in major producing countries. Worldwide cotton production has not
declined this much since 2008. This unexpected drop in production led to releases of stocks;
however, total world stocks still remain at a very high level (20 Mt, 5% down from 2014).
Production fell in almost all major cotton producing countries led by Pakistan,
the United States, and China, which experienced declines of 5%, 19% and 17%, respectively.
Adverse weather, lower global world market demand and policy uncertainty all contributed to
the sharp decline. The decreased synthetic fibre prices driven by substantially lower oil prices
placed huge competitive pressures on world cotton markets. Nonetheless, cotton mill
consumption is estimated to increase by 1% from 2014 to around 24.3 million tonnes (Mt) in
the 2015 marketing year. Mill consumption estimates in China and India remained stable at
7.7 Mt and 5.3 Mt respectively, Pakistan experienced over 2% and Bangladesh over 4% growth
while Viet Nam picked up 6% as Chinese direct investment in mills of the latter two countries
continues to increase.
Global cotton imports declined for the third consecutive season, falling 2% from 2014, to
75 Mt. Increases in imports by Indonesia, Turkey and Viet Nam were insufficient to offset the
12% decline in China’s import demand from 2014, as their new cotton support policy narrowed
the price gap between domestic and imported cotton. With lower output, US exports are
estimated to fall to 2.2 Mt, about 11% below the previous year. India’s exports however
increased slightly.
Projection highlightsAlthough the world cotton price is under pressure from substantial high stock levels and
fierce competition from synthetic fibres, cotton prices are expected to be relatively stable in
nominal terms after an anticipated further drop in 2016. During 2016-25, relative stability is
expected as government support policies stabilise markets in major cotton producing
countries. However, world cotton prices are expected to be lower than the average in 2013-15 in
both real and nominal terms.
World production is expected to grow at slower pace than consumption during the first
few years of the outlook period, reflecting the anticipated lower price level resulting from the
large global stocks that accumulated between 2010 and 2014. The stock-to-use ratio is
expected to be over 40% in 2025, which is at the high-end of historical levels but well below the
historical high of 87% in 2014. World cotton area should be stable for the first five years but it is
projected to grow from 2020 onwards. Yields rise around the world and global average yield
grows slowly as production switches from relatively high yielding countries, notably China, to
relatively low-yielding ones in South Asia.
World cotton use is expected to grow at 1.5% p.a. as a result of economic and population
growth, reaching 28.3 Mt. Consumption in China is expected to fall to 6.9 Mt following the
downward trend started in 2010, while India becomes the world’s largest country for cotton

3. COMMODITY SNAPSHOTS
OECD-FAO AGRICULTURAL OUTLOOK 2016-2025 © OECD/FAO 2016 119
mill consumption (8 Mt) in 2025. Higher cotton mill consumption by 2025 is also foreseen for
Bangladesh, Pakistan, Turkey, Indonesia and Viet Nam.
It is expected that the growth in global cotton trade will be slower compared to previous
years, especially 2011-13, when growth was driven by surging Chinese imports. To obtain
value-added from mills, a shift to trading cotton yarn and fabrics rather than raw cotton has
emerged over the past few years, which is expected to continue. Nonetheless, by 2025 global
raw cotton trade will reach 8.7 Mt, nearly 7% higher than the average during 2013-15.
The United States retains its position as the world’s largest exporter, accounting for 28% of
world trade. Exports from Brazil are expected to almost double from 0.7 Mt to 1.5 Mt, making it
the world’s second largest cotton exporter. With higher production, Australia is expected to
increase cotton exports to 1.1 Mt, over 70% more than in the base period. Cotton producing
countries in Sub-Saharan Africa, as a whole, will increase their exports to reach 1.4 Mt by 2025.
On the import side, China is expected to import 1.6 Mt in 2025 and retains barely its position as
the world’s largest import market. Its dominant role in the world cotton market will be
significantly challenged as other importing countries emerge. It is projected that by 2025,
Bangladesh, Indonesia and Viet Nam will each import more than 1 Mt.
While continuing increases in farm labour costs and competition for resources with other
agricultural crops place significant constraints on growth in global cotton production, higher
productivity driven by technological progress, including greater adoption of bio-tech cotton,
creates substantial potential for cotton production to expand in the next decade. While the
medium-term prospects are for sustained growth, there may be potential short-term
uncertainties in the current Outlook which may result in short-term volatilities in demand,
supply and prices. A sudden slow-down in global economy, a sharp drop in global textiles and
clothing trade, quality and price competition from synthetic fibres and changes in government
policies are important factors that can affect the cotton market.The unprecedented high stock
level is a key driver of the world cotton price.
The expanded cotton chapter is available athttp://dx.doi.org/10.1787/agr_outlook-2016-14-en
Figure 3.8. Cotton consumption by region
Source: OECD/FAO (2016), “OECD-FAO Agricultural Outlook”, OECD Agriculture statistics (database), http://dx.doi.org/10.1787/agr-data-en.1 2 http://dx.doi.org/10.1787/888933381669
0
2
4
6
8
10
12
2005 2006 2007 2008 2009 2010 2011 2012 2013 2014 2015 2016 2017 2018 2019 2020 2021 2022 2023 2024 2025
Mt
China India Pakistan Rest of the World
3. COMMODITY SNAPSHOTS
OECD-FAO AGRICULTURAL OUTLOOK 2016-2025 © OECD/FAO 2016120
Notes
1. These absolute increases in the European Union and Canada are slightly misleading since the baseperiods included bumper crops in 2013 and 2014 in the European Union and an extreme bumpercrop in Canada in 2013.
2. The term “processed meats” refers to meat that has been treated either to be preserved orflavoured, such as hams and sausages.
3. Gasohol is a mixture of gasoline and anhydrous ethanol used as transport fuel. In Brazil, mostvehicles are flex-fuel vehicles able to run on any blend of gasoline and ethanol. At the pump,automobilists can choose between gasohol (currently E27) and hydrous ethanol (E100).
4. Wholesale price, US Omaha.
5. Producer price, Germany, net of biodiesel tariff and of energy tax.
6. The term blend wall refers to short run technical constraints that act as an impediment toincreased ethanol use. It is assumed in this Outlook that US cars will not be able to consumegasohol with more than 10% of ethanol.
From:OECD-FAO Agricultural Outlook 2016-2025
Access the complete publication at:http://dx.doi.org/10.1787/agr_outlook-2016-en
Please cite this chapter as:
OECD/FAO (2016), “Commodity snapshots”, in OECD-FAO Agricultural Outlook 2016-2025, OECDPublishing, Paris.
DOI: http://dx.doi.org/10.1787/agr_outlook-2016-6-en
This work is published under the responsibility of the Secretary-General of the OECD and the Director-General of the FAO. Theopinions expressed and arguments employed herein do not necessarily reflect the official views of OECD member countries, orthe governments of the FAO member countries.
This document and any map included herein are without prejudice to the status of or sovereignty over any territory, to thedelimitation of international frontiers and boundaries and to the name of any territory, city or area.
You can copy, download or print OECD content for your own use, and you can include excerpts from OECD publications,databases and multimedia products in your own documents, presentations, blogs, websites and teaching materials, providedthat suitable acknowledgment of OECD as source and copyright owner is given. All requests for public or commercial use andtranslation rights should be submitted to [email protected]. Requests for permission to photocopy portions of this material forpublic or commercial use shall be addressed directly to the Copyright Clearance Center (CCC) at [email protected] or theCentre français d’exploitation du droit de copie (CFC) at [email protected].