Embed Size (px)
Citation preview
Part 3: Models for Color and Color Image Formation
The final image depends on:
•Illumination light•Object reflectance•Sensor characteristics
Color Image Formation
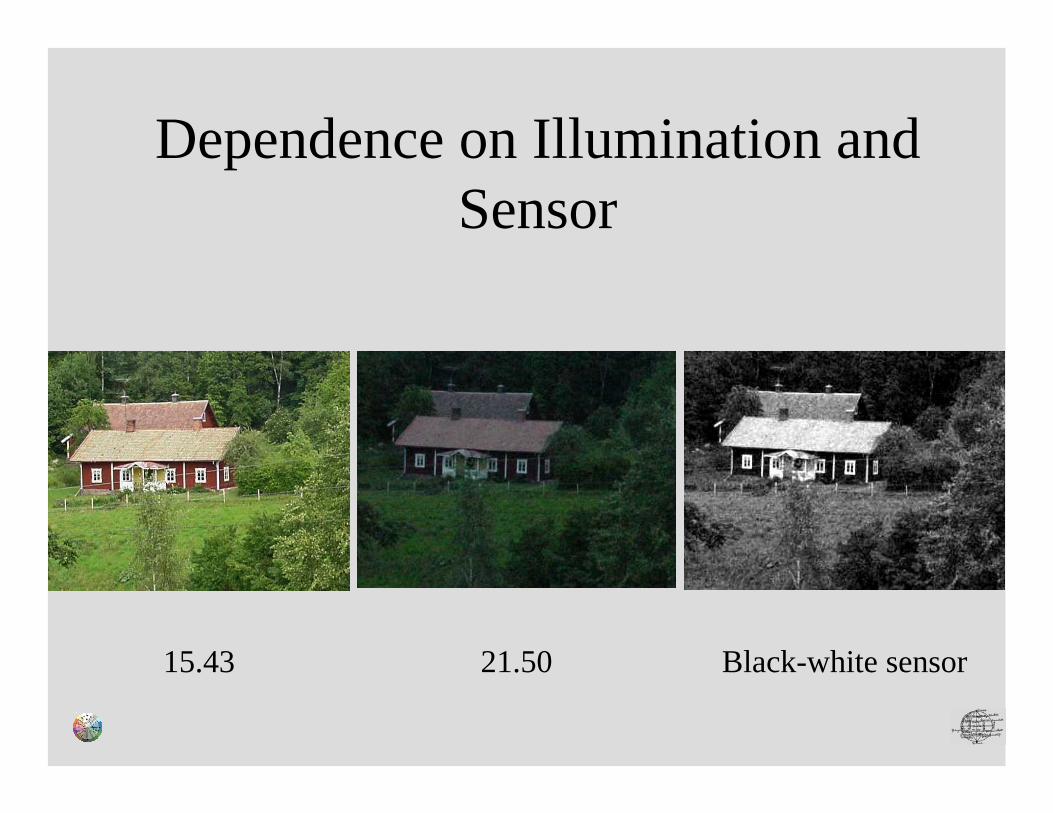
Dependence on Illumination and Sensor
15.43 21.50 Black-white sensor
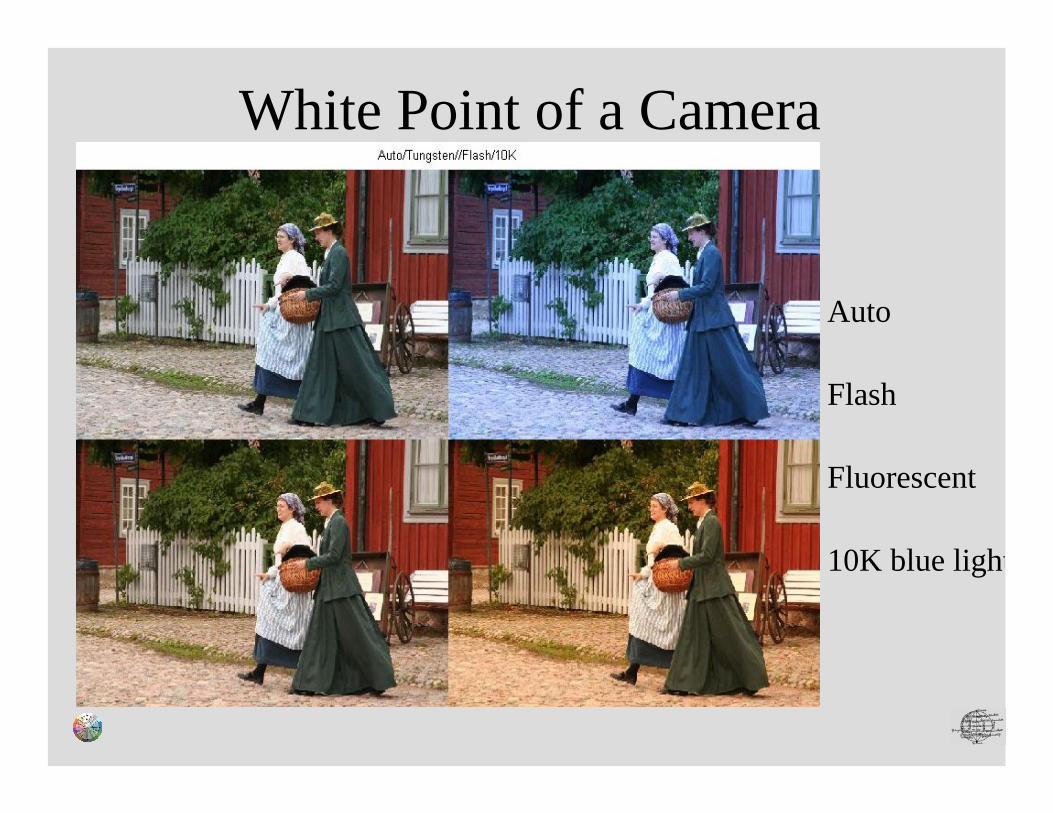
White Point of a Camera
Auto
Flash
Fluorescent
10K blue light
Correction
Having a good model of how illumination/object/sensor combine to form the final image allows to correct wrong color settings or togenerate images showing the same scene under different illumination
Application:Digital photographyMovie industry...
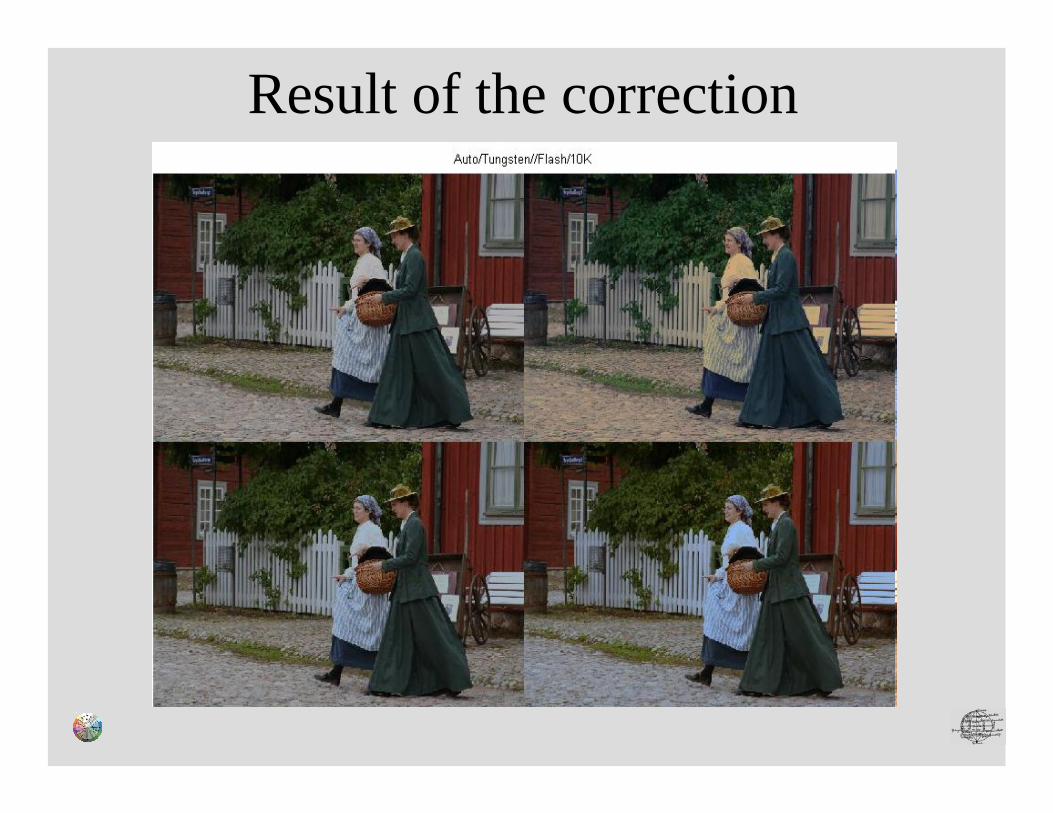
Result of the correction

Illumination Sources
Illumination Spectra
• Illumination light is a mixture of lights of different wavelength
• The relative amount of the different wavelength contributions defines the color
• The total amount defines the intensity
Illumination lights are defined by illumination spectra
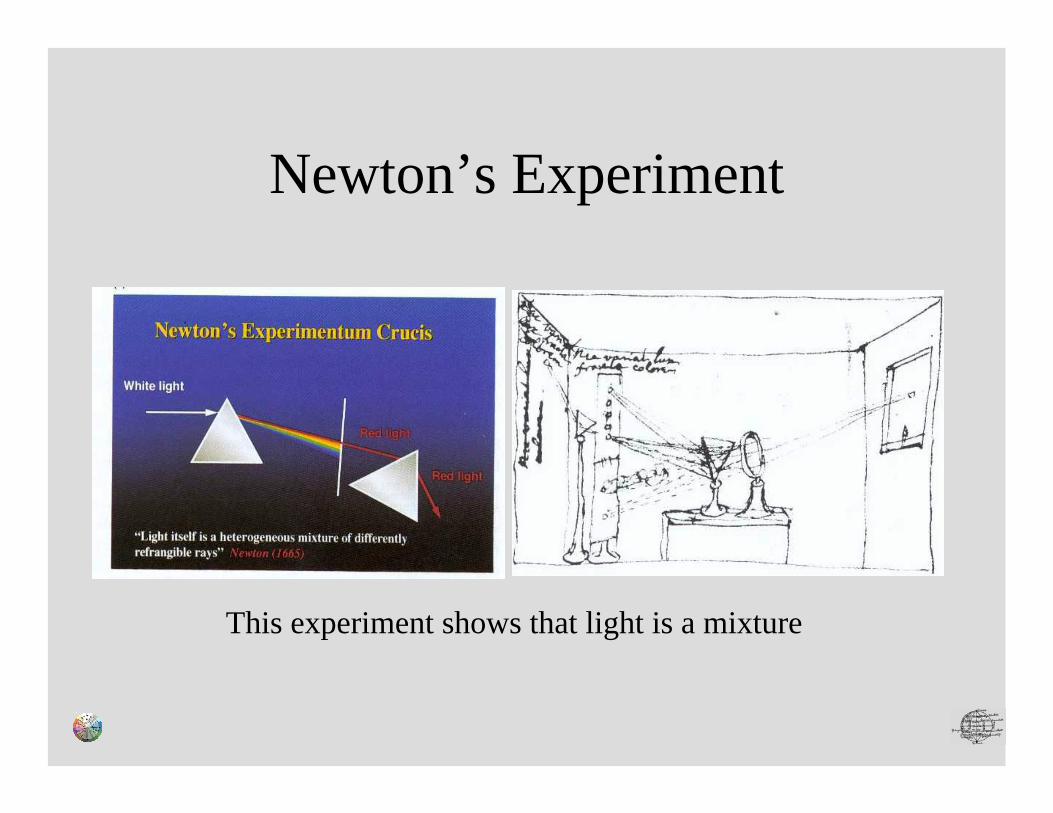
Newton’s Experiment
This experiment shows that light is a mixture
CIE-Lights
Light sources recommended by the
CIE (Commission Internationale de l'Éclairage)International Commission on Illuminationinclude:
• A represents light bulbs • D65 represents daylight• F sources representing fluorescence lights
Artificial light sources often have spikes in their emission spectra.
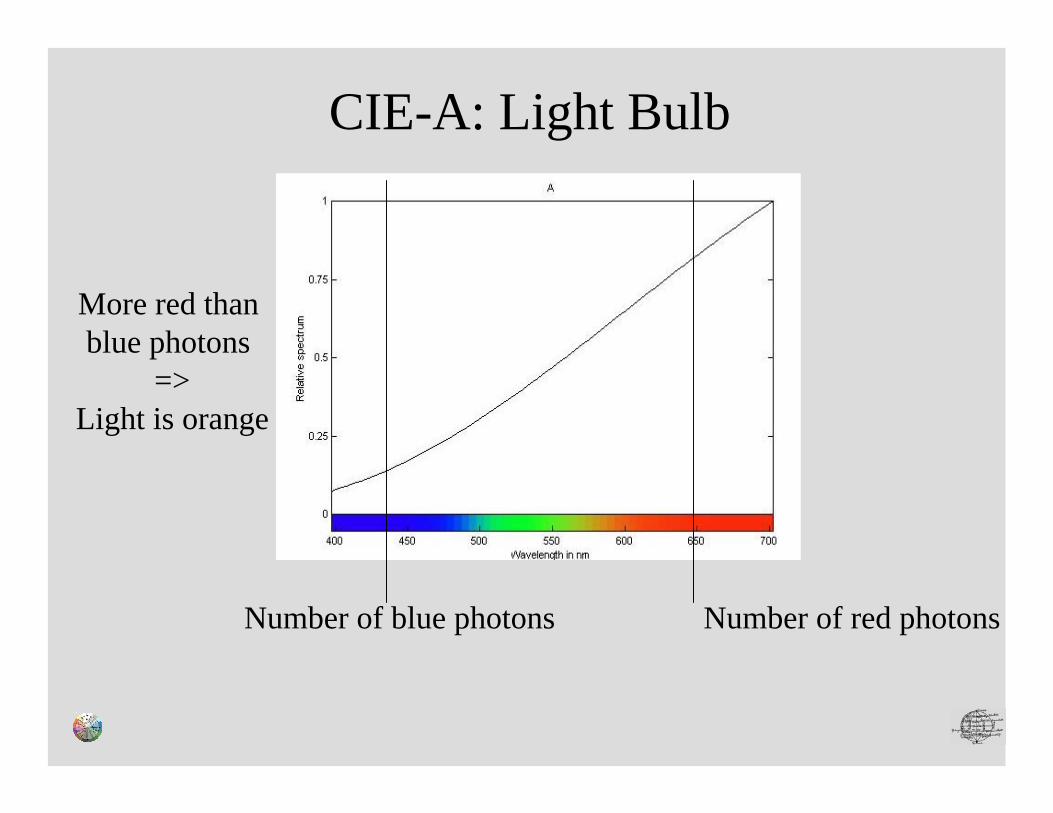
CIE-A: Light Bulb
Number of red photonsNumber of blue photons
More red than blue photons
=>Light is orange
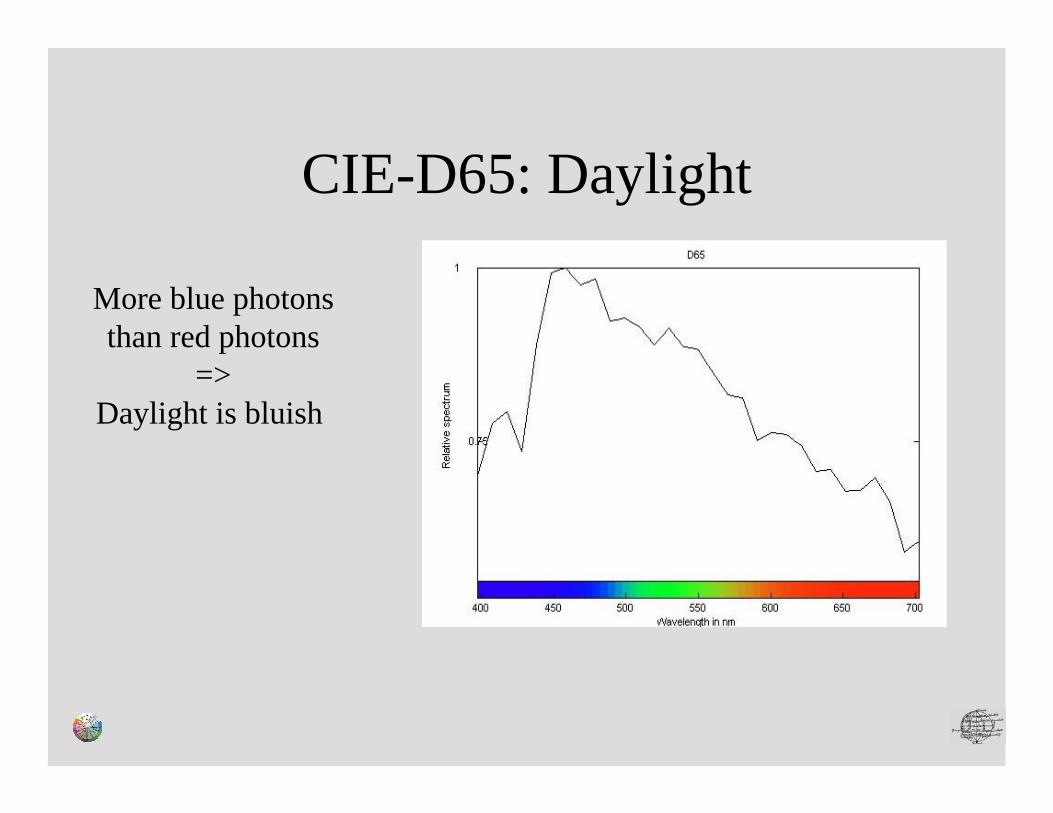
CIE-D65: Daylight
More blue photonsthan red photons
=>Daylight is bluish
• Heating up an object leads to an emission of radiation
• The type of radiation depends on the temperature and the properties of the object
• For a black-body (complete absorption and maximum
emission) the radiation emission can be exactly calculated
• This gives a connection between temperature and color
Color temperature
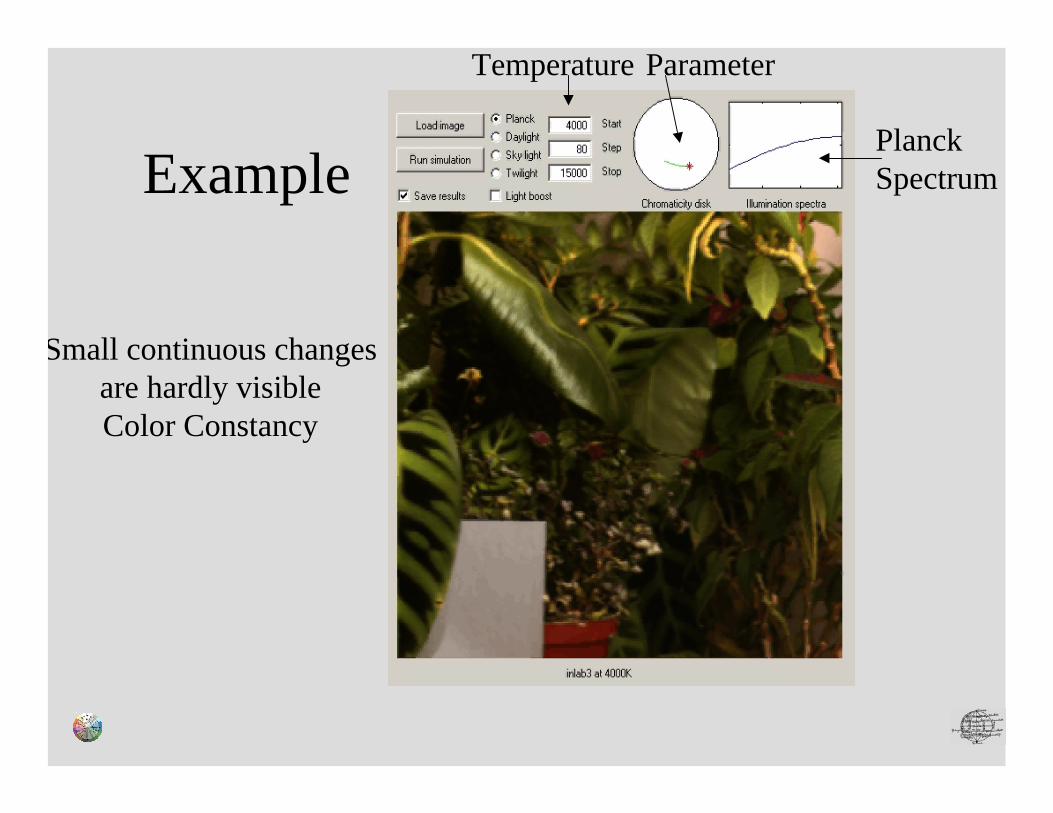
ExamplePlanckSpectrum
ParameterTemperature
Small continuous changesare hardly visibleColor Constancy
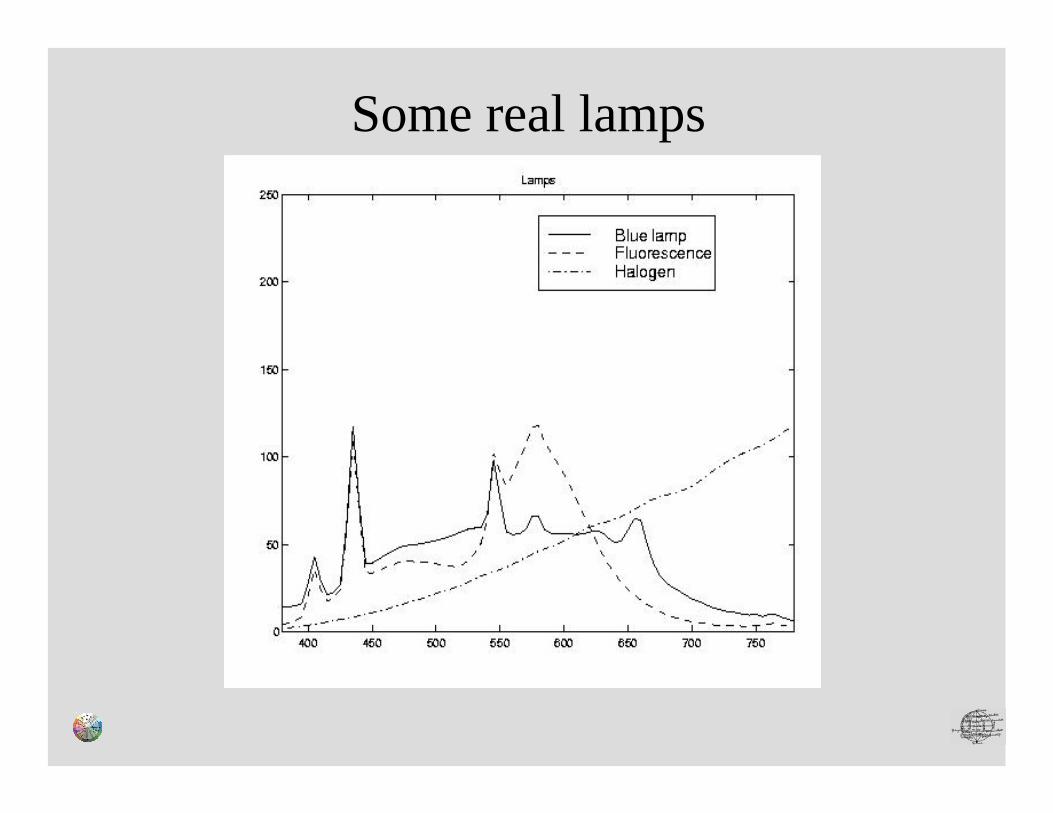
Some real lamps
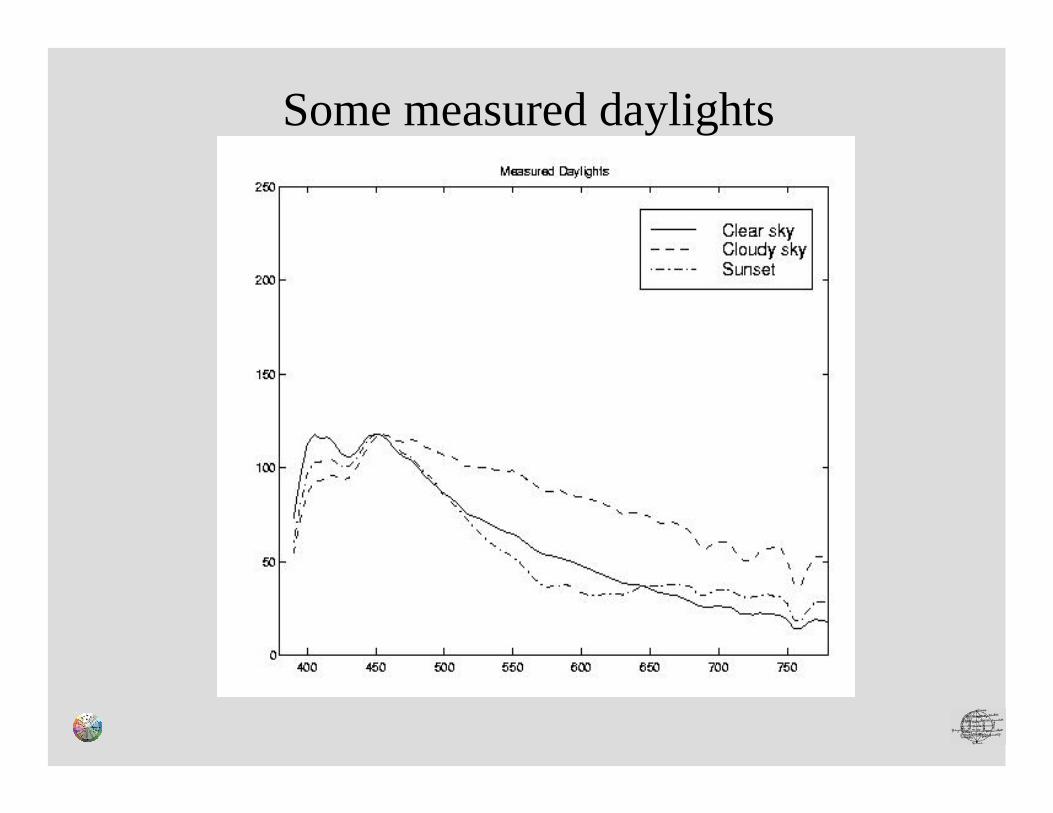
Some measured daylights
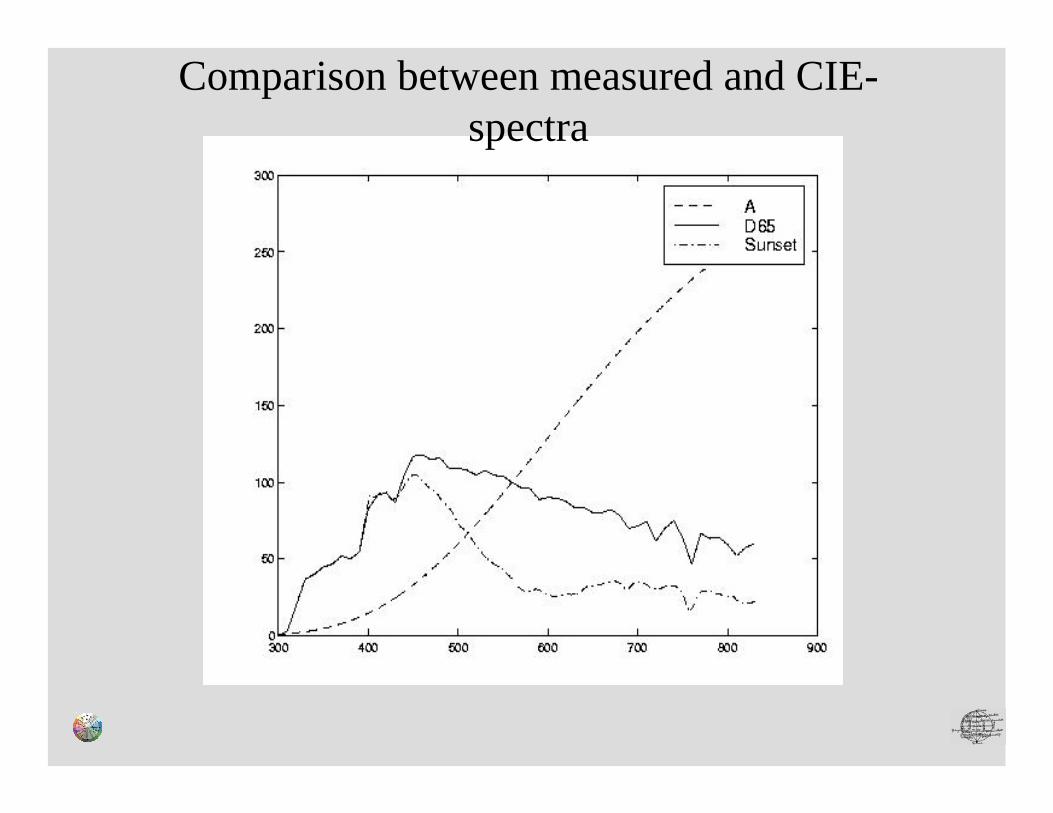
Comparison between measured and CIE-spectra
Summary: Illumination Spectra
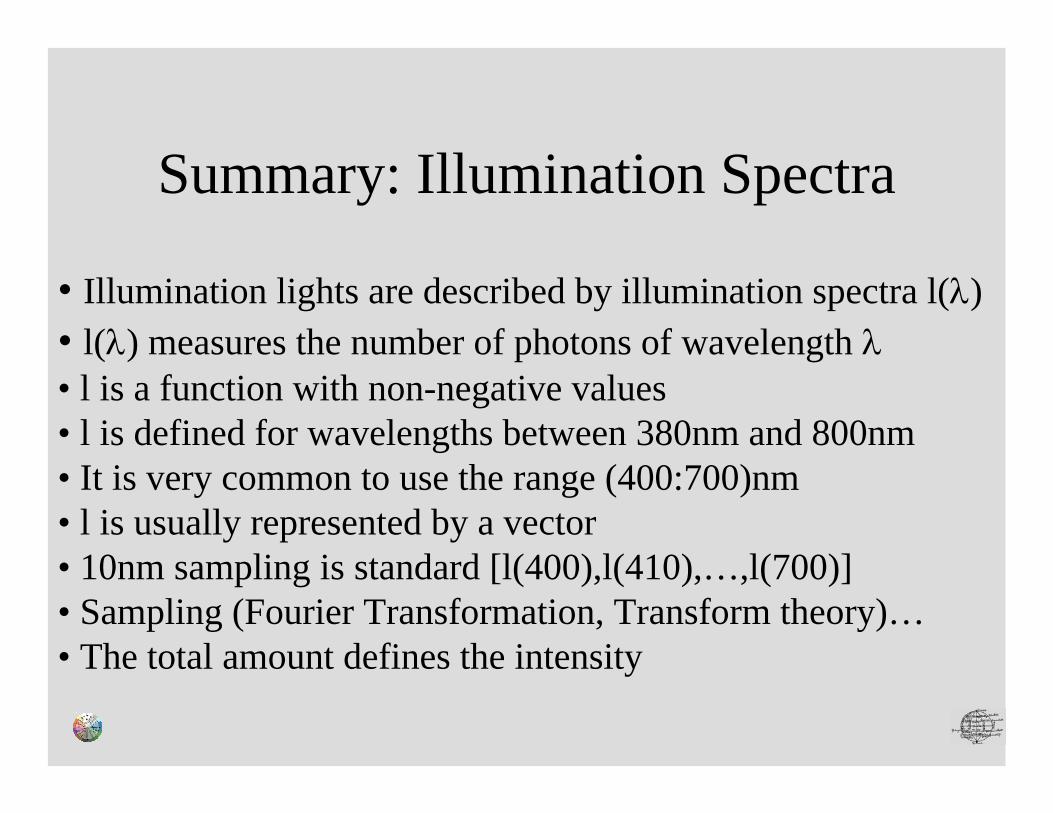
• Illumination lights are described by illumination spectra l(λ)• l(λ) measures the number of photons of wavelength λ• l is a function with non-negative values • l is defined for wavelengths between 380nm and 800nm • It is very common to use the range (400:700)nm• l is usually represented by a vector• 10nm sampling is standard [l(400),l(410),…,l(700)]• Sampling (Fourier Transformation, Transform theory)…• The total amount defines the intensity

Object Reflections
Material-Light Interaction
The description of what happens when light hits an object is
VERY COMPLICATEDExamples:• Mirror• Skin• Paper
• Atmosphere• Paint
•…

Shiny Car
Reflectance spectra
• Objects absorb parts of the incoming light and reflect the rest
• The absorption/reflection property varies with wavelen
• This is described by the reflection spectrum
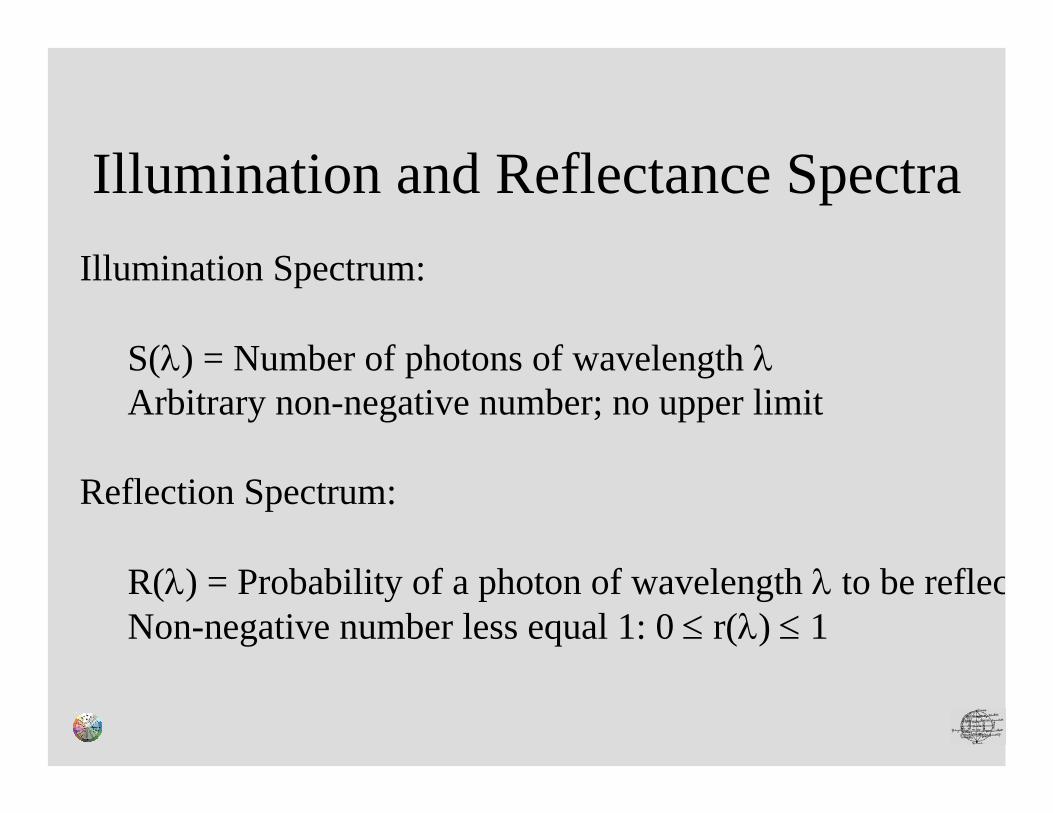
Illumination and Reflectance SpectraIllumination Spectrum:
S(λ) = Number of photons of wavelength λArbitrary non-negative number; no upper limit
Reflection Spectrum:
R(λ) = Probability of a photon of wavelength λ to be reflecNon-negative number less equal 1: 0 ≤ r(λ) ≤ 1
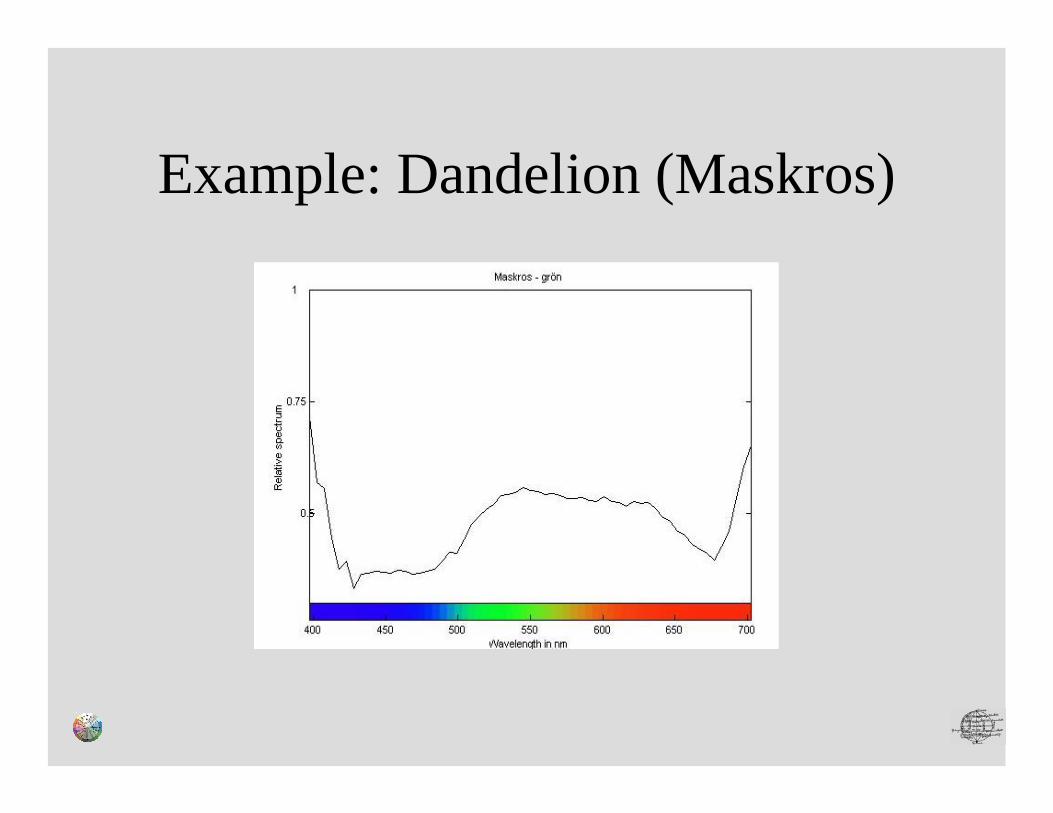
Example: Dandelion (Maskros)
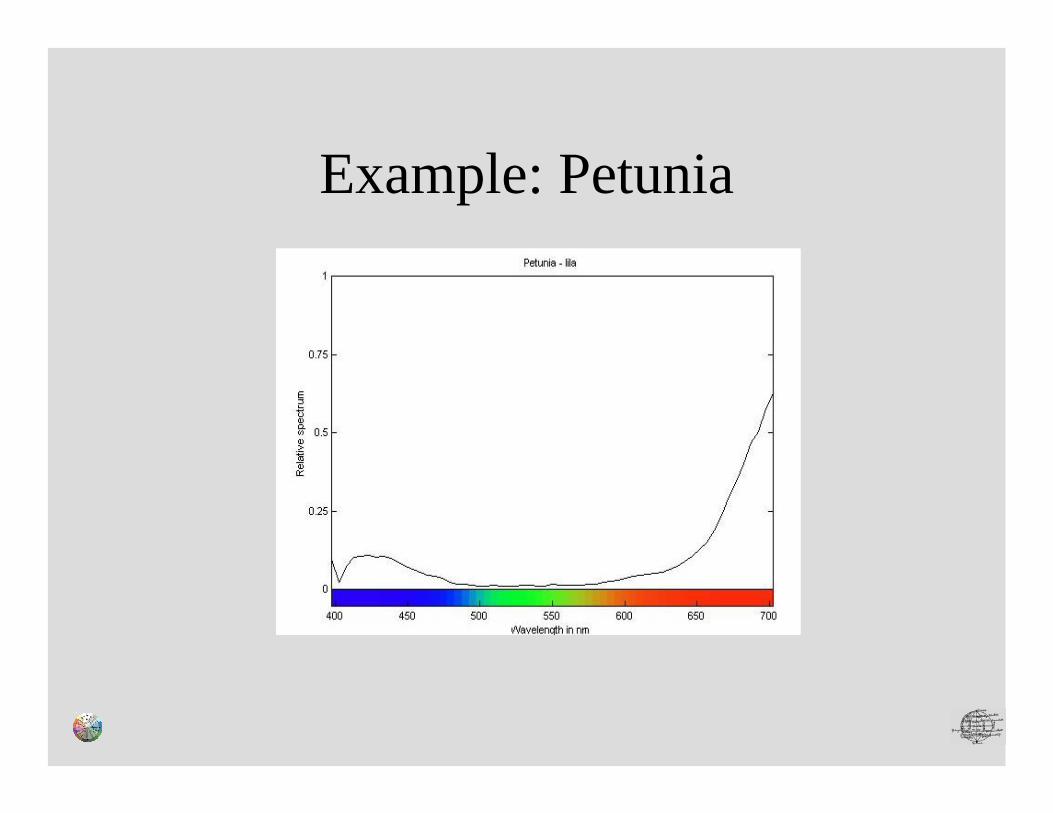
Example: Petunia
Interaction: illumination - objectThe illumination source S(λ)hits the object with reflection R (λ)
The light which leaves the object is S (λ) * R (λ)
Number of incoming photons*Probability to be reflected
=Number of outgoing photons
Matlab notation: S.*RPointwise multiplicationDifferent way to compute: S.*R = diag(S)*R
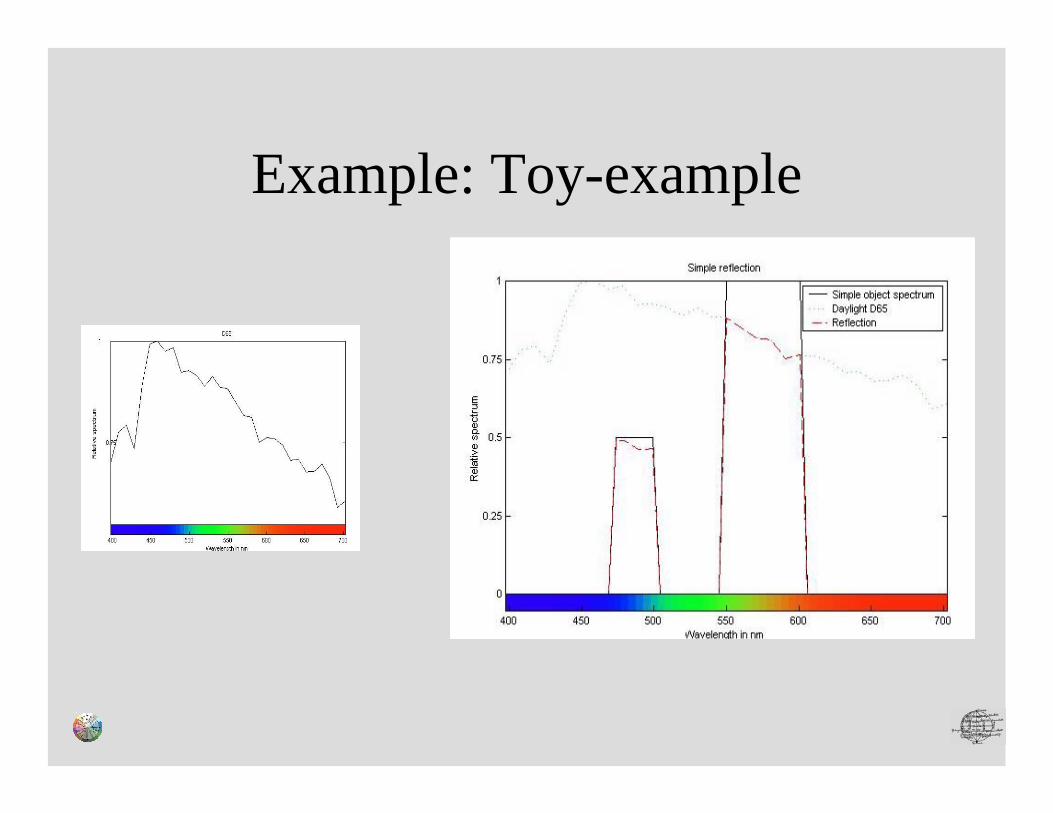
Example: Toy-example
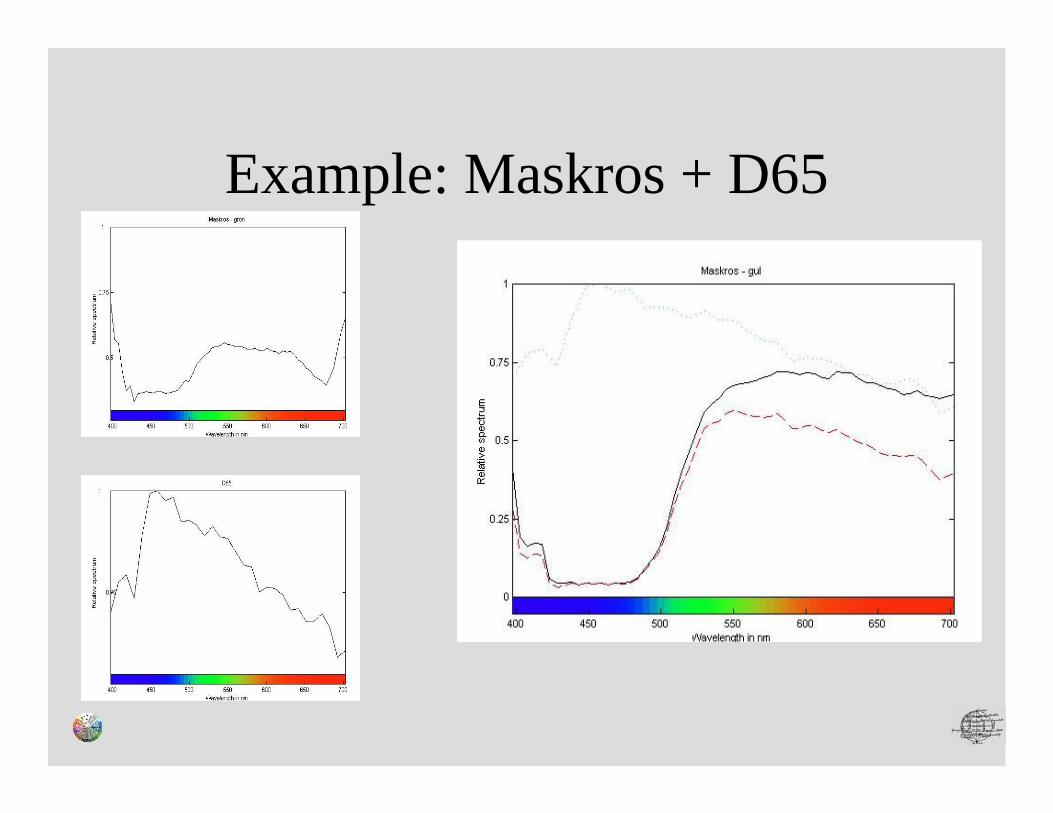
Example: Maskros + D65
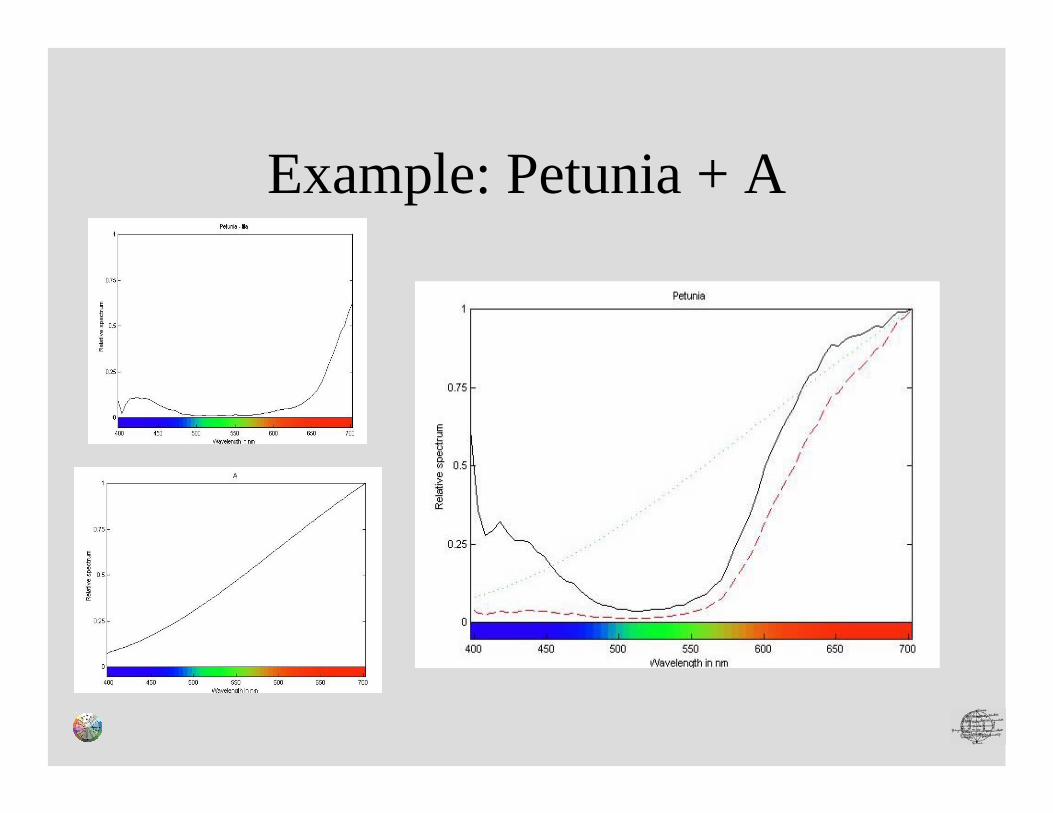
Example: Petunia + A
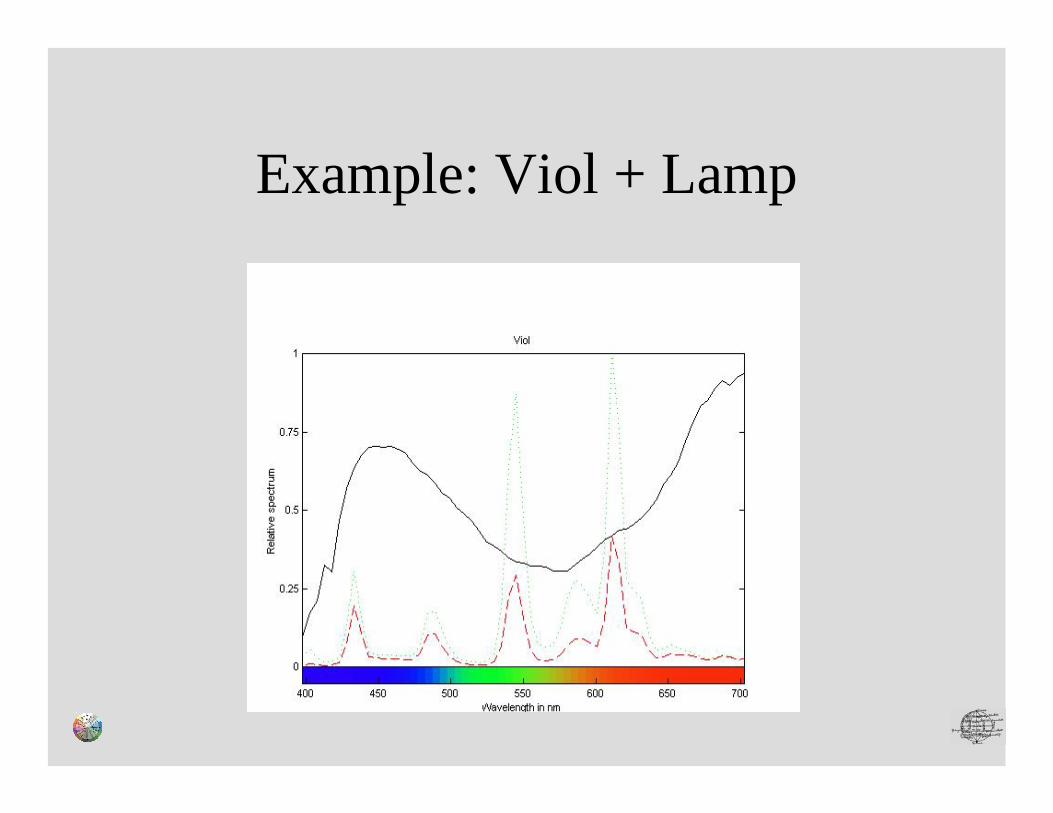
Example: Viol + Lamp
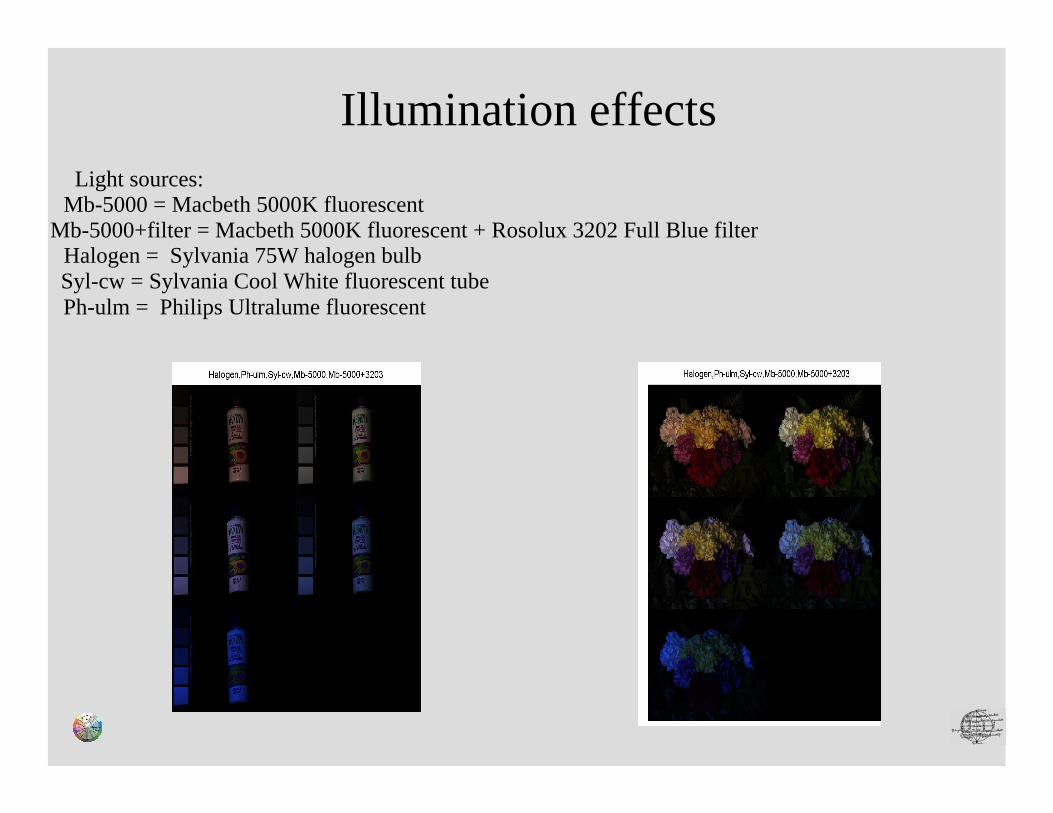
Light sources:Mb-5000 = Macbeth 5000K fluorescent
Mb-5000+filter = Macbeth 5000K fluorescent + Rosolux 3202 Full Blue filterHalogen = Sylvania 75W halogen bulbSyl-cw = Sylvania Cool White fluorescent tubePh-ulm = Philips Ultralume fluorescent
Illumination effects
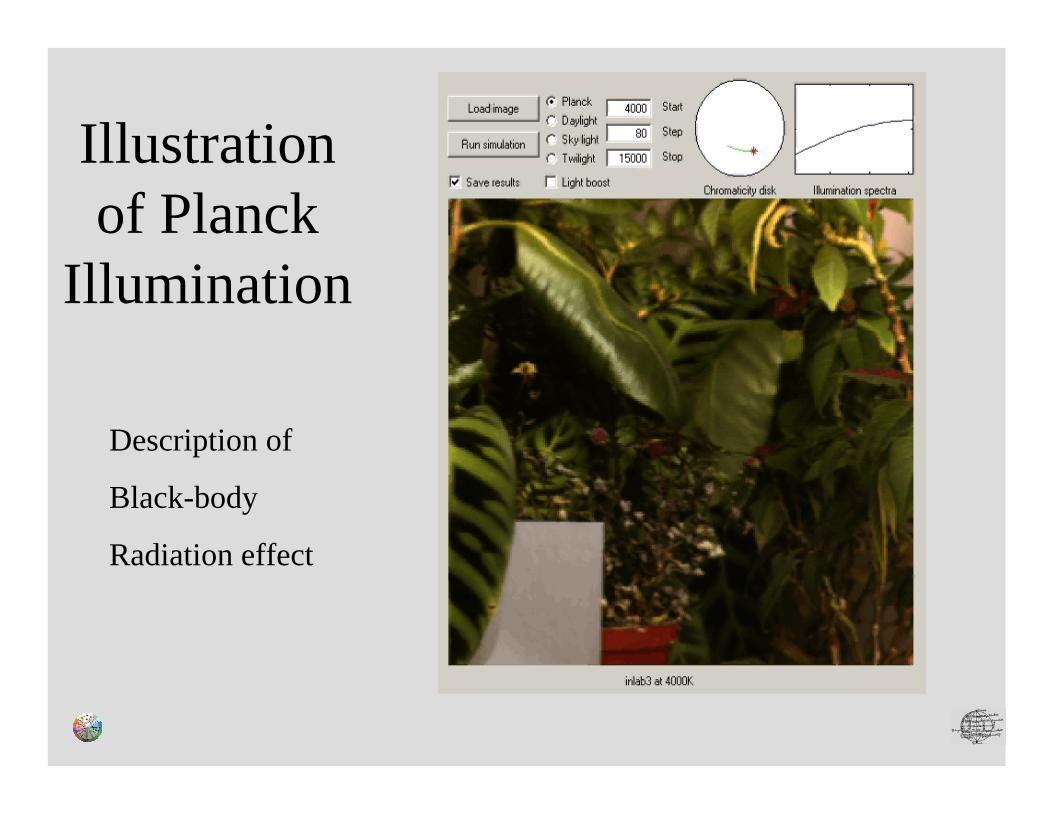
Description of
Black-body
Radiation effect
Illustration of Planck
Illumination
Detectors
Spectral Sensitivity Curve
Sensors are characterised by Spectral Sensitivity Curves
• A photon hits the sensor• With a certain probability the photon is absorbed• This probability depends on the wavelength• The sensors counts how many photons were
absorbed in a given period• This count defines the output of the sensor
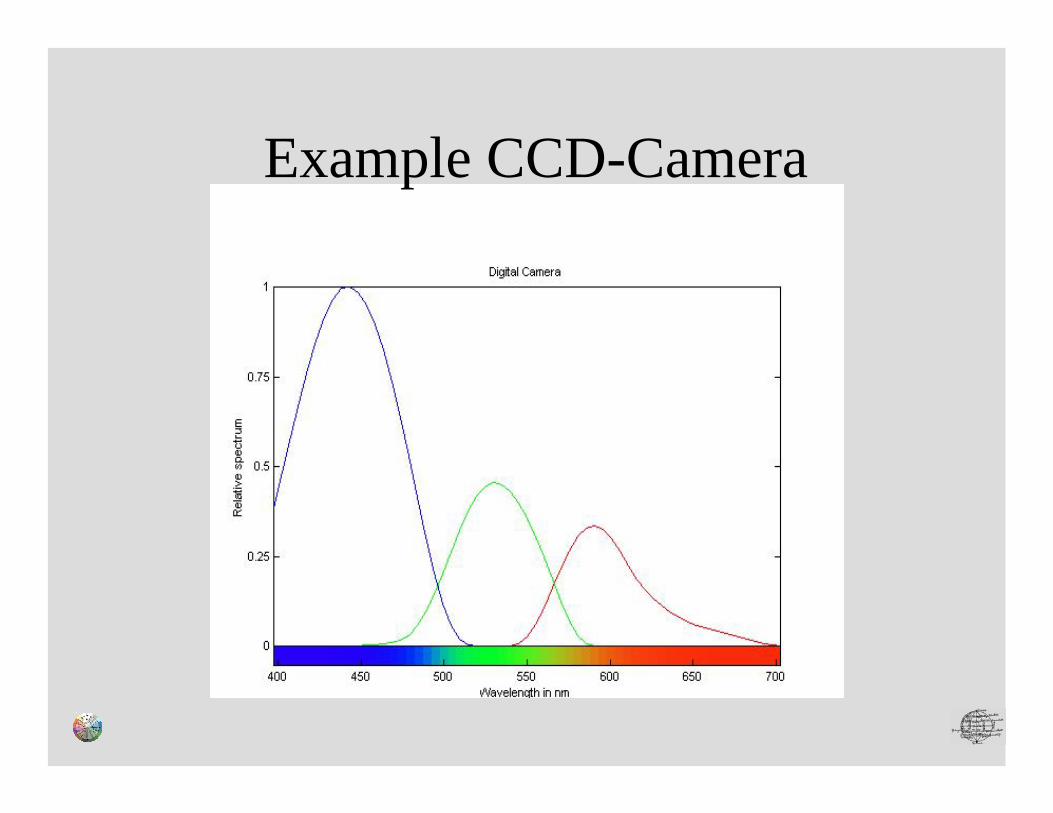
Example CCD-Camera
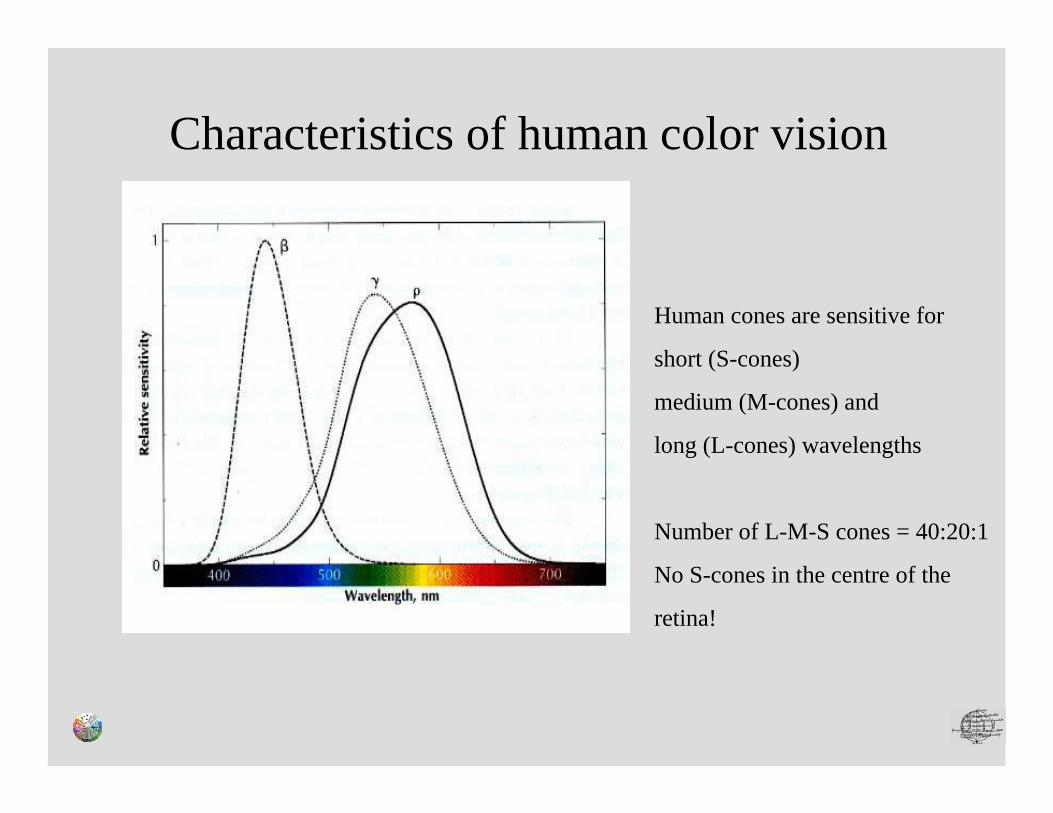
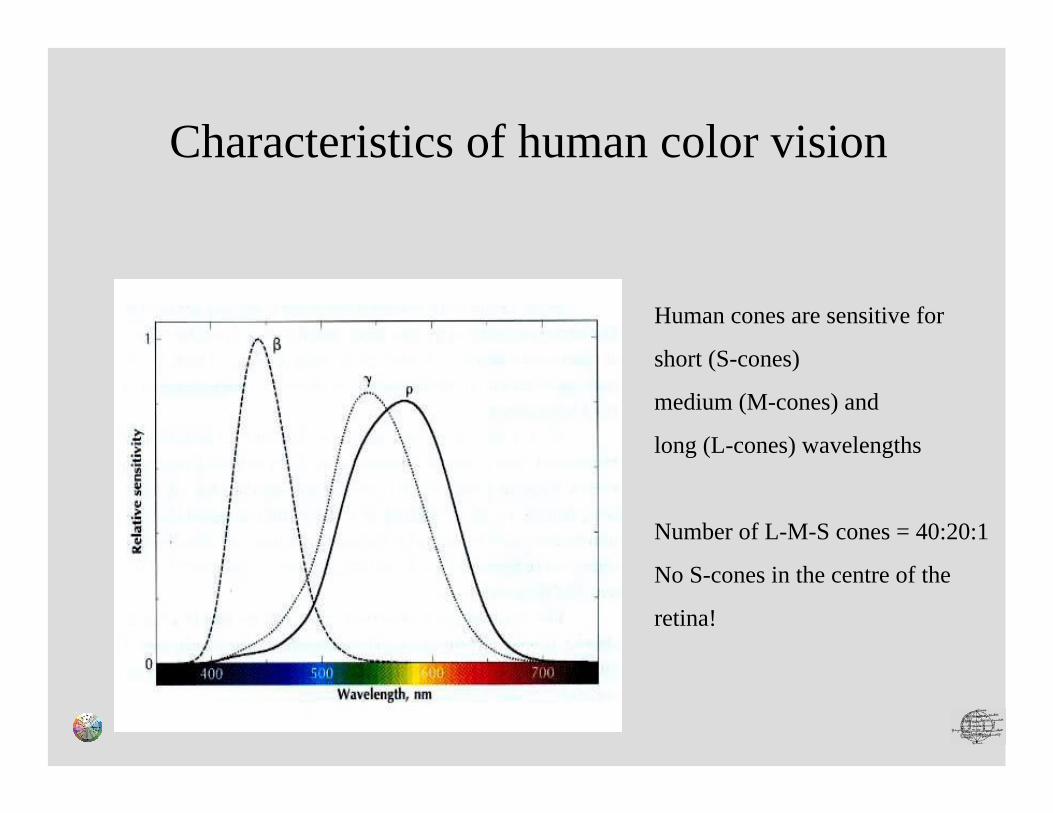
Human cones are sensitive for
short (S-cones)
medium (M-cones) and
long (L-cones) wavelengths
Number of L-M-S cones = 40:20:1
No S-cones in the centre of the
retina!
Characteristics of human color vision
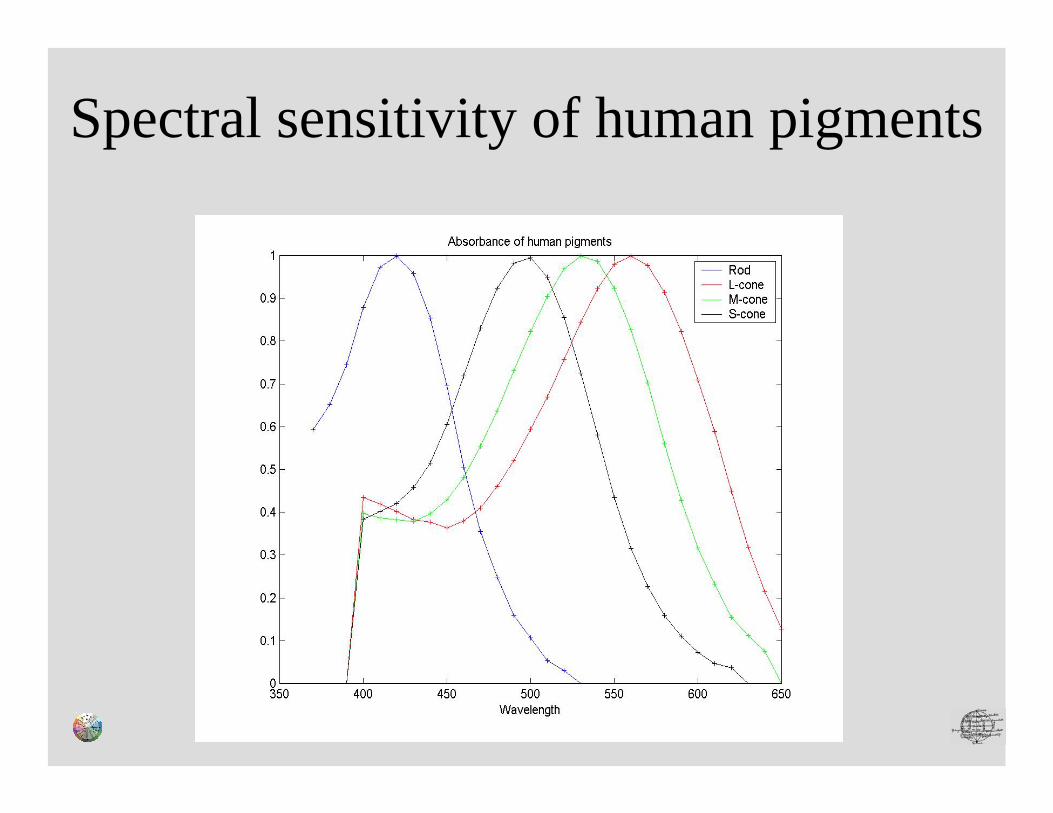
Spectral sensitivity of human pigments

Color Image Formation
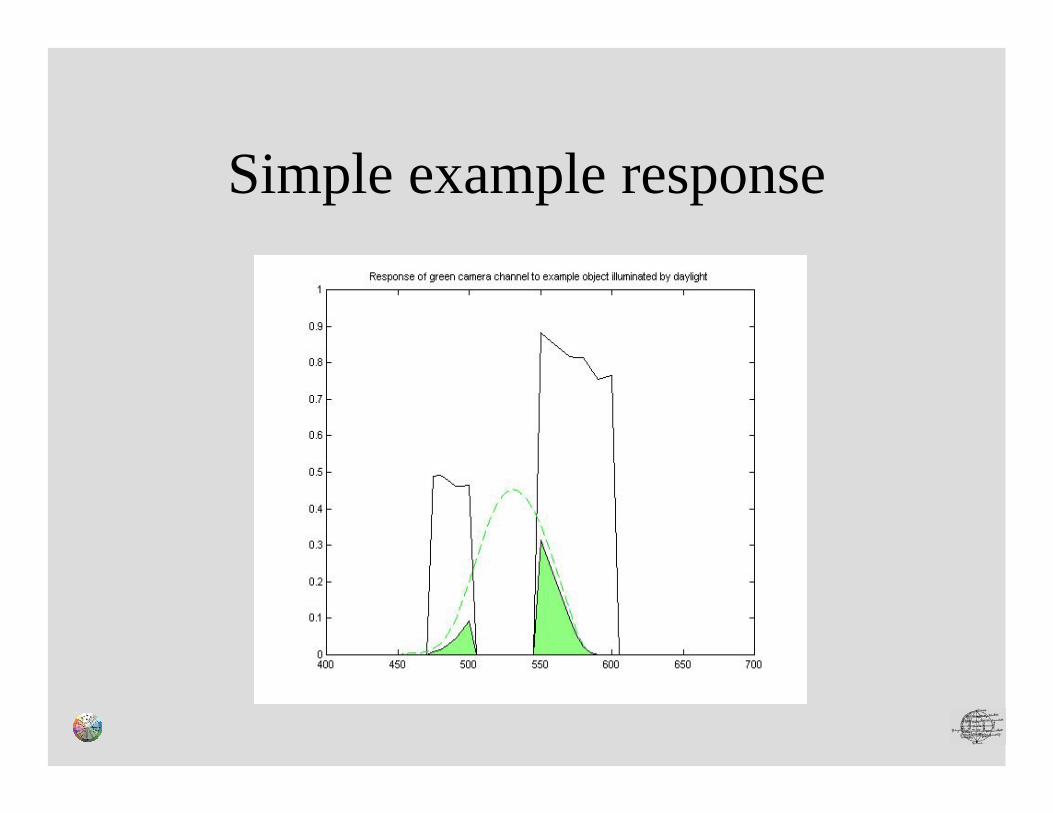
Simple example response
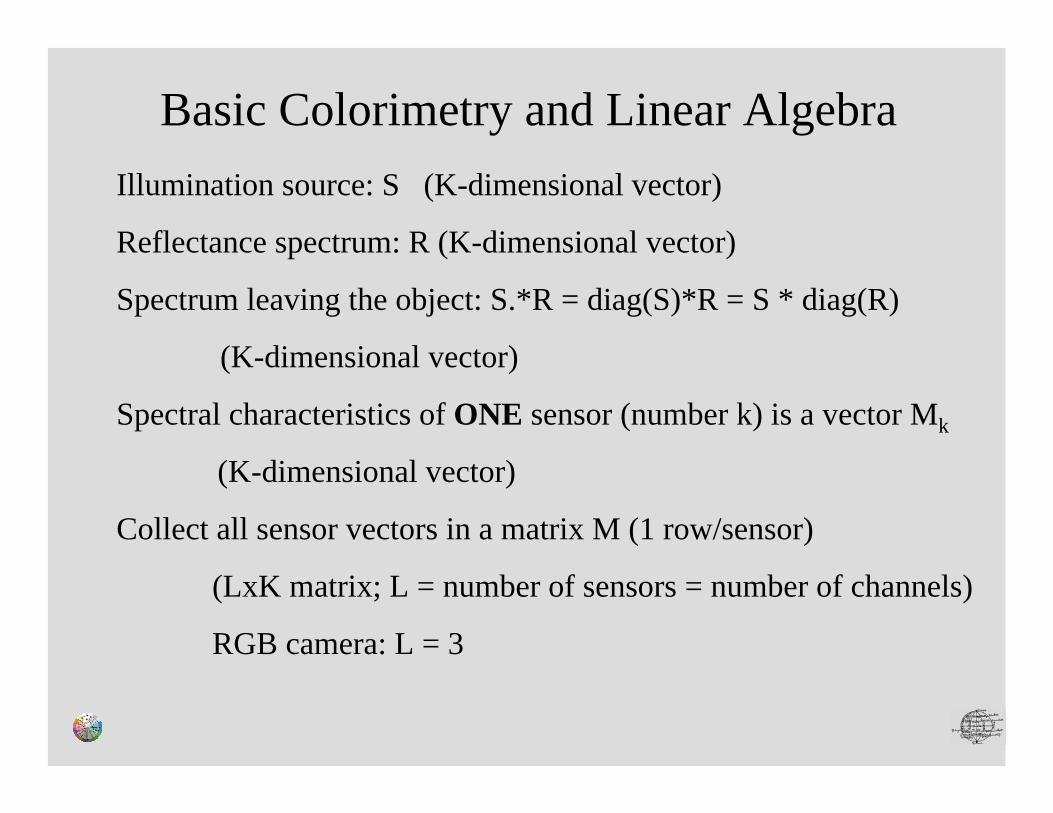
Basic Colorimetry and Linear Algebra Illumination source: S (K-dimensional vector)
Reflectance spectrum: R (K-dimensional vector)
Spectrum leaving the object: S.*R = diag(S)*R = S * diag(R)
(K-dimensional vector)
Spectral characteristics of ONE sensor (number k) is a vector Mk
(K-dimensional vector)
Collect all sensor vectors in a matrix M (1 row/sensor)
(LxK matrix; L = number of sensors = number of channels)
RGB camera: L = 3
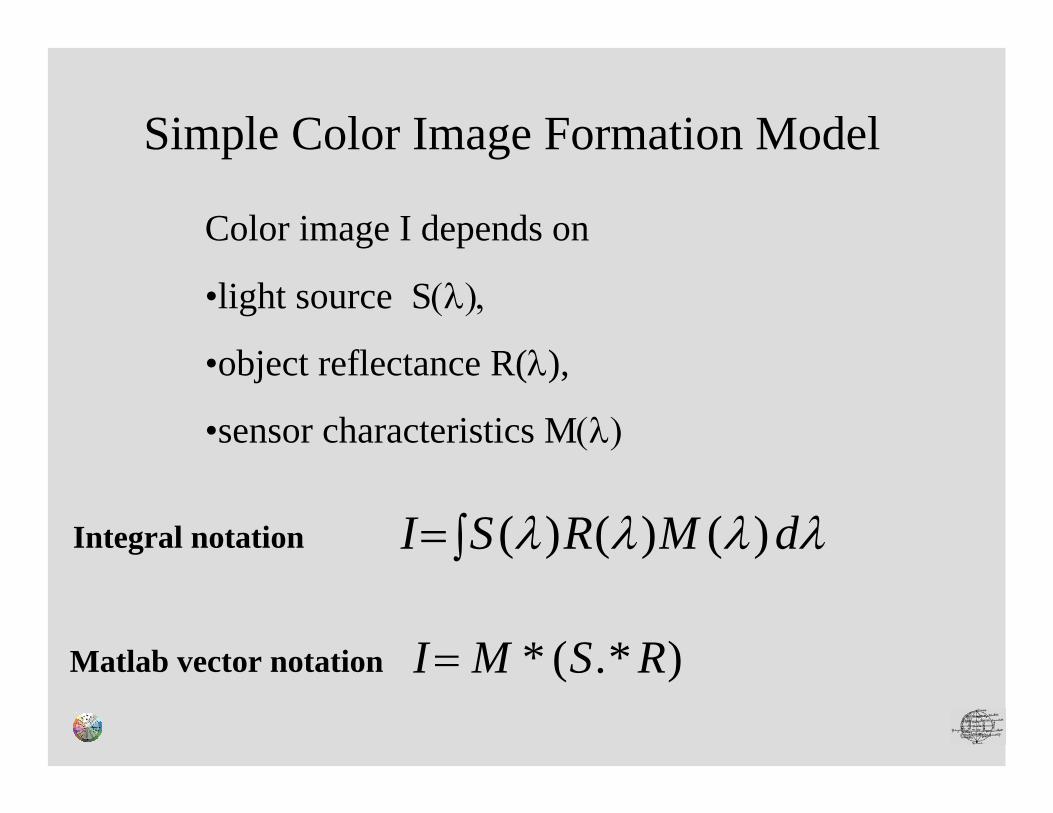
Color image I depends on
•light source S(λ),
•object reflectance R(λ),
•sensor characteristics M(λ)
λλλλ dMRSI )()()(∫=
)*.(* RSMI =
Integral notation
Matlab vector notation
Simple Color Image Formation Model
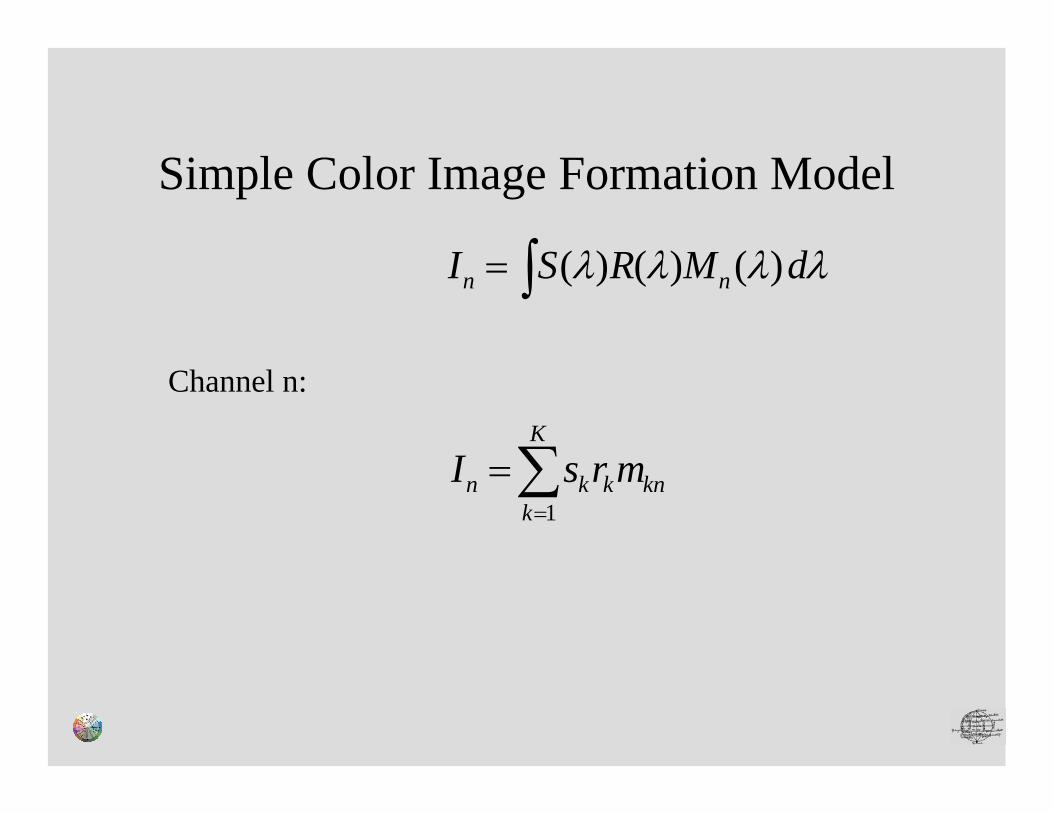
Simple Color Image Formation Model
Channel n:
λλλλ dMRSI nn )()()(∫=
∑=
=K
kknkkn mrsI
1
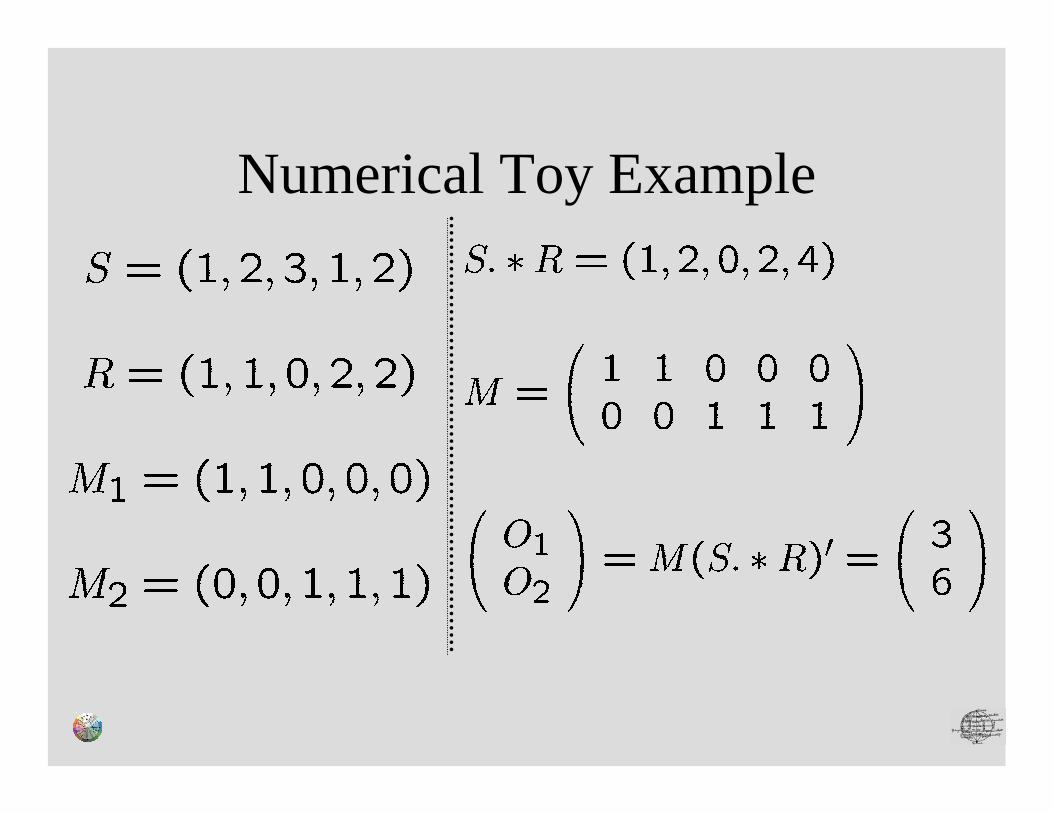
Numerical Toy Example
Practical Problems
Measuring the spectra involvedTables of spectral dataData may be missing or sampled with different intervalsInterpolation
What is ignored:• Fluorescence:
An incoming photon of a wavelength may producephoton of another wavelength
• Interaction with the material: A photon may enter the material and interact with it
• Geometry: The response may depend on the viewing geometry
• Non-linearity: The measurement is certainly non-linear in real devices
• ...

Part 4: Colorimetry and the CIE Systems
Definition
Colorimetry is the technique of the measurement of color.
It is a part of color science!
Color science consists of all knowledge concerningthe production of color stimuli and the visual perception of i
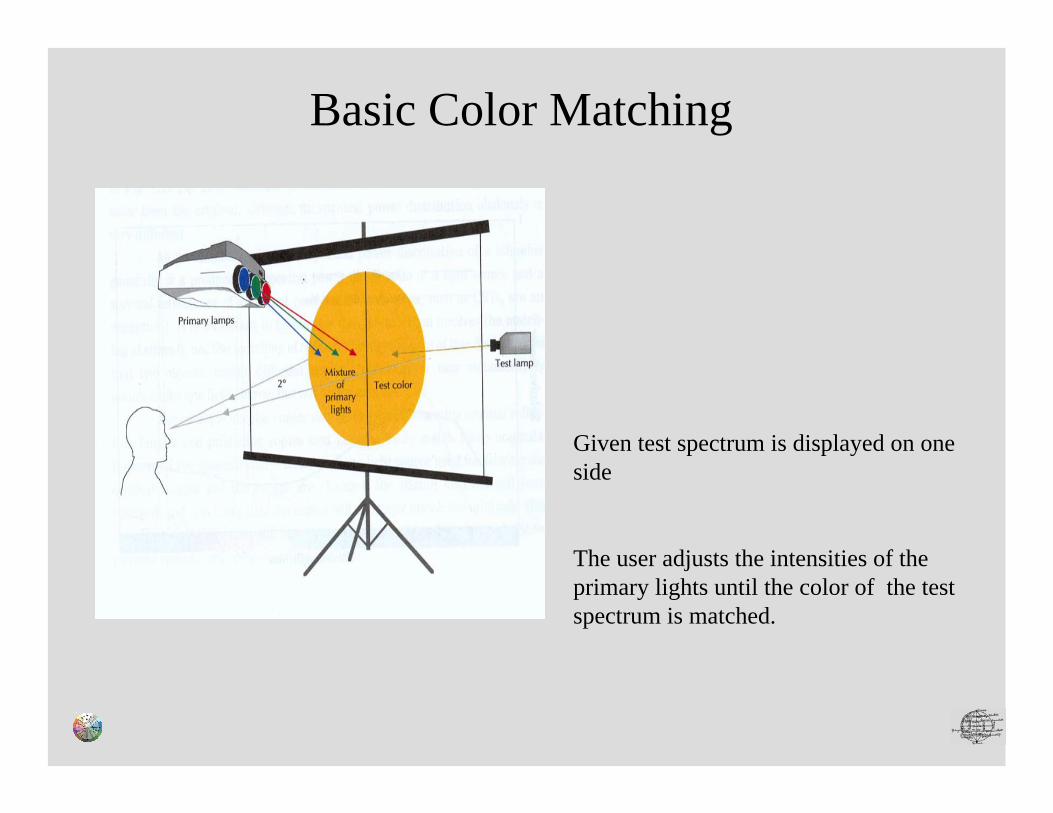
Given test spectrum is displayed on one side
The user adjusts the intensities of the primary lights until the color of the test spectrum is matched.
Basic Color Matching
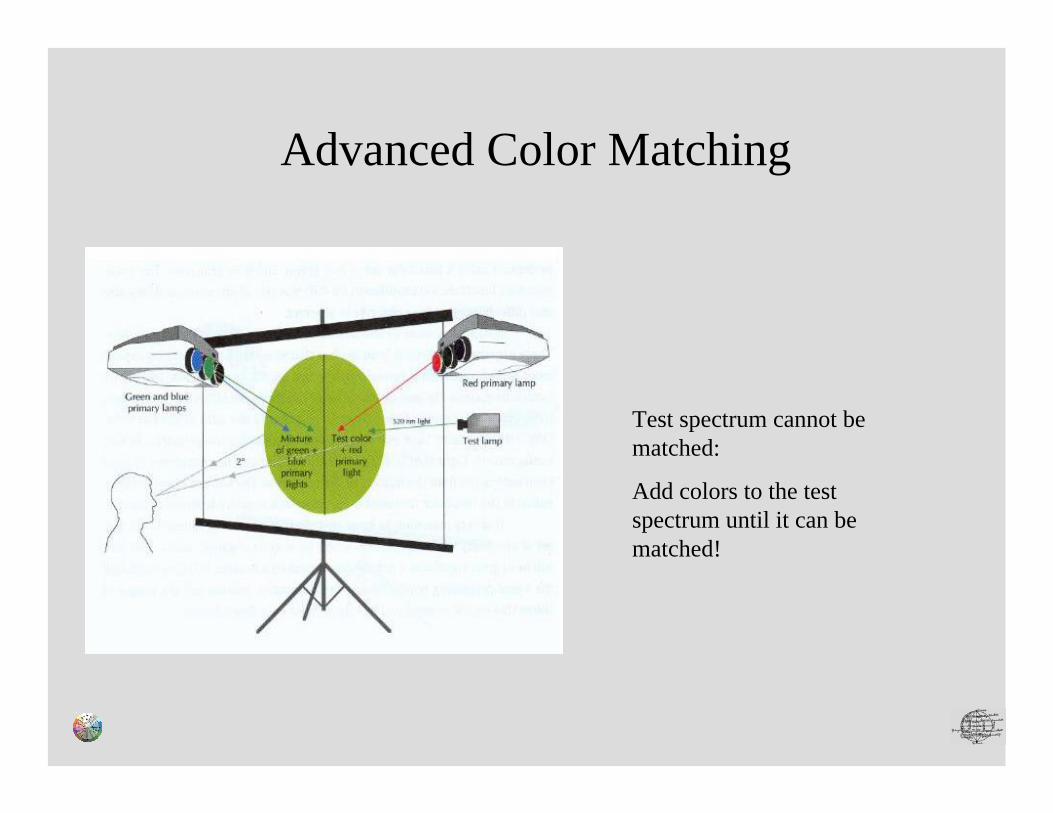
Test spectrum cannot be matched:
Add colors to the test spectrum until it can be matched!
Advanced Color Matching
Color Signal = Illumination .* Reflectance = S .* R
Imaging device output = Measurement * Color Signal: I = M*(S .* R)
Usually (RGB)
device output is three-dimensional
illumination and reflectance are K-dimensional and
K >> 3
Therefore:
I is a three-dimensional linear projection of the input
Consequently:
Each output vector corresponds to a (K-3)-dimensional subspace
Basic Colorimetry and Linear Algebra
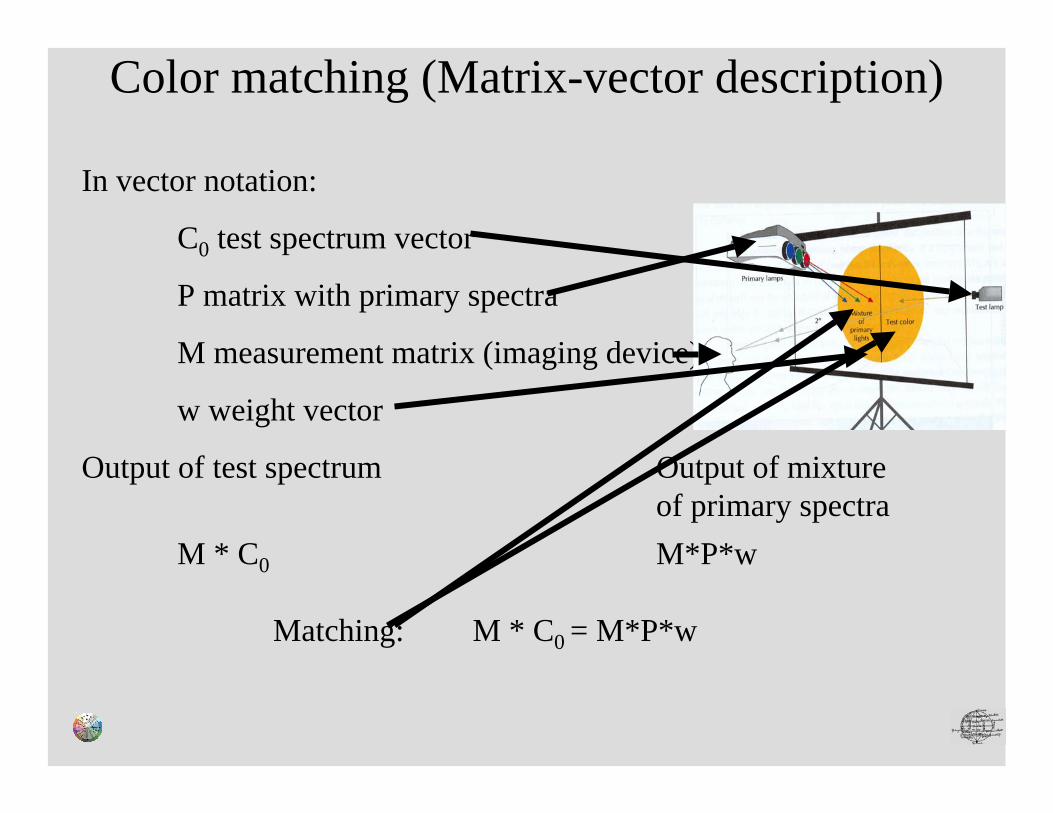
In vector notation:
C0 test spectrum vector
P matrix with primary spectra
M measurement matrix (imaging device)
w weight vector
Output of test spectrum Output of mixture of primary spectra
M * C0 M*P*w
Matching: M * C0 = M*P*w
Color matching (Matrix-vector description)
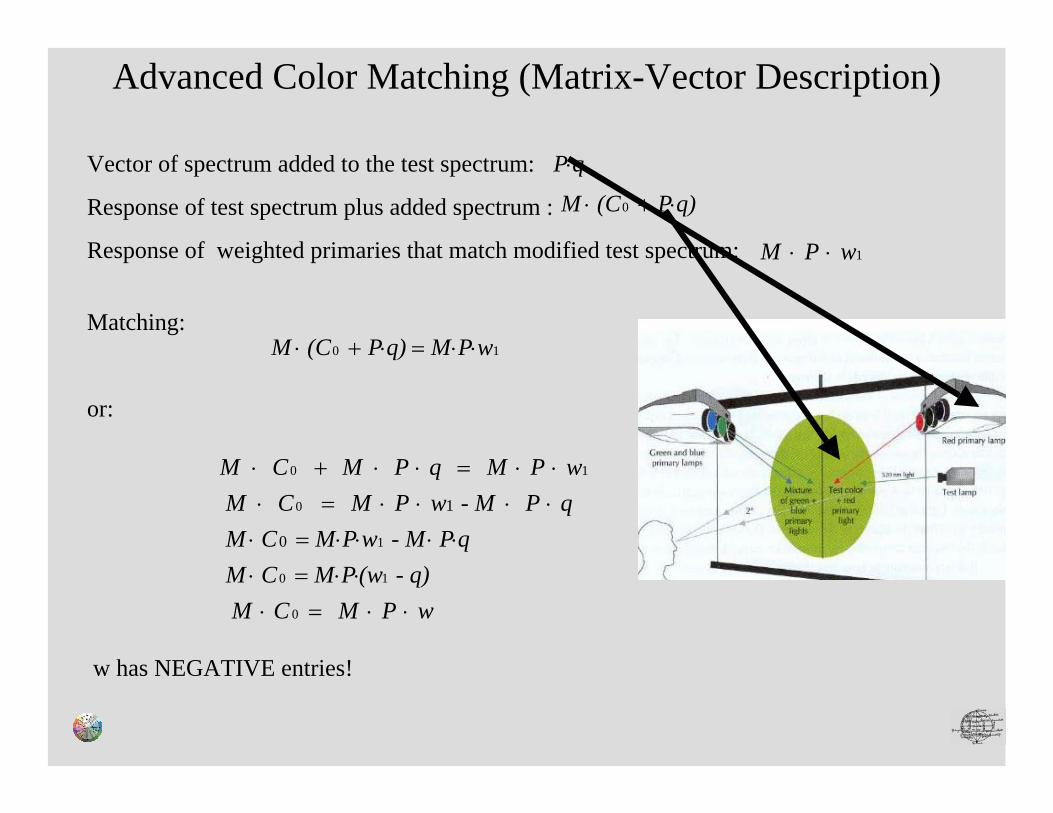
Vector of spectrum added to the test spectrum:
Response of test spectrum plus added spectrum :
Response of weighted primaries that match modified test spectrum:
Matching:
or:
w has NEGATIVE entries!
qP⋅
q) P (CM ⋅+⋅ 0
1wPM ⋅⋅
10 wPMq) P (CM ⋅⋅=⋅+⋅
wPMC M - q)(wP M C M
q P - M wP M C M q P - M wP M C M wPMq PM CM
⋅⋅=⋅⋅⋅=⋅
⋅⋅⋅⋅=⋅⋅⋅⋅⋅=⋅⋅⋅=⋅⋅+⋅
0
10
1
0
10
0
1
Advanced Color Matching (Matrix-Vector Description)
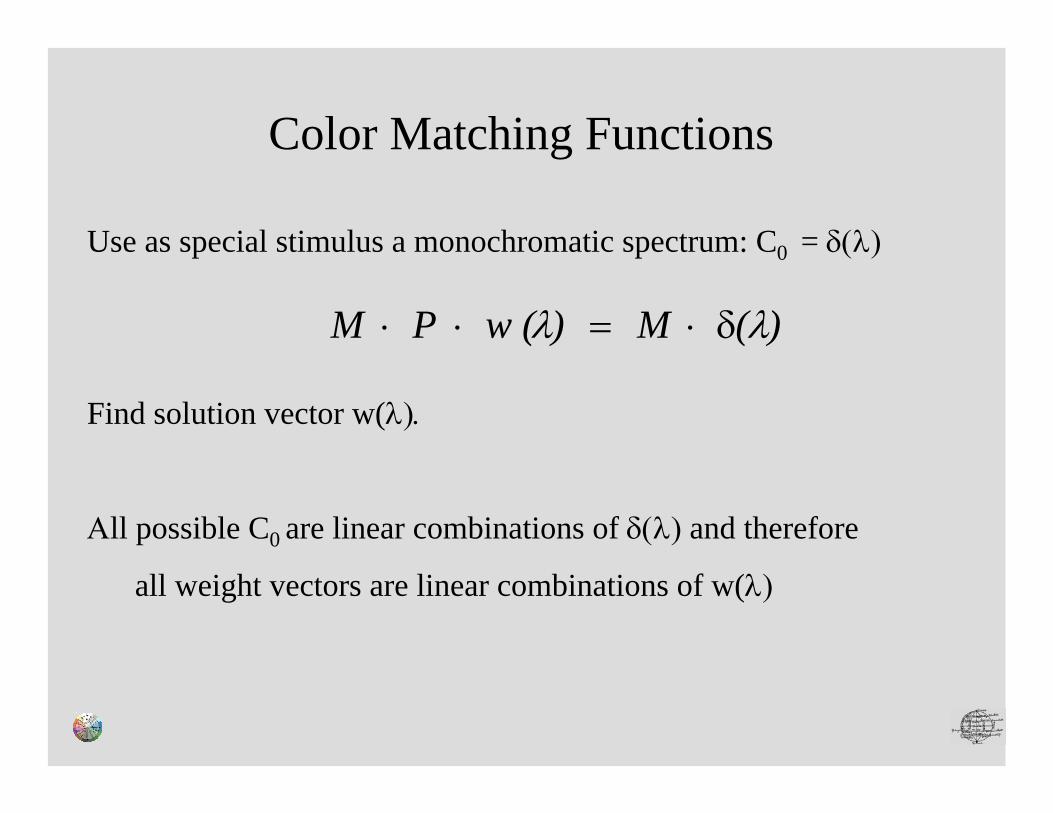
Use as special stimulus a monochromatic spectrum: C0 = δ(λ)
Find solution vector w(λ).
Αll possible C0 are linear combinations of δ(λ) and therefore
all weight vectors are linear combinations of w(λ)
)( M ) w ( P M λλ δ⋅=⋅⋅
Color Matching Functions
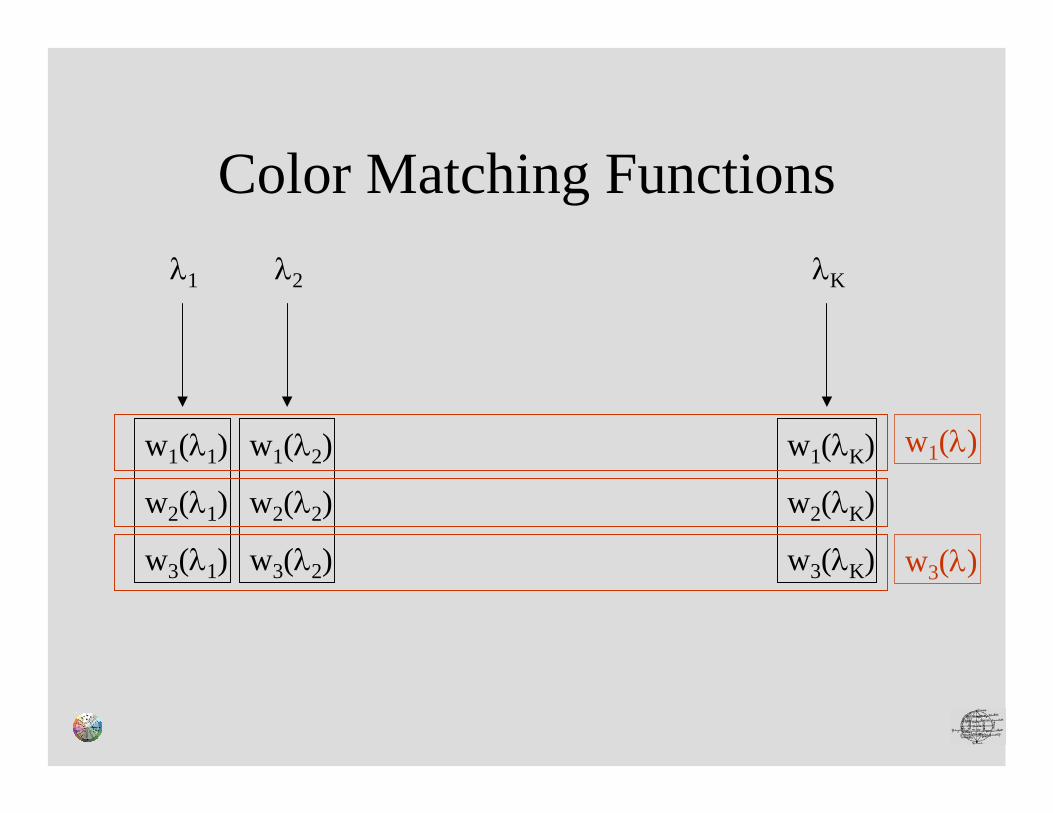
Color Matching Functionsλ1
w1(λ1)
w2(λ1)
w3(λ1)
λ2
w1(λ2)
w2(λ2)
w3(λ2)
λK
w1(λK)
w2(λK)
w3(λK)
w1(λ)
w3(λ)
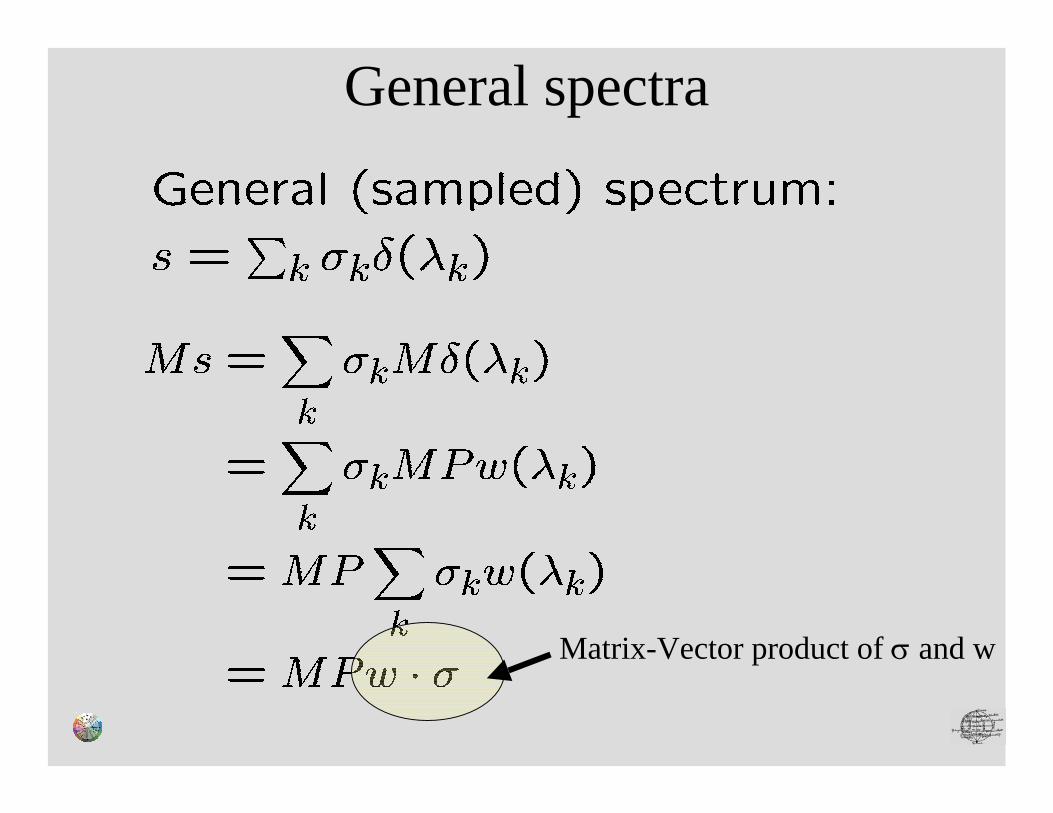
General spectra
Matrix-Vector product of σ and w
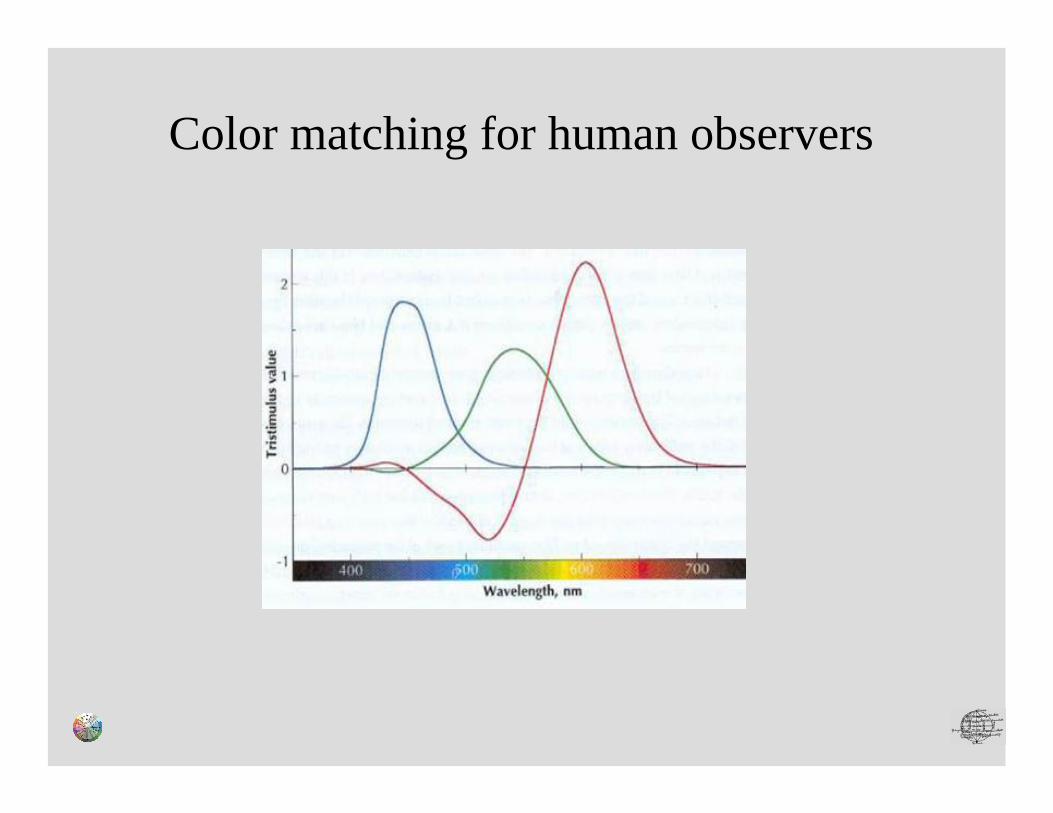
Color matching for human observers
Human cones are sensitive for
short (S-cones)
medium (M-cones) and
long (L-cones) wavelengths
Number of L-M-S cones = 40:20:1
No S-cones in the centre of the
retina!
Characteristics of human color vision
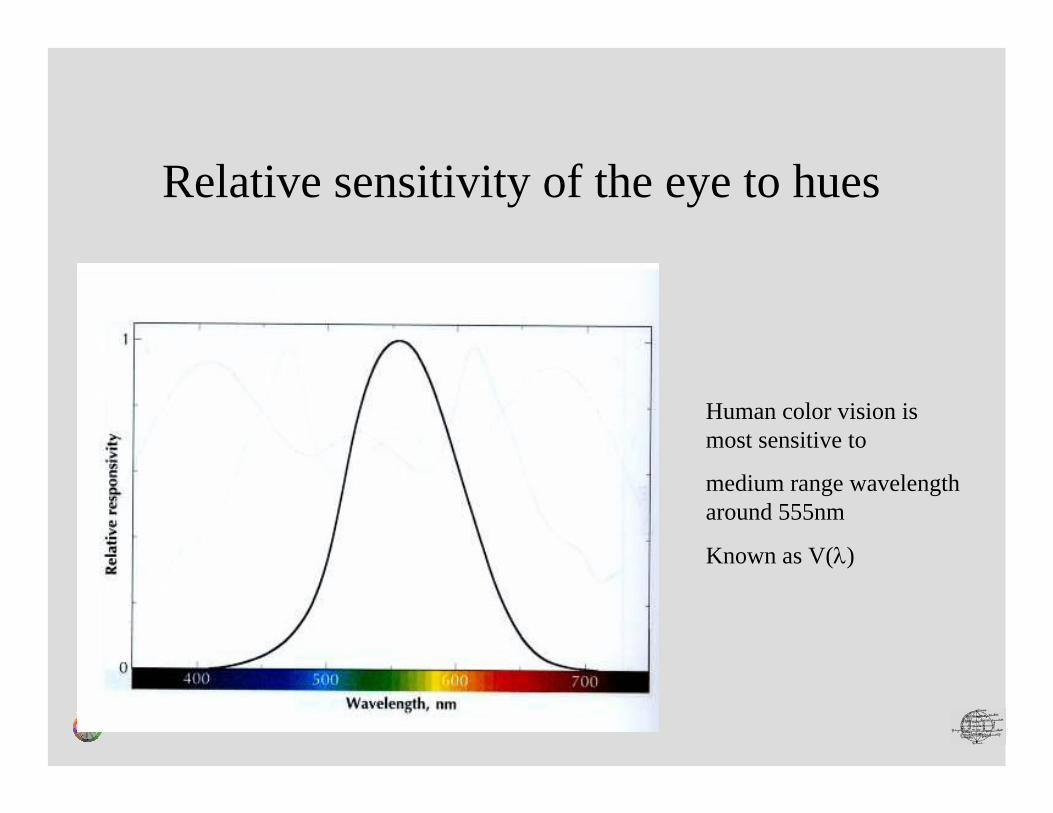
Human color vision is most sensitive to
medium range wavelength around 555nm
Known as V(λ)
Relative sensitivity of the eye to hues
The CIEXYZ systemWestland/Ripamonti: Computational Color Science: Chapter 4(Sharma: Digital Color Imaging Handbook Chapter 1.5.1)
• Discussion interpolation/extrapolation techniques• Spectral bandpass• Chromaticity diagram• Matlab:
•interp1 interpolation•cband bandpass correction•r2xyz reflectance to xyz•plocus plot spectral locus
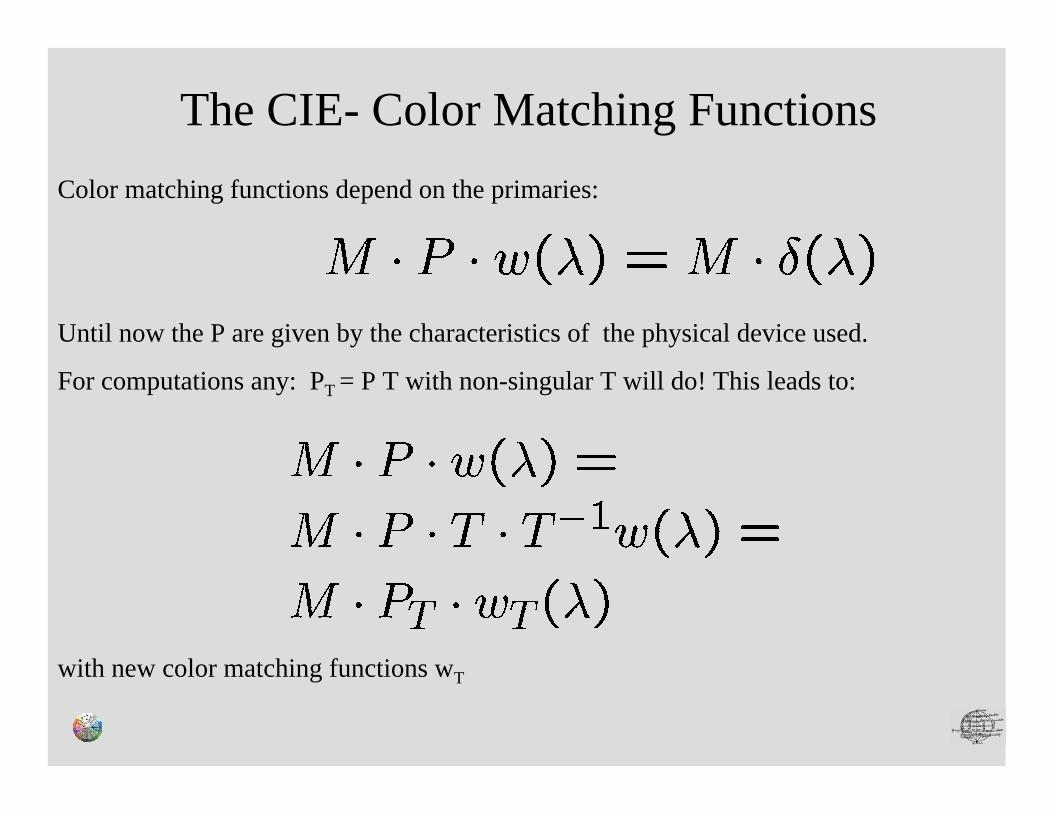
Color matching functions depend on the primaries:
Until now the P are given by the characteristics of the physical device used.
For computations any: PT = P T with non-singular T will do! This leads to:
with new color matching functions wT
The CIE- Color Matching Functions
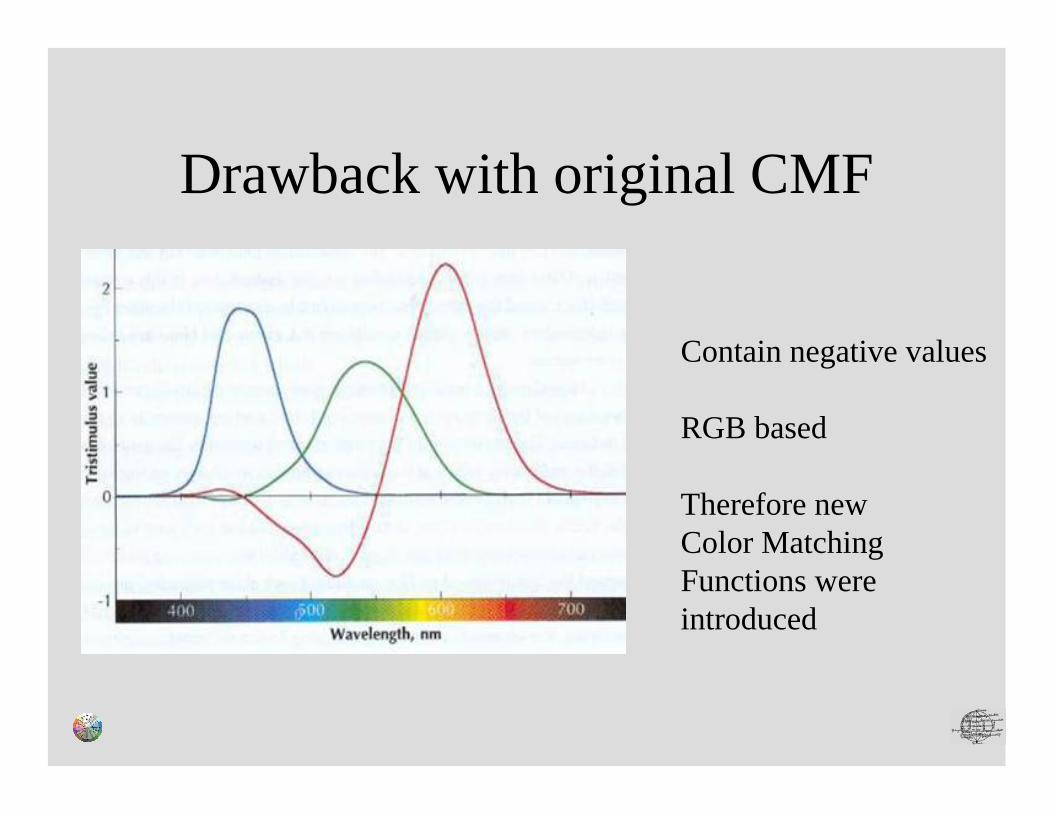
Drawback with original CMF
Contain negative values
RGB based
Therefore new Color Matching Functions were introduced
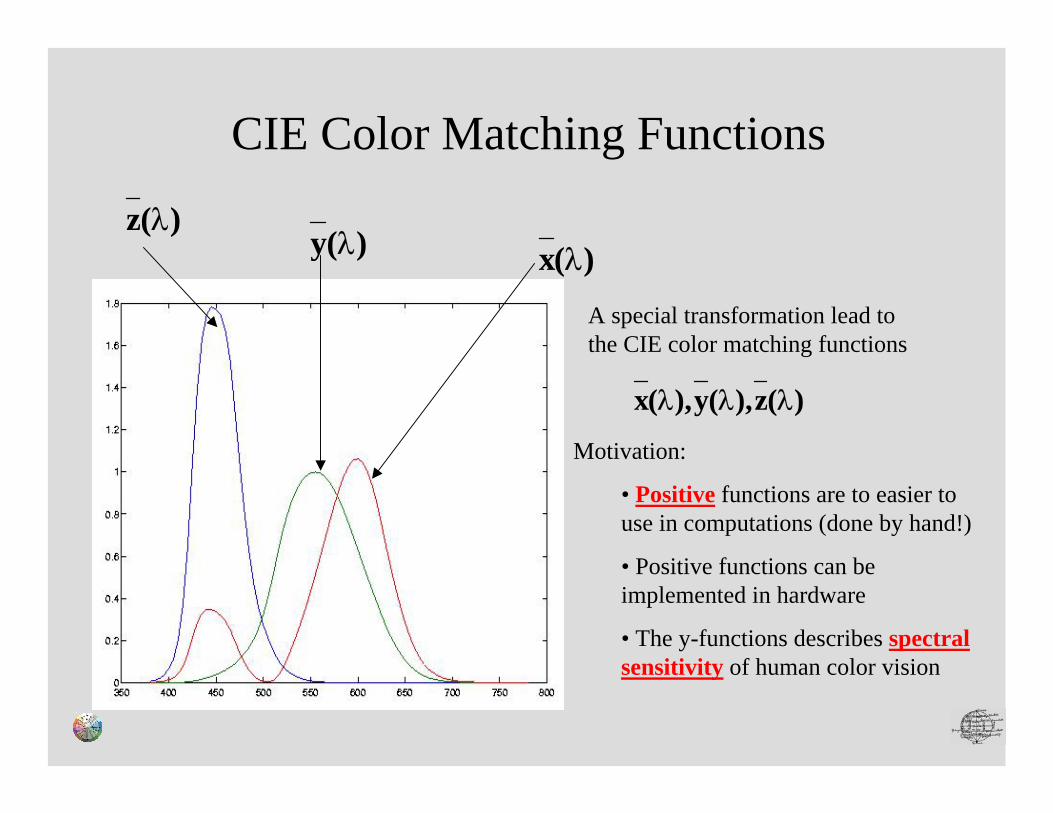
Motivation:
• Positive functions are to easier to use in computations (done by hand!)
• Positive functions can be implemented in hardware
• The y-functions describes spectral sensitivity of human color vision
A special transformation lead to the CIE color matching functions
)(z),(y),(x λλλ
)(x λ)(y λ)(z λ
CIE Color Matching Functions
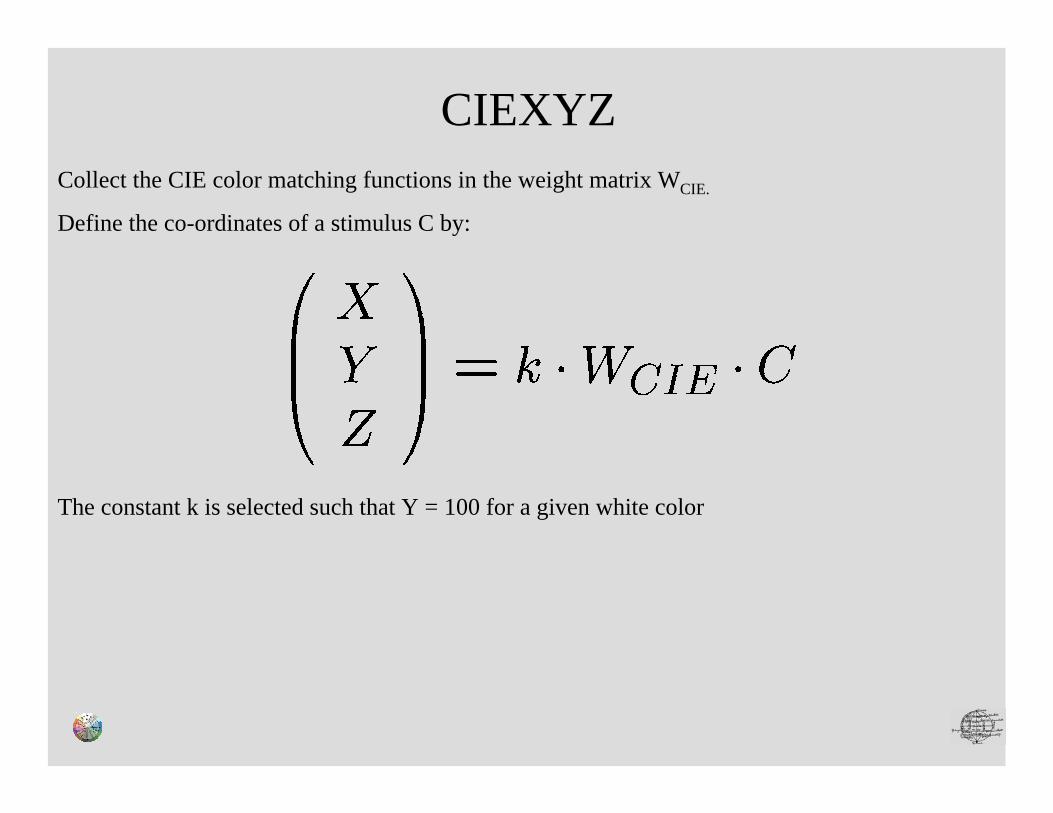
The constant k is selected such that Y = 100 for a given white color
Collect the CIE color matching functions in the weight matrix WCIE.
Define the co-ordinates of a stimulus C by:
CIEXYZ
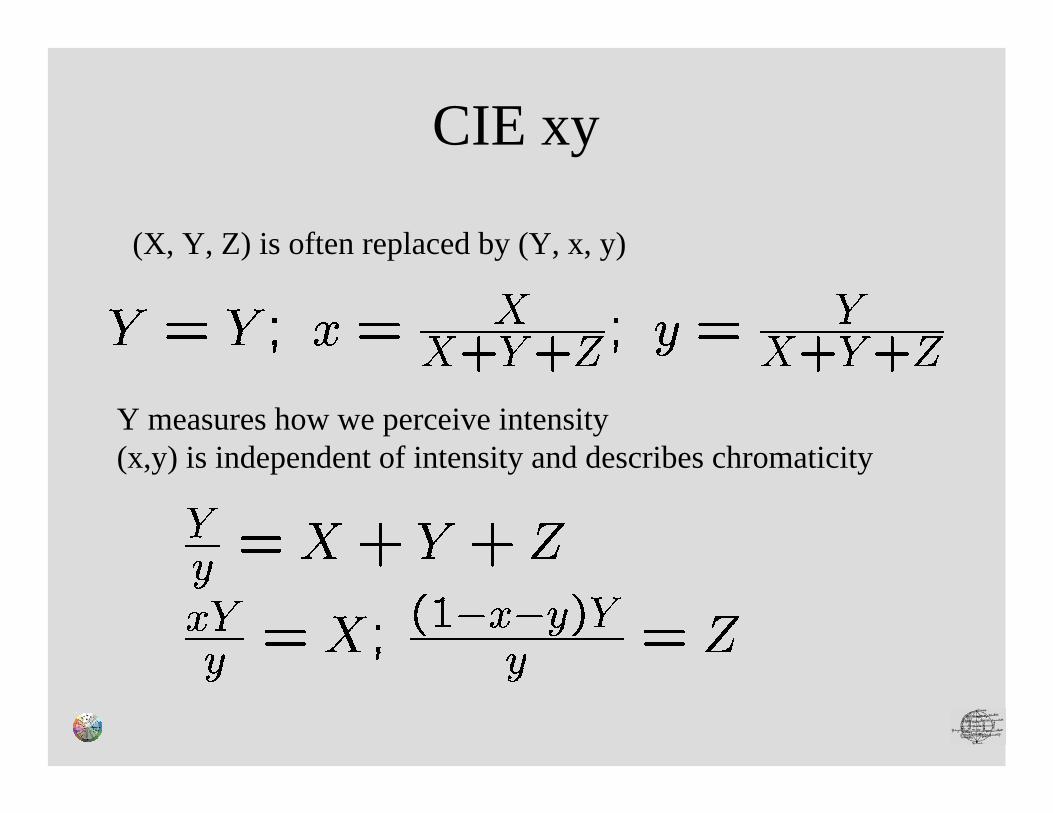
CIE xy
(X, Y, Z) is often replaced by (Y, x, y)
Y measures how we perceive intensity (x,y) is independent of intensity and describes chromaticity
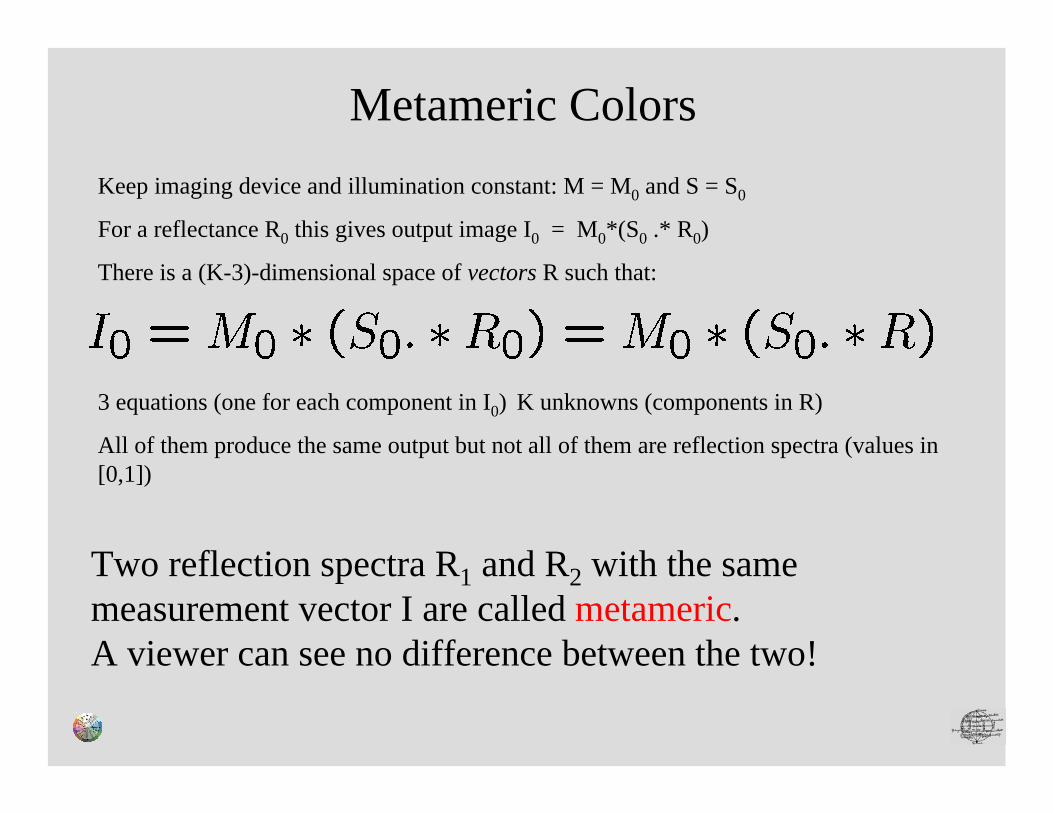
Keep imaging device and illumination constant: M = M0 and S = S0
For a reflectance R0 this gives output image I0 = M0*(S0 .* R0)
There is a (K-3)-dimensional space of vectors R such that:
3 equations (one for each component in I0) K unknowns (components in R)
All of them produce the same output but not all of them are reflection spectra (values in [0,1])
Two reflection spectra R1 and R2 with the same measurement vector I are called metameric. A viewer can see no difference between the two!
Metameric Colors
Metamerism continued
Assume two spectra R1 and R2 are metamericunder source S1
Now change illumination source to S2 usually R1 and R2 will have different measurement vectorsunder this illumination.
Now you can see the difference between the spectra!
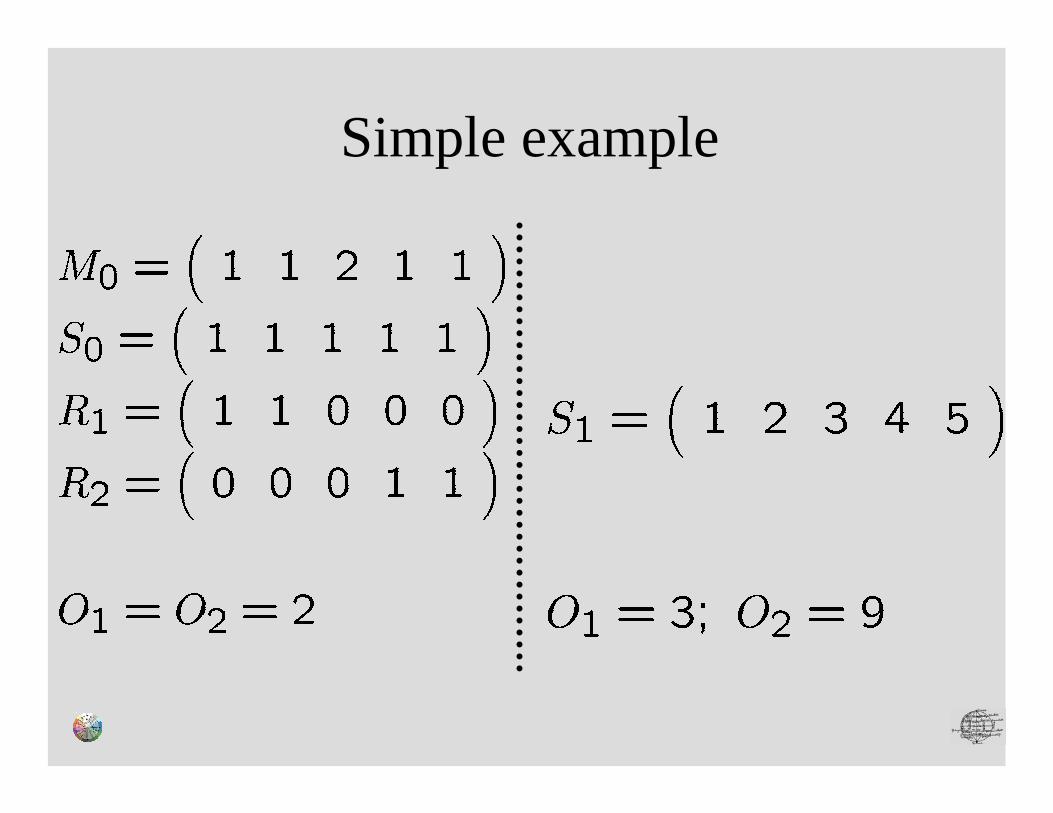
Simple example
Effects of metamerism
Disadvantage:
No-accurate color measurement in the sense
of spectra
Advantage:
Easier color reproduction
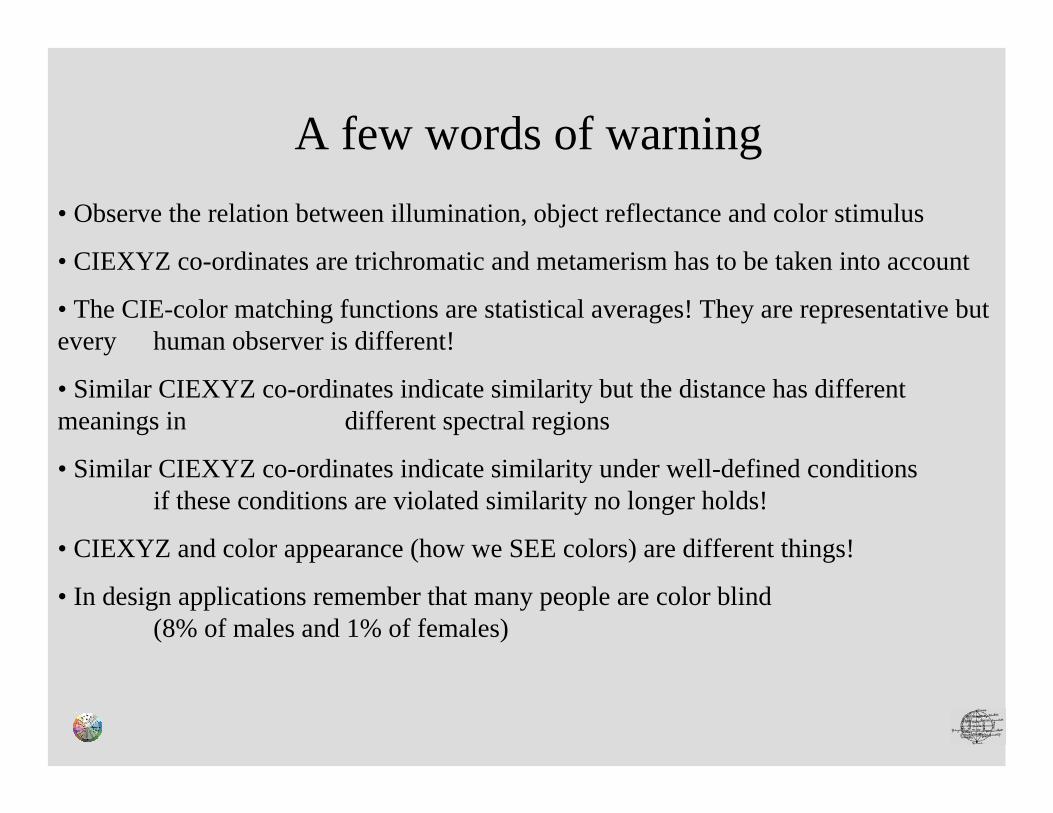
• Observe the relation between illumination, object reflectance and color stimulus
• CIEXYZ co-ordinates are trichromatic and metamerism has to be taken into account
• The CIE-color matching functions are statistical averages! They are representative but every human observer is different!
• Similar CIEXYZ co-ordinates indicate similarity but the distance has different meanings in different spectral regions
• Similar CIEXYZ co-ordinates indicate similarity under well-defined conditions if these conditions are violated similarity no longer holds!
• CIEXYZ and color appearance (how we SEE colors) are different things!
• In design applications remember that many people are color blind (8% of males and 1% of females)
A few words of warning
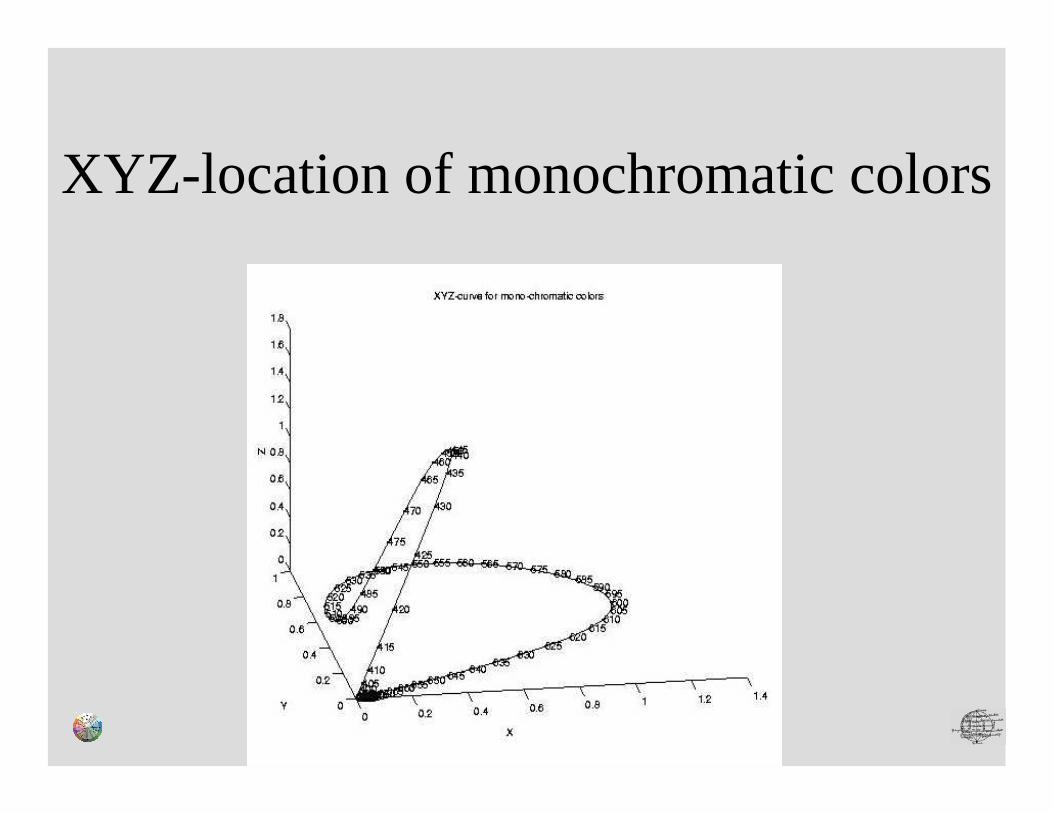
XYZ-location of monochromatic colors
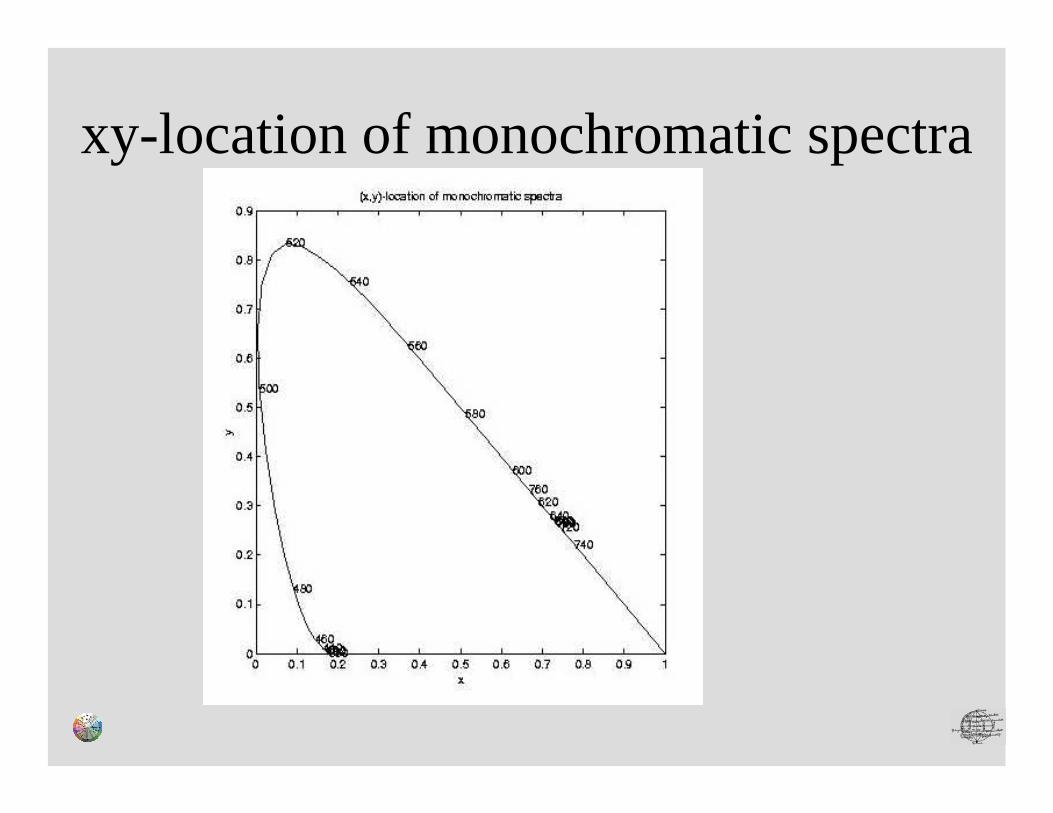
xy-location of monochromatic spectra
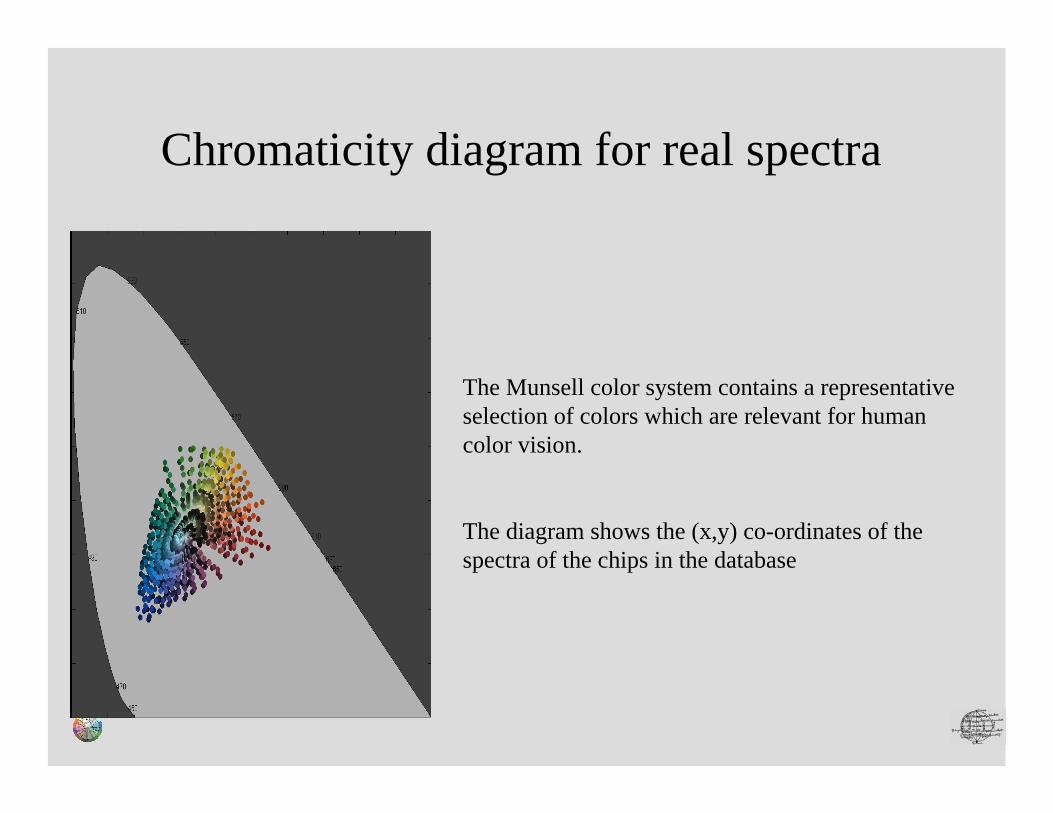
The Munsell color system contains a representative selection of colors which are relevant for human color vision.
The diagram shows the (x,y) co-ordinates of the spectra of the chips in the database
Chromaticity diagram for real spectra
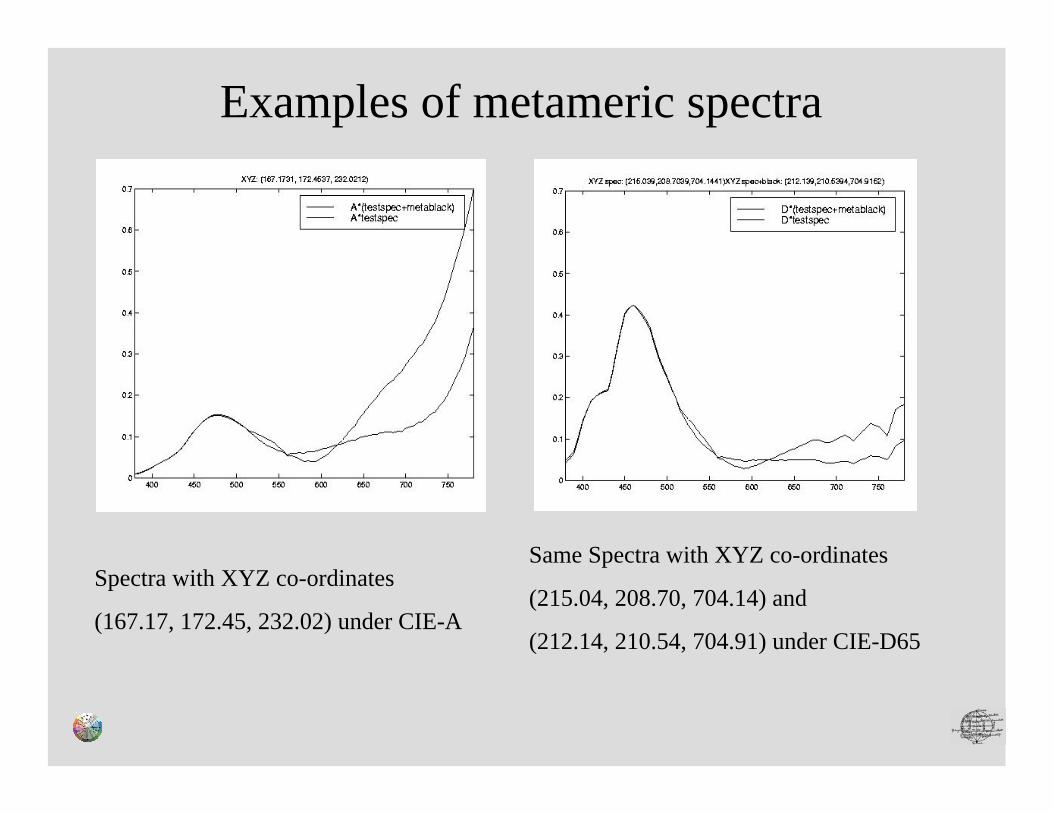
Spectra with XYZ co-ordinates
(167.17, 172.45, 232.02) under CIE-A
Same Spectra with XYZ co-ordinates
(215.04, 208.70, 704.14) and
(212.14, 210.54, 704.91) under CIE-D65
Examples of metameric spectra
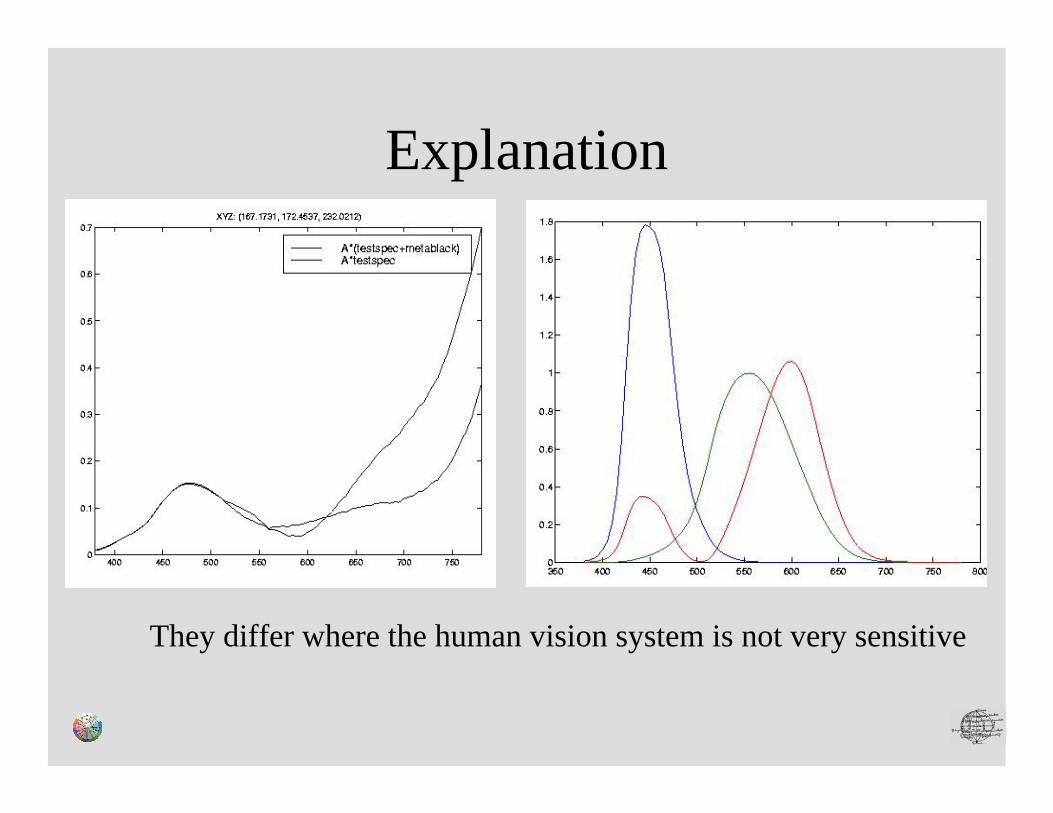
Explanation
They differ where the human vision system is not very sensitive
Homogenous Color Spaces: CIELAB & CIELUV
Westland/Ripamonti: Computational Color Science: Chapter 5(Sharma: Digital Color Imaging Handbook Chapter 1.7)
• 5.1-5.3 Introduction and description of CIELAB and CIELUV• 5.5 Implementation
• Matlab:•xyz2lab Conversion from XYZ to Lab•lab2xyz Conversion from Lab to XYZ•xyz2luv Conversion from XYZ to Luv•luv2xyz Conversion from Luv to XYZ•car2pol, pol2car: conversion of (a,b) or (u,v) between rectangular and polar coordinates
Drawback of the CIE-XYZ system:
The metric varies over the spectral space
XYZ-dist(stimulus1,stimulus2) = XYZ-dist (stimulus3,stimulus4)
does not mean that the difference between
stimulus1 and stimulus2
is the same as the difference between
stimulus3 and stimulus4
for a human observer.
Therefore various systems of perceptually homogeneous color spaces are in use
Perceptually homogeneous spaces
White PointTake a white object color with flat spectrum: 1)( =λR
Take a light source: 1)( =λS
The measured light has spectrum )()( λλ RS ⋅
),,( NNN ZYXWith CIEXYZ co-ordinates:
Often (XN,YN,ZN) are the CIEXYZ of the brightest point in the scene
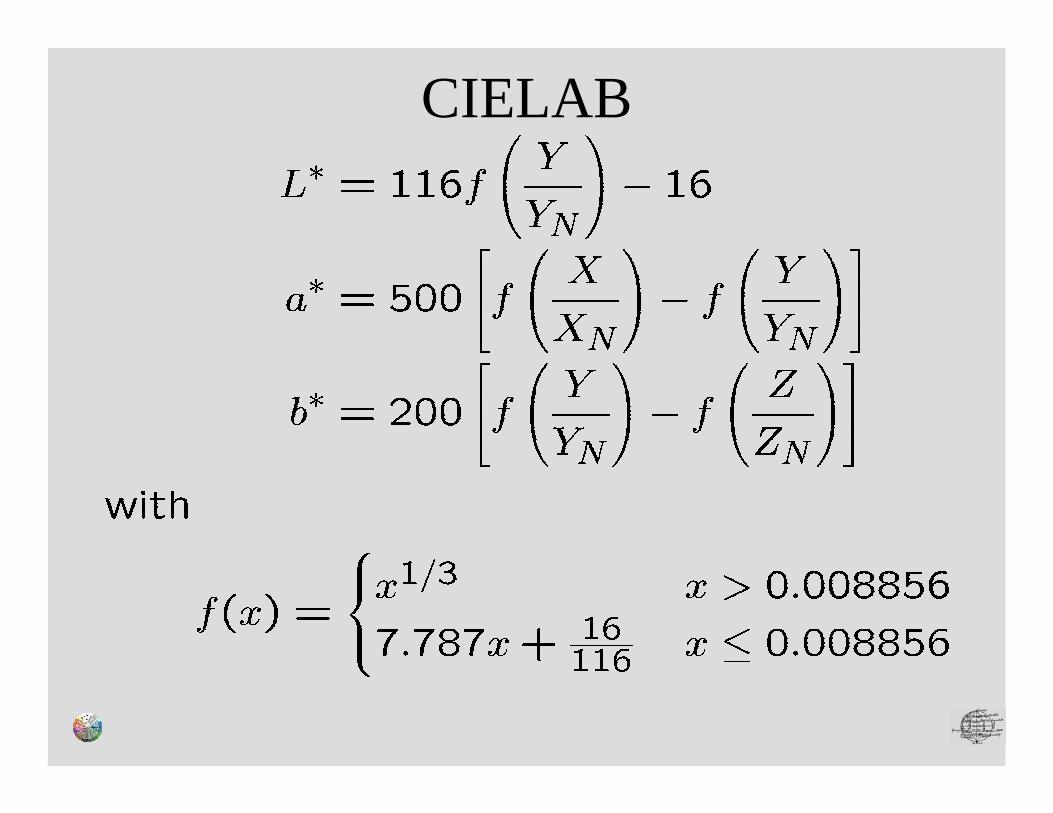
CIELAB
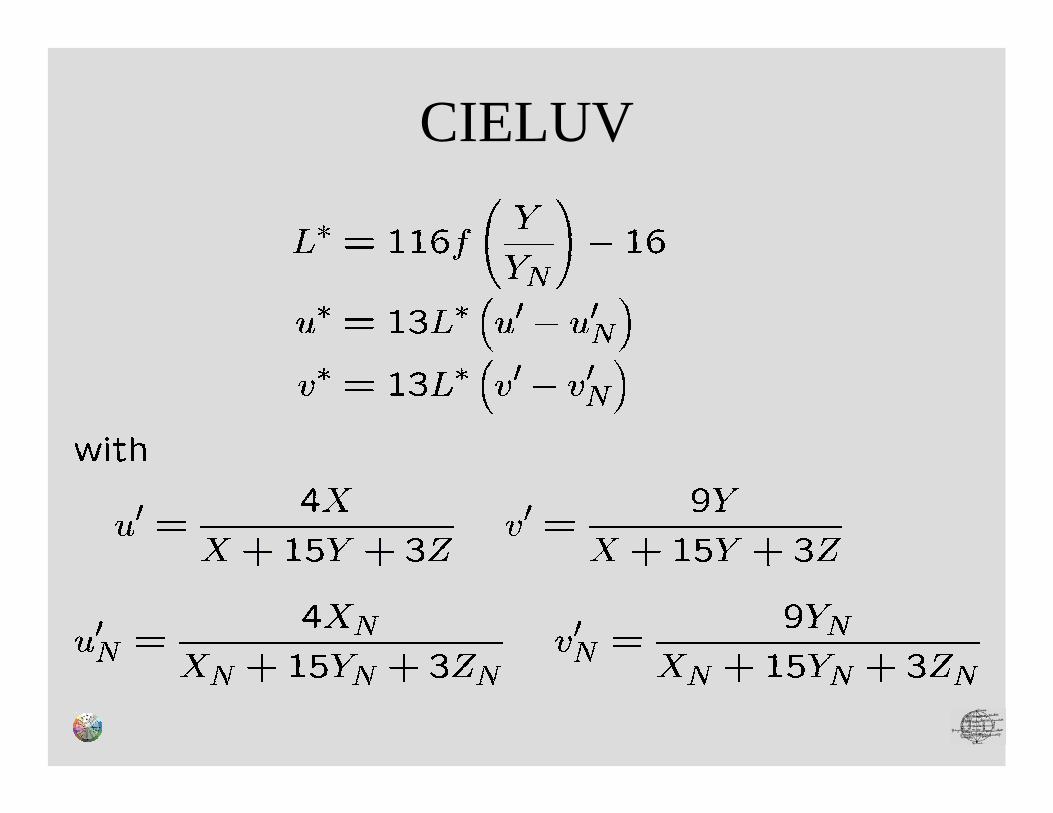
CIELUV
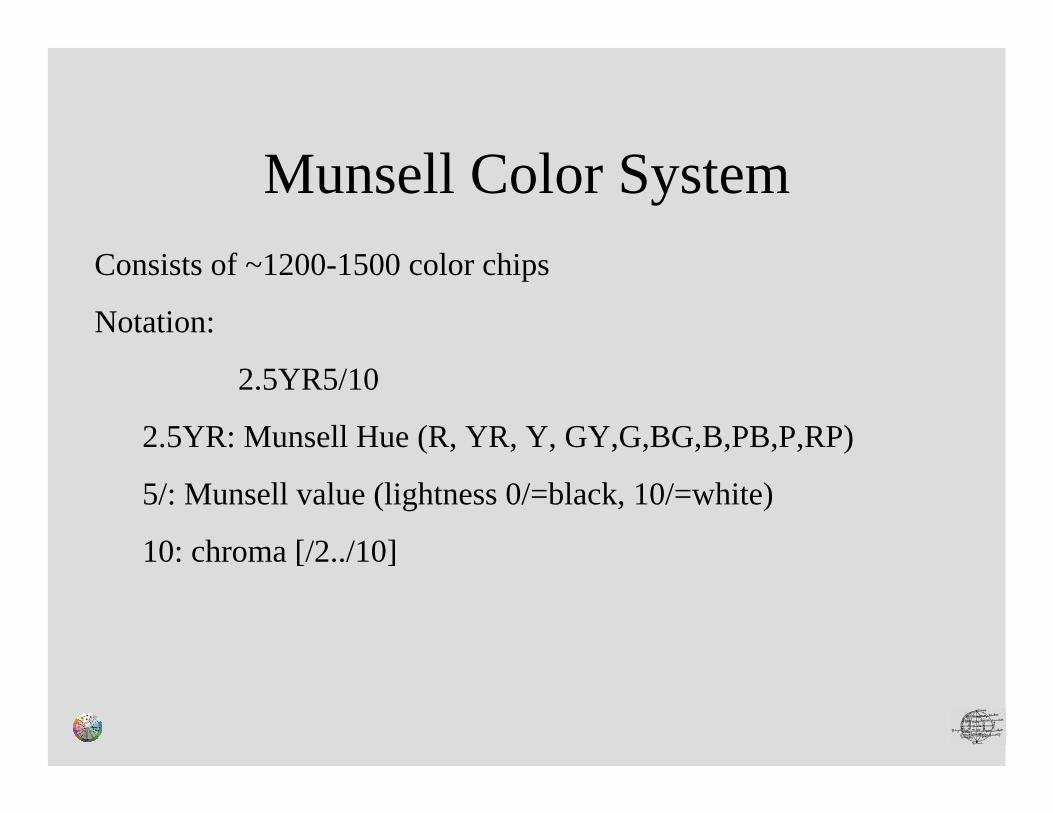
Munsell Color SystemConsists of ~1200-1500 color chips
Notation:
2.5YR5/10
2.5YR: Munsell Hue (R, YR, Y, GY,G,BG,B,PB,P,RP)
5/: Munsell value (lightness 0/=black, 10/=white)
10: chroma [/2../10]
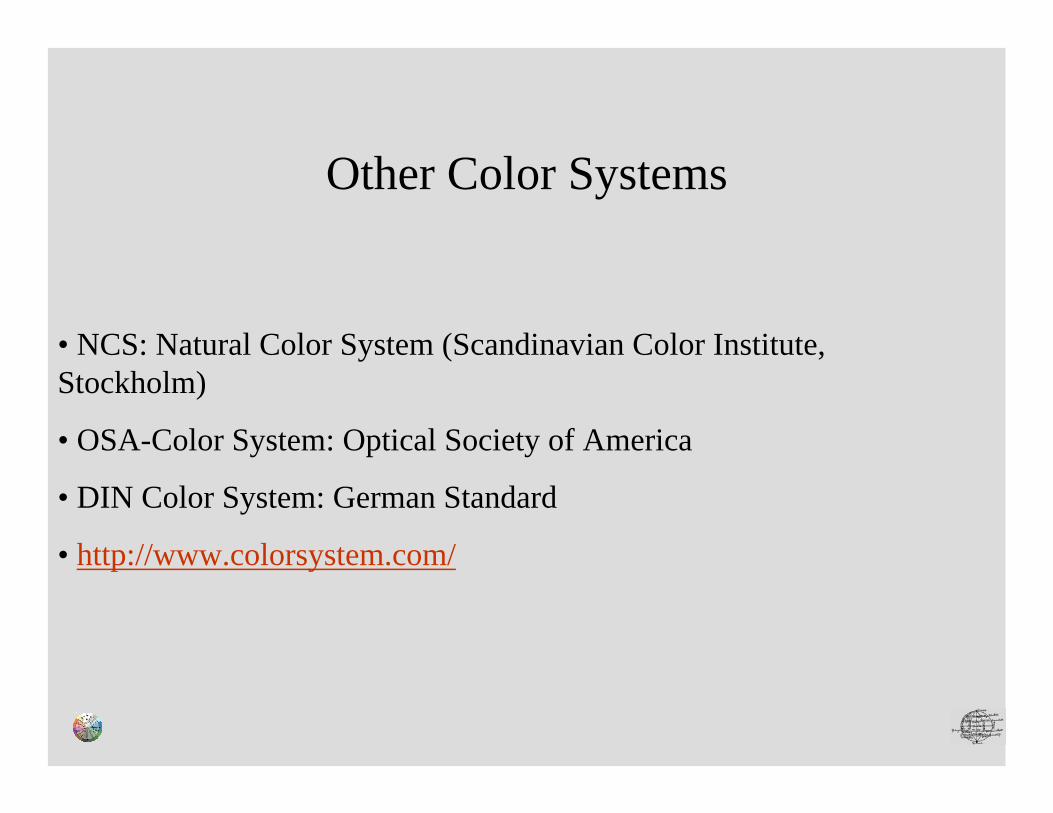
• NCS: Natural Color System (Scandinavian Color Institute, Stockholm)
• OSA-Color System: Optical Society of America
• DIN Color System: German Standard
• http://www.colorsystem.com/
Other Color Systems

The NCS-Book
c:\databases\ncs2000\ncsbook\ncsbook.m
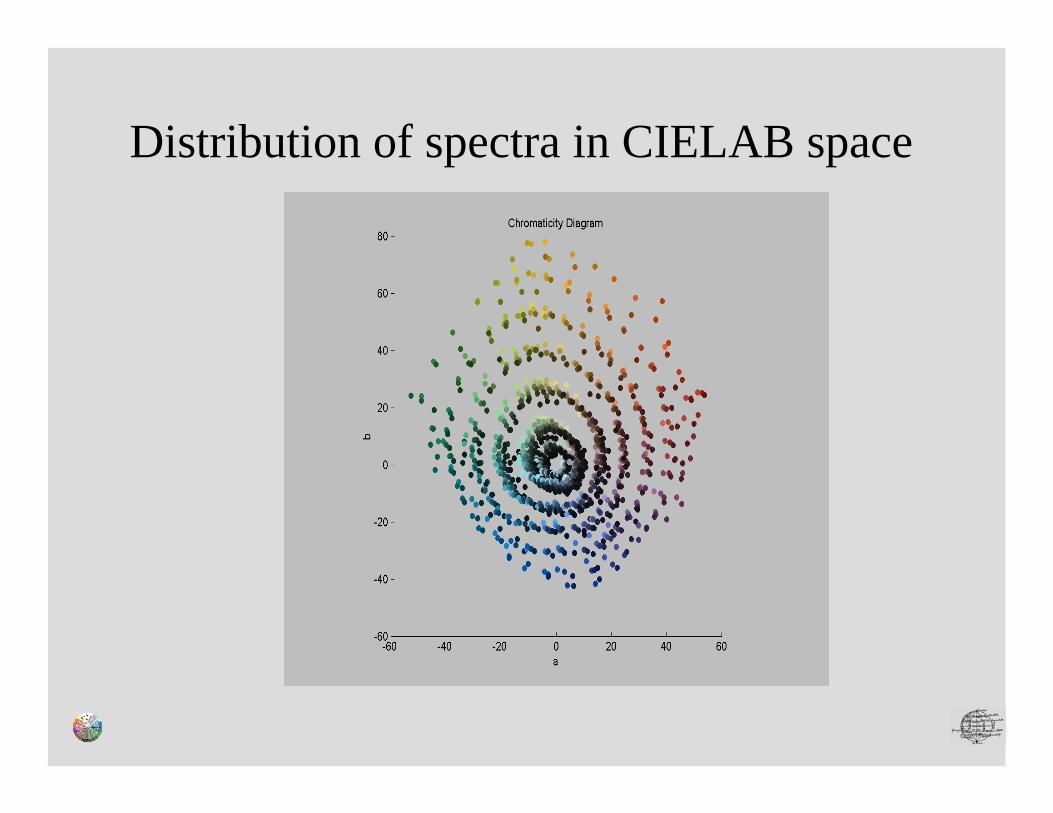
Distribution of spectra in CIELAB space
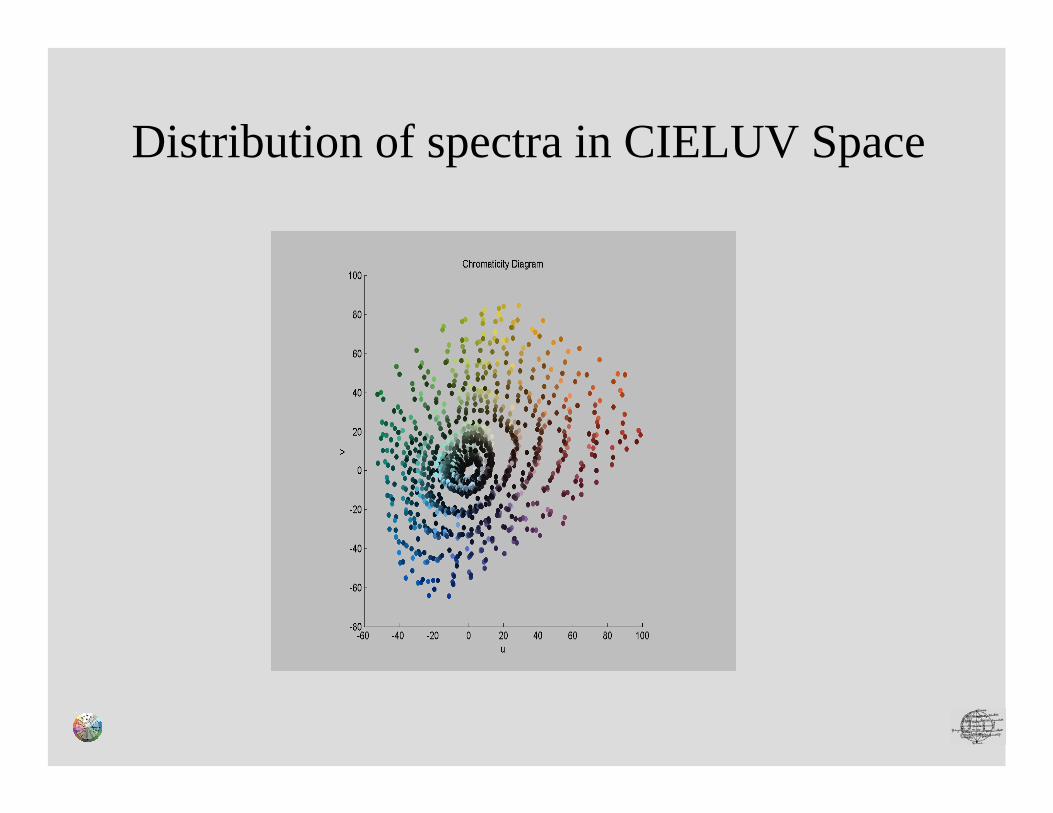
Distribution of spectra in CIELUV Space
Lightness/Hue/Saturation
L measures where on the black/white scale the color is:0 = black 100 = white
r2 = a2+b2: the ab-radius measures how saturated the color is
atan(a/b) the ab-angle measures the hue of the color
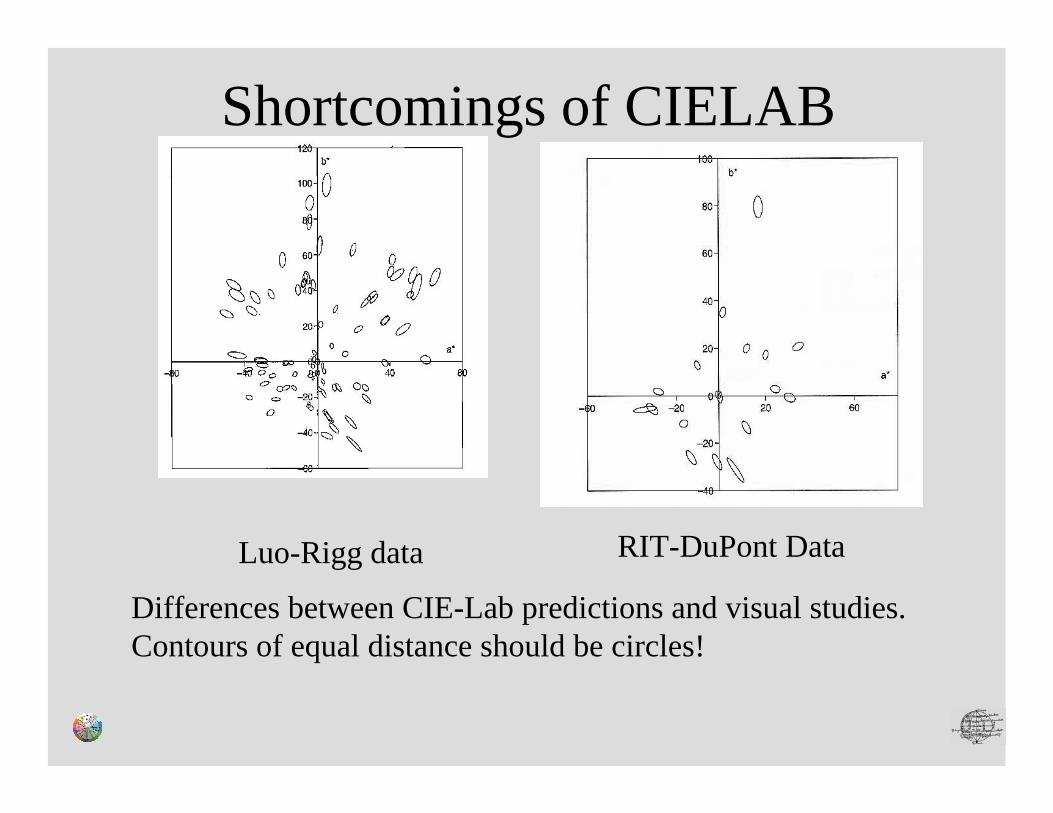
Shortcomings of CIELAB
Luo-Rigg data RIT-DuPont Data
Differences between CIE-Lab predictions and visual studies.Contours of equal distance should be circles!