Embed Size (px)
Citation preview

Part I
Chemical and Physical Foundations
1 Thermodynamics and Kinetics
1.1 Laws of Thermodynamics
The First Law of Thermodynamics is a restatement of the Law of Conservation of Energy.From the perspective of thermal systems, it can be expressed as:
∆E = q + w (1)
where E represents the change in energy of a system, q represents the heat flow into or out of asystem, and w represents work done by or on the system. The numbers here are, by convention,positive if the system gains energy (so if heat moves into the system, or if work is done on thesystem) and vice versa. Under constant pressure (which is where most biological systems operate),q is also ∆H, or enthalpy. ∆H and ∆E are state functions, in the sense that they are propertiesof a system at a specific state and are independent of how one arrives at that state.
For a process to be reversible, it must occur such that the system is constantly at equilibriumthrough the course of the process.
The Second Law of Thermodynamics states that the entropy of the universe must increaseor stay constant. Change in entropy is oftentimes referred to by ∆S (also a state function) and refersto the change in the “disorder” of a system, or, more mathematically precise, in the multiplicitiesof the system. This law simplifies into the understanding of the concept of free energy, or ∆G(referring to Gibb’s Free Energy, the free energy at constant pressure and temperature).
∆G = ∆H − T∆S (2)
The formula above gives a state function, the Free Energy, which serves as an indicator of theoverall entropy change of the universe, whereby a positive ∆G indicates an overall reduction inuniversal entropy and vice versa.
∆G = ∆G0 + RT ln Q (3)
Refers to how to calculate ∆G at non-standard conditions where R is the ideal gas constant, ∆G0
is the free energy under certain standard conditions, T is the temperature, and Q is a mathematicalcalculation representing the deviation from standard condition (as Blincoe would say, “productsover reactants”).
These state functions can be used to calculate properties of reactions. This can be done bytaking the total ∆G, ∆H, or ∆S of formation of the products (which can be found in a table andrepresent the change in a given state function of producing the substance from its original elements)and subtracting the total values of formation for the reactants (“products minus reactants”).
1.2 Kinetics
A reaction is first order if the rate of the reaction is proportional to the first power of a reactant(d[A]
dt = −k[A]). A reaction is then nth order for a specific reactant if the rate is proportional tothe nth power of that reactant (d[A]
dt = −k[A]n). For 1st order reactions:
d[A]dt
= −k[A]
A(t) = [A]0e−kt (4)
For second order reactions:
d[A]dt
= −k[A]2
1[A](t)
= kt +1
[A]0(5)
1

It should be noted that the rate of the reaction depends on the activation energy of a reaction(the hump in the reaction-energy diagram), and not on the free energy difference (∆G) or any otherstate function difference between products and reactants.
2 Redox States
There are two usages of “redox state.” The most formal refers to the charge on an atom. In ioniccompounds, this is simply the charge of the atom in the ion (ie in NaCl, Na’s redox state is +1 andCl’s is -1). In covalent structures, this is simply the formal charge on the atom in question.
There is another usage which is tied to the first, but refers more loosely to how electron-deficientan atom is. A carbon bonded to another carbon, for instance, would not be particularly electron-deficient. But, a carbon bonded to a nitrogen or an oxygen would be. Therefore a carboxylic acidis oxidized relative to a ketone is oxidized relative to an alcohol . . . It would be even more so if itwere doubly bonded to an oxygen. This state of electron deficiency is considered to be oxidizedrelative to the original carbon-carbon bond status.
Because of the change in the charges involved, reduction and oxidation involve electron transfers.
3 Water, pH, Acid-Base Reactions
The BrØnsted Lowry definition of an acid is a molecule which donates H+ and the definition of abase is a molecule which reduces H+ levels. The acidity of a substance is given by its Ka which isevaluated at equilibrium to be:
Ka =[H+][A−]
[HA](6)
where [A−] represents the concentration of the conjugate base, or the acid after it has donated aproton, and [HA] represents the concentration of undissociated acid. The basicity of a substance isgiven by its Kb which is ultimately Kw
Kawhere Ka refers to the acidity of the base’s conjugate acid
(the base upon gaining a proton) and Kw = [H+][OH−] = 10−14.The equation of importance here is the Henderson-Hasselbach Equation which defines the
pH of a solution under specific circumstances of acid/conjugate base levels:
pH = pKa + log[A−][HA]
(7)
This relationship suggests that solutions made using the salts of acids/bases or their conjugates canhave specific pH’s.
Buffers are solutions made from acids/bases and the salts of their conjugates which are ableto resist pH change. Mathematically, this is accomplished by having a sufficiently large volume ofbuffer such that the ratio [A−]
[HA] does not change substantially.
3.1 Solutions and Equilibria
At equilibria (∆G = 0), all reactions have a K property (products over reactants) which is depen-dent not on the rate of the reaction but on the overall free energy difference between the productsand the reactants, according to:
∆G = −RT ln K (8)
This K is related to kinetics indirectly in the sense that it is a quotient of the forward and reverserates of reaction (depending on how one defines K). A similar K dependence occurs also fordissolving substances.
4 Solute-Solvent Interactions and Chemical Interactions andBonds
Solute particles are able to affect some of the solvent’s properties (eg: partial vapor pressure, boilingpoint, freezing point, etc). These occur because dissolving requires solute-solvent interactions to
2

overcome the solute-solute and solvent-solvent interactions.The four types of non-covalent chemical interactions are polar dipole-dipole interactions,
hydrogen bonding, Van Der Waals dispersion forces, and ionic interactions. Polar dipole-dipole interactions refers to the affinity that molecular dipoles, molecules which have an uneven dis-tribution of charge, have for one another. Hydrogen bonding refers to especially strong dipole-dipoleinteractions between hydrogens connected to strongly electronegative atoms and other strongly elec-tronegative atoms which typically have lone pairs on them. The hydrogen bond is usually depictedas an interaction between the lone pair (hydrogen bond acceptor) and the hydrogen (hydrogen bonddonor). Van Der Waals dispersion forces refer to attraction with nonpolar molecules due to chargeimbalances arising by chance in nonpolar molecules. These explain octane’s higher boiling pointrelative to methane and iodine’s nongaseous state - the molecules are larger and more likely tobecome dipole-like. Ionic interactions, oftentimes called salt bridges in biological environments,are the affinity between cations and anions.
A general rule is that “like dissolves like”, meaning that polar solvents will dissolve polar solutesand nonpolar solvents will dissolve nonpolar solutes, but the two do not mix.
The hydrophobic effect is used to describe how many biological macromolecules fold in aque-ous environments. Because polar water molecules do not associate with hydrophobic groups, todissolve a hydrophobic group in water requires that the water molecules arrange themselves in alattice, held together by hydrogen bonding, surrounding the hydrophobic group. Thus, dissolvingnonpolar compounds in water has a weakly negative ∆H (releases energy) but a negative ∆S (de-crease in entropy), making ∆G temperature-dependent. The decrease in entropy is due to the watermolecules forming the tight, rigid structure. The hydrophobic effect refers to the release in freeenergy from allowing nonpolar groups to face the inside of the macromolecule (ie a protein folding)which thus eliminates the need for the crystalline water structure (and removes the ∆S cost) andhence is a strong driving force for folding.
These interactions also are the basis for not only macromolecular folding, but also for interac-tions between enzyme and substrate and between receptors and ligands. In each case, there mustbe a driving force as well as complementarity between the surfaces. The driving force for mostinteractions is typically the hydrophobic effect. Complementarity refers to the “match” betweensubstrate and enzyme or ligand and receptor with regards to positioning and type of interactions(i.e. two hydrogen bond donors must be paired with two hydrogen bond acceptors). It should benoted that hydrogen bonding, in an aqueous environment, is NOT a good driving force for macro-molecule folding or DNA base-pairing in general because hydrogen bond acceptors and donors areall satisfied by hydrogen bonding to water molecules in the unfolded state. Hydrogen bonding andsalt bridges are, however, important for specificity and complementarity.
5 Chemical Reaction Mechanisms
(consult an organic chemistry textbook if more is needed)SN2 reaction is a direct nucleophilic substitution where a nucleophile (an atom with a lone pair
that wishes to donate it) attacks at a position with a good leaving group (an atom who can take ona negative electric charge well). Mechanistically, this causes the leaving group to leave and replacesthe leaving group with the nucleophile as shown. The attack and leaving is simultaneous and occursthrough the shown transition state causing the final conformation to be an exact reversion of theoriginal stereochemistry. SN2 reactions work best with good leaving groups and good nucleophiles,but also when the nucleophile is not sterically hindered from attack (ie if A and B and C are smalland oftentimes hydrogen).
B
A
CLG
NuA
Nu
BCLG
A
Nu CB
LG
SN1 reactions occur when the leaving group first leaves, creating a flat carbocation intermediatewhich can then be attacked by the nucleophile from either direction, creating a final product that isindeterminate in terms of stereochemistry. SN1 reactions work best with good leaving groups (donot need a particularly good nucleophile) and when the carbocation is stabilized, preferably whenA, B, and C are carbon chains or larger.
3

B
A
CLG
BC A C
A
BNuNu LG
E2 eliminations occur when a base deprotonates at a position exactly anti to a good leaving groupsuch that a flat transition state resembling the final double bond is present. E2’s work best whenthe proper stereochemistry is present and a strong enough base is near.
LG
H
BH
LG
BB-H
LG
E1 elimination occurs when the leaving group first leaves, leaving a flat carbocation intermediate.Deprotonation by a base pushes electrons into the carbocation, completing the elimination. E1’sthus work best when there are stabilizing groups around the carbocation and when the leavinggroup is very good (the base does not need to be very strong).
LG
H
B
H
B-H
LG
Much of biological chemistry has to do with carbonyl chemistry. There are three principles thatone needs to be kept in mind when dealing with carbonyls. First, carbonyls are electrophiles atthe carbon group which is very oxidized because of its two bonds to oxygen.
O O
Secondly, the protons alpha to a carbonyl are fairly acidic because the electrons can flow into theelectrophilic carbonyl.
OH
B
O
Thirdly, nucleophilic attacks on carbonyls go through a tetrahedral intermediate (the stereochem-istry depends on where the nucleophile attacks from) which collapses to recreate the carbonylstructure and kick off a leaving group.
X
O
Nu
OX
Nu
O
Nu
X
Carbonyls undergo a variety of condensation reactions. The acidity of the α-proton allows for threeparticular condensation reactions which occur repeatedly in biology. One is the Michael additionwhere a carbonyl conjugated to a double bond can convey the carbonyl’s electrophilicity to theposition β to the carbonyl:
4

O
R
Nu
R
O
Nu
R
O
Nu
H A
R
O
Nu
The aldol condensation employs the acidity of the α-proton to convert the α position into anucleophile which can then attack other carbonyl’s, generating carbonyl’s with alcohol groups atthe β position. This is a key step in the gluconeogenesis pathway and its reverse, the retro-aldolis the key step in glycolysis:
O
R
RC
O
R
H
B
O
R
O
R
H A
R
O OH
R
R
The Claisen condensation employs a similar mechanism to convert the position α to a carbonylinto a nucleophile and displaces the alcohol group of an ester, giving a β-ketoester. This is a keystep in fatty acid synthesis, and the reverse retro-Claisen is the key step in fatty acid metabolism:
O
RH
B
O
R
O
R
R
O
ORR
O O OR
R
H A
R
O O
R
Another key condensation is the replacement of a carbonyl with an imine group, oftentimes used byenzymes to covalently attach a carbonyl to a lysine residue. The aldolase responsible for catalyzingthe key aldol and retro-aldol condensations in glycolysis and gluconeogensis operate in this fashion.Effectively, a series of proton transfers converts the carbonyl oxygen into a water molecule whichcan act as a leaving group, allowing the nitrogen to create the imine linkage, which is oftentimescalled a Schiff base, and is notably more electrophilic than a carbonyl because of the positivecharge:
R
O
R
H2NR
R
OH
R
HN
H+ transfer
R
AH
R
OH2
R
HNR
R R
HN
R
5

Part II
Catalysis and Binding
6 Enzyme Reaction Mechanisms and Kinetics
6.1 How Enzymes Work
Every different enzyme employs a different reaction mechanism. However, they all work by loweringthe activation energy (free energy difference between the transition state and substrate whichfor quantum mechanical reasons allows a reaction to progress faster):
1. Enzymes position reactive amino acids to “activate” the substrate (raising the free energy ofthe substrate, making it easier to proceed through the reaction)
2. Enzymes bind the transition state more tightly than the product or reactant states, loweringthe transition state energy
Alternative approaches (not all are mutually exclusive with each other or with the transitionstate stabilization theory described here, the bold terms are important to know though) to under-standing how enzymes work are:
1. Induced Fit Model which claims that the binding of the correct substrate triggers a changein the structure of the enzyme that brings catalytic groups into the right position to catalyzethe reaction
2. Nonproductive Binding claims that only the correct substrates bind in one, specific, andproductive orientation to an enzyme for catalysis, while incorrect substrates bind in multipleorientations and thus cannot react.
3. Strain and Distortion Model argues that the enzyme active site strains the bonds andatoms of the substrate molecule such that it assumes the transition state
6.2 Enzyme Limitations
It should be noted that enzymes have certain limitations. They do not affect the final equilibriumbetween products and reactants (which is dependent on ∆G which is dependent only on the initialand final states rather than the process), are thus oftentimes reversible, are oftentimes energy-dependent, oftentimes require cofactors, and cannot process reactions which are not energeticallyfavorable.
6.3 Enzyme Kinetics
Enzyme reactions can be summarized as follows:
S + E ES → E + P
The velocity of the reaction, defined as d(P )dt , thus shows first-order kinetics with respect to the
enzyme-substrate complex with the constant kcat (also called the turnover rate:
v =d(P )dt
= kcat(ES)
The rate of appearance of the enzyme-substrate complex, then, is given by the rate of the forwardreaction (with kinetic constant k1) subtracted by the rate of the reverse reaction (with kinetic con-stant k−1) and the rate of enzymatic catalysis (as it also consumes the enzyme-substrate complex).Thus:
d(ES)dt
= k1(E)(S)− k−1(ES)− kcat(ES) (9)
6

At steady-state equilibrium, this rate is 0. One can thus define an equilibrium value Km:
Km =kcat + k−1
k1=
(E)(S)(ES)
(10)
As (E) and (ES) are constantly varying, we seek a quantity which is constant which will allow usto calculate the reaction rate under the presence of enzyme. Because the total enzyme is constant,an expression for (ES) can be found:
Etot = (E) + (ES) = (ES)(
Km
(S)+ 1
)⇒ (ES) =
(Etot)1 + Km
(S)
Substituting into the original equation gives the Michaelis-Menten equation for enzyme kinetics:
d(P )dt
=kcat(Etot)(S)
(S) + Km(11)
As the maximum possible enzyme velocity is when all the enzyme is complexed (hence when (ES) =(Etot)) equation [11] can also be written:
d(P )dt
=vmax(S)
(S) + Km
Hence, enzyme kinetics are determined primarily by two parameters: Km and kcat.
6.4 Analysis of Enzyme Kinetics
There are three plots which are always associated with Michaelis-Menten Kinetics. The first arecalled Lineweaver-Burk plots which show the relationship between the reciprocal of the velocityand then reciprocal of the substrate concentration:
v =vmax(S)
(S) + Km
1v
=1
vmax+
Km
vmax
(1
(S)
)(12)
which is in other words a line with vertical intercept of 1/vmax and a slope of Km/vmax.The second are called Dixon plots which show (S)
v versus (S) (which is essentially the Lineweaver-Burk relationship multiplied by (S) on both sides):
(S)v
=1
vmax(S) +
Km
vmax(13)
which is a line with vertical intercept of Km
vmaxand a slope of 1
vmax.
The last is the Eadie-Hofstee plot which plots v versus v/(S) (which is essentially the Lineweaver-Burk relationship multiplied by vmaxv):
v = −Km
(v
(S)
)+ vmax (14)
which is a line with vertical intercept vmax and a slope of −Km
6.5 Competition and Inhibition
If an enzyme has two substrates, it will react with both, thus slowing the rate of the reaction withone specific substrate because of partial saturation with the other substrate. The relative reactionrate, then, is determined by the specificity of the enzyme as well as the substrate concentrations.Recall that at equilibrium:
v(t) =kcat(E)t(S)
Km(15)
7

Thus, if [A] and [B] are two substrate for the same enzyme, then because the free enzyme (E)t isthe same for both enzymes, the relative rate of reaction is:
vA
vB=
(kcat
Km
)A
[A](
kcat
Km
)B
[B](16)
and thus kcat
Kmis the bspecificity constant of an enzyme for a particular substrate.
Competitive inhibitors (ie most small-molecule drugs), on the other hand, do not get reactedwith and simply bind the enzyme, preventing the enzyme from binding the substrate. This bindingshows a binding parameter KI such that:
KI =[E][I][EI]
(17)
Therefore the total enzyme concentration is actually the sum of the free enzyme, enzyme bound tosubstrate, and enzyme bound to inhibitor:
Etot = (E) + (ES) + (EI) = (E)(
1 +(I)KI
)+ (ES) (18)
Using [18] and re-deriving the Michaelis-Menten relationship gives the formula for the rate of anenzyme-catalyzed reaction subject to a competitive inhibitor:
v =kcat(Etot)(S)
(S) + Km
(1 + (I)
KI
) (19)
This new relationship has a modified Km of:
K ′m = Km
(1 +
(I)KI
)(20)
It should be noted here that the inhibition can be made irrelevant by sufficiently large levels ofsubstrate. On a Lineweaver-Burke plot, this inhibition is represented by a rotation of the curve,with increasing inhibitors showing an increased rotational effect. Because a competitive inhibitordoes not affect the maximum velocity, the vertical intercept ( 1
vmax) stays at the same position while
the horizontal intercept representing Km shifts.Inhibitors that are not competitive cannot be overcome by large levels of substrate and can
happen in three ways:
1. An irreversible modification to the enzyme active site (e.g. 5-FU binding to thymidylatesynthase)
2. Binding of an inhibitor to the enzyme at a site other than the enzyme active site (e.g. NNRTIs[as opposed to NRTIs])
3. Binding of the inhibitor to the enzyme-substrate complex
This is where the nomenclature becomes difficult and confusing. There are two types of nomen-clature employed. The first and most used refers to three broad types of inhibition: competitive,noncompetitive, and uncompetitive. In this system, the term uncompetitive inhibitor refersto inhibitors that are not competitive which are able bind to the enzyme-substrate complex andare thus only able to exert influence when substrate concentrations are high (when the enzyme-substrate complex is in abundance), as compared to competitive inhibitors which cannot exertinfluence when substrate levels are high and can only do so when the concentrations are low. In aLineweaver-Burke plot, these curves are shown as lines which have been displaced vertically in thepresence of inhibitor. In this system, the term noncompetitive inhibitor refers to inhibitors thatare able to bind both the free enzyme and the enzyme-substrate complex and thus exert multipleeffects on the Lineweaver-Burke plot.
8

In the second system of nomenclature, inhibitors are designated according to which constantthey affect. Competitive inhibitors affect Km (refer to [20]), while noncompetitive inhibitors affectkcat, and mixed inhibitors affect both. While this is not as oftentimes used, its important toremember that enzyme kinetics can be almost exclusively understood from their ability to impactthe parameters of the Michaelis-Menten relationship, which is why this is included. Therefore,in dealing with enzyme kinetics calculations regarding inhibitors that act in a mode different fromsimple competitive inhibition, one only has to consider the effects on the Michaelis-Menten equation(e.g. if an irreversible inhibitor knocks out 10% of an enzyme, then (E)tot is reduced by 10%).
7 Ligand-Protein Interactions
7.1 Mathematics of Complex Formation
The value which determines complex formation equilibria is KD:
KD =(R)(L)(RL)
(21)
where (R) is the equilibrium level of free receptor, (L) of free ligand, and (RL) of receptor-ligandcomplex. From [8], we know, therefore, that a smaller KD means a tighter and more energeticallyfavorable interaction. Using the fact that the total receptor ((R) + (RL)) level is constant, thenone can deduce:
Rtot = (R) + (RL)
= KD(RL)(L)
+ (RL)
(RL) =RtotL
KD + L
(RL)Rtot
=L
KD + L(22)
If, as is often the case, that the total ligand concentration is much greater than the total receptorconcentration, then the concentration of free ligand L can be approximated by the total ligandconcentration Ltot.
7.2 Scatchard Equation
[22] is oftentimes plotted as a Scatchard diagram which plots the fractional saturation dividedby the ligand concentration against the fractional saturation:
(RL)Rtot
(KD + L) = L
KD(RL)Rtot
= L
(1− (RL)
Rtot
)
(RL)Rtot
L=
1KD
− 1KD
((RL)Rtot
)(23)
which gives a linear relationship where the vertical intercept is the reciprocal of the dissociationconstant and the slope is the negative of the reciprocal of the dissociation constant.
[23] was derived for the case of a single receptor. It turns out, though, if there is a protein withmultiple identical receptors for the same ligand, and if each of these receptors acts independentlyof each other (binding at one site does not affect the affinity at another site), then the equationcan still be used if one understands that (RL)
Rtotis actually ranges from 0 to N , where N is the total
number of receptor sites on the molecule. In a Scatchard diagram, then, the vertical intercept wouldthus be N
KD, the horizontal intercept would be N and the slope would be − 1
KDwhere KD is the
dissociation constant for a single receptor:(RL)Rtot
L=
1KD
(N − (RL)
Rtot
)(24)
9

It should be noted that many texts write [24] as:
y
L= KA(N − y) (25)
where y is the fractional saturation (measured from 0 to N) and KA is the association constant,which is simply the reciprocal of KD.
In some cases, the Scatchard Equation, is written as a relationship between r, the number ofbound ligand molecules per monomer, and n, the number of binding sites per monomer:
r
L=
1KD
(n− r) (26)
7.3 Hemoglobin and Myoglobin and the Hill Equation
A comparison between hemoglobin and myoglobin binding of oxygen is the standard example givenwhen dealing with complex receptor-ligand interaction systems that deal with cooperativity orallostery. Both terms refer to binding relationships where the receptors are not independent.Cooperativity refers to what happens when binding of one receptor with ligand alters the affinity ofthe other receptors, while allostery refers to what happens when the binding of the receptors witha non-ligand at an allosteric position affects their affinity for substrate.
Cooperativity can be either positive or negative with the former referring to cases where bindingof ligand increases the affinity of the other receptors and the latter refers to a decrease. Cooper-ativity can be observed through a sigmoidal relationship between fraction of receptors bound andconcentration of ligand and by a non-linear relationship when a Scatchard diagram is made. If onetakes [25], one can rearrange it:
y/N
L= KA(1− y/N)
y/N
1− y/N=
f
1− f= KAL (27)
[27] shows a linear relationship between the ratio of the fractional saturation f (recall that y rangesfrom 0 to N and that the true fractional saturation is thus y/N) to 1 − f goes linearly with L.Cooperativity relationships do not show this linearity and the degree of linearity can be quantifiedusing the Hill Coefficient n such that:
f
1− f= KALn (28)
where n ranges from 1 (in the case of complete non-cooperativity as shown in the Scatchard rela-tionship in [27]) to N (in the case of all-or-nothing cooperativity, where if one receptor is boundall the other receptors are forced to be bound as well). Hill plots are often made to assess n atdifferent ligand concentrations. This is best visualized by taking the logarithm of both sides:
logf
1− f= n log L + log KA
which results in a graph where the slope of the curve at any point is the Hill coefficient, or degreeof cooperativity, at that ligand concentration/degree of saturation.
In the comparison between Hemoglobin and Myoglobin one finds that Myoglobin (which is inmuscle cells) binds oxygen with a Hill coefficient of 1 (no cooperativity, as there is only one bindingsite) and Hemoglobin, which has a lower affinity for oxygen than myoglobin, has several Hill coef-ficients with the physiologically relevant one being around 2.8. This is evolutionarily advantageousas it means that Hemoglobin molecules will quickly and cooperatively release oxygen when oxygenconcentrations are low (i.e. in the tissues) and quickly and cooperatively bind oxygen when oxygenconcentrations are high (i.e. in the lungs). This sigmoidal relationship allows oxygen to be quicklyand efficiently delivered from the lungs to the body.
There are several mechanisms by which this is postulated to occur. The most common one isthe Monod-Wyman-Changeux model (or MWC model) which postulates that hemoglobin’s four
10

oxygen binding sites exist in two forms, a relaxed form, and a tense form with the former bindingoxygen more tightly than the latter. What happens is that while the tense form predominates inthe absence of ligand, one receptor’s binding of ligand shifts the equilibrium of the other bindingsites towards the relaxed form, making binding a cooperative event.
Part III
Major Metabolic Pathways andBioenergetics
8 Organic Chemistry of Metabolic Biochemistry
8.1 Metal Cations
The purpose of Magnesium and Zinc and Calcium ions in most metabolic pathways is to stabilizethe buildup of negative charges (ie in kinases, metal cations interact with the negative phophategroups) or to increase the acidity (lower the pKa) of a proton (ie in alcohol dehydrogenases).
8.2 XTP
O P O
O
O
P O P
O
O
O
O
O
Adenosine
ATP
αβγ
ATP is the most commonly used, although GTP, CTP, and TTP are also used occasionally. Thesecofactors function as sources of good leaving groups which thus lower the free energy ∆G of areaction, making them sources of energy, or as sources of negatively charged phosphates. Thechemistry for reaction with an XTP molecule (although ATP is shown, all the chemistry is essentiallythe same) occurs in two ways. The first means is by attacking the α-phosphate (the one closest tothe nucleotide) to displace a pyrophosphate ion, which is a good leaving group that spontaneouslyhydrolyzes into two phosphates (hence releasing more free energy):
O P O
O
O
P O P
O
O
O
O
O
Adenosineαβγ
Nu
The second means is by attacking the γ-phosphate (the one furthest from the nucleotide) to dis-place ADP (with only two phosphates rather than one) as a leaving group, leaving the nucleophilephosphorylated:
O P O
O
O
P O P
O
O
O
O
O
AdenosineαβγNu
8.3 NAD(P)H
Nicotinamide adenine dinucleotide (NAD) is a cofactor involved in redox reactions which isderived from the vitamin niacin. It has a nicotinamide ring which can act as a hydride acceptor ordonor depending on the charge and double bond structure on the ring. When the amine nitrogenis positively charged, the cofactor is called NAD(P)+ and acts as a hydride acceptor (and hence anoxidizing agent). When the amine nitrogen is neutral, the cofactor is called NAD(P)H and acts as ahydride donor (and hence a reducing agent). The only difference between NADPH and NADH is inan extra phosphate group in the R group. The chirality of the ring (the amide substituent gives the
11

ring a handed-ness) and the fact that all enzyme reactions take place within a complicated three-dimensional structure means that enzyme-catalyzed reactions involving NAD(P)H or NAD(P)+abstract a specific proton (with exclusively pro-R or pro-S stereochemistry on the substrate) andadd it to one specific side of the nicotinamide ring.
N
R
CONH2
H
N
R
CONH2
H H
8.4 FAD
Flavin Adenine Dinucleotide (FAD) is a cofactor also involved in redox reactions which isderived from the vitamin riboflavin. It is primarily used as an oxidizer. Its specific mechanismof action depends a great deal on the substrate, as FAD can participate in hydride transfers andsingle-electron transfers/radical chemistry (ie it can be used to reduce oxygen to hydrogen peroxide).
N
R
N
N
NH
O
O N
R
NH
HN
NH
O
O
H
H A
8.5 Coenzyme A
Coenzyme A (CoA) is used to activate acyl substrates to transfer them. It effectively holdsacyl groups through the use of a a phosphopantetheine arm which ends with a thiol group which iscapable of acting as a nucleophile to attack carbonyl’s. The arm is oftentimes abbreviated “CoA”as shown below (where the two structures represent the same thing):
HS
HN
O
HN
O
OH
O P
O
O
O P
O
O
Adenosine
HSCoA
Enzymes oftentimes attack the α-phosphate (closest to the nucleotide) with a nucelophilic group(ie serine), displacing AMP as a leaving group and conjugating the phosphopantetheine arm to theenzyme. CoA helps catalyze reactions which replace substituents on carbonyl groups:
R1
O
R2
SCoAH
H+ transfer R1
O
SCoA
H R2
8.6 Biotin
Biotin, a B vitamin derivative, is employed in carboxylation reactions. Although its precise mech-anism is not well understood, it is used to hold carbon dioxide such that it can then be transferredonto another molecule.
12

HN NH
S
O
O
OH
ATP, CO2N NH
S
O
O
OH
O2C
ADP, Pi
8.7 TPP
Thiamin Diphosphate (TPP) is a cofactor involved in a number of reactions. It is derived fromthe B-vitamin thiamine and is most useful because of its ylid functional group. The positioning ofa carbon between two heteroatoms (nitrogen and sulfur) lowers the pKa of the carbon’s proton.
S
N
R
R
S
N
R
H
This enables it to act as a nucleophile. which is connected to an iminium ion which can thusfunction as an electron sink.
CO2
LG
S
N
R
R
CO2
S NR
R
S NR
R
8.8 Lipoamide
Lipoamide, a derivative of lipoic acid, has an electrophilic disulfide bridge. Upon breaking of thering, FADH2 is required to recreate the original lipoamide structure.
SS
NuR
S SH
R
NuSH SH
R
Cys S
SCys
SHS
R
H
B
FAD
Cys S
FADH2
Cys S
SS
H
R
B
SS
R
Cys S
SCys
FADH2
8.9 PLP
PLP, or pyridoxal phosphate, a cofactor derived from pyridoxine (vitamin B6) is used widelyin amino acid metabolism. Its aldehyde functionality serves as an attachment point for various
13

lysine-containing enzymes, creating a Schiff base link. PLP-mediated steps always begin by atransamination reaction in which a substrate amine group becomes covalently linked to the cofactor.
N
H
OH
PiO
O
PLP
enzyme
N
H
OH
PiO
N
Lys-Enz
NH2R
N
H
OH
PiO
N
R
As PLP possesses an electrophilic nitrogen connected to a conjugated pi system, PLP acts asan electron sink, allowing various reactions to occur adjacent to or on the amine group, sometimesgiving pyridoxamine phosphate (PMP) as a by-product (which can then be converted back to PLPby transamination with an α-keto acid, and disruption of the Schiff base linkage by hydrolysis ortransamination).
N
H
OH
PiO
N CO2
N
H
OH
PiO
NA H
N
H
OH
PiO
N
H2O
R
R R
N
H
OH
PiO
NH2
RO
PMP
8.10 Miscellaneous
There are a number of cofactors which chelate a metal ion to help mediate radical chemistry.Coenzyme B12 is a cobalt containing cofactor which helps to mediate radical rearrangement reac-tions. It mediates this by having a readily homolytically cleaved bond to a methyl-deoxyadenosinemoiety. Heme is an iron containing cofactor which helps bind oxygen species to mediate oxygena-tion/oxidation reactions.
Tetrahydrofolate (THF) and its derivative 5,10-methylenetetrahydrofolate acts as a means totransfer 1-carbon groups.
9 Lipid Metabolism
9.1 Digestion
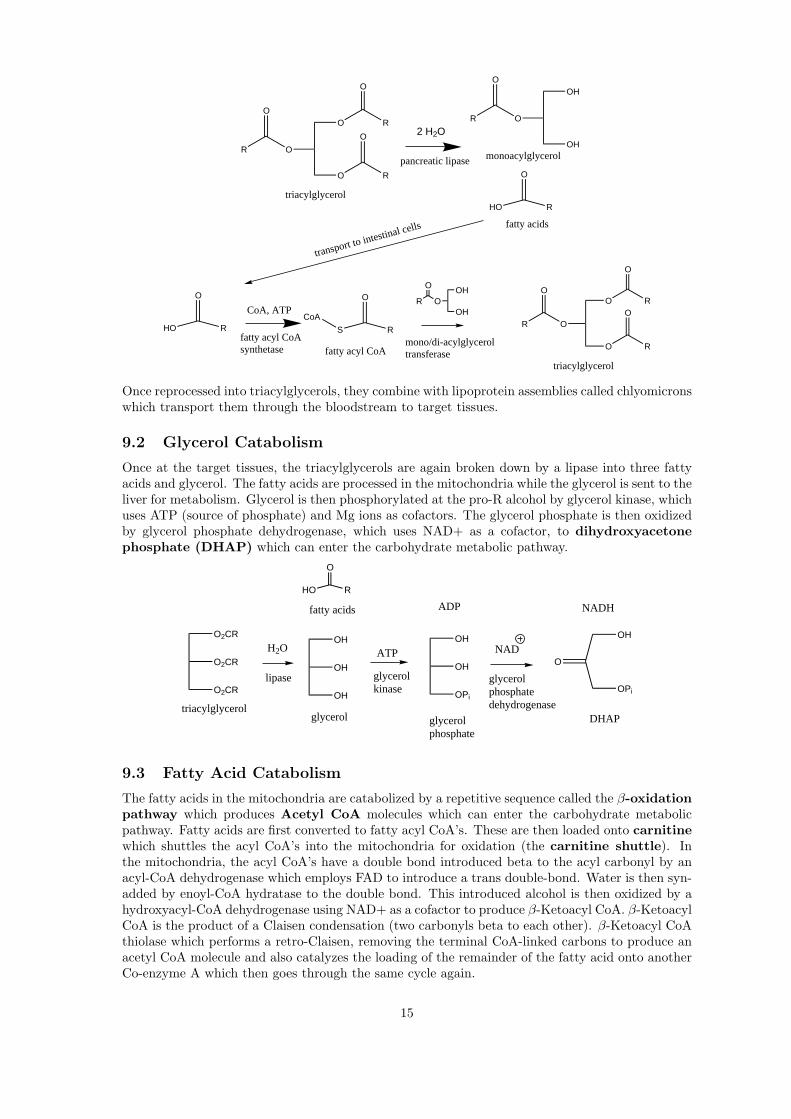
Because dietary fats are insoluble in water, they are emulsified by bile acid salts (such as tauro-cholate and glycocholate) which act as detergents. Once emulsified, they are hydrolyzed by pancre-atic lipase at the C1 and C3 positions to yield a mono-acylglycerol and two fatty acids. These arethen transported to the cells lining the intestinal wall and recombined to produce triacylglycerols.This step is catalyzed by the use of ATP and CoA. The use of ATP would make this enzyme asynthetase as opposed to a synthase.
14
R
O
O
O
O
O
R
O
R
triacylglycerol
2 H2O
pancreatic lipase
R
O
O
OH
OH
HO
O
R
monoacylglycerol
fatty acids
fatty acyl CoAsynthetase
CoA, ATP
HO
O
R
fatty acyl CoA
S
O
R
CoA
mono/di-acylglyceroltransferase
R
O
OOH
OHR
O
O
O
O
O
RO
R
triacylglycerol
transport to intestinal cells
Once reprocessed into triacylglycerols, they combine with lipoprotein assemblies called chlyomicronswhich transport them through the bloodstream to target tissues.
9.2 Glycerol Catabolism
Once at the target tissues, the triacylglycerols are again broken down by a lipase into three fattyacids and glycerol. The fatty acids are processed in the mitochondria while the glycerol is sent to theliver for metabolism. Glycerol is then phosphorylated at the pro-R alcohol by glycerol kinase, whichuses ATP (source of phosphate) and Mg ions as cofactors. The glycerol phosphate is then oxidizedby glycerol phosphate dehydrogenase, which uses NAD+ as a cofactor, to dihydroxyacetonephosphate (DHAP) which can enter the carbohydrate metabolic pathway.
OH
OPi
OHNADATP
O
OH
OPi
O2CR
O2CR
O2CR
OH
OH
OH
ADP
triacylglycerolglycerol glycerol
phosphate
NADH
DHAP
lipase
H2O
HO R
O
fatty acids
glycerolkinase
glycerolphosphatedehydrogenase
9.3 Fatty Acid Catabolism
The fatty acids in the mitochondria are catabolized by a repetitive sequence called the β-oxidationpathway which produces Acetyl CoA molecules which can enter the carbohydrate metabolicpathway. Fatty acids are first converted to fatty acyl CoA’s. These are then loaded onto carnitinewhich shuttles the acyl CoA’s into the mitochondria for oxidation (the carnitine shuttle). Inthe mitochondria, the acyl CoA’s have a double bond introduced beta to the acyl carbonyl by anacyl-CoA dehydrogenase which employs FAD to introduce a trans double-bond. Water is then syn-added by enoyl-CoA hydratase to the double bond. This introduced alcohol is then oxidized by ahydroxyacyl-CoA dehydrogenase using NAD+ as a cofactor to produce β-Ketoacyl CoA. β-KetoacylCoA is the product of a Claisen condensation (two carbonyls beta to each other). β-Ketoacyl CoAthiolase which performs a retro-Claisen, removing the terminal CoA-linked carbons to produce anacetyl CoA molecule and also catalyzes the loading of the remainder of the fatty acid onto anotherCo-enzyme A which then goes through the same cycle again.
15

O
CoA-S
R
O
CoA-S
R
OH
O
CoA-S
R
O
O
CoA-S
R
fatty acyl CoA
R
O
CoA-S
O
S-CoA
acetyl CoA
acyl CoAdehydrogenase
FAD
FADH2
enoyl CoAhydratase
H2O
β-Ketoacyl CoAdehydrogenase
NAD+
NADH
CoASH
β-Ketoacyl CoA thiolase
9.4 Fatty Acid Biosynthesis
Fatty acids typically have an even number of carbon atoms because they are synthesized from twocarbon-acetyl CoA precursors. In order for both processes to be energetically favorable, fatty acidbiosynthesis occurs in the cytoplasm and is slightly different from β-oxidation which occurs in themitochondria. Fatty acid biosynthesis employs NADPH to reduce the double bond while β-oxidationemploys FAD to introduce one. In bacteria, fatty acid biosynthesis is catalyzed by multiple enzymeswhich handle each step, while in eukaryotes, a large, multienzyme complex catalyzes all the stepsin the pathway.
The acetyl CoA molecules for fatty acid synthesis are produced in the mitochondria. Thetransport of acetyl CoA to the cytosol where fatty acid synthesis occurs is mediated by oxaloacetate(OAA). Acetyl CoA undergoes a condensation with OAA to form citrate which can then leave themitochondria. In the cytosol, an ATP-dependent citrate lyase liberates OAA and acetyl CoA.The OAA then undergoes a series of transformations to become pyruvate (where it is reduced byNADH and oxidized by NADPH, thus converting an NADH to NADPH) and then re-enters themitochondria where it is converted in another ATP-dependent step into OAA (thus moving oneequivalent of acetyl CoA requires two equivalents of ATP).
Acetyl CoA in the cytosol has two fates. The first involves carboxylation by acetyl-CoA car-boxylase which uses a bicarbonate ion, ATP, and the cofactor biotin to add a carboxylate group toacetyl CoA, producing malonyl CoA. Malonyl CoA is then loaded onto an acyl-carrier protein sidechain. This protein then “holds” the growing fatty acid chain.
CoA-S
ON-carboxybiotin
ATP + CO2
biotin
CoA-S
O
CO2
ACP-SH
S
CO2
O
ACP
CoA-SH
The second fate of acetyl CoA is to be added onto the growing fatty acid chain. The first stepis the loading of acetyl CoA onto an acyl carrier protein (ACP). This is then transferred ontoanother protein, acetyl synthase.
O
CoA-S
O
S
ACP
O
S
Synthase
CoASH
ACP-SH Synthase-SH
ACP-SH
The enzyme complex then catalyzes a Claisen condensation between the malonyl CoA and theacetyl CoA by decarboxylating the fatty acid chain on the acyl-carrier protein. The resulting ketoneis then reduced by NADPH to create an alcohol which is dehydrated to remove the hydroxyl groupand introduce a double bond. This double bond is then reduced by NADPH.
16

The resultant fatty acid chain, now longer by two carbons and conjugated to the acyl-carrierprotein is transferred onto acetyl synthase which allows it to undergo another Claisen condensationwith a newly produced malonyl CoA, thus repeating the cycle and lengthening the fatty acid chainto whatever length is desired. It should be noted that the enzyme complex here can “choose” toleave out a reduction step or a dehydration step in order to produce modified fatty acid chains (ieunsaturated fatty acid).
S-ACP
O
O2C
S-Synthase
O
R
S-ACP
O
O
R
Synthase-SH
CO2
NADPH
S-ACP
O
HO
R
NADP+
S-ACP
O
R
H2O
NADPH
S-ACP
O
R
Synthase-SH
9.5 Terpenoid Biosynthesis
Many of the non-glycerol lipids are terpenoids, carbon structures built from isoprene units,5-carbon structures which can be combined head-to-tail. Isopentenyl diphosphate is the functionalform of the isoprene unit consisting of a double bond at the head and a diphosphate group towardsthe tail which allows for conjugation.
isoprene
O P O
O
O
P
O
O
O
isopentenyl diphosphate
Isopentenyl diphosphate is synthesized primarily by the mevalonate pathway. Two moleculesof acetyl CoA undergo a Claisen condensation catalyzed by acetoacetyl CoA acetyltransferase toform acetoacetyl CoA. This is then loaded onto an enzyme (displacing the CoA linkage) and thenundergoes an aldol condensation with another molecule of acetyl CoA catalyzed by a glutaryl-CoAsynthase. The enzyme linkage is then hydrolyzed and the resulting 3-hydroxy-3-methylglutarylCoA is then reduced with two equivalents of NADPH to remove the final CoA linkage to yieldmevalonate.
mevalonate
O
S-CoA
O
S-CoA
acetoacetyl CoAacetyltransferase
CoA-S
O O
glutaryl CoAsynthaseO
S-CoA
CoA-S
O OH
S-CoA
O
H2O
O
O OH
S-CoA
O
glutaryl CoAreductase
2 NADPH
O
O OH
OH
Mevalonate is then converted into isopentenyl diphosphate (IPP). Three equivalents of ATPare employed to doubly phosphorylate the tail and to singly phosphorylate the middle alcohol.Decarboxylation then produces the double bond, displacing one of the phosphates.
17

mevalonate
O
O
OH
HO
3 ATP
mevalonatekinase
O
O
OPi
PiPiO
OPiPi
isopentenyl diphosphate
CO2, Pi
To couple multiple isoprene units, an isomerization reaction takes place converting IPP intodimethylallyl diphosphate (DMAPP) as catalyzed by IPP isomerase, requiring magnesiumand zinc cations as cofactors. DMAPP then couples with IPP to give geranyl diphosphate whichcan then be combined with another molecule of IPP to form farnesyl diphosphate. Dimerization offarnesyl diphosphate yields squalene which is the precursor to a number of steroid molecules.
OPiPi
IPP
OPiPi
DMAPP
IPP + DMAPPOPiPi
geranyl diphosphate (GPP)GPP + IPP OPiPi
farnesyl diphosphate (FPP)
FPP + FPP
squaleneHO
lanosterol
10 Carbohydrate Metabolism
10.1 Structure
Carbohydrates exist in multiple forms. Glucose, for instance, exists in an α-form, a β-form (withα and β forms differing in the positioning of the hydroxyl group at position 1, α being axial and βbeing equatorial), and in the polyhydroxyaldehyde form with the last form being the most rare.
OHO
HO
OHOH
HOH2C
OH
HO
OH
OH
OH
O
OHO
HO
OH
OH
HOH2C
α-Glucopyranose (37%)β-Glucopyranose (63%)
0.002%
10.2 Digestion
Starches and other polysaccharides are linked between individual carbohydrate monomers by gly-cosidic linkages. Glucose polymers are typically linked by α-1-4’ linkages (between the 1 positionof an α form and the 4 position of the next) and α-1-6’ linkage between the 1 position of an α formand the 6 position of the next.
18

OHO
HO
OHO
OH2C
O
OHO
HO
HOH2C
OH
HO
HOH2C
OHOH
1-6' linkage
1-4' linkage
A salivary enzyme called amylase hydrolyzes the 1-4’ linkages. Processing in the intestine withglycosidases yields glucose which enters the bloodstream.
10.3 Glycolysis
Glycolysis, also called the Embden-Meyerhoff Pathway is the process by which glucose iscatabolized into pyruvate. The hormone insulin stimulates it, while the opposing hormoneglucagon inhibits it. It is turned on in muscle cells but turned off in the liver by epinepherine.This is most likely due to regulation of phosphofructokinase.
First, glucose is phosphorylated by hexokinase. The resultant glucose-6-phosphate then un-dergoes a number of keto-enol tautomerizations catalyzed by glucose-6-phosphate isomerase togive α-fructose-6-phosphate. This is in turn phosphorylated and isomerized to give β-fructose-1,6-bisphosphate. This ring sugar is then opened and cleaved with a retro-aldol reaction into glyc-eraldehyde 3-phosphate (GAP) and dihydroxyacetone phosphate (DHAP). The enzymemakes a Schiff base linkage with the substrate in order to increase the carbonyl’s electrophilicity.GAP and DHAP rapidly interconvert via triose phosphate isomerase (TIM). GAP is thenoxidized and phosphorylated by GAP dehydrogenase to 1,3-bisphosphoglycerate. This is readilydephosphorylated by phosphoglycerate kinase, leaving behind 3-phosphoglycerate. This is thenisomerized by phosphoglycerate mutase to 2-phosphoglycerate. A dehydration step catalyzed by anenolase creates phosphoenolpyruvate (PEP) which is dephosphorylated and tautomerized fromenolpyruvate to pyruvate by pyruvate kinase.
O
PiO
OH
OH
OH
OH
O
PiO
OH
OHOH
OPi
ATPO
OH
OPi
OHO
HO
OH
OPi
OH
ATPOHO
HO
OH
OH
OH
OH
O
OPi
DHAP
TIM
OH
OPi
O
OOPi
O
OH2O
ADP
CO2
O
ATP
NADH
OPi
OH
O
OPi
OPi
OH
O
O
ADP
ATP
hexokinase phospho-glucose isomerase
α-fructose-6-phosphateglucose
phospho-fructokinase
β-fructose-1,6-bisphosphate
aldolase
GAPNAD+, Pi
glyceraldehydedehydrogenase
1,3-Bisphosphoglycerate
phosphoglyceratekinase
3-phosphoglycerate
phosphoglyceratemutase
2-phosphoglycerate
enolase
Phosphoenolpyruvate (PEP)
pyruvate kinase
pyruvate
19

It should be noted here that glycolysis takes one molecule of glucose, consumes two moleculesof ATP (to phosphorylate the glucose molecule), and produces two molecules of NADH and fourmolecules of ATP (two per pyruvate) and two molecules of pyruvate.
10.4 Transformations of Pyruvate
Pyruvate can have three fates.In yeast under anaerobic conditions, pyruvate is converted to ethanol and carbon dioxide. The
process is a Thiamin diphosphate-dependent process catalyzed by pyruvate decarboxylase wherebypyruvate is decarboxylated and converted into acetaldehyde. Acetaldehyde is then reduced by analcohol dehydrogenase into ethanol, thus recycling NADH back into NAD+ and allowing glycolysisto continue.
O
O
OHpyruvate
NADH
alcohol dehydrogenase
OH
NAD+
TPP
pyruvate decarboxylase
O
CO2
acetaldehyde ethanol
The second fate is to lactic acid which is produced under anaerobic conditions (ie during muscleactivity), again the purpose of which is to regenerate NAD+ for glycolysis. This is carried out bylactate dehydrogenase which uses NADH to reduce pyruvate into lactate.
O
O
OHpyruvate
NADH
pyruvate dehydrogenase
OH
O
OHlactate
NAD+
Under normal situations, pyruvate is converted to acetyl CoA by a three-enzyme-complex calledthe pyruvate dehydrogenase complex. The first step is the TPP-dependent decarboxylationof pyruvate and conversion into HETPP. The TPP ylid is then removed in a lipoamide dependentfashion. The lipoamide is finally replaced by coenzyme A (producing acetyl CoA) and the dihy-drolipoamide is oxidized by FAD back into lipoamide (and hence producing FADH2 which is thenused to reduce NAD+ to NADH).
O
O
OH HOS
N
R
RHO
S
N
R
R
S SH
R
O
S
SH
RO
S-CoA
HS
SH
RS
S
R
pyruvate
TPP
CO2
HETPP
lipoamide
CoASH
Acetyl CoA
dihydrolipoamide
FAD
FADH2
lipoamide
20

This conversion takes one molecule of pyruvate and converts it to one molecule of acetyl CoA,one molecule of carbon dioxide, and in the process reduces one equivalent of NAD+ to NADH anduses one molecule of Coenzyme A.
10.5 Citric Acid Cycle
Also called the Krebs cycle and the tricarboxylic acid (TCA) cycle, the Citric Acid cycle aerobicallycombines acetyl CoA with oxaloacetate and in a sequence of reactions produces two molecules ofcarbon dioxide and a number of reduced coenzymes (NADH and FADH2).
SCoA
O
1 CoASH, 2 CO2, 3 NADH, 1 FADH2, 1 GTP, 2 H+
The first step is a citrate synthase-catalyzed aldol condensation between acetyl CoA and oxaloac-etate (OAA), producing citryl CoA which is hydrolyzed to citrate. Aconitase then catalyzes anisomerization, moving the hydroxyl group from the 2 position to the 3 position in a stereospe-cific manner, producing isocitrate. Isocitrate is then oxidized by isocitrate dehydrogenase to giveoxalosuccinate which undergoes decarboxylation to become α-ketoglutarate. α-ketoglutarate thenundergoes another round of decarboxylation to yield succinyl CoA, a process which also requiresTPP and lipoamide and Coenzyme A. Succinyl CoA is converted to succinate by a nucleophilic acylsubstitution with a phosphate ion as a nucleophile and then removal of the phosphate to produceGTP and succinate. The succinate is dehydrogenated by succinate dehydrogenase using FAD asa cofactor and producing fumarate which is then hydrolyzed by the enzyme fumarase into malate.Finally, malate is oxidized by malate dehydrogenase to regenerate OAA and re-initiate the cycle.
SCoA
O
O2C
CO2
acetyl CoA
O
oxaloacetate
O2C
HO CO2
citratecitrate synthase
CO2 O2C
CO2
CO2
OH
isocitrate
aconitase
isocitratedehydrogenaseNAD+
O2C
O
CO2
α-ketoglutarateCO2
NADH
TPPlipoamideCoA, NAD+
S CO2
O
CoA
succinyl CoA
Pi, GDP
CO2NADH
succinyl CoAsynthetase
O
CO2
O
succinate
succinatedehydrogenase
FAD
O2C
CO2fumarate
FADH2
H2O, H+ fumarase
OH
CO2
O2Cmalate
NAD+ malate dehydrogenase
NADH
10.6 Oxidative Phosphorylation
The bulk of the energy output from glucose catabolism comes from oxidative phosphorylation inthe mitochondria, specifically the reduction of oxygen gas to water. The electrons to reduce oxygencome from the hydride carriers NADH and FADH2. In a series of redox reactions, the electrons are“passed” in the electron transport chain by a sequence of carriers culminating at the end with the
21

reduction of oxygen to water. The energy released by each transfer is used to transport proton’s fromthe inside compartment (the matrix) to the intermembrane space. This concentration gradientpowers the F0F1 ATPase which converts the energy of protons moving down their concentrationgradient into the synthesis of ATP in a process called oxidative phosphorylation (the oxidationof NADH and FADH2 coupled to the phosphorylation of ADP to ATP). Generally, one molecule ofNADH supplies sufficient energy to produce three equivalents of ATP, and one molecule of FADH2
supplies sufficient energy to produce two equivalents of ATP.It should be noted here that the NADH produced in glycolysis was primarily produced in the
cytoplasm and hence needs to be trafficked into the mitochondria. There are two paths involved:
1. The α-glycerol phosphate shuttle operates by using NADH in the cytoplasm to reduceDHAP to α-glycerol phosphate which is then transported into the mitochondria whereby itis oxidized back to DHAP, and reduces FAD to FADH2. DHAP is then exported back tothe cytoplasm. Note, that in this shuttle, NADH is converted to FADH2 which adds a bit ofuncertainty to the final ATP output.
2. The malate-aspartate shuttle is used in muscle, heart, and brain tissues. NADH is usedto reduce oxaloacetate to malate which is then transported into the mitochondria where it isre-oxidized to form oxaloacetate and to regenerate NADH. Oxaloacetate is then converted toaspartate which is then exported back to the cytoplasm where it is re-converted to oxaloacetateto re-initiate the cycle.
10.7 Glucose Catabolism: In Summary
1. Glycolysis converts one molecule of glucose into two molecules of pyruvate. In the process, itconsumes two molecules of ATP and produces four molecules of ATP and two molecules ofNADH, thus giving a net production of 2 ATP + 2 NADH
2. Pyruvate is converted to acetyl CoA in a process which produces one equivalent of carbondioxide and one equivalent of NADH, thus considering one molecule of glucose as the startingpoint, the net production is 2 CO2 + 2 NADH
3. Every cycle of the Kreb’s cycle converts Acetyl-CoA into two molecules of carbon dioxide,three equivalents of NADH, one equivalent of FADH2, and one equivalent of GTP (which canbe used to produce ATP). Thus, giving a net production of 2 ATP + 4 CO2 + 6 NADH+ 2 FADH2
4. The electron transport chain produces approximately 2 ATP for every FADH2 and 3 ATPfor every NADH. As there are a total of 10 NADH molecules and 2 FADH2 molecules, themaximum energy output of the electron transport chain is 34 ATP
The maximum total, then, would be approximately 38 ATP, although because the electrontransport chain is used to transport things other than protons and because of the two differenttypes of NADH shuttles, the number can vary.
10.8 Poisons Which Affect Glucose Metabolism
A number of poisons affect steps in glucose metabolism. Arsenate (HAsO2−4 ), which is an analogue
of phosphate, impacts glycolysis. It impacts the step catalyzed by GAP dehydrogenase in wherethe arsenate ion is incorporated by the enzyme rather than a phosphate ion. While glycolysis canstill continue, the instability of the arsenate ester causes it to be readily hydrolyzed, producing3-phosphoglycerate without generating ATP, thus eliminating the net ATP gain of glycolysis.
Other poisons are called uncouplers as they uncouple the connection between ATP synthesisand electron transport chain function. Dinitrophenol (DNP) and valinomycin are classic ex-amples of this – they effectively punch holes in the mitochondrial membrane, allowing protons todiffuse down their electrochemical gradient, and decoupling it from ATP synthesis.
Cyanide and rotenone and antimycin inhibit specific components of the electron transport chainand hence prevent ATP synthesis in that fashion. Atractyloside and bongkrekate block the entry ofADP into the mitochondria and block the export of ATP, thus preventing oxidative phosphorylationfrom continuing once all the ADP has been phosphorylated.
22

10.9 Gluconeogenesis
Glucose can be biosynthesized from pyruvate in an 11-step pathway called gluconeogenesis. Aswith fatty acid anabolism and catabolism, gluconeogenesis and the breakdown of glucose are notthe exact reverse.
The first step is a biotin-mediated and ATP-dependent carboxylation of pyruvate catalyzedby pyruvate carboxylase to yield OAA. OAA is then decarboxylated and converted into PEP byphosphoenolpyruvate carboxykinase which transfers a phosphate from GTP (converting it to GDP)to the molecule. This may seem redundant (attaching a carboxyl and then removing it) but it is notas the attachment of the carboxyl is coupled to the hydrolysis of a molecule of ATP, thus releasingenergy, making the subsequent reaction of OAA with GTP more favorable.
O
CO2
pyruvate
N-carboxybiotin
ATP + CO2
biotin O
CO2
OAA
O2C GTPpyruvatecarboxylase PEP carboxykinase
O
CO2
Pi
CO2 GDP
PEP
Water is then added across the double-bond of phosphoenolpyruvate to give 2-phosphoglyceratewhich is then isomerized to 3-phosphoglycerate, which are essentially exact reverses of the dehydra-tion and isomerization reactions in glycolysis. 3-phosphoglycerate is phosphorylated, consuming amolecule of ATP, at the 1-position. Glyceraldehyde 3-phosphate dehydrogenase then reduces themolecule to GAP with NADH and displaces the phosphate group. As before, the enzyme TIMcatalyzes the reversible conversion of GAP to DHAP. A molecule of GAP and a molecule of DHAPthen undergo an aldol condensation (as opposed to the retro-aldol reaction in glycolysis) to givefructose 1,6-biphosphate.
The 1-phosphate is then hydrolyzed to give fructose 6-phosphate. Recall that in glycolysis, amolecule of ATP was consumed to ADP in order to phosphorylate the 1 position. This is notthe case here as the production of ATP from ADP is not energetically favorable (the reverse of afavorable reaction cannot also be favorable). Fructose 6-phosphate is then converted to glucose 6-phosphate by the same series of keto-enol tautomerizations, but in reverse, which converted glucose6-phosphate to fructose 6-phosphate in glycolysis. The final step is another hydrolysis reaction tohydrolyze the phosphate and produce glucose (rather than pushing the phosphate onto ADP tomake ATP which is, as mentioned above, energetically unfavorable).
OPi
PEP
O2Cenolase
H2OOPi
O2COH
2-phosphoglycerate
phosphoglyceratemutase
OH
O2COPi
3-phosphoglycerate
ATPphosphoglyceratekinase
OPi
OH
O
OPi
1,3-Bisphosphoglycerate
NADH
glyceraldehydedehydrogenase
OPi
OH
O
GAP
OPi
O
OH
DHAP
aldolase
fructose1,6-bisphosphate
H2O
O
PiO
OH
OHOH
OPi
TIM
O
PiO
OH
OH
OH
OH
α-fructose-6-phosphate
OHO
HO
OH
OPi
OH
phospho-glucose isomerase
glucose 6-phosphate
OHO
HO
OH
OH
OHglucose
H2O
23

It should be noted that all the steps of gluconeogenesis are essentially the reverse of those usedin glycolysis EXCEPT for:
1. The conversion of PEP to pyruvate in glycolysis is mediated by ATP hydrolysis, while theconversion of pyruvate to PEP in gluconeogenesis occurs through an OAA intermediate andrequires a biotin-dependent-carboxylation, the hydrolysis of ATP, a decarboxylation, and thephosphorylation of OAA by GTP.
2. In glycolysis, fructose 6-phosphate is converted to fructose 1,6-bisphosphate by ATP hydroly-sis. In gluconeogenesis, the reverse step is done simply by a phosphatase-mediated hydrolysisof the phosphate linkage, rather than the production of ATP.
3. In glycolysis, glucose 6-phosphate is converted to fructose 6-phosphate by ATP hydrolysis. Ingluconeogenesis, the reverse step is done simply by a phosphatase-mediated hydrolysis of thephosphate linkage, rather than the production of ATP.
Energetically, forming one molecule of glucose from two molecules of pyruvate requires 4 mole-cules of ATP, 2 molecules of GTP, and 2 molecules of NADH.
10.10 Pentose Phosphate Pathway
The pentose phosphate pathway is an alternative means of processing glucose. It is used tometabolize 5-carbon sugars, produces NADPH, and produces ribose 5-phosphate which is neededfor nucleotide biosynthesis.
Glucose 6-phosphate is first oxidized by NADP+ as catalyzed by glucose 6-phosphate de-hydrogenase to produce 6-phospho-gluconolactone and NADPH. This is then hydrolyzed to 6-phosphogluconate which undergoes another oxidation at the 3-position. This β-ketoester is thendecarboxylated to give ribulose 5-phosphate, a two-step process which is catalyzed by one en-zyme, phosphogluconate dehydrogenase, which creates another molecule of NADPH. Ribulose 5-phosphate is isomerized by a series of keto-enol tautomerizations catalyzed by ribulose 5-phosphateisomerase to produce ribose 5-phosphate. Simultaneously, ribulose 5-phosphate epimerase altersthe stereochemistry at one carbon of ribulose 5-phosphate to yield xylulose 5-phosphate (epimersare diastereomers that differ at only one chirality center, and an epimerase thus converts betweenepimers). The relative rates of reactions typically give a two-fold excess of xylulose 5-phosphate.When ribose 5-phosphate is needed (for ribonucleotide synthesis), the epimerase can simply catalyzethe reverse reaction, enabling more ribose 5-phosphate to be produced.
OHO
HO OH
OH
OPiO
HOHO
OH
OPi
O
NADP+glucose6-phosphatedehydrogenase
NADPH
H2OO2C
OH
OH
OH
OH
OPi
glucose 6-phosphate 6-phospho-gluconolactone 6-phosphogluconate
phosphogluconatedehydrogenase NADP+
OH
O
OH
OH
OPi
ribulose 5-phosphate
OH
O
OH
OH
OPi
O
OH
OH
OH
OPi
xylulose 5-phosphate
ribose 5-phosphate
NADPH
2
CO2
24

If ribonucleotide biosynthesis is not occurring, then the pentose phosphate pathway continues.One equivalent of xylulose 5-phosphate then reacts with ribose 5-phosphate in a TPP-dependentreaction catalyzed by transketolase which transfers two carbons from xylulose 5-phosphate to theribose 5-phosphate, producing GAP and sedoheptulose 7-phosphate (transfers two carbons fromthe ketose [xylulose] to the aldose [ribose]). This is then followed by a transaldolase reactionwhich reacts sedoheptulose 7-phosphate with GAP, moving three carbons from the sedoheptulose(the ketose) to GAP (aldose). Note how despite the names, they both transfer carbons to thealdose sugar. This step creates fructose 6-phosphate (which can undergo glycolysis) and erythrose4-phosphate (which is metabolized by some organisms).
OH
O
OH
OH
OPi
O
OH
OH
OH
OPi
xylulose 5-phosphate
ribose 5-phosphate
transketolase
TPP
O
OH
OPi
GAP
OH
OH
OH
OH
OPi
O
OH
sedoheptulose
transaldolase
O
OH OH
OH
OH
OPi
fructose 6-phosphate
O
OH
OH
OPi
erythrose 4-phosphate
Erythrose 4-phosphate can also react with xylulose 5-phosphate (the extra equivalent that didnot react with ribose 5-phosphate). This is catalyzed by a TPP-dependent transketolase whichtransfers a two-carbon unit from xylulose 5-phosphate to erythrose 4-phosphate to give GAP anda second molecule of fructose 6-phosphate.
O
OH
OH
OPi
erythrose 4-phosphate
OH
O
OH
OH
OPi
xylulose 5-phosphate
TPP
transketolase
O
OH OH
OH
OH
OPi
fructose 6-phosphate
O
OH
OPi
GAP
10.11 Photosynthesis Light Reactions
The light reactions are so called because of their dependence on sunlight. The sun mediates aprocess whereby chlorophyll captures solar energy and employs it to split one equivalent of waterinto two equivalents of protons, half an equivalent of oxygen gas, and 4 equivalents of high-energyelectrons. These electrons are funnelled through an electron transport chain which are used toreduce NADPH and power another electrochemical gradient by pumping protons into the interiorof the thylakoid discs, driving the production of ATP upon the diffusion of the protons down theirgradient. Some of these electrons do not reduced NADP+ and undergo cyclic phosphorylationwhere they repeatedly pass through the electron transport chain, constantly pumping protons. Theproduced ATP and NADPH are then used in the light-independent “dark reactions”.
10.12 Reductive Pentose Phosphate Cycle
Also called the Calvin Cycle, or the reductive pentose phosphate (RPP) cycle, these arethe “dark reactions” of photosynthesis which employ the NADPH produced in the light reactions
25

to reduce carbon dioxide to give carbohydrates. The process has three stages:
1. Fixation which reacts three molecules of carbon dioxide with 3 molecules of ribulose 1,5-bisphosphate to give 6 molecules of 3-phosphoglycerate
2. Reduction which reduces the 6 molecules of 3-phosphoglycerate to 6 molecules of GAP
3. Regeneration which takes 5 of the GAP molecules and regenerates 3 molecules of ribulose1,5-bisphosphate. The last molecule of GAP enters the gluconeogenesis pathway to becomeglucose
O
OPi OH
OH
OPi
ribulose 1,5-bisphosphate
3 CO2fixing
CO2
OH
OPi
3-phosphoglycerate
6
3
ATP, NADPH
reduction
O
OH
OPi
GAP
6
regenerationhexose synthesis
ADP NADP+
The RPP cycle is initiated by the carobxylation of ribulose 1,5-bisphosphate to give two mole-cules of 3-phosphoglycerate as catalyzed by the enzyme rubisco. The mechanism of the catalysisoccurs via the production of a cis enediolate which is stabilized by a magnesium ion. This enedi-olate is able to attack carbon dioxide and hydrolysis at the carbonyl of the resulting β-keto acidgenerates two molecules of 3-phosphoglycerate, thus completing the fixation stage. Rubisco, itshould be noted, oftentimes nonproductively fixes oxygen as well as carbon dioxide. Plants thathave a danger of operating in low-carbon dioxide environments have adapted to this problem thatun-adapted C3 plants do not deal with. These C4 plants form OAA (a four carbon compound)by combining carbon dioxide with PEP in cells specifically designed to collect carbon dioxide. OAAis then converted into malic acid and shunted to cells which engage in the Calvin Cycle where theacid is broken down back into PEP and carbon dioxide. These cells are removed from high oxygenlevels and hence avoid the problem of rubisco catalyzing the wrong reaction. CAM plants, ratherthan spatially separating the site of carbon dioxide gathering and fixing, temporally separate thetwo.
3-phosphoglycerate is then phosphorylated at the carboxyl location by a molecule of ATP togenerate 1,3-bisphosphoglycerate. This is then reduced to an aldehyde by NADPH at the site of car-boxylation, also displacing an equivalent of inorganic phosphate to generate GAP, thus completingthe reduction stage.
O
OPi OH
OH
OPi
ribulose 1,5-bisphosphate
Rubisco
CO2 O2C
OH
OPi
2
3-phosphoglycerate
ATP
OH
OPiO
PiO
1,3-bisphosphoglycerate
NADPH
OH
OPiO
GAP
While one molecule of GAP enters gluconeogenesis, the remainder enter the regeneration stage.Two equivalents of GAP are isomerized to DHAP by the enzyme TIM. One DHAP molecule thenundergoes an aldol condensation with another GAP molecule, producing fructose 1,6-bisphosphatewhich is hydrolyzed to fructose 6-phosphate. Fructose 6-phosphate then reacts with a molecule ofGAP to give xylulose 5-phosphate and erythrose 4-phosphate as catalyzed by transketolase.
26

Erythrose 4-phosphate itself undergoes an aldol condensation with the second equivalent ofDHAP to give sedoheptulose 1,7-bisphosphate. This is then hydrolyzed to sedoheptulose 7-phosphatewhich undergoes a reaction with another molecule of GAP which is catalyzed by a transketolase togive xylulose 5-phosphate and ribose 5-phosphate.
OH
OPiO
GAP
TIM
O
OPiOH
DHAP
O
OPi OH
OH
OH
OPi
fructose 1,6-bisphosphate
H2O
O
OH OH
OH
OH
OPi
fructose 6-phosphate
OH
OPiO
GAPOH
O
OH
OH
OPi
xylulose 5-phosphate
O
OH
OH
OPi
erythrose 4-phosphate
+
OPi
O
OH
OH
OH
OH
OPi
Sedoheptulose 1,7-bisphosphate
H2O
OH
O
OH
OH
OH
OH
OPi
Sedoheptulose 7-phosphate
OH
O
OH
OH
OPi
xylulose 5-phosphate
O
OH
OH
OH
OPi
ribose 5-phosphate
+OH
OPiO
GAP
At this point, all 5 molecules of GAP have been used and have been utilized to produce 2 equiva-lents of xylulose 5-phosphate and 1 equivalent of ribose 5-phosphate. The xylulose 5-phosphates andthe ribose 5-phosphate are all isomerized to ribulose 5-phosphate. These are then phosphorylatedwith ATP to give ribulose 1,5-bisphosphate to complete regeneration.
OH
O
OH
OH
OPi
xylulose 5-phosphate
O
OH
OH
OH
OPi
ribose 5-phosphate
23
OH
O
OH
OH
OPi
ribulose 5-phosphate
3 ATP 3
OPi
O
OH
OH
OPi
ribulose 1,5-bisphosphate
11 Amino Acid Metabolism
11.1 Urea Cycle
The first stage in most amino acid catabolism is deamination. This is handled by the cofactorPLP which mediates a transamination between the amino acid and α-ketoglutarate to produce the
27

de-aminated amino acid and glutamate. This PLP-reaction is handled by deprotonation of the αproton upon transamination, and concludes by the formation of PMP upon hydrolysis. PMP thenaminates α-ketoglutarate to glutamate, regenerating PLP.
HO2C NH2
R
PLP-Enz
NH
OH
PiO
N
R H
CO2H
B
NH
OH
PiO
NCO2H
R
A H
H2O
R CO2H
O
NH
OH
PiO
NH2
alpha ketoacid
PMP
HO2C
O
CO2H
NH
OH
PiO
NCO2H
R
HB
NH
OH
PiO
NCO2H
R
AH
NH
OH
PiO
N
Lys-EnzEnzyme
HO2C CO2H
NH2
glutamate
Glutamate is then oxidatively deaminated to generate an imine (with the alpha proton removed).This imine is then hydrolyzed back to α-ketoglutarate and ammonia.
CO2H
NH2
HB
H
NAD+
O2C CO2
NH2
O2C
H2O
O2C CO2
O
alpha-ketoglutarate
NH3NADH
This ammonia enters the urea cycle where it is converted to urea. The first step is the conver-sion of ammonia to carbamoyl phosphate requiring two molecules of ATP and one of bicarbonate.This then undergoes the four-step transformation whereby it combines with ornithine to producecitrulline. Citrulline then undergoes an ATP-coupled condensation with aspartate to give arginosuc-cinate. Arginosuccinate then decomposes into arginine and fumarate. Arginine is then hydrolyzedto produce urea and regenerate ornithine, thus completing the cycle:
28

PiO NH2
O
carbamoyl phosphate
HO2C
NH2
NH2
ornithine
NH
NH2
O
HO2C
NH2
citrulline
ATP
H2N
CO2H
CO2H
aspartate
NH
NH
HN
HO2C
NH2
HO2C
HO2C
arginosuccinateNH
NH2
NH
HO2C
NH2 arginine
H2OHO2C
NH2
NH2
ornithine
H2N
O
NH2
urea
11.2 Amino Acid Side Chain Catabolism
Each amino acid has a specific degradation path. Many of them converge (ie glutamine being con-verted to glutamate and thus shares glutamate’s catabolic pathway). These degradation paths allowone to characterize amino acids as glucogenic or ketogenic, as they are all ultimately degradedinto components which can enter the gluconeogenesis pathway or the fatty acid biosynthetic path-way. Some can be both. Tryptophan, for instance, is both, as it produces acetyl CoA (which entersfatty acid biosynthesis) and pyruvate (which enters gluconeogenesis). Catabolism of all amino acidsis completed by entry of each product into the Citric Acid Cycle.
11.3 Amino Acid Biosynthesis
Humans are only able to synthesize the 11 non-essential amino acids. The other 9 are essentialamino acids which must be obtained from the diet.
7 of the non-essential amino acids are biosynthesized from pyruvate or other citric acid cycleintermediates via PLP-dependent aminations (and subsequent transformations in some cases). 3of them are synthesized from the oxidation of 3-phosphoglycerate, amination by glutamate, andhydrolysis (and subsequent transformations).
R CO2H
O
R-NH2
PLPR CO2H
NH2
alanine, aspartate, glutamate
arginine, proline
amidation
asparagine, glutaminepyruvate, oxaloacetate, alpha-ketoglutarate
OPi
OH
CO2H
1. NAD+2. Glutamate, PLP3. H2O
3-phosphoglycerate
OH
NH2
CO2H
serine
cysteine
glycine
29

12 Nucleotide Metabolism
12.1 Nucleotide Catabolism
Dietary nucleic acids are hydrolyzed to the individual nucleotides and some are transported to beused for nucleotide/DNA/RNA synthesis while the rest are catabolized.
The pyrimidines are metabolized in similar ways. Cytidine is converted to uridine before process-ing. Uridine and thymidine undergo phosphorolysis to cleave the base from the sugar. The freebase is then reduced by a coupled NADPH/FADH2 system and then metabolized to malonyl CoAor succinyl CoA.
N
N
O
Sugar
NH2
O
H2O
cytidine
HN
N
O
Sugar
O
O
uridine/thymidine
Pi
phosphorolysis
HN
NH
O
O
Sugar-OH
Me
HN
NH
O
O
malonyl CoA (U) orsuccinyl CoA (T)
carbohydrate metabolism
The purines are metabolized by conversion to free xanthine which is then oxidized to uricacid. Adenosine is converted to inosine which is then phosphorolytically cleaved to produce freehypoxanthine (which is then oxidized to produce xanthine). Guanosine is phosphorolytically cleavedand then de-aminated to xanthine.
N
N
N
N
NH2
Sugar adenosine
N
N
N
NH
O
Sugarinosine
1. Pi (phosphorolysis)2. oxidation
NH
N
NH
NH
O
O
xanthine
oxidationNH
HN
NH
NH
O
O
O
uric acid
N
N
N
NH
O
Sugar
NH2
guanosine
1. Pi (phosphorolysis)2. H2O
12.2 Nucleotide Biosynthesis
Uridine is produced from the condensation of carbamoyl phosphate and aspartate. This carbamoylphosphate is then cyclized, reduced, coupled to the appropriate sugar, and then decarboxylated.Cytidine is then made from this by an amination (the opposite of the de-amination step in cytidinecatabolism).
Thymidine is produced by the methylation of uridine, a process catalyzed by thymidylatesynthase, an enzyme which is inhibited by the anti-cancer agent 5-FU. Thymidylate synthase uses5,10-methylene-tetrahydrofolate as the methyl donor and forms a substrate-enzyme covalent linkagewhich activates the correct position of uridine to pick up the methyl group.
30

H2N OPi
O
H2N
CO2H
CO2H
carbamoyl phosphate
aspartate
HO2C
NH
H2N
O
CO2H
carbamoyl aspartate
1. -H2O2. reduction3. sugar4. -CO2
HN
N
O
O
Sugar
uridine
ATP, NH3
N
N
NH2
O
Sugar
ADP, Pi
cytidine
5,10-methylene-tetrahydrofolate
thymidylate synthase
HN
N
O
O
Sugar
thymidine
Unlike the pyrimidine biosynthesis which couples sugar to a completed base, purine biosynthesisassembles the base on the ribose sugar, producing inosine monophosphate which is the precursorto guanosine and adenosine. The process of inosine formation involves attaching an amine groupto the 1’ position of the sugar. This group then attacks an activated glycine residue, creating thebackbone of the five-membered ring component of inosine. Aspartate and a formaldehyde group(donated by 10-formyl-tetrahydrofolate) then form the backbone of the six-membered ring part ofinosine.
Inosine is then converted to adenosine by GTP-coupled condensation with aspartate to formadenylosuccinate and then loss of fumarate to give the final nucleotide. Inosine is converted toguanosine by an NAD+ oxidation and the ATP-coupled amination of the newly formed ketone.
O
HO OH
PiOH2C
OPiPi
O
HO OH
PiOH2C NH2HO2C NH2
glycine
ATP
O
HO OH
PiOH2C HNO
H2N
5-phosphoribosylalpha-diphosphate (PRPP) glycinamide ribonucleotide
Sugar
N
N
NH2
CO2H
carboxyaminoimidazoleribonucleotide
2. -fumarate3. 10-formyl-THF4. -H2O
H2N CO2H
CO2H
1.
aspartate
N
N
N
NH
O
Sugar
Inosine
H2N CO2H
CO2H
aspartate
GTPN
N
N
N
HN
Sugar
CO2H
HO2C
adenylosuccinate
-fumarate
N
N
N
N
NH2
Sugaradenosine
NAD+, H2O
N
N
NH
NH
O
Sugar
O
xanthosine
glutamine
ATPN
N
N
NH
O
Sugar
NH2
guanine
31

13 Integration of Energy Metabolism
13.1 Universals
All metabolic pathways are regulated to serve a basic purpose: to supply a ready amount of energyto all cells. This energy is ultimately in the form of ATP. Indirectly, this ATP comes from glucosewhich is necessary, first because glycolysis and the citric acid cycle are the dominant sources ofenergy, and secondly because pyruvate, the by-product of glycolysis, can undergo anapleroticreactions to form OAA and Malate which are needed to keep the citric acid cycle running. Fat,protein, and glycogen act as sources/supplies of energy.
13.2 Hormonal Regulation
Three hormones are the master regulators of metabolism: insulin, glucagon, and epinepherine.Insulin is produced in response to high levels of glucose, and induces cells to take up glucose fromthe bloodstream and store excess energy as fat, glycogen, and protein. It activates a ReceptorTyrosine Kinase system. Glucagon responds to and exerts the exact opposite effects. It activatesa G-Protein Coupled Receptor system. Epinepherine induces quick retrieval of glucose and fat forquick bursts of energy. Thus, this defines four basic metabolic states:
1. Feeding is eating. During feeding, the precursors to energy storage molecules are in highamounts, and the pancreas responds by secreting insulin.
2. Fasting is not eating. During fasting, the body withdraws from the energy supplies thatwere stored during feeding, and the pancreas responds to this and induces this by secretingglucagon.
3. Starvation is not eating for long periods of time. At this point, glycogen stores have beendepleted and metabolic signals are used to induce starvation behavior in the brain and thebody (ie use of protein for energy). Note, diabetics experience constant starvation despitehigh blood glucose levels.
4. Excitement refers to the immediate need for energy. It is triggered by the adrenal glandsreleasing epinepherine into the circulation.
Glucagon’s binding to GPCR’s induces adenylyl cyclase which produces cAMP. cAMP acti-vates various protein kinases which phosphorylate and hence regulate a variety of pathways whichexert glucagon’s effects. Regulation of metabolism, then, can be mediated by regulation of cAMPproduction/degradation (and thus overall phosphorylation), by the levels of products of glycolysis,NADH, and Acetyl-CoA.
13.3 Metabolic Rules
1. ATP and Glucose levels must be relatively constant
2. The utilization of fat for energy requires carbohydrates (anaplerotic reactions are needed)
3. Glucose cannot be made from fat. β-oxidation results in formation of acetyl-CoA molecules.Glucose production requires OAA which can only be made from acetyl-CoA through the citricacid cycle. But, because the citric acid cycle begins by combining OAA with acetyl CoA, therecan be no net new production of OAA from acetyl CoA.
4. Synthesis and degradation are tightly regulated such that futile cycles (where energy isconsumed going nowhere) are minimized.
5. Low energy turns on lipolysis and glycolysis.
6. Low glucose levels turn on protein degradation and gluconeogenesis and glycogen breakdown.While muscles and liver both store glycogen, only the liver and kidneys are able to engage insignificant glycogen breakdown for other tissues to use (due to muscle cells lacking a particularenzyme).
32

7. Protein phosphorylation due to cAMP activates pathways that maintain glucose levels andretrieve energy and inactivates enzymes that store glucose, fat, and protein.
13.4 Tissue Cooperation
Different tissues may cooperate to help maintain energy levels. One example of this is the relation-ship between muscle and liver. During starvation, muscle and brain adapt by activating systemsto use ketone bodies and protein as a source of energy, while the liver activates pathways to makeketone bodies and process protein metabolic byproducts. During excitement, the liver is activelyengaged in producing glucose while the muscle is engaged in burning it.
Another example of this are the Interorgan Cycles. The Cori Cycle refers to the musclesconsuming glucose and producing lactate in response to activity, while the liver will take up lactateto produce glucose which it then releases back into the bloodstream.
The alanine cycle refers to the interorgan cycle where starving muscles catabolize protein andas a result some of the nitrogen wastes are used to transaminate pyruvate (from glycolysis) intoalanine. This alanine is then sent to the liver where it is converted back to pyruvate and thenconverted back to glucose, thus processing the nitrogen wastes and recycling carbon products backto glucose.
The formation of ketone bodies is a consequence of starvation and the accompanied metabolismof fat. The liver’s rapid processing of fatty acids into acetyl-CoA can consume the stores of freeCoA. The liver can respond by condensing three acetyl-CoA molecules to form one molecule ofHMG-CoA which is then split by HMG-CoA lyase to produce acetoacetate (or hydroxybutyrate,the reduced form), acetyl CoA, and two free CoA molecules. Acetoacetate and hydroxybutyrateare then transported to muscle and brain tissues which can adapt to utilize them by convertingthem into acetyl-CoA molecules.
Part IV
Gene Expression
14 Basic Genetics
14.1 Mendel
Gregor Mendel’s experiments were conducted on true-breeding pea plants, plants that self-pollinating would only produce offspring with a specific trait for a given character (purple flowersis the trait, flower color is the character). Mendel’s experiments revolved around his willingnessto apply numerical calculation to analyzing P generation, F1 generation, and F2 generationtraits. Using it, he found that the traditional understanding of traits, blending, was false and thatinheritance was governed by particulate factors, or genes.
Mendel found that individuals had two alternative versions of genes, or alleles, the combinationof which determined the genotype and the observed trait (phenotype). One allele came fromthe mother, one from the father. Typically, one of these alleles was dominant, in the sense thatit was the dominant allele which determined the phenotype despite the recessive allele (onebearing two dominant or two recessive alleles is said to be homozygous, one bearing one of each isheterozygous). These alleles would then segregate during gamete production, such that half of theproduced gametes would receive one allele and the other half would receive the other, making theF1 generation’s genotypes to be half from the father, half from the mother – which was Mendel’sLaw of Segregation. This can be shown in traditional Punnett square depictions (which I willnot show because if you don’t know Punnett square, you shouldn’t even think about taking thisGRE) and is studied in humans using pedigrees.
Mendel also found that if you looked at two separate traits (ie pea coat and pea color) thatthe F2 generation yielded trait quantifications which showed that the alleles segregate into gametesindependently (ie the allele for color and the allele for shape “choosing” gametes independently ofone another). This is referred to as Mendel’s Law of Independent Assortment.
33

14.2 Beyond Mendel
While Mendel’s laws are for the most part true, it is an oversimplified view for several reasons:
1. Mendel’s pea crosses used traits that showed complete dominance in that a dominant allelewas the only allele that mattered. In cases of incomplete dominance, both traits show. Forinstance, snapdragon color is an example of incomplete dominance where the F1 generationof a cross between homozygous red flowers and homozygous white flowers (no functioningpigment protein) is a pink flower (half as much red). This is not a case for blending, however,as the F2 generation shows red, pink, and white flowers in a classic 1:2:1 ratio confirmingparticulate inheritance and demonstrating that dominance need not be complete.
2. Codominance can be thought of as incomplete dominance when, instead of one gene being“null” (like the white snapdragon flower) in phenotype, both genes are expressed equally. Oneexample of this is blood group genes, where a person with the alleles coding for type A bloodand type B blood both express themselves equally on the surface of red blood cells.
3. Mendel’s experiments and conclusions suggested that traits only have two types of alleles.Many genes have multiple alleles, such as blood group (A, B, O).
4. Mendel’s experiments and conclusions also suggested that alleles only control one trait.Pleiotropy refers to genes which control multiple traits (ie a prevalent transcription fac-tor).
5. Mendel’s experiments argue that assortment of alleles occurs independently of one another.Even if this is so, one can still see some sort of “linkage”, or epistasis, between two genes ifthe genes themselves affect each other’s expressions. The classic example of this is mice coatcolor as one gene controls whether or not the color is black or brown and one gene controlswhether or not pigment gets to the skin.
6. Polygenic inheritance refers to how many traits, especially quantitative ones, are deter-mined by many genes. Characters that are multifactorial are determined not only by manygenes but my environmental factors as well.
14.3 Chromosomal Inheritance
Mendelian inheritance has its physical basis in chromosomes. This was discovered by Thomas HuntMorgan who discovered that some traits are linked with sex (sex-linked genes), demonstratingthat the gene was on the sex-determining chromosome. This explained why some genes were linked(did not assort independently of one another).
Morgan also found that even genes on the same chromosome were not completely linked. Thisis due to meiotic recombination, or a crossing-over of genes in neighboring chromosomes. Usingthis fact, one can then create a map of the chromosome (linkage map), as one expects genes closertogether to be less likely to cross over relative to one another. This degree however cannot be fullyused as a means of measuring physical distance, especially as genes that are spread about also havea higher chance of crossing-back to their original chromosome. A 1% chance of crossing over relativeto another gene is thought of as a “distance” of 1 map unit or 1 centiMorgan.
Sex-linked traits express themselves dominantly in the gender that lacks the two sex-determiningchromosomes (males in most mammals, females in birds, some fishes, and some insects). Malemammals, for instance, also pass on these sex-linked traits to all their daughters.
Chromosomal inheritance also sheds light on the issue of X-Inactivation. Female cells willrandomly inactivate one of their X chromosomes by methylation and compacting of the chromosomeinto a compact Barr body. For females heterozygous for a sex-linked gene, this can lead to somecells expressing one and some cells expressing the other.
If in meiosis, the chromosomes are not distributed equally (a nondisjunction), the offspringwill have an abnormal chromosome number, or aneuploidy. This often leads to various defects inhumans, but surprisingly, plants with polyploidy appear to be healthier.
It should be noted that there are forms of non-chromosomal inheritance. Specifically, gendersoften imprint their gamete genetic material with epigenetic modifications (modifications not in
34
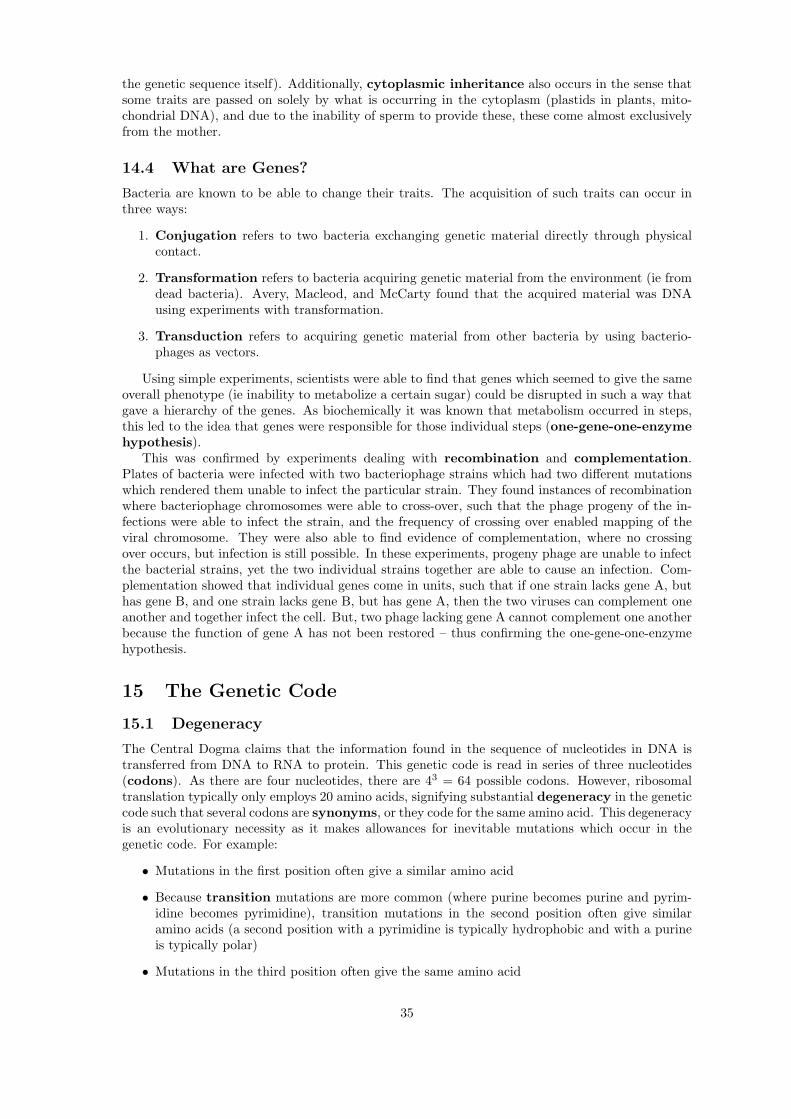
the genetic sequence itself). Additionally, cytoplasmic inheritance also occurs in the sense thatsome traits are passed on solely by what is occurring in the cytoplasm (plastids in plants, mito-chondrial DNA), and due to the inability of sperm to provide these, these come almost exclusivelyfrom the mother.
14.4 What are Genes?
Bacteria are known to be able to change their traits. The acquisition of such traits can occur inthree ways:
1. Conjugation refers to two bacteria exchanging genetic material directly through physicalcontact.
2. Transformation refers to bacteria acquiring genetic material from the environment (ie fromdead bacteria). Avery, Macleod, and McCarty found that the acquired material was DNAusing experiments with transformation.
3. Transduction refers to acquiring genetic material from other bacteria by using bacterio-phages as vectors.
Using simple experiments, scientists were able to find that genes which seemed to give the sameoverall phenotype (ie inability to metabolize a certain sugar) could be disrupted in such a way thatgave a hierarchy of the genes. As biochemically it was known that metabolism occurred in steps,this led to the idea that genes were responsible for those individual steps (one-gene-one-enzymehypothesis).
This was confirmed by experiments dealing with recombination and complementation.Plates of bacteria were infected with two bacteriophage strains which had two different mutationswhich rendered them unable to infect the particular strain. They found instances of recombinationwhere bacteriophage chromosomes were able to cross-over, such that the phage progeny of the in-fections were able to infect the strain, and the frequency of crossing over enabled mapping of theviral chromosome. They were also able to find evidence of complementation, where no crossingover occurs, but infection is still possible. In these experiments, progeny phage are unable to infectthe bacterial strains, yet the two individual strains together are able to cause an infection. Com-plementation showed that individual genes come in units, such that if one strain lacks gene A, buthas gene B, and one strain lacks gene B, but has gene A, then the two viruses can complement oneanother and together infect the cell. But, two phage lacking gene A cannot complement one anotherbecause the function of gene A has not been restored – thus confirming the one-gene-one-enzymehypothesis.
15 The Genetic Code
15.1 Degeneracy
The Central Dogma claims that the information found in the sequence of nucleotides in DNA istransferred from DNA to RNA to protein. This genetic code is read in series of three nucleotides(codons). As there are four nucleotides, there are 43 = 64 possible codons. However, ribosomaltranslation typically only employs 20 amino acids, signifying substantial degeneracy in the geneticcode such that several codons are synonyms, or they code for the same amino acid. This degeneracyis an evolutionary necessity as it makes allowances for inevitable mutations which occur in thegenetic code. For example:
• Mutations in the first position often give a similar amino acid
• Because transition mutations are more common (where purine becomes purine and pyrim-idine becomes pyrimidine), transition mutations in the second position often give similaramino acids (a second position with a pyrimidine is typically hydrophobic and with a purineis typically polar)
• Mutations in the third position often give the same amino acid
35

• If the first two positions of the codon are G or C, the strength of the bond makes the thirdposition redundant so mutating the third position in these cases gives the same amino acid
15.2 Wobble
It was at first believed that every codon has one tRNA, but characterization of tRNA species showedthat this was not the case. Additionally, they found that the 5’ end of the tRNA anticodon (whichcorresponds to the 3’ end of the codon, hence the last position) used a non-Watson-Crick base,Inosine, which is a de-aminated form of adenine. Crick, in 1966, devised the Wobble Conceptto explain the smaller numbers of tRNA then expected, which argues that the 5’ position of theanti-codon is not as spatially confined and is thus able to participate in a wider variety of contacts,thus allowing the third position to be a bit more flexible. This has been confirmed by structuralanalysis of tRNAs.
15.3 Stop Codons
Stop codons will be discussed in the protein translation section but I thought it would be good toput in here that stop codons are NOT recognized by tRNAs.
15.4 Historical
The genetic code was deciphered by using cell-free translation systems with ribosomes and highMg concentration (which remove the need for the typical starting factors) and synthetic mRNAs.By using different sequences, scientists were able to deduce the entire genetic code (sounds a loteasier than it is, because they didn’t use solid phase synthesis back in the day, they could onlymake random orderings of polynucleotides).
15.5 Point Mutations
Several types of point mutations can occur:
1. a missense mutation is a mutation which alters a single amino acid in a polypeptide
2. a nonsense mutation is a mutation which prematurely introduces a stop codon in thesequence creating a nonfunctional/terminated protein
3. a frameshift mutation is an insertion or deletion of a base pair into a genetic code whichknocks all subsequent bases out of frame with their intended reading frame
15.6 Suppression
If a mutation induces a specific phenotype, subsequent mutations which are able to neutralize thefirst one are called suppressor mutations. There are three types. The first and most obviousare reverse (back) mutations which simply undo the first mutation. The second are intragenicmutations which are mutations in another part of the mutated gene which have the ultimate effectof undoing the first mutation. The third are intergenic mutations which are mutations in anothergene locus altogether which still suppresses the first mutation.
Another form of suppression separate of mutations exists. In many species of bacteria, mutanttRNAs exist which are capable of suppressing nonsense mutations by binding the stop codon andsimply introducing an amino acid. (In case you’re curious as to how the bacteria continues to readproperly, it turns out that E. Coli does not use certain stop codons very often, so it makes sense tosuppress those as nonsense mutations)
15.7 The Code is Universal
Except in some cases (ie mitochondrial DNA, bacterial DNA), the genetic code is interpreted thesame way universally.
36

16 Transcription
16.1 RNA Polymerase
The enzyme that drives transcription is RNA Polymerase. In bacteria, there is only one RNApolymerase while Eukaryotic cells possess three (RNA Polymerase 1, 2, and 3). RNAP1 andRNAP3 transcribe ribosomal RNA and transfer RNA, respectively. RNAP2 transcribes mRNA.Not surprisingly, RNAP2 and the bacterial core enzyme are very homologous at the sequence leveland are even more similar on a structural level (closer towards the active site). RNA Polymeraseslook like “crab claws”. The space between the claws is the beginning of a channel and the “palm”of the claw is the active site of the enzyme which holds the two Mg2+ ions necessary for polymerase(both RNA and DNA) activity.
16.2 Chemistry
Transcription resembles DNA replication in that the nucleotides are linked together with the 3’hydroxyl group of the last nucleotide acting as a nucleophile to attack the α phosphate of thenext nucleotide and displace pyrophosphate. Such a reaction requires metal cations to stabilize thenegative charges on the phosphates.
16.3 Initiation
Transcription itself is divided into three steps: initiation, elongation, and termination. Ininitiation, the RNA polymerase begins by binding to promoter sequence and then melting the DNAbefore undergoing abortive initiation, whereby RNA polymerase constructs short stretches ofRNA without advancing, regularly stopping and going back to the transcription initiation site. Thisabortive initiation is then followed by a transition to the processive transcription of the elongationphase.
In prokaryotes, the σ factor determines RNA Polymerase’s promoter specificity. The RNAPolymerase-σ factor complex is called the bacterial RNA Polymerase holoenzyme. The con-sensus sequence promoter recognized by σ are a set of two 6-base sequences upstream of thetranscription initiation site - a TTGACA (at -35) followed by 17-19 bases and then a TATAAT (ataround -10). The consensus sequence is derived statistically by noting which elements of the pro-moter are most commonly shared amongst all bacterial genes. The closer to the consensus sequencea promoter is, the stronger it is said to be, in that it promotes more transcripts in a given periodof time.
The initial binding event between the holoenzyme and the promoter leaves the DNA in a double-stranded conformation (termed the closed complex). This is followed by an isomerization(structural change) of the holoenzyme into a form which can actually initiate transcription whichis called the open complex. This structural change causes DNA melting to occur somewherebetween -11 and +3.
Because RNA Polymerase does not require a primer (unlike DNA polymerases), the proteinstructure must make a number of contacts with the DNA backbone (one reason that most tran-scription initiation sites start with A) in order to create a stable complex from which to initiatetranscription. This initiation is then abortive, where short mRNA strands are created but termi-nated and the process repeats itself several times. Once the RNA polymerase gets past abortiveinitiation, it is said to “escape” the promoter and begin the elongation phase.
Eukaryotic initiation is similar, but somewhat more complex. As with prokaryotes, RNA poly-merase II in eukrayotes recognizes specific promoter sequences, although the promoters are them-selves more complicated and, instead of being recognized by a σ factor, are recognized by a widerange of General Transcription Factors (GTFs). The complex of RNAP2, GTFs, and thepromoter is called the Pre-Initiation Complex.
The promoters are also very diverse, although four common elements (not all of which arefound in every promoter) are the BRE (TFIIB Recognition Element) and TATA Box which areupstream of the transcription initiation site, the Inr (Initiator Element) which happens just at thetranscription initiation site, and the DPE (Downstream Promoter Element) which occurs about28 base pairs downstream of the initiator site. The TATA Box is recognized by the TATA Binding
37

Protein (TBP) which is itself a component of the TFIID complex which also has components whichrecognize the Inr and DPE sites. In the formation of the Pre-Initiation Complex, TFIID first bindsthe TATA box and bends the DNA. This structure can then recruit TFIIB and TFIIA which canthen recruit RNA Polymerase and TFIIH which is critical for the melting of the DNA complex andfor proceeding to elongation after several rounds of abortive initiation. The move to elongation isaccompanied by TFIIH’s multiple-phosphorylation of RNAP2’s C Terminal Domain (CTD) tailwhich consists of repeats of phosphorylatable amino acids. Phosphorylation of the CTD assists theRNAP2 in “shedding” off the GTFs and mediator complex and in recruiting the RNA processingmachinery which acts on the RNA as it is transcribed. It should be noted that there are other factorsthat have not been described here and each play a role in creating the Pre-Initiation Complex andin recruiting and stabilizing RNA Polymerase II.
Eukaryotes also make use of an extensive Mediator Complex which consists of further elementswhich binds DNA elements, other mediators, and/or RNA Polymerase. These components areneeded due to the inherent complexity of the eukaryotic genome which is packaged into chromatinand other difficult-to-access superstructures. As large structures consisting of the mediator complex,many GTFs, and RNA Polymerase II have been assembled without DNA, some have termed thiscomplex the Eukaryotic RNA Polymerase II Holoenzyme, although it is not certain how relevant invivo this is. Interestingly, many components of this “holoenzyme” do not actually interact directlywith the polymerase (ie TFIID).
16.4 Elongation
Elongation refers to the processive (meaning that it is not stop-release-bind again-start again, butcontinually adds nucleotides) addition of ribonucleotides inside the enzyme active site. The DNAenters the enzyme at one place, splits into the template and non-template strands, and then reformsbehind the polymerase, while RNA nucleotides enter from one channel, and the transcribed RNAleaves through yet another channel. At any given time, only 8 or 9 RNA nucleotides are actuallypaired with DNA.
In prokaryotes, elongation is accompanied by two forms of proofreading. The first is pyrophos-phorolytic editing which is simply the reverse reaction of transcription which reincorporatespyrophosphate, as opposed to displacing it. This process can remove correct base pairs as well asincorrect base pairs, but because of the enzyme active site structure, the enzyme tends to hoverover incorrectly made pairs longer, and is thus more likely to remove an incorrect nucleotide (evenif it removes a correct nucleotide there is a reasonably high chance that a correct nucleotide willadd back on).
The second form of proofreading is hydrolytic editing which is where the enzyme hydrolyzesparts of the RNA which are coded improperly. This process is stimulated by Gre factors whichnot only enhance proofreading but also increase transcription speed by decreasing the time theenzyme spends at hard-to-transcribe areas (RNA transcription does not occur at a constant speedthroughout the transcript).
In eukaryotes, elongation is started and enhanced by a component of the initial complex calledP-TEFb which phosphorylates a residue on the CTD tail and is responsible for phosphorylating andrecruiting TAT-SF1 and hSPT5 which, along with P-TEFb, are elongation factors. Similar to theGre factors in prokaryotic elongation is the eukaryotic TFIIS which in addition to reducing the timethat transcription stalls at specific sequences, also enhances the pyrophoshorolytic proofreading aswell as an internal RNase function of the RNA Polymerase which is comparable to the hydrolyticediting in prokaryotes. Eukaryotic elongation is also accompanied by the recruitment of RNAprocessing enzymes and factors needed for termination.
16.5 Termination
In prokaryotes, sequences in the RNA called terminators signal for termination of transcription.These terminators are either Rho dependent or Rho independent.
Rho independent terminators, also called intrinsic terminators, usually have a short invertedrepeat of about 20 nucleotides followed by a stretch of several A’s. The inverted repeat is proneto forming a hairpin loop structure which, when coupled with the more weakly bound A-U pairs
38

leads to dissociation of the RNA from the polymerase (although the specific mechanism is not quiteclear).
Rho dependent terminators are less well characterized but recruit the protein Rho which is anATPase which uses ATP hydrolysis to trigger termination. Rho is unable to terminate transcriptionof RNA that is being translated.
Eukaryotic termination is achieved by the recognition of termination sequences. These sequencescause termination factors such as CPSF and CstF (which have already been recruited to the RNAP2CTD tail during elongation) to bind to the RNA and recruit poly-A-polymerase which attachesa polyA tail to the RNA and also triggers dissociation of the RNA from the RNA polymerase.
17 RNA Processing
17.1 mRNA Capping
Eukaryotic mRNAs are capped at the 5’ end with an “inverted” methyl guanine. This processinvolves three steps. The first involves removing a phosphate from the 5’ end of the mRNA transcriptwith RNA triphosphatase. The β-phosphate then acts as a nucleophile to attack the α-phosphateof a GTP nucleotide catalyzed by guanylyl transferase. This displaces pyrophosphate and createsa 5’-5’ linkage (the “inverted” guanine). Lastly, methyl transferase methylates the 7 position onguanine. This machinery is recruited by the phosphorylated CTD tail of the elongating eukaryoticRNA Polymerase II.
17.2 RNA Splicing
The Eukaryotic RNA that is first transcribed is called pre-mRNA, and still contains non-expressedintrons in addition to the expressed exons. pre-mRNA undergoes RNA splicing to excise theintrons and produce the final mRNA strand. Many pre-mRNAs, in fact, have multiple spliceproducts (alternative splicing).
The process of splicing is fairly universal. The 5’ end (5’ splice site) of the intron and the 3’ end(3’ splice site) of the intron and an internal site (branch site) in the intron contain sequenceswhich signal for splicing activity. A transesterification reaction occurs where the 2’-hydroxylgroup of the branch site acts as a nucleophile, attacking the phosphate linkage at the 5’ splice site,thus creating a lariat, or a loop in the intron, and liberating the exon 5’ to the intron. The freed3’-hydroxyl of the exon then attacks the phosphodiester linkage at the 3’ splice site, thus linkingthe 5’ splice site to the 3’ splice site, and excising the intron, now a lariat structure. The increase inentropy from the production of the freed lariat is the driving force of the reaction and the reverseis also prevented by rapid degradation of free RNA. In alternative splicing, some exons are left out,and the 5’ exon may attack a later 3’ splice site (trans-splicing).
There are three categories of splicing. The first two involve the reaction as described above,and the third involves a different mechanism. The introns involving the splicing reaction describedabove are Group 2 Introns. The first type of Group 2 Intron uses a mostly-RNA machinery calledthe spliceosome which catalytically binds and induces the structural changes which lead to lariatformation and splicing. The second type of Group 2 intron splicing is self-splicing (the RNA of theintron adopts the appropriate structures needed), and needs no spliceosome.
The third category are the Group 1 Introns which are introns which self-splice and releaselinear introns rather than lariats. The mechanism by which this occurs is that the introns forma RNA structure capable of binding a guanine nucleotide. The intron then positions the guaninenucleotide to attack the 5’ splice site, bypassing the lariat intermediate. This is followed by theusual 5’ splice site attacking the 3’ splice site.
Splicing errors are rare for two reasons. First, the splicing machinery is recruited as transcriptionoccurs, making it less likely that the spliceosome will miss an exon. Secondly, exons themselves areoftentimes bound by exonic splicing enhancers (ESEs) which help to recruit the spliceosometo the correct position.
Alternative splicing is regulated by ESEs and also exonic splicing suppressors (ESSs) as wellas intronic splicing enhancers and suppressors (ISE’s and ISS’s) which can be induced in responseto different stimuli and thus favor different splice products under different circumstances.
39

Splicing has several evolutionary implications/concepts:
1. Self-splicing introns suggest that these elements were introduced externally as they are, likeviruses, able to replicate themselves on their own and are able to incorporate into the genome
2. The spliceosome’s dependence on RNA for catalytic activity lends support to the RNA worldhypothesis and the idea that ribozymes are prevalent in nature
3. The presence of splicing allows for exon shuffling which allows for domains to be mixed andmatched allowing for greater evolutionary diversity in protein structure and makeup
4. Splicing is widely believed to be the reason why the genomes of higher organisms (ie mammals)are not much longer than the genomes of lower organisms.
18 Translation
18.1 RNA
Messenger RNA is read by the ribosomal translation machinery. As codons are groups of threenucleotides, there are three possible ways to translate any given sequence. Only specified openreading frames with a specific start location and a stop location are translated. Most mRNAstrands to be translated only have one open reading frame (monocistronic), while those withmultiple open reading frames are polycistronic.
In prokaryotes, the mRNA oftentimes bears a Shine-Dalgarno Sequence also known as aRibosome Binding Sequence (RBS) which is complementary to a sequence in the ribosomalRNA, directing ribosomes to translate the strand.
Eukaryotic mRNA recruits the translational machinery in three ways. First, the inverted methyl-guanine cap on the RNA recruits ribosomal machinery. Secondly, many eukaryotic mRNAs beara Kozak Sequence (which consists of a purine three bases upstream and a guanine immediatelydownstream of the start codon) which increases translation efficiency. Lastly, the poly-adenylatedtail of eukaryotic mRNAs promotes translation efficiency.
In addition to mRNA, translation requires an adaptor molecule to couple codon recognitionwith peptide chemistry. These are the transfer RNAs (tRNAs). These structures are mostlysingle-stranded, employ non-conventional bases (ie pseudouridine and dihydrouridine) and adopta cloverleaf-like secondary structure and an L-like three-dimensional structure. At one end of thetRNA is a site which recognizes the codon (the anticodon). Although the sequences of tRNAsvary greatly, the 3’ end of the tRNA always ends with 5’-CCA-3’. The terminal adenine is theposition where charged tRNAs have an amino acid attached.
The process of charging an amino acid is two-fold but both steps are catalyzed by tRNAsynthetases. In the first step, the carboxy terminus of an amino acid is used as a nucleophile toattack the α-phosphate of an ATP, displacing pyrophosphate, and creating an adenylated aminoacid. This complex is then attacked by the 2’ or 3’ hydroxyl (it can rapidly equilibrate betweenboth) of the tRNA terminal adenine, charging the tRNA in the process. One tRNA synthetase isresponsible for one amino acid, so many tRNA synthetases recognize multiple tRNAs. This chargingprocess is made accurate by multiple contacts between the enzyme and the tRNA and multi-stepproofreading and is necessary because ribosomes cannot discern correct versus incorrectly chargedtRNAs.
H3N
R
O
O
O
HO OH
Adenine
O
P OO
OPiPi
H3N
R
O
O PiOAdenosine
HO
tRNA
H3N
R
O
O tRNA
charged amino acid
40

18.2 Ribosome
The ribosome is a very large complex of RNA and protein. It consists of two components — a largeand small subunit. The small subunit is where codon recognition takes place and the large subunitis where the catalytic machinery is housed. The ribosome cycle refers to the formation of theribosome-mRNA complex and the dissociation once the polypeptide chain has been formed:
1. The small subunit associates with the mRNA
2. The small subunit recruits the large subunit
3. After translation occurs, the complex dissociates
Multiple ribosomes can translate a given mRNA strand at any time, allowing for greater effi-ciency of translation and explains the relatively little mRNA relative to the number of ribosomesin cells.
18.3 Chemistry
Peptide bond formation chemistry is fairly simple. As with DNA and RNA production, peptidebond formation is directional. New amino acids are added at the C terminus of a growing polypep-tide chain. The catalysis is handled by the RNA in the ribosome which positions the tRNA bearingthe polypeptide chain next to the tRNA charged with the next amino acid. The amino group of thisamino acid then attacks the acyl linkage between the polypeptide chain and the tRNA, transferringthe new polypeptide to the tRNA formerly only bearing an amino acid (the peptidyl transferasereaction).
18.4 Initiation of Translation
The initiation of translation relies on the small subunit of the ribosome binding in the correctreading frame. This is mediated in prokaryotes by binding to the RBS. This binding places thestart codon in the P site of the ribosome. The P site is responsible for holding the tRNA whichholds the growing polypeptide chain. The adjacent A site is the amino site, where new chargedtRNAs enter the ribosome and perform peptide chemistry, and the E site next to that is the exitsite, where used tRNAs exit the channel. Immediately following ribosome binding to the mRNA,an initiator tRNA bearing N-formyl methionine, a modified amino acid, enters the P site tobecome the first amino acid in the polypeptide chain. The initiation factors IF1, IF2, and IF3are then responsible for initiating translation. The three factors prevent association of the largesubunit (which does not associate with the small subunit until after initiation is complete), preventsother tRNAs from associating with the mRNA, and facilitates the association of the initiator tRNA,the small subunit, and the mRNA. When the initiator tRNA and the mRNA successfully pair, achange in conformation displaces IF3 which then allows the large subunit to associate with the smallsubunit. The resultant ribosome complex causes IF2, a GTPase bound to GTP during initiation,to hydrolyze GTP to GDP. IF2-GDP has a much weaker affinity for the ribosome complex andalso becomes displaced which releases IF2 and IF1 from the ribosome, thus completing prokaryoticinitiation.
In eukaryotes, the small unit of the ribosome is recruited by the mRNA cap. The small unit,already pre-bound to an initiator tRNA prior to association with the mRNA, then searches for thestart site and then initiates translation there. The proteins involved are much greater in number andin complexity, but lead to a similar sequence of events except that the first amino acid is methionine(not fMet) and there are two GTP-bound GTPases which are associated with the complex ratherthan the one in prokaryotes. The scanning for the start site is driven by ATP hydrolysis by oneof the many initiation factors. Binding of the initiation factor then induces the GTPase activitywhich displaces the initiation factors and allows the large subunit to associate and end initiation.
Eukaryotes increase translation efficiency through the use of the poly A tail on mRNAs. PolyA Binding Protein bends the mRNA into a circle allowing initiation factors associated with thepoly A tail to interact with the initiation factors which associate with the guanine cap of the mRNA.This stabilized circle allows ribosomes to quickly “jump back on” to the mRNA after finishing oneround of translation, thus increasing translation efficiency.
41

18.5 Elongation
The elongation of the polypeptide chain requires the translocation of the ribosome such that thetRNAs move over one step: from A to P, P to E. This translocation is assisted by elongation factors.
EF-Tu is a GTPase which, while bound to GTP has high affinity for tRNA and loses this affinitywhen bound to GDP. EF-Tu is one of the critical mechanisms by which accuracy is maintainedduring translation, as a codon-anticodon mispairing decreases the GTPase’s efficiency and a boundEF-Tu blocks peptide coupling, thus preventing the wrong peptide bond from forming.
The ribosome itself also contributes to increasing accuracy by positioning ribonucleotides in theminor groove of the codon-anticodon pairing which can recognize when the pairing is incomplete.Additionally, the tRNAs upon binding, in order to properly form a peptide bond must be able torotate in a process called accomodation. Incorrect tRNA base pairing leads to the tRNA beingdisplaced from the ribosome during accomodation.
EF-G is another GTPase which, when bound to GTP, is able to bind to ribosomes followingpeptide bond formation. Upon binding, it hydrolyzes GTP to assist in the translocation process,pushing both tRNAs and also moving the mRNA. EF-Ts then replaces the GDP bound to EF-Gwith GTP so that the cycle can continue (and also on EF-Tu).
EF-Tu, EF-G, and EF-Ts have very similar counterparts in eukaryotes.
18.6 Termination
Translation termination occurs at stop codons. These codons are not recognized by tRNA but byproteins called release factors. There are two classes of release factors. Class I release factorsrecognize the stop codons themselves and trigger hydrolysis of the peptidylacyl-linkage of the P-site tRNA to free the polypeptide. They resemble tRNAs in structure in order to fill out this role.Class II release factors induce the dissociation of the Class I release factor from the ribosome.They are also GTP regulated although they have a stronger affinity for GDP so are found in theGDP bound form. The GDP bound form has a high affinity for the ribosome-Class I release factorcomplex. This binding causes the Class II release factor to become bound to GTP instead of GDP.This transition displaces the Class I factor. Loss of the Class I factor stimulates the hydrolysisof the bound GTP which leads to the GDP bound form of the protein which dissociates from theribosome.
A ribosome recycling factor (RRF) recruits EF-G which uses GTP hydrolysis to dissociatethe ribosome, tRNA, and mRNA from each other and to allow the ribosome to translate anothertranscript and the tRNAs to become acylated again.
18.7 Energy
One common strand here is the use of ATP hydrolysis and GTP hydrolysis to energetically push theprocess of translation forward. Every extra amino acid adds a cost of two GTP (one for EF-Tu, onefor EF-G) and one ATP (for the tRNA synthetase to charge the tRNA). The initiation itself usesGTP and ATP hydrolysis to set up the complex and to scan for the start codon and to properlyplace the appropriate tRNAs there. Termination also requires GTP hydrolysis as the RRF stepinvolves a GTP and the Class II factor uses one as well.
Part V
Gene Regulation
19 Gene Regulation in Prokaryotes
19.1 Transcriptional Control
Much of expression regulation in living organisms occurs at the level of transcription, oftentimesin the initiation phase. Proteins which become activated given specific signals are used to enhance(activators) or repress (repressors) transcription by affecting the steps in initiation.
42

• Simple Activation/Repression: The most elementary of transcriptional control are DNAbinding proteins that recognize DNA sequence motifs near the promoter. These proteins theneither recruit or prevent the binding of RNA polymerase (and hence modulate transcriptionallevels relative to the basal levels by affecting the time the RNA polymerase is at a givenpromoter)
• Allostery: Certain proteins can also modulate transcription by affecting RNA polymeraseconversion to the open configuration or the ability to undergo promoter escape
• Action-at-a-Distance: Many proteins which engage in simple recruitment/repression or inallostery bind to DNA sequences removed from the promoter. These interactions are mediatedby the bending or looping of DNA and various proteins can facilitate the proper DNA bendingto facilitate transcription.
• Cooperativity: This is not a regulatory method per se, but the effects of various regulatoryproteins can be enhanced through cooperativity, whereby the effects of multiple proteinswhich interact with RNA Polymerase can be enhanced if they interact with one another.Cooperativity leads to switch-like behavior for transcription as genes will be transcribedreasonably poorly in the absence of full cooperativity and will quickly turn on as the bindingof some factors recruits others. Cooperativity also allows the integration of multiple controlsignals to control one gene’s transcription.
• Combinatorial Control: Also not a regulatory method per se, this refers to the fact thata single protein can act as a regulator for multiple genes
• Alternative σ factors: As mentioned before, the σ factor is responsible for promoter selec-tivity. The most prominent σ factor in E. coli is σ70. Under heat-shock conditions, E. coliwill switch to σ32. Other alternative σ factors can direct RNA polymerase towards differentpromoter elements.
• Altering Conformation of DNA: A few transcriptional regulators are known to affectRNA polymerase by altering the structure of DNA in such a way to encourage binding oractivity of RNA polymerase. MerR, for example, activates transcription of merT, a generesponsible for a cell coping with high levels of mercury. In the absence of mercury, MerRstabilizes the promoter which is structured so that the -35 and -10 elements of the promoterare not optimally placed to lead to RNA Polymerase binding. In the presence of mercuryions, however, MerR twists the promoter DNA forcing it into a more optimal configuration.
• Preventing RNA Polymerase from Escaping the Promoter: Some repressors act bypreventing RNA polymerase from escaping the promoter by binding very strongly to RNApolymerase. These bind, much as one would expect activators to, upstream of the promoter.However, these proteins are able to bind tightly enough to prevent RNA polymerase fromleaving the promoter.
• Co-Repressors and Co-Activators: These terms refer to substances which are needed forrepression or activation but which are not DNA-binding proteins and do not interact with thetranscriptional machinery themselves.
• Dual Activator-Repressor: Some proteins, like MerR alluded to above, act as both ac-tivators and repressors which can recruit/activate RNA polymerase under some conditions,but block transcription in others.
• Attenuation: Many bacteria use attenuation to regulate genes clusters which encode theenzymes needed to synthesize certain amino acids. This is done by preventing or enabling theformation of an early termination hairpin structure given different concentrations of the aminoacid in question. There are other systems of control that are similar to attenuation which usemRNA structure responsive to different conditions to block transcription or translation.
• Antitermination: Antitermination is not well-understood, but involves the use of proteinswhich recognize stretches of mRNA or DNA during transcription and become loaded ontoRNA polymerase as a result. The RNA polymerase-protein combination becomes resistant tocertain termination sequences, thus acting as another level of transcriptional control.
43

• Retroregulation: Retroregulation occurs when the mRNA transcribed downstream of thegene being regulated is capable of recruiting nuclease activity. Thus, the mRNA is degradedbefore it can be translated in a step that occurs after transcription of the gene (and movesbackwards).
19.2 Classical Example: lac Operon
The lac operon system of E. coli refers to the regulatory system which controls the transcriptionof the polycistronic mRNA which encodes β-galactosidase (the specific gene is lacZ), an enzymewhich metabolizes lactose. The other two genes on the mRNA are lacY and lacA which encodetransporters that import lactose. The lac operon is designed so that these three genes are onlyactive in the absence of glucose and in the presence of lactose. Jacob and Monod did a classicalseries of experiments where they found that control of the system required two sequences, one whichcould only act in cis and one which could act in trans relative to the gene in question.
It turns out that the sequence capable of acting in trans coded for a regulatory protein and thesequence only capable of acting in cis was the sequence the regulatory protein recognized. In the lacsystem, the lac repressor is the protein which binds to the DNA sequence, called the lac operator,which is close enough to the promoter that the binding activity prevents RNA polymerase frombinding. The lac repressor, upon binding to allolactose, a lactose metabolite, becomes unable tobind the operator and hence allows for transcription. The cis and trans conclusions then makesense, as the operator can only control the expression of one gene (cis) while a diffusible proteincan act on any gene having the correct protein binding sequence.
The protein responsible for glucose detection in E. coli is called CAP. CAP binds cAMP, a signof low glucose levels, and this binding enables it to bind to a site upstream of the promoter. CAPthen interacts with the C-terminal tail of RNA polymerase (the region which normally interactswith the UP element which the lac promoter lacks) to recruit RNA polymerase.
19.3 Classical Example: Bacteriophage SPO1 Lifecycle Regulation
The bacteriophage SPO1 infects B. subtilis. In order to produce viral progeny, a specific subsetof genes must be expressed at different times. SPO1 regulates this via alternative σ factors. Theearly-phase SPO1 genes bear a promoter which is recognized by B. subtilis σ70 . One of thesegenes, gene 28, is an alternative σ factor which later displaces σ70 and directs transcription of themiddle-phase genes. One of these genes, in turn, encodes yet another alternative σ factor whichdirects RNA polymerase towards the viral late phase genes.
19.4 Classical Example: NtrC
NtrC is a protein which regulates transcription of glnA, a gene responsible for nitrogen metabolismunder low nitrogen conditions. NtrC showcases multiple forms of regulation. Under low nitrogenconditions, it is phosphorylated, exposing its DNA binding domain. NtrC binds four sites upstreamof the promoter, thus binding is highly cooperative and interaction with RNA polymerase requiresthe looping of DNA. NtrC does not recruit RNA polymerase per se, but induces an allostericchange in RNA polymerase, causing it to associate with σ54 which directs transcription to theglnA promoter. Finally, NtrC also has an ATPase activity which, upon hydrolysis of ATP, inducesRNA polymerase to switch from the closed conformation to the open conformation and activatingtranscription.
19.5 Classical Example: araBAD System
The araBAD system controls the genes responsible for arabinose metabolism. araC, the regula-tory protein, binds as a dimer in the presence of arabinose to two sites, araI1 and araI2, upstream ofthe promoter to recruit RNA polymerase. In the absence of arabinose, araC then binds to araI1 anda site many bases upstream of the promoter araO2, causing the DNA to loop, and also preventingRNA polymerase recruitment. The degree of induction is very large which is why this system isused in many expression vectors.
44

19.6 Classical Example: trp Attenuation
The trp cluster of genes encode the enzymes needed for tryptophan biosynthesis and is regulated bya tryptophan-dependent repressor-operator system. The system also uses attenuation. Recall thatin bacteria, translation occurs during mRNA transcription. The polycistronic mRNA which hasthe trp genes encodes a dummy leader peptide before the genes. This leader peptide is uniquein that it has two tryptophan residues one after another. The mRNA encoding these two residuesare part of a stretch of mRNA 5’ of a stretch of mRNA that it can form a hairpin loop with. Thislatter stretch can also form a hairpin structure with another stretch of mRNA 3’ to it which is itselfa part of the termination hairpin loop of the leader mRNA. In a tryptophan-poor environment,the ribosome stalls at the double-tryptophan-encoding portion of the mRNA. This stalling causesthe ribosome to block the 5’ stretch of mRNA complementary to the middle stretch, enabling themiddle stretch to form a hairpin loop with the 3’ stretch. This hairpin loops prevents the formationof the terminator hairpin (as the 3’ stretch is not available) and allows RNA polymerase to continuetranscription. In a high-tryptophan environment, the ribosome does not stall at that first stretch,and proceeds. This allows the 5’ stretch to form a hairpin loop with the middle stretch, allowingthe 3’ stretch to form the termination hairpin loop which then blocks transcription of the remainingtrp genes. A similar system is used by various bacteria for other amino-acid biosynthesis systems.
This method of control is similar to the riboswitch method of transcriptional control wherea leader mRNA can adopt a complex tertiary structure which can bind various molecules (ie me-thionine). The binding then controls the formation or prevention of a termination hairpin or theformation of RNA structures which are difficult to transcribe through or terminate translation.
This is also similar to the system which regulates ribosomal protein levels. Ribosomal proteinsbind to the mRNA’s which encode them in such a way as to prevent ribosomes from translatingthem.
19.7 Classical Example: Phage λ
Bacteriophage λ upon infection can either destroy the cell lytically or enter a dormant lysogenicphase. This decision is determined by a variety of factors including the nutrient density in thesurrounding media (high nutrient density, lytic, low nutrient density, no point in being lytic). Thelysogenic phase can also be exited given certain stimuli, such as DNA damage (which threatens theexistence of the phage).
This complex behavior is regulated by a relatively simple system which, at its core, involvesthree promoters: PL (left), PR (right), and PRM (repressor maintenance). PL and PR are strongpromoters which are capable of inducing strong transcription and flank the weak promoter PRM
and its target gene, cI which encodes the λ repressor. PR also directs the transcription of Cro.Lytic behavior occurs when PL and PR are active but PRM is not, while lysogenic behavior occurswhen PL and PR are inactive but PRM is active.
The key to this system is that there are two operators (to the left and to the right) which regulateall three promoters. Each operator has three protein binding sites, for a total of six binding sites.OR1, OR2, OR3, OL1, OL2, and OL3 are each capable of binding Cro and λ repressor. While Crodimers can only act as repressors, λ repressor can bind as a dimer, a tetramer, and even an octamerand depending on its position and the units involved can act as either an activator or a repressor.
The operator of most interest is the one on the right as it simultaneously regulates PRM andPR in such a way that a bound OR3 blocks PRM and bound OR2 and OR1 blocks PR (and a similarpattern blocks PL), but recruits RNA polymerase to PRM . λ repressor binds OR1 readily but bindsOR2 and OR3 weakly, although due to cooperativity, a λ repressor dimer bound at OR1 can recruitanother dimer to OR2, while Cro binds OR3 readily but binds OR1 and OR2 weakly. Therefore, inthe lytic phase, Cro repressor binds OR3, but not OR1 and OR2, thus blocking PRM and enablingPR and PL. In the lysogenic phase, λ repressor binds OR1 and OR2, but not OR3, thus blockingPR (and also PL) and enabling PRM .
This system, then, is capable of a very fine-tuned system of control of the levels of λ repressor. λrepressor acts as its own inducer, as its presence at OR1 and OR2 stimulates transcription (positiveautoregulation). If repressor levels are too high, then it will bind OR3 and shut down its owntranscription levels (negative autoregulation).
Thus, if a virus is already in the lysogenic phase, induction (to the lytic phase) merely involves
45
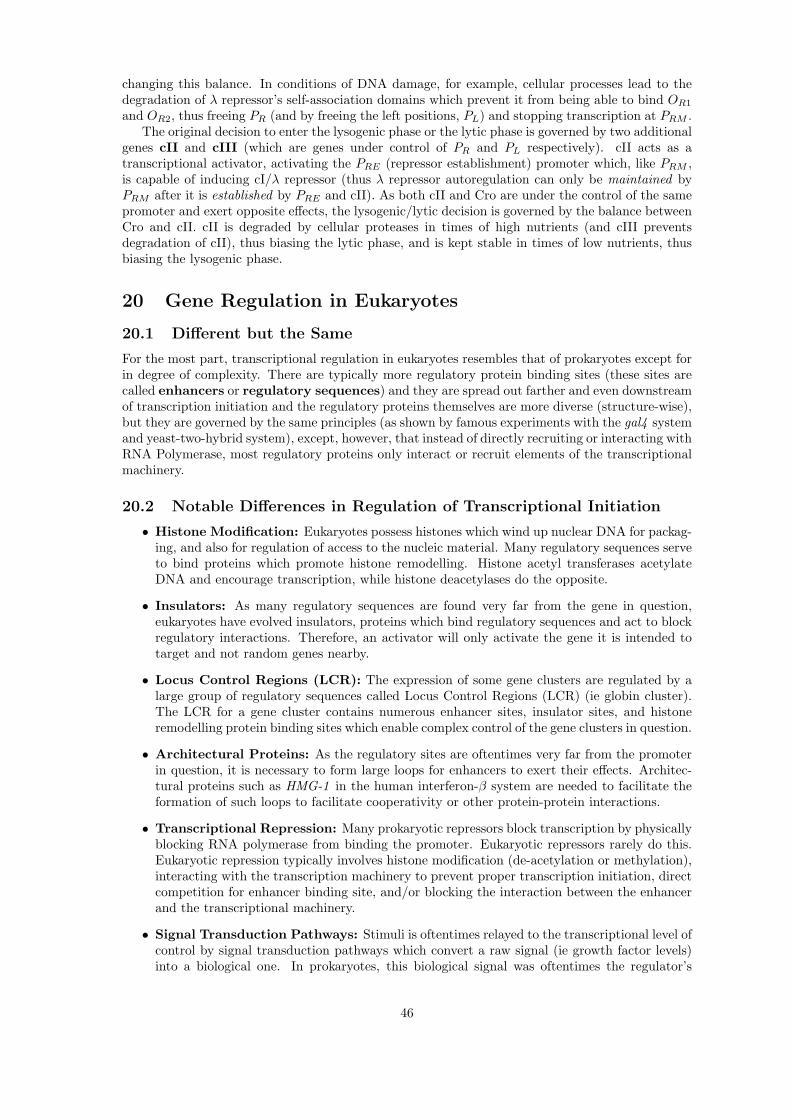
changing this balance. In conditions of DNA damage, for example, cellular processes lead to thedegradation of λ repressor’s self-association domains which prevent it from being able to bind OR1
and OR2, thus freeing PR (and by freeing the left positions, PL) and stopping transcription at PRM .The original decision to enter the lysogenic phase or the lytic phase is governed by two additional
genes cII and cIII (which are genes under control of PR and PL respectively). cII acts as atranscriptional activator, activating the PRE (repressor establishment) promoter which, like PRM ,is capable of inducing cI/λ repressor (thus λ repressor autoregulation can only be maintained byPRM after it is established by PRE and cII). As both cII and Cro are under the control of the samepromoter and exert opposite effects, the lysogenic/lytic decision is governed by the balance betweenCro and cII. cII is degraded by cellular proteases in times of high nutrients (and cIII preventsdegradation of cII), thus biasing the lytic phase, and is kept stable in times of low nutrients, thusbiasing the lysogenic phase.
20 Gene Regulation in Eukaryotes
20.1 Different but the Same
For the most part, transcriptional regulation in eukaryotes resembles that of prokaryotes except forin degree of complexity. There are typically more regulatory protein binding sites (these sites arecalled enhancers or regulatory sequences) and they are spread out farther and even downstreamof transcription initiation and the regulatory proteins themselves are more diverse (structure-wise),but they are governed by the same principles (as shown by famous experiments with the gal4 systemand yeast-two-hybrid system), except, however, that instead of directly recruiting or interacting withRNA Polymerase, most regulatory proteins only interact or recruit elements of the transcriptionalmachinery.
20.2 Notable Differences in Regulation of Transcriptional Initiation
• Histone Modification: Eukaryotes possess histones which wind up nuclear DNA for packag-ing, and also for regulation of access to the nucleic material. Many regulatory sequences serveto bind proteins which promote histone remodelling. Histone acetyl transferases acetylateDNA and encourage transcription, while histone deacetylases do the opposite.
• Insulators: As many regulatory sequences are found very far from the gene in question,eukaryotes have evolved insulators, proteins which bind regulatory sequences and act to blockregulatory interactions. Therefore, an activator will only activate the gene it is intended totarget and not random genes nearby.
• Locus Control Regions (LCR): The expression of some gene clusters are regulated by alarge group of regulatory sequences called Locus Control Regions (LCR) (ie globin cluster).The LCR for a gene cluster contains numerous enhancer sites, insulator sites, and histoneremodelling protein binding sites which enable complex control of the gene clusters in question.
• Architectural Proteins: As the regulatory sites are oftentimes very far from the promoterin question, it is necessary to form large loops for enhancers to exert their effects. Architec-tural proteins such as HMG-1 in the human interferon-β system are needed to facilitate theformation of such loops to facilitate cooperativity or other protein-protein interactions.
• Transcriptional Repression: Many prokaryotic repressors block transcription by physicallyblocking RNA polymerase from binding the promoter. Eukaryotic repressors rarely do this.Eukaryotic repression typically involves histone modification (de-acetylation or methylation),interacting with the transcription machinery to prevent proper transcription initiation, directcompetition for enhancer binding site, and/or blocking the interaction between the enhancerand the transcriptional machinery.
• Signal Transduction Pathways: Stimuli is oftentimes relayed to the transcriptional level ofcontrol by signal transduction pathways which convert a raw signal (ie growth factor levels)into a biological one. In prokaryotes, this biological signal was oftentimes the regulator’s
46

ability or inability to bind DNA. In eukaryotes, what is more common is enabling/preventingthe regulator from acting by modifying the protein’s structure (ie phosphorylation) or alteringthe nuclear import/export of the regulator.
• Gene Silencing: Gene silencing refers to the transcriptional shutdown of genes becauseof their location, not in response to a particular stimulus. It is mediated by histone mod-ification, usually by histone deacetylation or methylation, or by methylating DNA directly.The former packs the chromatin together more tightly into heterochromatin, rendering theDNA inaccessible to transcriptional machinery, and the latter blocks the binding of proteinsneeded to initiate transcription and by recruiting histone remodelling complexes to do thesame. This direct DNA methylation is the basis of imprinting where despite the presenceof both a maternal and paternal allele, only one is active (the unmethylated one). Thesechanges involving gene silencing are termed epigenetic because they are real and can beinherited through cell division but are not in the genetic code itself. These changes are of-tentimes maintained by so-called maintenance methylases which methylate hemi-methylatedDNA (from DNA replication).
20.3 Regulation of Post-Initiation Transcription
It should be noted first that all prokaryotic mechanisms of regulation which were dependent onco-transcriptional translation (ie attenuation) do not apply as translation and transcription ineukaryotes are separated.
• Control of Transcriptional Elongation: Like the bacterial anti-terminators, some eukary-otic genes require the binding or recruitment of factors to assist in transcriptional elongation.This includes P-TEF, a kinase which is recruited to some positions to phosphorylate theRNA polymerase CTD and allow it to pass sequences that would otherwise stall it.
• Regulation of Splicing: Splicing enhancers and splicing repressors can be activatedgiven different cellular stimuli and can thus direct mRNA to be alternatively spliced at differ-ent levels under different conditions. This is the basis of Drosophila sex-determination. Theexpression of a master regulator gene is controlled by the ability of X-linked splicing enhancersto properly splice a specific mRNA transcript.
• Translational Control: Self-explanatory, but several genes are regulated on the level oftranslation. Gcn4, a yeast gene responsible for amino acid biosynthesis, is only translated inlow amino acid conditions. This is regulated because the mRNA of Gcn4 contains 4 shortopen reading frames upstream of the Gcn4 gene itself. Ribosomes are unable to translate all4 in low amino acid conditions and can thus reach the Gcn4 open reading frame, while in highamino acid conditions, the ribosome dissociates from the mRNA after translation is complete.
20.4 Classic Example: Yeast Cell Type Control
S. cerevisiae can be three types of cells: a, α, and diploid. The three types of cells have differentexpressions of genes. a type cells express a1, a a-type specific regulator of transcription, and Mcm1,a general regulator. α type cells express α1, α2, and Mcm1. Diploid cells express a1, Mcm1, andonly α2.
In a cells, Mcm1 acts as an activator for a-specific genes and the absence of an activator preventsthe activation of α-specific genes. In α cells, Mcm1 binds cooperatively with α1 at the enhancer forα-specific genes, thus turning them on. And α2 binds as a repressor at the enhancer for a-specificgenes and blocks the capability of Mcm1 to activate a-specific genes, thus turning them off.
In diploid cells, the lack of α1 prevents the activation of α specific genes. The presence of α2then inhibits a-specific genes (as in α cells) and binds with a1 to block haploid specific genes.
20.5 Classic Example: Glucocorticoid Receptor
The glucorticoid receptor (GR) is normally held in the cytoplasm. Upon binding its ligand, how-ever, it is then transported to the nucleus where it can bind at various glucocorticoid response
47

elements (GREs) in the DNA. At some GREs, the GR adopts a conformation which allows itto recruit CBP, a histone acetylase and recruiter of transcriptional machinery used by many otherenhancers thus activating transcription, and at other GREs, the GR adopts a conformation whichallows it to recruit histone deacetylases and thus shutting down transcription.
20.6 Biological Diversity and Gene Regulation
It’s commonly cited that the human genome is not much larger or more complicated than muchsimpler organisms. And even between species as different as humans to worms, most of the genes areclear homologues of one another. The primary explanation for the increase in complexity withoutgreat difference in genome itself is gene expression regulation.
Many genes appear to have been the products of gene duplication. This gene duplicationis then followed by mutations in the primary structure, giving it slightly different function, ormutations in the regulatory sequences controlling the gene’s expression. With the exception ofbacteria, it seems that much of evolution has been driven by the latter. In eukaryotes this is furtherassisted by alternative splicing which can be used to “mix-and-match” gene components and by thefact that it is very commonplace for regulatory elements to be many kilobases away from the genesin question.
21 Viruses
21.1 Basics
Viruses are small parasites that employ the machinery of the cells they infect to reproduce, and infact cannot reproduce without infecting cells. They are essentially bundles, called nucleocapsids,of genetic information (DNA or RNA) packaged in protein shells called capsids. These nucleocap-sids may or may not have a lipid bilayer, called an envelope, which while derived from the infectedcell if present contain viral rather than cellular glycoproteins and cell surface proteins, associatedwith them. These capsids and their envelopes often bear proteins and structures which assist ininfection and in identifying cell types (ie by binding to cell surface markers of certain cell types) Thestudy of viruses has allowed for the exploration of host immune responses as well as the molecularbiology of all living things.
Capsids are usually assemblies of relatively few proteins into a three-dimensional structure.There are two main classes of capsid structure. The first involves simply wrapping the nucleicacids within a protein helical structure. The second involves assembling proteins into icosahedralstructures (20 identical equilateral triangular faces in a quasi-spherical shape).
Simply mixing the nucleic information with the capsid proteins of many simple viruses promotesspontaneous self-assembly. More complicated viruses require specific assembly stages before maturevirus are produced. Viruses have shown a remarkable ability to not only use cellular machinery,but to completely hijack the machinery to end the production of cellular components and onlyproduce ones needed for viral assembly. This dependence on cellular machinery for infection andreplication limits the viral range, the range of host cell types that a virus can infect, of most viruses.Nomenclature-wise, viruses that only infect bacteria are called bacteriophage, and viruses thatonly infect animal cells and plant cells are called (wait for it) animal viruses and plant viruses.Some plant viruses are able to infect and use insects as vectors for spread of infection.
Viruses demonstrate one of two general lifecycle types. The lytic cycle describes how virusesinfect cells, use their nucleic information to synthesize viral proteins, replicate their nucleic infor-mation, assemble within the cell, and then lyse the cell to release new infectious viral particles.The alternative lysogenic cycle involves viruses infecting cells, but instead of culminating in lysis,these cycles culminate in the insertion of their own nucleic material into the genome of the host, asa prophage, where the DNA lies dormant and is replicated when the cell replicates. Under certainconditions, the prophage will then exit the nucleic material and then resume the lytic cycle. Thiscontrol allows viruses to prevent themselves from exterminating a population and encourages fastergrowth when it is sustainable. Lysogenic viruses are oftentimes called temperate viruses.
48

21.2 Animal Virus
Bacteriophages have ready access to the nucleic information (there is no nucleus in a prokaryote)and much simpler regulatory systems to contend with. There are six classes of viruses dividedmostly by type of nucleic information and process by which it is used:
1. Class 1 - Class 1 viruses are viruses that use dsDNA as a source of nucleic information.The dsDNA of Class 1a viruses enters the nucleus and cellular machinery is employed totranscribe it to mRNA. The dsDNA of Class 1b viruses carry their own transcription enzymesand all of replication occurs in the cytoplasm.
2. Class 2 - Class 2 viruses have ssDNA (selection of plus or minus strand is up to the virus andsometimes the virus doesn’t care). This is then copied into dsDNA and then used to makemRNA.
3. Class 3 - Class 3 viruses use dsRNA. The minus strand is then used to direct the synthesisof plus strand mRNA. To date, all Class 3 viruses have been shown to have segmentedgenomes, multiple dsRNA molecules each encoding only one or two polypeptides. Theyhave their own enzymes to produce mRNA.
4. Class 4 - Class 4 viruses use a single plus strand of RNA. This is used to create a minusstrand which is then used to create more plus strand RNA which is then used as mRNA.Class 4a viruses synthesizes a single polypeptide form a long mRNA strand and then cleavesthe polypeptide into the individual proteins. Class 4b viruses synthesize at least two strandsof mRNA (at least one of which is the full-genome-length) all of which are translated intopolyproteins.
5. Class 5 - Class 5 viruses contain a single minus strand of RNA. The viruses each use a RNA-dependent RNA polymerase to synthesize mRNA for use. Class 5a viruses encode multiplegenes on the one strand of mRNA, of which individual mRNA’s encoding each of the genesare made. Class 5b viruses employ segmented genomes, although some of the RNA strandscan encode for multiple peptides by having the ribosome shift reading frames.
6. Class 6 - Class 6 viruses are more commonly referred to as retroviruses. Their capsidsencapsulate two identical plus strands of RNA. These are then used to synthesize minusstrand DNA via reverse transcriptase. This is then used to make plus strand DNA andthe dsDNA is then integrated into the genome to enter a lysogenic-like phase as a provirus.
49