Embed Size (px)
Citation preview
Part III: Programmatic Cost AnalysisAssessing Resources: The Third of a Five-Part Series

Slide 1
This module discusses programmatic cost analysis. This type of analysis assesses the resources required to implement an intervention or program, and the costs associated with the use of those resources.
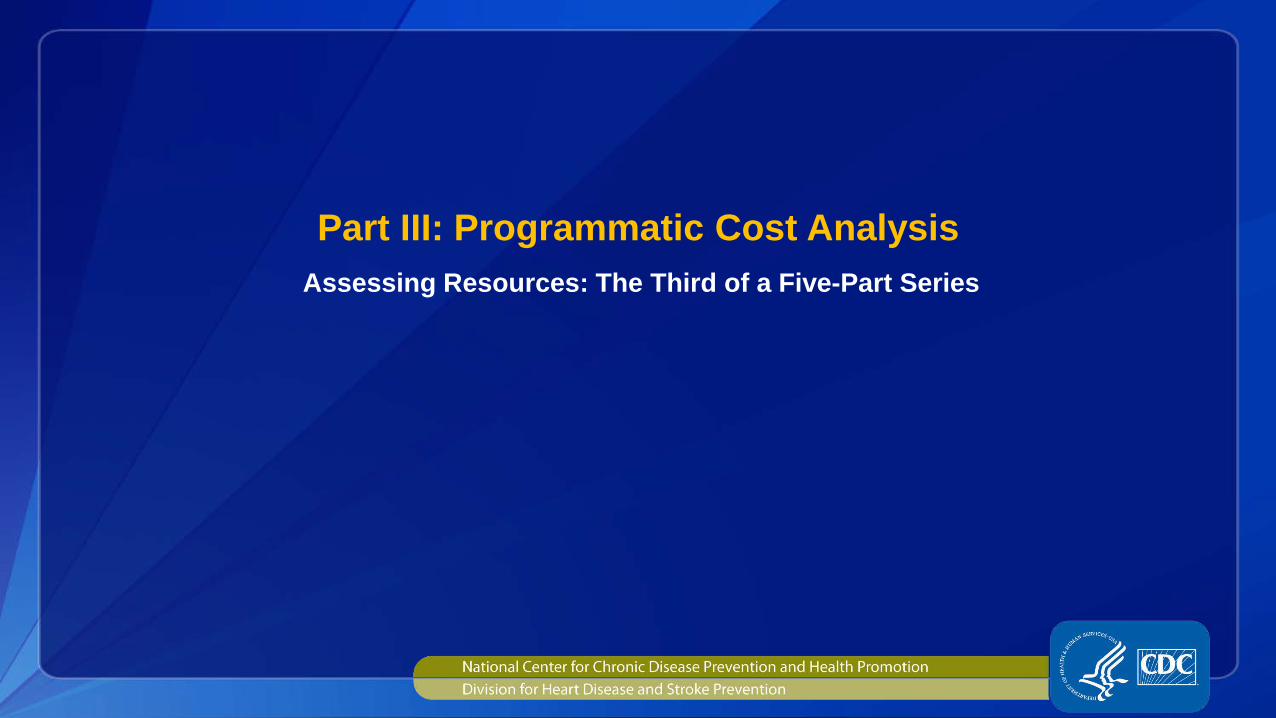
Various Terms for Cost Analysis
Cost minimization
analysis
Cost outcome analysis Cost
consequence analysis
Resource Assessment

Slide 2
The terminology used in the field is somewhat vague and inconsistent. Programmatic cost analysis may be called cost outcome analysis, cost minimization analysis, or cost consequence analysis. In essence, the idea is that you assess the resources required to implement an intervention. When looking at the unit of service delivery, such as participants or patients, program costs can also be compared to these process-level outcomes.
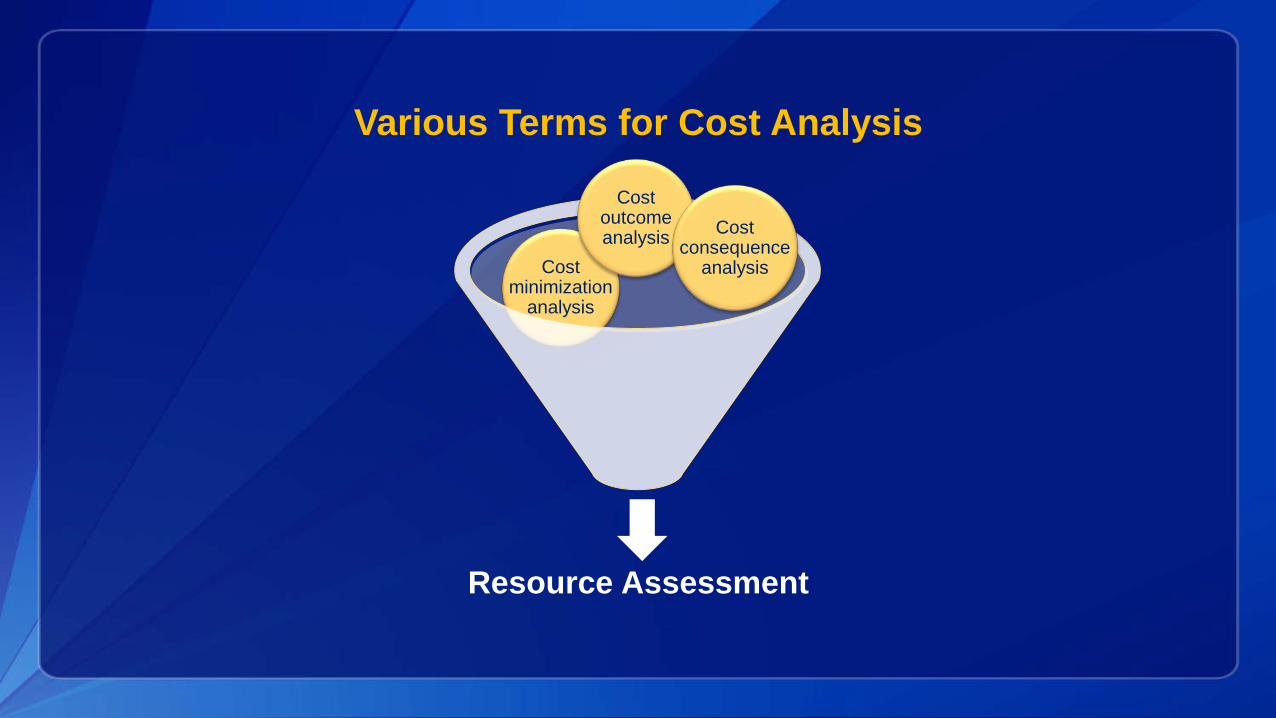
Public Health Model for Prevention
Problem Identification
Program and Policy Development
Program and Policy Evaluation
Implementation andDissemination
Risk and ProtectiveFactor Identification
Economic Impact –
COI
EconomicEvaluation
CostAnalysis
EconomicEvaluation
Slide 3
Assessing programmatic costs can be done at several points within the public health model for preventing cardiovascular disease. If you plan to assess costs associated with your program or intervention while you’re developing the program, you’re conducting a prospective cost analysis. Cost analysis can also be conducted alongside program evaluation. In this case, costs can be assessed prospectively—that is, while the program is being evaluated for efficacy or effectiveness. Or costs can be assessed retrospectively if the efficacy or effectiveness of the program is already being shown. Prospective collection of programmatic costs is preferred, because you can ensure that all costs are collected systematically. When you conduct retrospective assessment of program costs, you sometimes find that data on the use of resources were not collected at all or were collected in a way that’s not useful to the cost analysis. Finally, cost analysis is often conducted once the program is in the widespread dissemination and implementation phase. The rationale for doing so can be:
• To determine how costs vary across sites or populations, perhaps using varying implementation strategies, or
• To determine whether there are inefficiencies in the use of resources or costs. This approach looks at average costs of the program based on whatever process variables are collected. These could include the number of participants, number of sessions provided, or number of health education packets disseminated.
A thorough cost analysis serves as the foundation for conducting other economic analyses, like cost-effectiveness or ROI analyses, and helps ensure their accuracy.
Program Costs
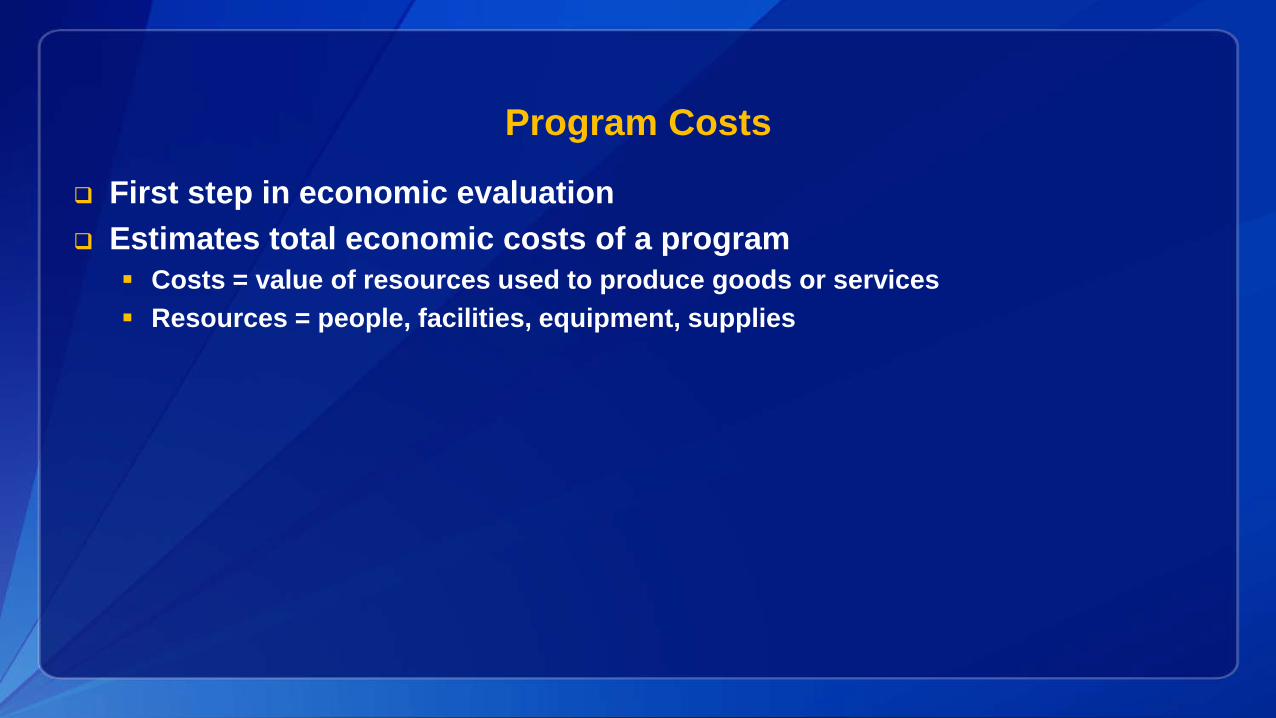
First step in economic evaluation Estimates total economic costs of a program
Costs = value of resources used to produce goods or services Resources = people, facilities, equipment, supplies
Slide 4
Assessment of program costs is often the first step in conducting any type of economic evaluation, whether it’s benefit-cost analysis or cost-effectiveness analysis. This step is the hardest in terms of time and data collection required. Consequently, not much attention is paid to programmatic costs in the economic evaluation literature for public health interventions. Unfortunately, published guidelines on how to conduct programmatic cost analysis are limited, but there are a few references at the end of this presentation that might be helpful. Program costs can be defined as the resources required to implement a program and the costs associated with those resources. The term “resource” generally means the personnel required, the space needed to deliver the intervention, the utilities or overhead costs, and the necessary equipment and supplies. The costs associated with these resources include the financial and economic costs. These terms will be explained in detail as the presentation progresses.
Financial Costs
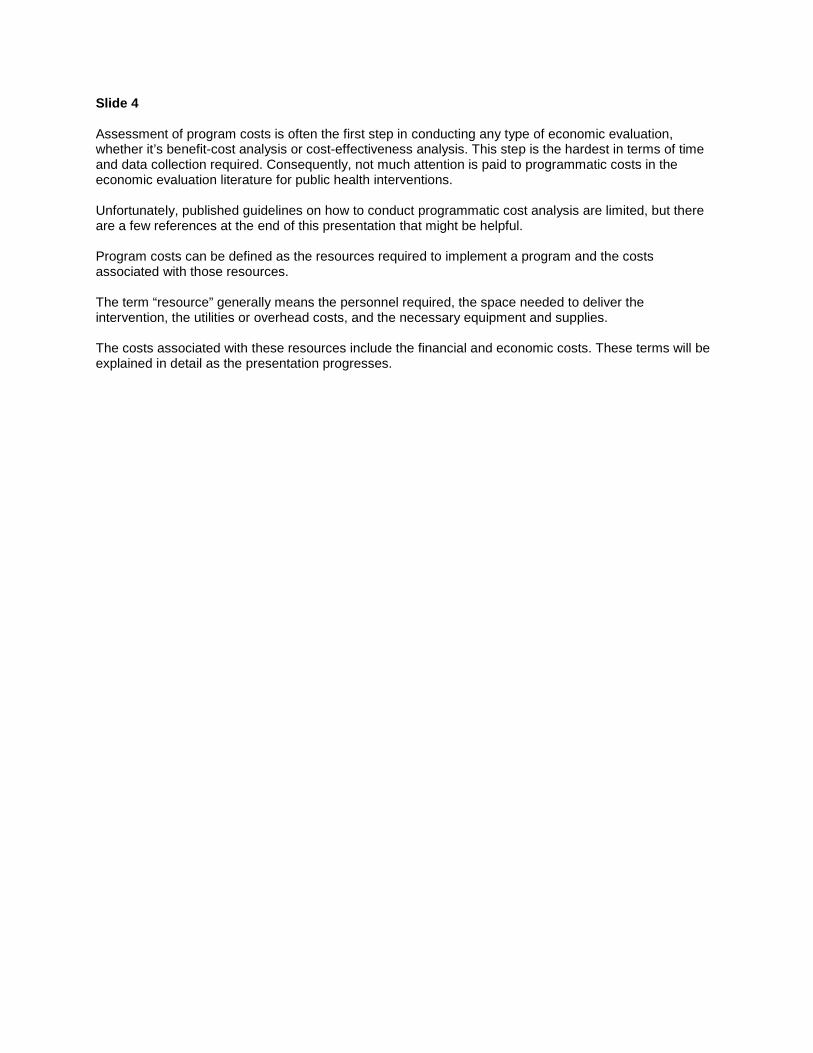
Financial costs Expenditures for resources to implement the program, based on market prices Often in the budget proposal Convenient, sometimes incomplete measure of costs
Examples Salaries for project personnel Supply costs Computer purchases Cost of curriculum materials

Slide 5
When we think of costs in everyday life, we think of the financial costs of the things we use or purchase—the price tag or market price we see in the store. Most material resources have a price. For example, personnel time required to implement an intervention has a price defined by hourly wage. Many prices are easily available, and most exchanges in our society are based on a monetary value understood by all. The financial costs associated with running a program or intervention are those found on the budget sheet. However, financial costs are only a convenient and often incomplete measure of costs, and many programmatic cost analyses do nothing more than include this amount.
Economic Costs
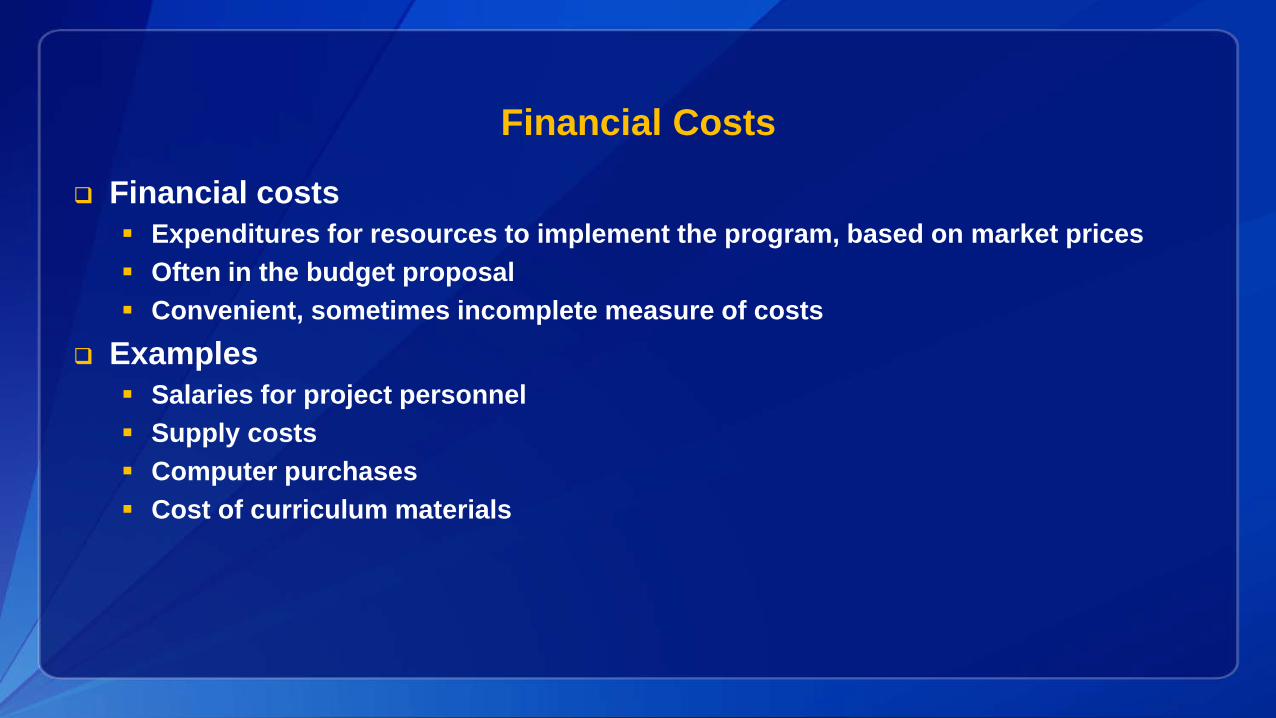
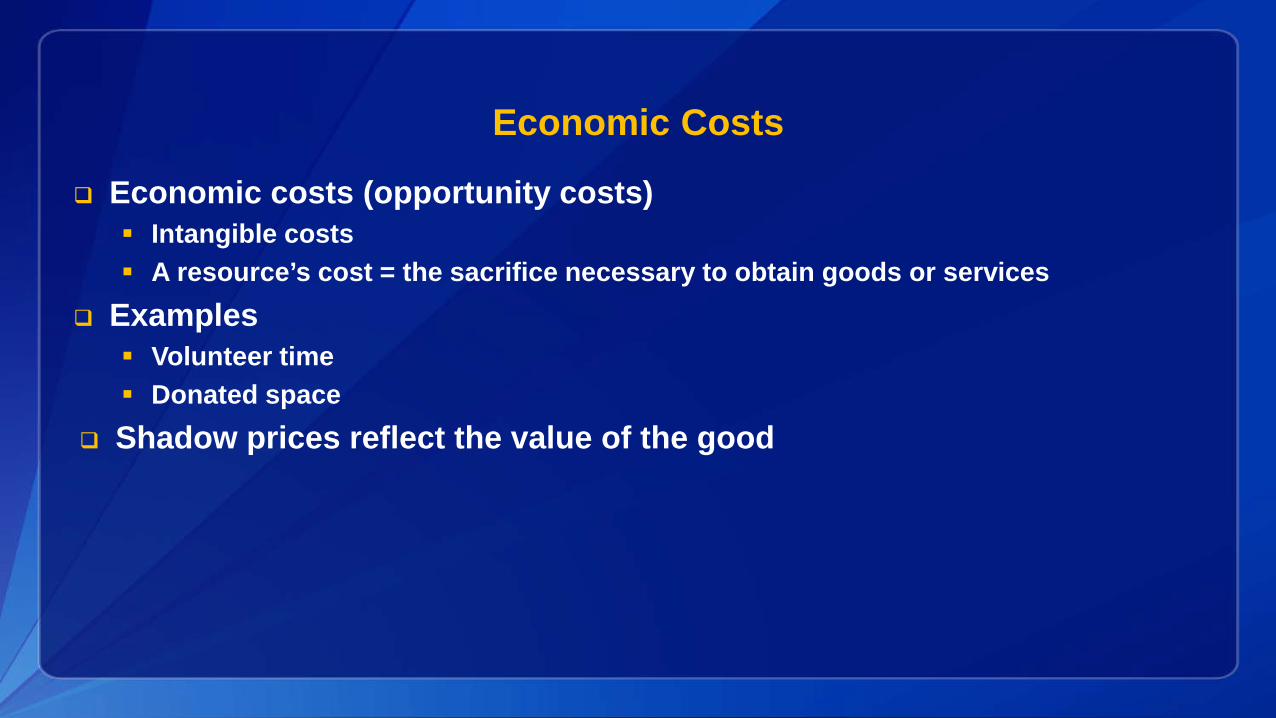
Economic costs (opportunity costs) Intangible costs A resource’s cost = the sacrifice necessary to obtain goods or services
Examples Volunteer time Donated space
Shadow prices reflect the value of the good
Slide 6 Estimating the value of a resource is more complex than just reading a price tag, because financial costs give incomplete information. What do we mean by that? What we’re interested in with programmatic cost analysis is not just the exchange value, or market price, of a good or service. We’re also interested in the value of the resources that go into its production, which can also be considered as your intangible costs, whereas the financial costs can be considered tangible. The market price may not reflect that. A seller may be overcharging because there’s no competition. Or the good may be subsidized as a favor to the producer or as social policy. Or the good may not have a fair market value at all because no money changes hands in the use of that resource. For example, volunteer time and donated space required to implement an intervention may not show up on the program’s budget sheet, because no money was required for their use. Yet they represent a real cost of the program in terms of opportunities that would be lost if the resources were used for another purpose. If Nurse Alice weren’t volunteering for your hypertension screening program, she could be volunteering at a domestic violence shelter instead. The value of her volunteerism to the hypertension program should be included. Valuing opportunity costs can be tricky, depending on the good to be valued. In general, you can use a person’s average wage to put a value on volunteer hours, or you can use a similar market value for the same type of good. In the example of donated space, you could use the average cost of renting business space in the same community. Some people use shadow pricing, which adjusts some of the financial costs in your programmatic cost analysis to reflect real value of the good. For example, if your intervention included an overnight stay in the hospital, you might not want to use the average charge for a hospital stay but, rather, the amount that the hospital is actually reimbursed. Hospital charges represent an inflated value of the actual resource to account for different insurance reimbursement practices and uncompensated care.
Example Classification Systems
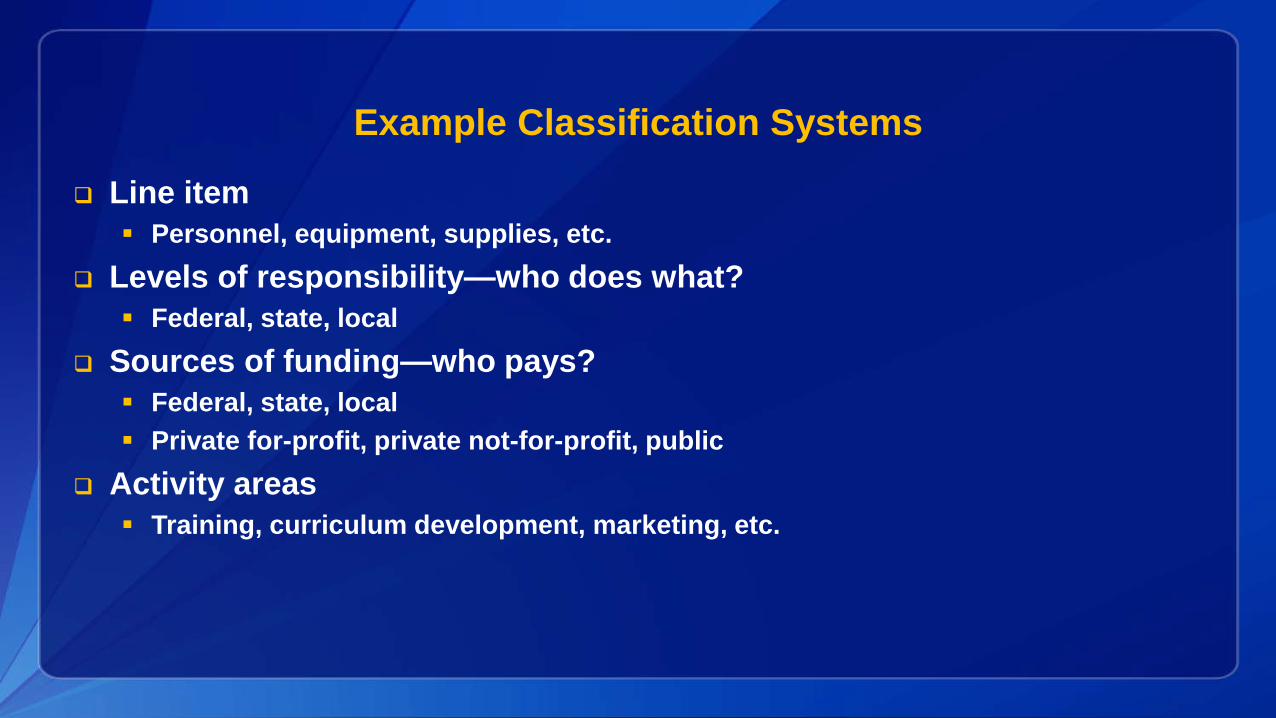
Line item Personnel, equipment, supplies, etc.
Levels of responsibility—who does what? Federal, state, local
Sources of funding—who pays? Federal, state, local Private for-profit, private not-for-profit, public
Activity areas Training, curriculum development, marketing, etc.
Slide 7
The first step in a programmatic cost analysis is to develop a classification system for how costs will be collected. Many classification systems are possible, as long as they meet the criteria that we’ve just defined. The most commonly used is probably the line item model, which is similar to the classification used in accounting and budgets. It’s also called classification by function. It might be useful to categorize costs by level of responsibility or source of funding, when it’s important to keep track of who does what and who bears the costs. It’s also possible to use two classification systems simultaneously, first by source of funding, for example, and then by line item.
Common Cost Analysis Strategies
Define list of intervention activities Pre-implementation vs. implementation phases Direct client, indirect client, direct administrative, indirect administrative
Define cost categories within each activity Personnel, travel, space, supplies/equipment
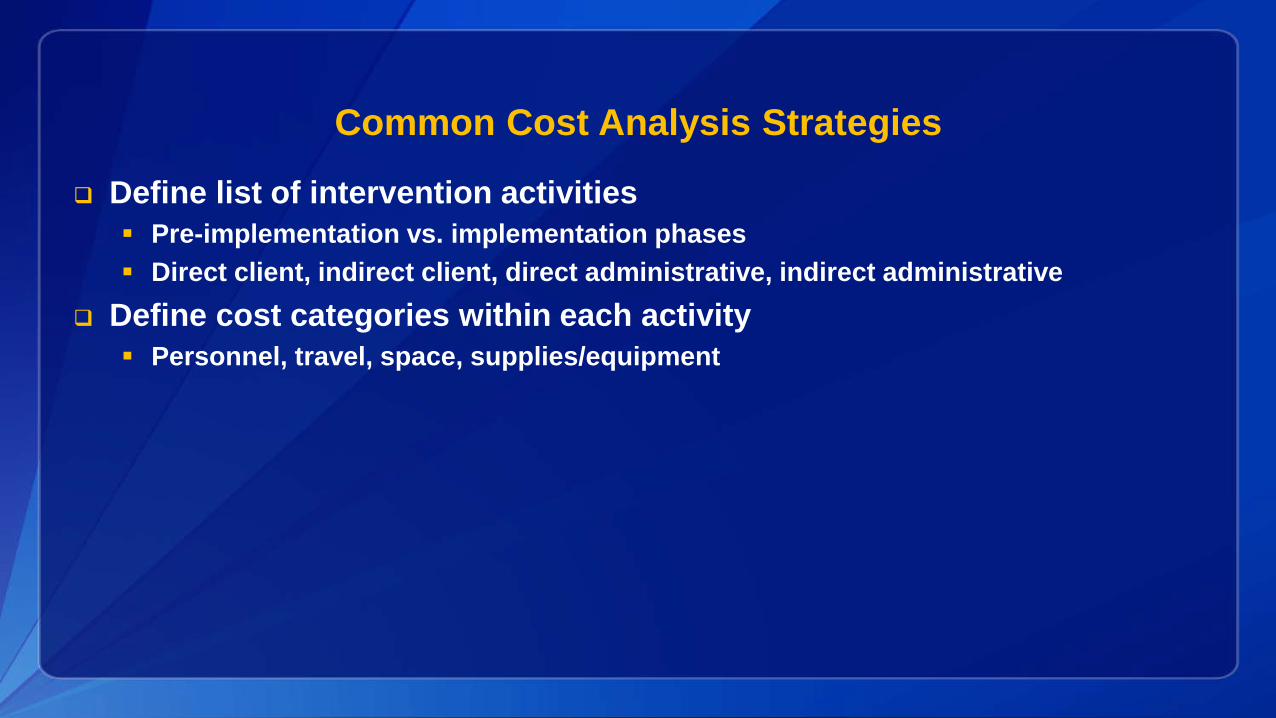
Slide 8
The most common way of categorizing costs is to define the list of intervention categories by activity level. This requires taking particular care to differentiate between those activities that occur in the pre-implementation phase and those that occur during the actual delivery of the intervention. This is because the activities are often different in the two phases. For example, in the pre-implementation phase, a lot of resources may be used to recruit participants. Once they’ve been recruited and the intervention is under way, this type of activity may no longer be relevant. Another way to think about intervention activities is to consider those activities that relate to direct service provision versus those that are administrative. For example, you might want to know the personnel time devoted to direct interaction with a participant. You might find that in a multisite replication of an intervention, considerable variation exists in administrative costs of running the program—and, more importantly, wide variability in actual delivery of the intervention, which may affect outcomes in the end. Once the activities are defined, one option in conducting programmatic cost analysis is to categorize costs within each category, based on the four main cost drivers for most interventions. These are:
• One: Personnel time; • Two: Travel costs; • Three: Space and utilities; and • Four: Supplies, materials, and equipment.
Defining Cost Categories: Example
Type of Activity Activity Description
(D) Direct: Client-focused, face-to-face activity
a. Advocateb. Assessc. Counseling support
(I) Indirect: Collateral activities on behalf of client systems
a. Advocateb. Clinical documentationc. Research resources
(AC) Administrative-Client: Related to client activities
a. Give supervisionb. Receive supervision
(AP) Administrative-Program: Related to programmatic/management activities
a. Plan and manage collaborative groups
b. Reporting to funders

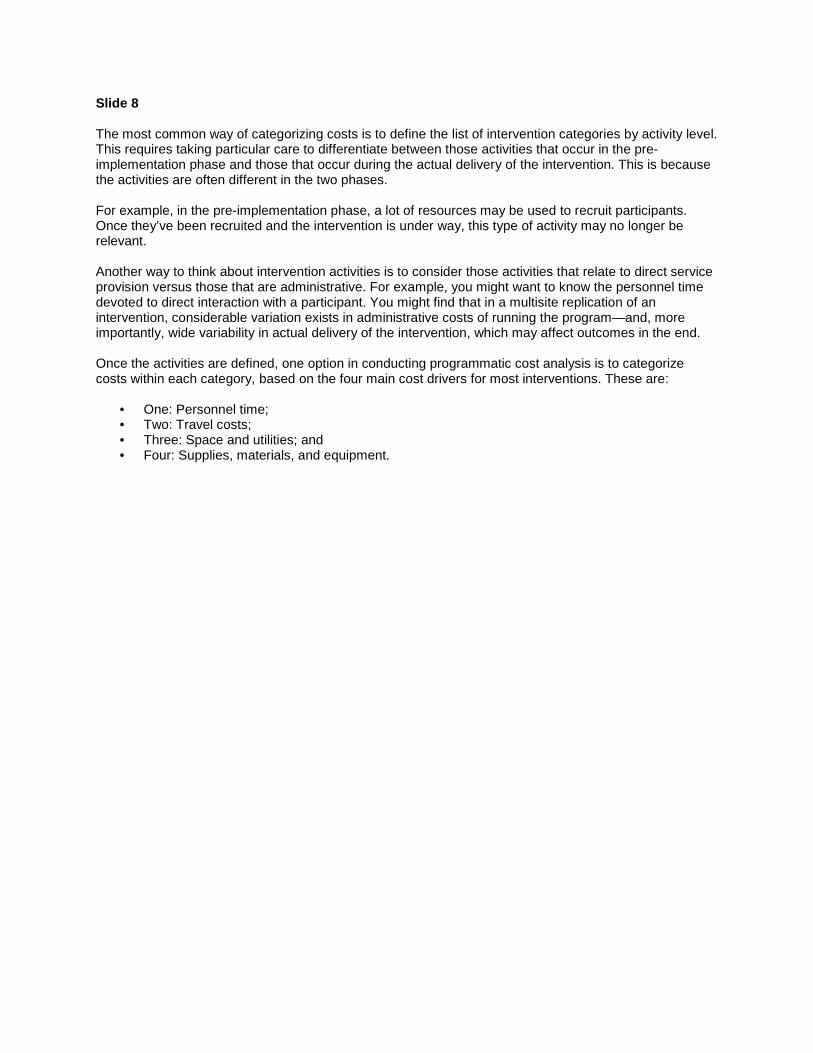
Slide 9
Here’s an example of how one program categorized costs. This is a behavioral intervention that included specific activities defined as either client-related or administrative. The program also wanted to make the distinction between client-related activities that included direct contact and client-related activities that were done on behalf of the client. For administrative activities, the program felt it was important to highlight those activities done on behalf of the client versus those activities that were necessary to keep the whole program in operation. This distinction will become important later, when we discuss fixed versus variable costs.
Costs NOT to Include
Costs associated with evaluating the program Unless it is essential that evaluation be part of future program implementation
Costs outside the perspective of the study Example: health system vs. community-based partner
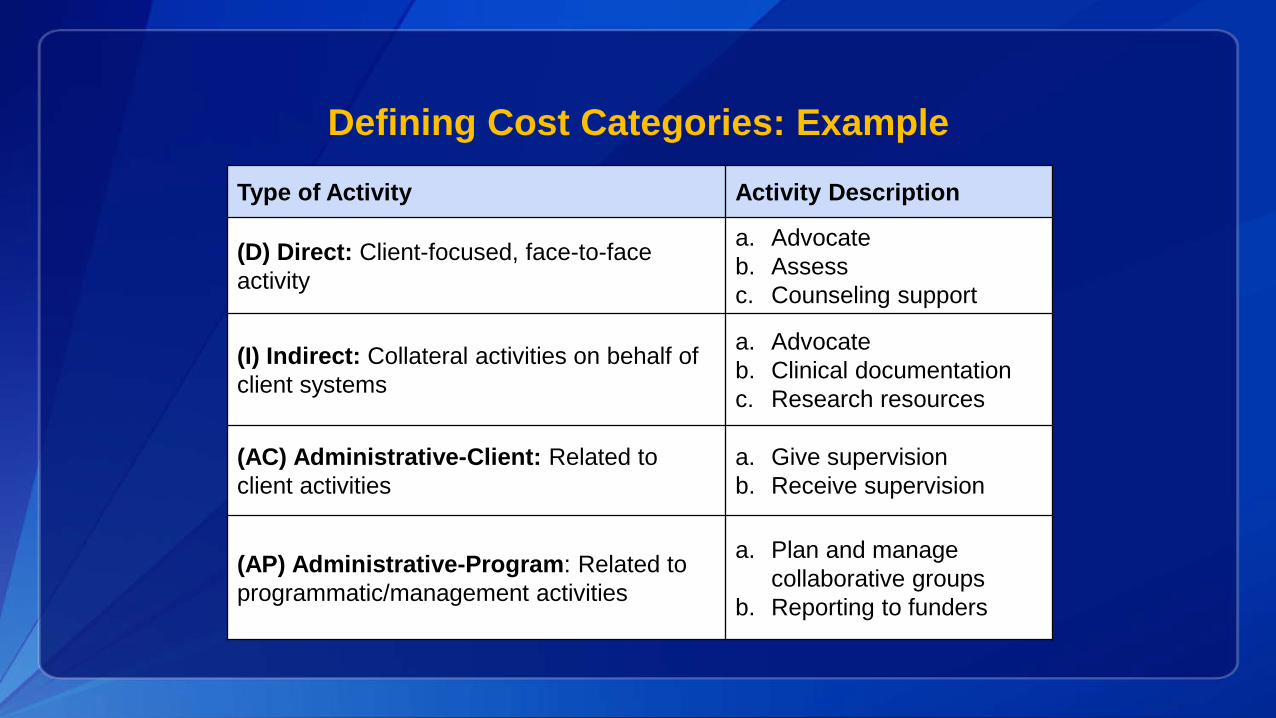
Slide 10
Defining the scope or scale of the study will help determine which costs to include in the programmatic cost analysis and which costs to exclude. For example, in many cases, costs are assessed alongside a program evaluation. If evaluation is not critical to the successful delivery of the intervention, then those costs should not be included. However, for many interventions, evaluation is built into the program and would be included if the program were implemented elsewhere. In these cases, the costs of evaluation would be included. An example of including evaluation in the programmatic cost analysis is the WISEWOMAN program. For WISEWOMAN, evaluation is related to clinical quality control in terms of monitoring the protocols on screening, and referrals of “alert values” are followed. Therefore, these costs would be included. When defining the scope and scale of an intervention, the perspective is also important in determining which costs to include. If the programmatic cost analysis is being conducted from the perspective of a health system delivering an intervention, then you might not want to include any non-health system costs.
Program Cost Inventory
Do not overlook... Resources that are hard to measure or value Resources used in small amounts Resources procured without money
• Volunteer time• Parent/caregiver time• Intervention recipient time• In-kind contributions/donated materials• Existing resources
Slide 11
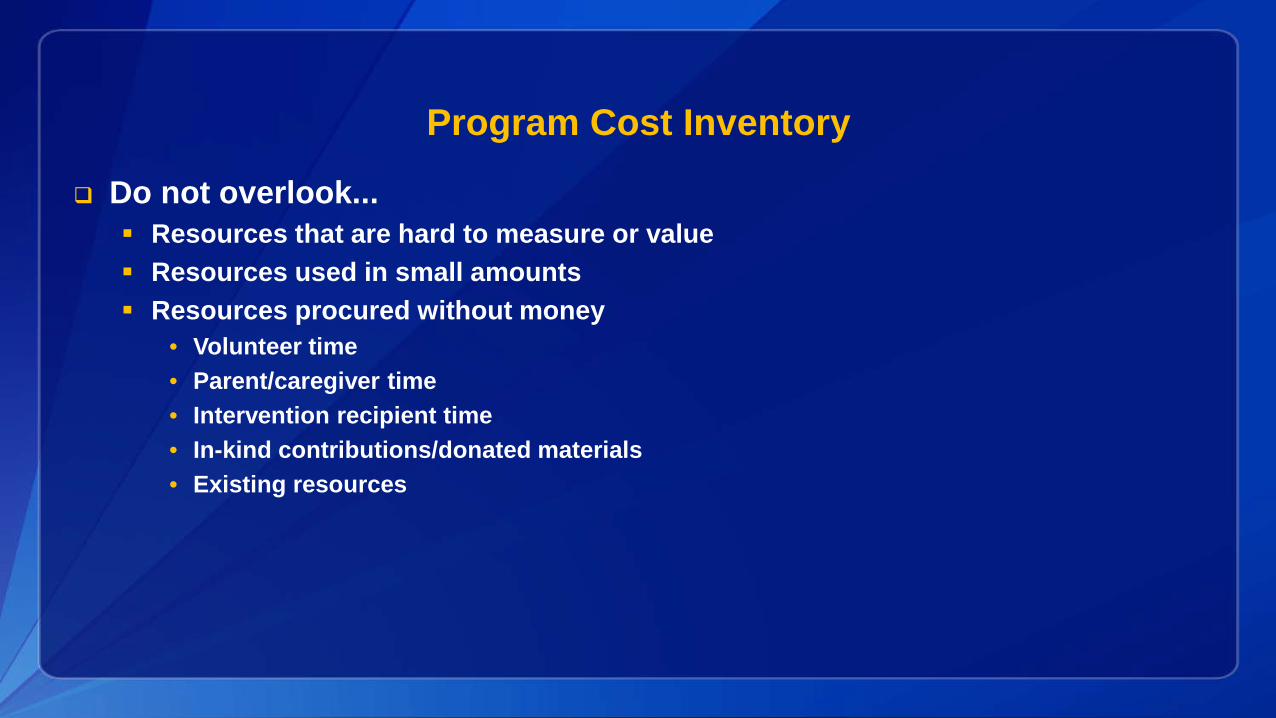
Some costs and resources are easily overlooked. Some resources are hard to measure or value. One example is time. Time lost can be hard to measure and value. Think of all the time spent in a doctor’s waiting room. Nobody really tracks it, especially if you don’t officially take time off from work to be there. The amount of time dedicated to various activities can also be hard to measure, such as nurses accomplishing several tasks at the same time, or dealing with several patients at once. If the task of measuring is complex or intimidating, in terms of the resources required to collect data, the evaluator may be more likely to find ways around it or simply ignore it. This could undermine the validity of the study results. Resources used in small amounts can also be hard to measure, but they add up when multiplied by a large number of patients. For example, individual stamps are inexpensive, but 55 million stamps can cost millions of dollars. As discussed previously, resources obtained without monetary exchange are important to consider in a programmatic cost analysis when looking at economic costs versus financial costs. If the resources are necessary to produce the intervention, then they need to be taken into account. For example, caregiver time is a very important category of costs for heart disease and stroke prevention. The impact on family members’ time can be significant. Even with hypertension, dietary changes required may take the spouse’s time to change cooking habits and find new recipes. Another example is lifestyle intervention programs. It may not be obvious that a time cost is involved, but these costs could be substantial.
Measuring Resource Use
Average vs. marginal costs Depends on how study is framed
What are you comparing costs of implementing program against?• Doing nothing?• The status quo?• Other interventions?
Slide 12
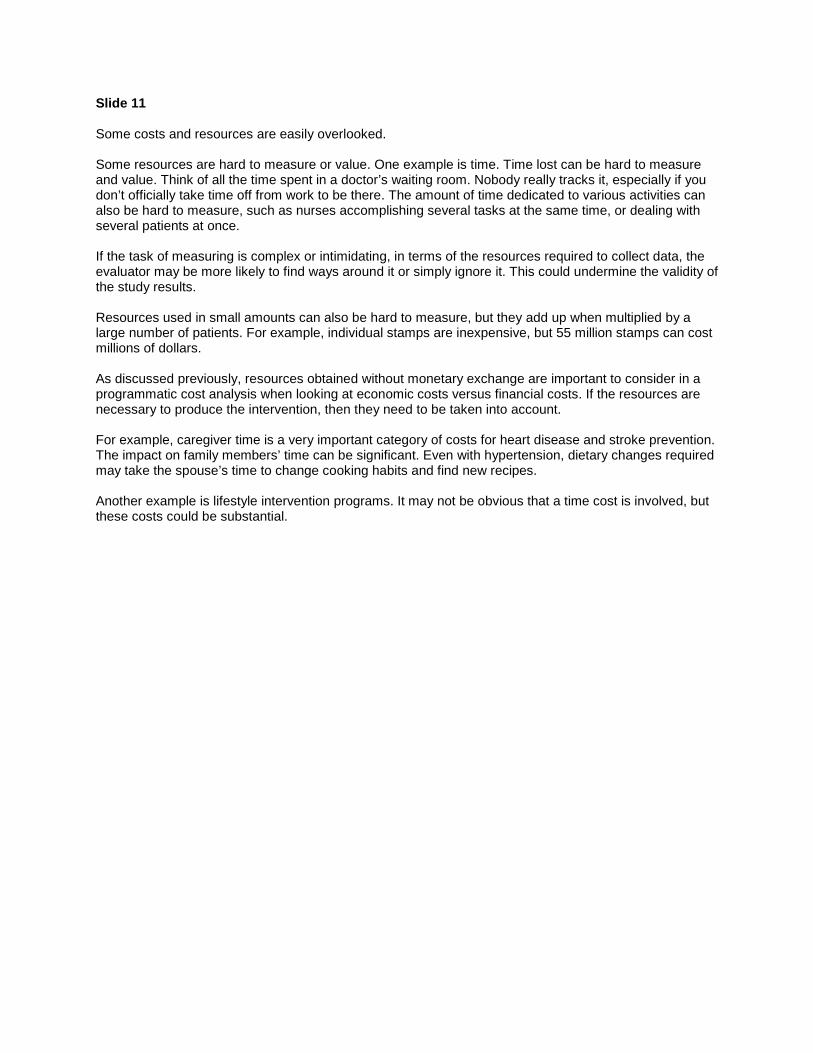
Another way you might consider assessing programmatic costs is in terms of average versus marginal costs. It really depends on what your study question is. “Average costs” refer to the total costs of the program, divided by a process outcome of interest—for example, the number of participants. “Marginal costs,” sometimes called incremental costs, are the additional costs of resources required to implement a program as an add-on to another existing program. In this case, the costs of the original program are held constant and are not considered; you just assess the costs of the additional resources. Or, if you’re considering only one program, marginal costs could be defined as the additional resources required to provide the intervention or program to one additional participant. For example, if you’re interested in knowing how much a lifestyle intervention costs as an add-on to an existing program or to the status quo, then you might want to only look at the marginal set of resources required to implement the add-on. Conversely, you may want to look at the costs of implementing a program in a community where nothing is currently being done to address the same health outcome. In this case, you would want to assess the total costs of the program, or average costs if you will compare total costs to some process-level outcome, such as the number of participants.
Measuring Resource Use
Fixed vs. variable costs Variable costs vary with activity level Fixed costs are constant despite volume of activity
Operating vs. capital costs Annual costs should be assessed by accounting for capital expenditures
Slide 13
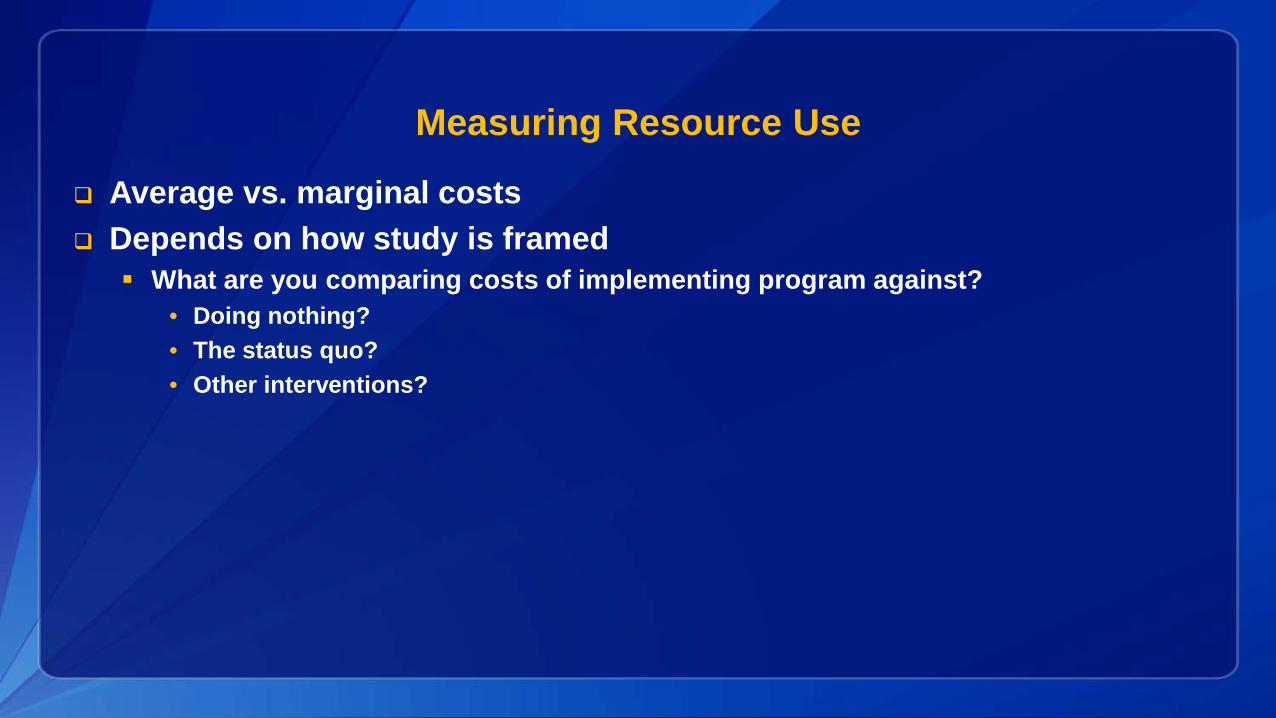
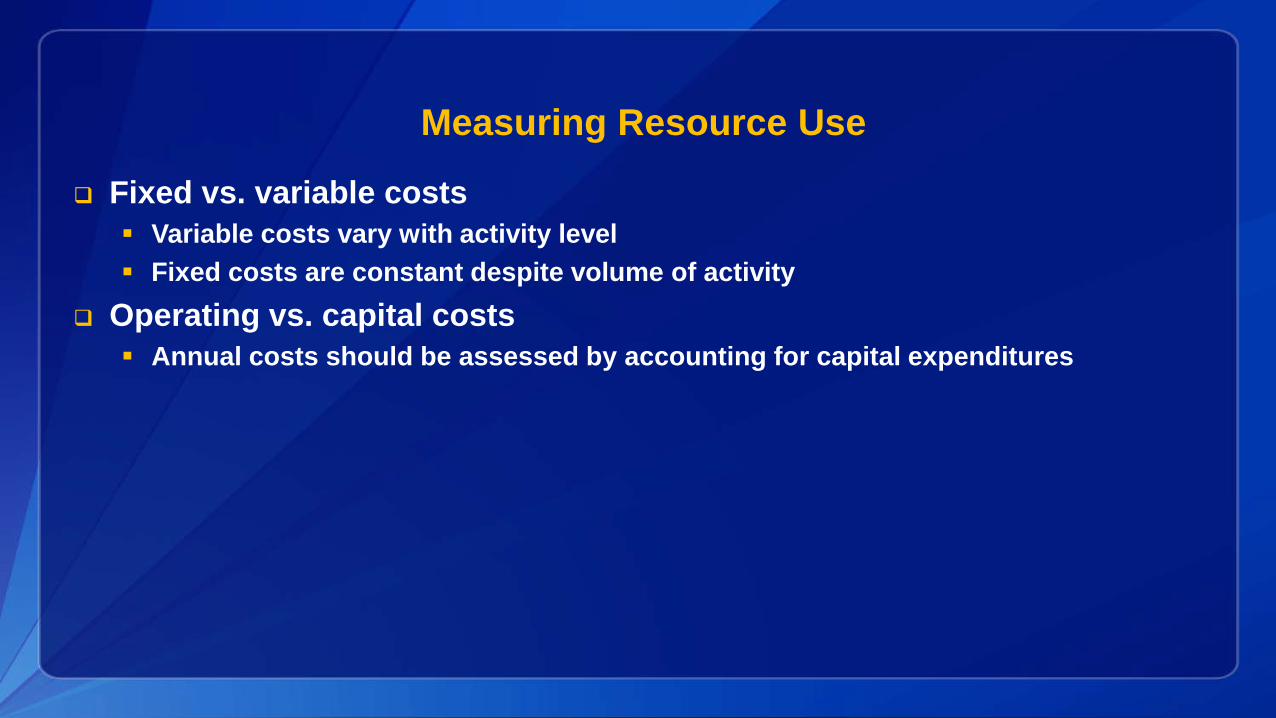
Another important distinction must be made between fixed costs and variable costs. Variable costs vary with the level of activity. The amount of resources used will increase if the level of activity increases. For instance, transportation vouchers for program participants are a variable cost, because the more patients seen and tested, the more transportation vouchers the program will consume. Fixed costs, on the other hand, remain constant, even when the activity level varies. Monthly rent for the same screening program is a fixed cost. It will be the same no matter how many patients are seen that month. In the long term, all costs are variable costs. The distinction between fixed and variable costs in programmatic cost analysis assumes two things. First is a short-term perspective. That means that even the rent will change eventually, but in the short term, it will remain relatively stable. The second assumption is a given capacity. If the level of activity increases so much that the program doesn’t have the capacity to absorb more clients, then you will need to move to a bigger space with a higher rent. But the distinction is still important. You must identify variable costs so that you may vary them accordingly in your calculations. When you’re doing cost projections, variable costs are especially important to assess whether program activities should be expanded or downsized. It may not be as expensive as you think to expand the program, if you have the capacity, because fixed costs won’t increase; only variable costs will. Another distinction to consider is one-time versus day-to-day expenses. One-time expenses, or capital expenditures, are expensive items necessary to run the program, like computers or office furniture. Other costs are required for the day-to-day operation of the program. This distinction is important. When you present your programmatic cost analysis results, if you have many capital expenditures in the first year, then presenting an average annual cost may be misleading. One way to address this misperception is to smooth out the costs of the capital expenditures over the length of the project. For example, if you purchase a 2,000-dollar computer in year one of a 5-year intervention, then the annual value of that computer is approximately 400 dollars per year. This is a very simplistic way to smooth out capital expenditures, because it assumes that the computer has no scrap value at the end of the intervention and that future values are worth the same as present values. But this will still work to calculate an average annual cost more accurately.
Sources for Measuring Resource Use
Primary data collection Accounting and payroll systems Records Questionnaires Observation
Published literature Professional guidelines
Slide 14
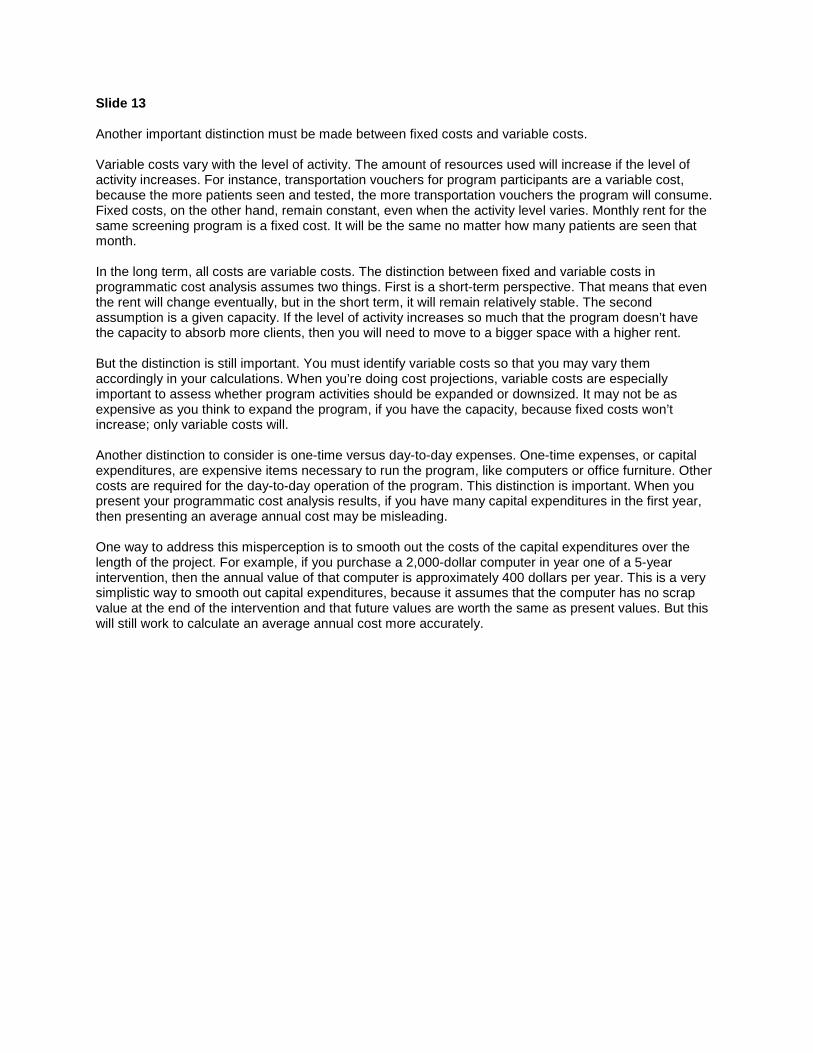
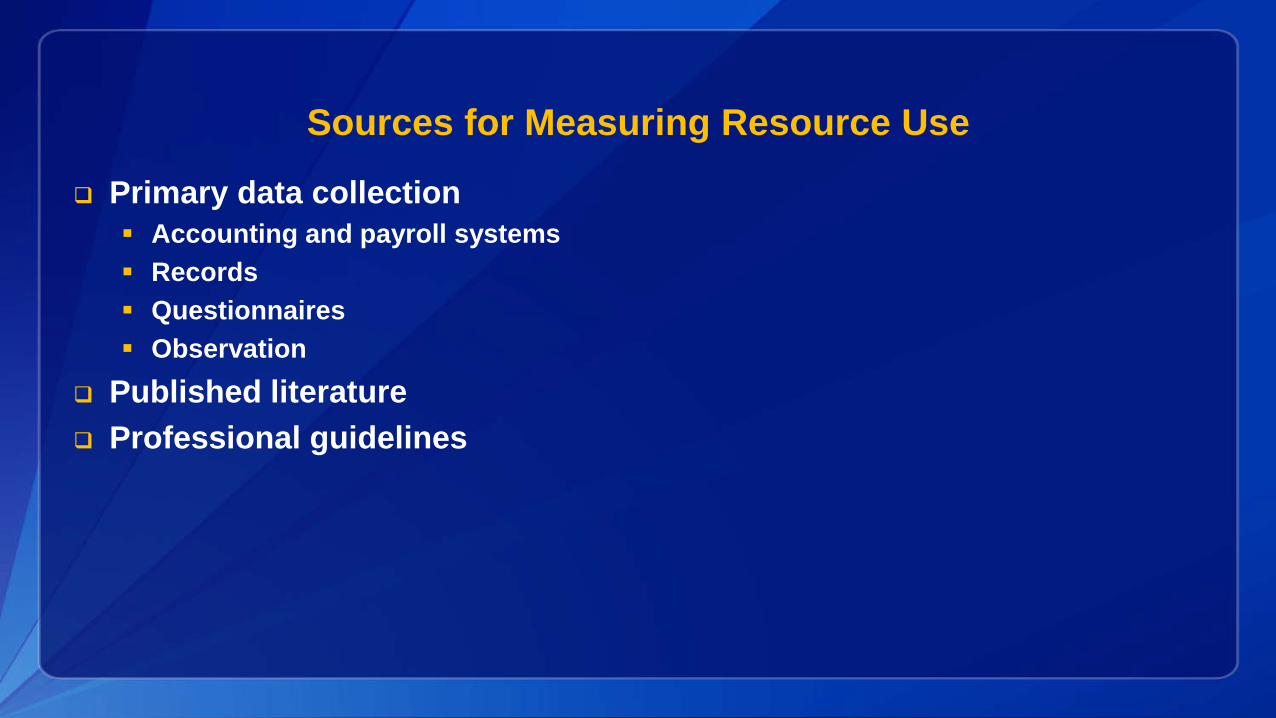
After identifying all the necessary resources, we need to assess how much of each resource is required to carry out an intervention. We define quantity in a broad sense; it includes tangible, material items, such as supplies, as well as intangible items, such as labor and time. Resource use can be measured in physical units or in the percentage of use for shared costs, like use of a vehicle by more than one program. There are several ways to do that. First, some information about quantities used may be available from the primary data gathered for the analysis. In the case of an existing program, a lot of information can be gathered from payroll and accounting systems. You can also collect costs yourself. To collect costs retrospectively, you look back at how the intervention was implemented and come up with approximations of the resources and their costs required to implement the intervention. You can also collect costs prospectively as the intervention is implemented. One technique involves using surveys to collect programmatic cost data. You can survey participants, medical staff, physicians, administrators, and others. For example, let’s say you need an estimate of the time spent traveling to and from the intervention site. You could survey the intervention patients and average out the answers. In this case, of course, you are relying on the accuracy of participants’ reports. You could also conduct a time study. For instance, community health workers can use a data collection instrument to track the time spent working with patients, connecting them to resources, documenting progress, etc. The CHW would log how much time he or she spends completing these tasks for a specified period of the study. For both questionnaire surveys and time studies, you need enough observations to calculate a representative average. To ensure that you have an unbiased estimate when surveying, you must consider a variety of issues. For example, if you interview only five participants, and they all happen to live far from the facility, you may overestimate the amount of time it takes to travel to the facility. On the other hand, if you interview only the five participants who have a car and who don’t need to take public transportation, you may underestimate the time that is necessary. The published literature can also be a source of information. For example, if you need to know the average length of time people remain hospitalized for congestive heart failure, you can search for articles on that topic. In this case, clinical trial reports can be very useful. A range of estimates may be available, and you would then contemplate doing a sensitivity analysis.
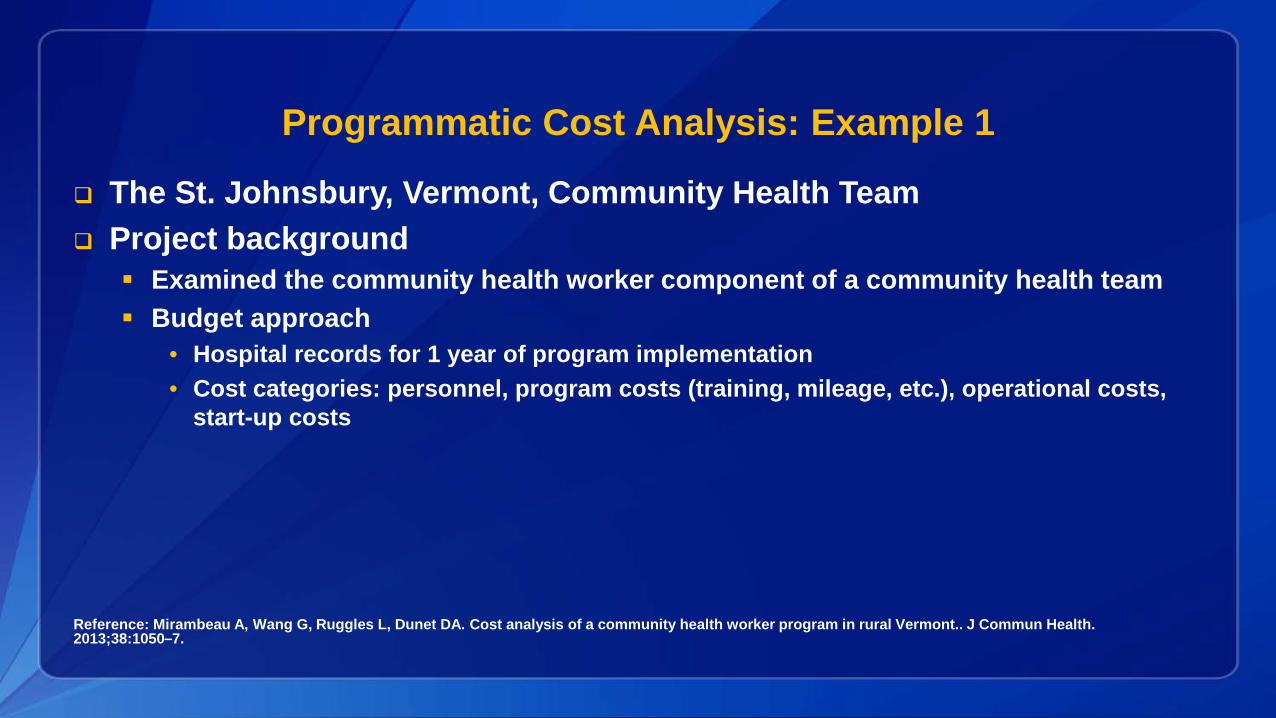
Programmatic Cost Analysis: Example 1
The St. Johnsbury, Vermont, Community Health Team Project background
Examined the community health worker component of a community health team Budget approach
• Hospital records for 1 year of program implementation• Cost categories: personnel, program costs (training, mileage, etc.), operational costs,
start-up costs
Reference: Mirambeau A, Wang G, Ruggles L, Dunet DA. Cost analysis of a community health worker program in rural Vermont.. J Commun Health. 2013;38:1050–7.
Slide 15
Here is an example of a programmatic cost analysis of the Georgia stroke and heart attack prevention program. Data were obtained from hospital records that allowed for assessing program costs. The authors relied on a retrospective review of the budget data available to measure costs in four areas: personnel, program costs (training, mileage, et cetera), operational costs, and start-up costs. The following article can be referenced for further detail on the outcomes of this study: Mirambeau, A, Wang, G, Ruggles, L, and Dunet, DA. Cost Analysis of a Community Health Worker Program in Rural Vermont. Journal of Community Health, 2013, volume 38, pages 1050 to 1057.
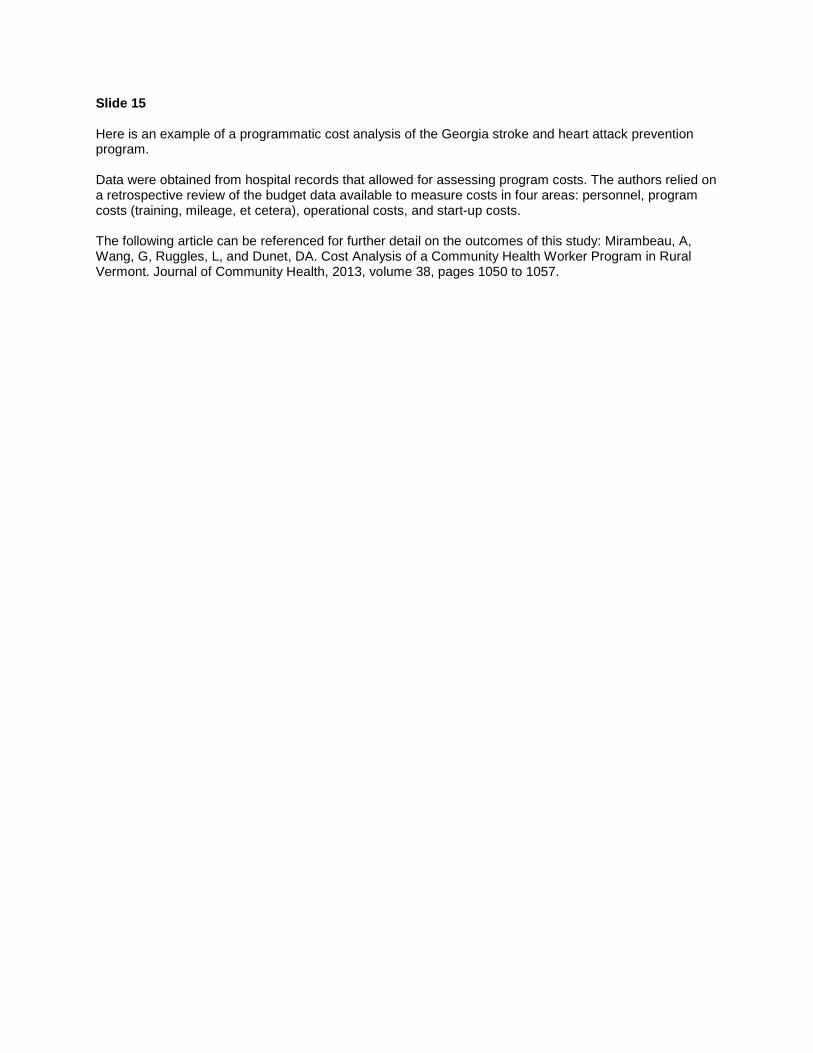
Program Cost: Example 2
WISEWOMAN Offered to participants in breast and cervical cancer screening program
Activity-based approach Prospective data collected twice a year from each project site Labor, materials, and contract costs by activity
• Outreach and follow-up• Screening• Intervention sessions
Estimated additional office visits and medications (not paid for by program)
Finkelstein EA, Khavjou O, Will JC. Cost-effectiveness of WISEWOMAN, a program aimed at reducing heart disease risk among low-income women. J WomensHealth. (Larchmont). 2006;15(4):379–89.
Slide 16
Because programmatic cost analysis is often the first step in an economic evaluation, published economic evaluations include quite a few details on this portion of the evaluation. An example is the cost-effectiveness analysis of the WISEWOMAN program. To assess programmatic costs in this study, the authors used an activity-based approach. They defined the activities associated with the intervention and then assessed the resources required for each activity. The authors collected costs prospectively as the program was implemented. The three main activity areas included outreach, screening, and intervention sessions. In addition to costs from the perspective of the program implementer, the authors also included those costs not paid for by the program, including costs to participants associated with extra office visits and medications.
Example 2: WISEWOMAN Cost Analysis
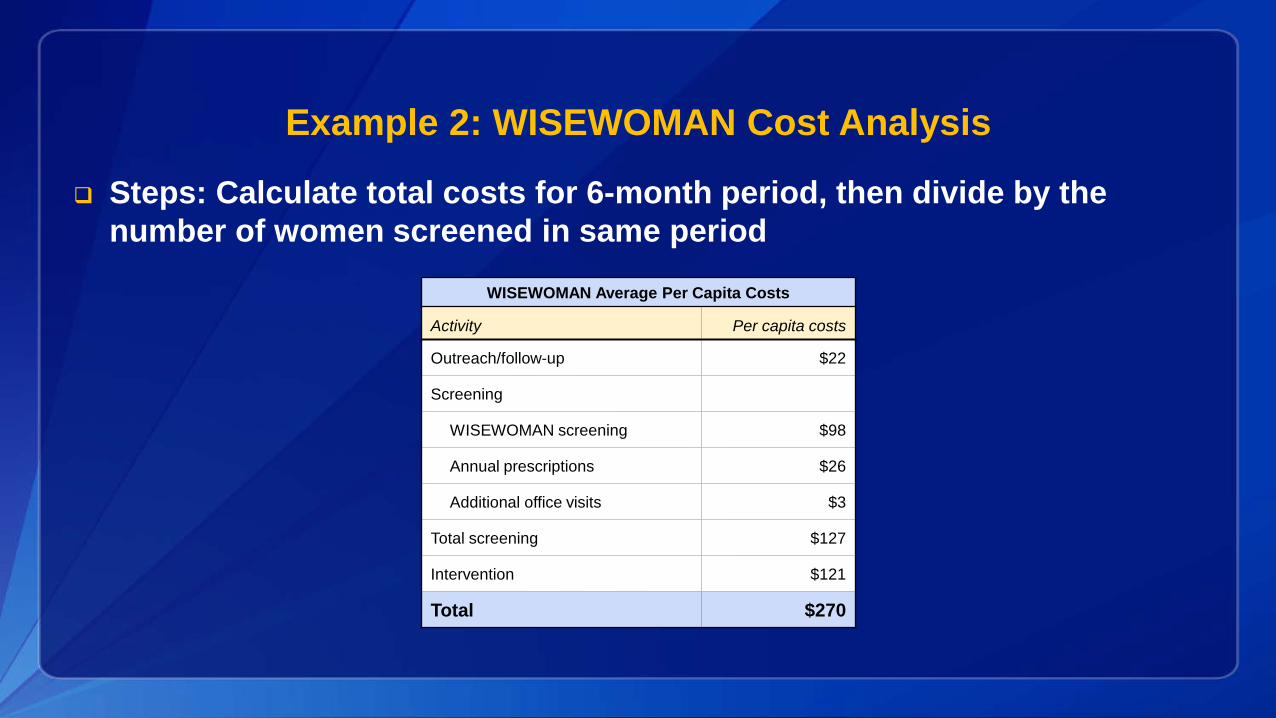
Steps: Calculate total costs for 6-month period, then divide by the number of women screened in same period
WISEWOMAN Average Per Capita Costs
Activity Per capita costs
Outreach/follow-up $22
Screening
WISEWOMAN screening $98
Annual prescriptions $26
Additional office visits $3
Total screening $127
Intervention $121
Total $270

Slide 17
Here are the final results of the WISEWOMAN programmatic cost analysis. The authors estimated that outreach required 22 dollars in expenditures per woman enrolled in the 6-month intervention period. Screening cost 127 dollars, and the intervention sessions cost 121 dollars. Therefore, the final average cost analysis showed that the WISEWOMAN intervention cost 270 dollars per woman.

Resources
Haddix A, Teutsch SM, Corso PS. Prevention Effectiveness: An Introduction to Decision Analysis and Economic Evaluation. 2nd ed. Oxford University Press; 2003.

Slide 18 The text book Prevention Effectiveness by Haddix and colleagues, published in 2003 by Oxford University Press, covers some of the more technical components of a programmatic cost analysis in greater depth.

Acknowledgments This presentation was developed by the Division for Heart Disease and Stroke Prevention (DHDSP) at the Centers for Disease Control and Prevention (CDC) under the leadership and guidance of:
Rashon Lane, Applied Research and Evaluation Branch, and Angela Soyemi, Communications Team
In collaboration with presentation author: Phaedra S. Corso, PhD, MPA, Department of Health Policy and Management, University of Georgia College of Public Health
CDC’s National Center for Health Marketing was integral in the development of this presentation. We thank: Anatavia M. Benson, Charlotte U. Duggan, and Thomas G. Race
This presentation was updated in August 2016.

For more information please contact Centers for Disease Control and Prevention
1600 Clifton Road NE, Atlanta, GA 30333Telephone, 1-800-CDC-INFO (232-4636)/TTY: 1-888-232-6348E-mail: [email protected] Web: www.cdc.gov
The findings and conclusions in this report are those of the authors and do not necessarily represent the official position of the Centers for Disease Control and Prevention.