Embed Size (px)
Citation preview

STRUCTURE AND FUNCTION RELATIONSHIPS IN
TROPONIN C PROBED BY SITE-DIRECTED MUTAGENESIS
Genny Trigo-Gonzalez
B.A., Universidad de Valparaiso, Chile, 1982
Thesis submitted in partial fulfilllrnent of
the requirements for the degree of
Master of Science.
in the Department
of
Chemistry
@ Genny Trigo-Gonzalez 1992
SIMON FRASER UNIVERSITY
March 1992
All rights reserved. This work may not be
reproduced in whole or in part, by photocopy
or other means, without permission of the author.

APPROVAL
Name:
Degree:
Title of thesis:
Genny Trigo-Gonzalez
Master of Science
Structure and Function Relationships in Troponin-C
Probed by Site-Directed Mutagenesis
Examining Committee:
Chair: Dr. D. Sutton
I , . Dr. T. w o r d , Assistant Professor Senior Supervisor
Dr. B. M. Pinto, Associate Proffesor Supervisory Committee
Dr. R. B. Cornell, Assistant Professor Supervisory Committee
I \
Dr. S. Holdcroft, ~ s s h a n t Professor Internal Examiner Department of Chemistry Simon Fraser University

PARTIAL COPYRIGHT LICENSE
I hereby grant to Simon Fraser University the right to lend my
thesis, project or extended essay (the title of which is shown below) to
users of the Simon Fraser University Library, and to make partial or
single copies only for such users or in response to a request from the
library of any other university, or other educational institution, on its own
behalf or for one of its users. I further agree that permission for multiple
copying of this work for scholarly purposes may be granted by me or the
Dean of Graduate Studies. It is understood that copying or publication
of this work for financial gain shall not be allowed without my written
permission.
Title of Thesis/Project/Extended Essay:
STRUCTURE AND FUNCTION RELATIONSHIPS IN TROPONIN-C
PROBED BY SITE-DIRECTED MUTAGENESIS.
Author: -
"s&ature)
GENNY TRIGO-GONZALEZ
(name)
(date)

ABSTRACT
Troponin C (TnC) is a protein located on the thin filament of skeletal and cardiac
muscle fibres. Calcium induces a conformational change in TnC which is communicated
to the other protein components of the thin filament, triggering muscle contraction. By
site-directed mutagenesis, tryptophan residues were introduced into the high-afftnity
domain of TnC at position 105 (mutant FW105), and into the low-affinity domain at
position 29 (mutant FW29). Since wild type TnC does not contain either tyrosine or
tryptophan, Trp-29 and Trp- 105 were used as site-specific reporters of metal ion binding
and conformational change. The spectral properties of FW29, and FW105 and of a
double mutant (FW29/FW105) were examined by absorbance and fluorescence methods.
Calcium induced significant changes in the near-W absorbance spectra,
fluorescence emission spectra and far-UV circular dichroism of all three proteins.
Magnesium induced changes in the spectral properties of FW105 and FW29/FW105
only. Calcium induced a 1.22 fold decrease in the fluorescence quantum yield of FW 105,
whereas magnesium induced a 1.6 fold increase. This suggests that calcium and
magnesium ions differ in their influence on the conformation of the high-affinity sites.
Tryptophan substitutions allowed low- and high-affinity sites to be titrated independently
of one another. Hill coefficients derived from titration curves indicate cooperative
calcium binding in both low- and high-affinity sites.
The binding of calcium by TnC produces a significant increase in the helical
content of the protein. Site-directed mutagenesis was used to study the relationship
between calcium ion binding and a-helix stability. Amino acid substitutions were made
at position 130, the N-cap position of helix G, in FW105. The binding properties of the
mutants were monitored using Trp-105 as reporter group in fluorescence experiments.
The high-affinity binding constants increased in the series Ile < Gly < Asp < Asn c Thr <

Ser. The substitutions did not affect the degree of cooperativity between the high-affinity
sites. The results suggest a close thermodynamic relationship between the stability of
helix G and high-affinity calcium ion binding in TnC. This relationship may be a way by
which calcium binding proteins with helix-loop-helix motifs fine-tune ion affinity.

DEDICATION
To my parents, for their love

ACKNOWLEDGMENTS
I am very grateful to my supervisor Dr. Thor Borgford for his professional
guidance, for being so encouraging, for creating such a nice working atmosphere and for
being there in my dark days.
Thanks to B.C Health Care Research Foundation for supporting this work.
Special thanks to Kevin Neden, Greg Awang, Gabe Kalmar, Debbie Carson and
Kathy Racher for helping me with their expertise and advice at different stages in my
work.
Thanks to everyone in Thor's lab for their warmth and joy of living.
Thanks to all my friends in Canada, my family in this beautiful country.
TABLE OF CONTENTS
Title ....................................................................................................................... Approval ................................................................................................................ Abstract .................................................................................................................. Dedication ............................................................................................................... Acknowledgements ................................................................................................. Table of Contents ....................................................................................................
.......................................................................................................... List of Tables
List of Figures ......................................................................................................... . . ............................................................................................... List of Abbreviations
1 . Introduction ........................................................................................................ 1.1 Troponin C and Muscle Contraction .............................................................. 1.2 Cooperativity in Calcium Binding .................................................................
..................................................... 1.3. Stability of Helices and Calcium Binding
...................................................................................................... 1.4. Summary
2 . Materials and Methods ........................................................................................ 2.1. Buffers and Other Solutions ......................................................................... 2.2. Bacteriological .............................................................................................
2.2.1. Media ................................................................................................ 2.2.2. Bacterial Strains ................................................................................ 2.2.3. Preparation of Competent E . coli Cells ..............................................
....................................................... 2.2.4. Transformation of E.coli Strains
............. 2.2.4.1. Transformation of E.coli strain TG2 by Phage M13
..................................... 2.2.4.2. Transformation of E.coli strain K12
1
. . 11
... 111
v
vi
vii
xi
xii
xiv
1
1
7
10
14
16
16
17
17
17
18
19
19
19
vii

2.2.4.3. Transformation of E.coli strain QY 13 with
Expression Vectors .............................................................. ....................................................................... 2.3. Plasmids and Bacteriophages
2.3.1. M13mp19 Bacteriophage ................................................................... 2.3.2. pLcIIFX-TnC ..................................................................................... 2.3.3. Determination of the Multiplicity of Viral Infection ........................... 2.3.4. Preparation of Single Stranded M13 (ssM13) DNA
for Sequencing ................................................................................... 2.3.5. Large Scale Preparation of Replicative Form MI3 (RF M13)
................................................................ and Plasmid pLcIIFX-TnC
2.4. Site-directed Mutagenesis of Troponin C DNA ............................................ 2.4.1. Preparation of U-DNA ....................................................................... 2.4.2. Mutagenic Oligonucleotide ................................................................
2.4.3. Kinasing of Primers ........................................................................... 2.4.4. Site-specific Mu tagenesis ................................................................... 2.4.5. Transformation of E.coli strain DH5a ...............................................
2.4.6. Sequencing of ssM13 ......................................................................... 2.5. Cloning into pLcIIFX-TnC Expression Vector ............................................
2.5.1. Restriction Digestion of M13 and pLcIIFX-TnC ................................ 2.5.2. Dephosphorylation of pLcIIFX-TnC Fragment .................................. 2.5.3. Purification of pLcIIFX-TnC and M13 Fragments ............................. 2.5.4. Ligation of pLcIIFX-TnC and M13 Fragments .................................. 2.5.5. Sequencing of pLcIIFX-TnCmUt .......................................................
2.6. Expression of FX-TnC Mutant Genes in E . coli Strain QY 13 ......................
2.6.1. Test for Expression ............................................................................ 2.6.2. Large Scale Expression ......................................................................
2.6.2.1. Growth of Cultures ...............................................................

....................................... 2.6.2.2. Release of Troponin C by Cell Lysis 36
................................................................... 2.6.3. Purification of Troponin C 37
.......................................... 2.6.3.1. Purification of Fusion Troponin C 37
2.6.3.2. Digestion of Fusion Troponin C with FX , ................................ 37
2.6.4. Preparation of Purified Proteins for Spectroscopic Analysis ................. 38
2.6.4.1. Calcium Concentration in Stock Solutions ............................... 39
2.7. Metal Binding Properties of Purified Proteins ................................................ 39
2.7.1. Fluorescence Spectroscopy .................................................................. 39
2.7.2. Circular Dichroism .............................................................................. 40
2.7.3. UV Absorbance and UV Absorbance Difference Spectra .................... 41
2.8. Calculations ................................................................................................... 41
3 . Results .................................................................................................................. 3.1. Mutagenesis ................................................................................................... 3.2. Cloning into pLcIIFX-TnC ............................................................................ 3.3. Protein Expression and Purification ............................................................... 3.4. Metal Binding Properties of FW29. FW105 and FW29/FW105 .....................
3.4.1. Far-UV Circular Dichroism ................................................................. 3.4.2. Absorbance Difference Spectra ........................................................... 3.4.3. Fluorescence ........................................................................................
3.5. Metal Binding Properties of Fusion FW 1 05/IX 130 Proteins .......................... 3.5.1. Far-UV Circular Dichroism ................................................................. 3.5.2. Fluorescence .......................................................................................
4 . Discussion ........................................................................................................ 79
4.1. Troponin C . Tryptophan mutants ................................................................. 79
4.2. Stability of Helix G ....................................................................................... 86

4.3. Conclusions ............................................................................................. 93
5. References .......................................................................................................... 94

LIST OF TABLES
Page
Table 2.1. Oligonucleotide Sequences ................................................................. Table 2.2. Mutagenic Capabilities of Oligonucleotides ....................................... Table 3.1. Annealing Reaction Conditions and Results ....................................... Table 3.2. Sequencing Results ............................................................................ Table 3.3. Summary of Site-Directed Mutagenesis Experiments ......................... Table 3.4. Relative Fluorescence Quantum Yield and Far-UV Ellipticities
of Tryptophan Mutants ....................................................................... ........ Table 3.5. Binding Parameters Determined by Far-W Circular Dichroism
Table 3.6. Binding Parameters Determined by Fluorescence
of Tryptophan Mutants .......................................................................
Table 3.7. Summary of FW105/UL130 Spectroscopic Data .................................

LIST OF FIGURES
Page
Figure 1.1. Organization of Skeletal Muscle ........................................................... Figure 1.2. Ribbon Structure of Troponin C ........................................................... Figure 1.3. Helix-Loop-Helix Structural Motif ....................................................... Figure 1.4. Amino Acid Sequence and Organization of
Recombinant Troponin C ..................................................................... Figure 1.5. C-domain of Troponin C ....................................................................... Figure 2.1. Bacteriophage M13mp19 ...................................................................... Figure 2.2. Plasmid pLcIIFX-TnC .......................................................................... Figure 2.3. cIIFX-TnC DNA and Amino Acid Sequence ........................................ Figure 3.1. Autoradiography of Mutant M13 DNA Sequences ................................ Figure 3.2. Anion Exchange Chromatography of E.coli Extract ..............................
Figure 3.3. SDS Polyacrylamide Gel of Troponin C ................................................
Figure 3.4. Gel Filtration Chromatography of Fusion Troponin C ........................... Figure 3.5. FPLC Chromatography of Fusion Troponin C .......................................
................... Figure 3.6. SDS Polyacrylamide Gel of Troponin C digested with FX ,
Figure 3.7. HPLC Chromatography of Authentic Troponin C .................................. 57
Figure 3.8. Far-UV Circular Dichroism Spectra of Tryptophan Mutants .................. 59
Figure 3.9. Titration of the Far-UV Circular Dichroism .......................................... 61
Figure 3.10. Absorbance Difference Spectra of Tryptophan Mutants ....................... 63
Figure 3.11. Fluorescence Emission Spectra of Tryptophan Mutants ....................... 65
Figure 3.12. Spectroscopic Properties of FW 105 in Response to Magnesium ......... 66
Figure 3.13. Titration of the Fluorescence of Tryptophan Mutants ........................... 67
Figure 3.14. Far-UV Circular Dichroism Spectra of FW105/IX130 Mutants ............ 71
Figure 3.15. Effect of Calcium on the Fluorescence Emission Spectra of
FW105/IX130 Mutants .................................................................... 75
Figure 3.16. Effect of Magnesium on the Fluorescence Emission Spectra of
FW105flX130 Mutants ..................................................................... 76
Figure 3.17. Titration of Tryptophan Fluorescence of FW 105/IX130 Mutants ....... 77
Figure 3.18. Gibbs Free Energy Diagram of FW105lIX130 Mutants ..................... 92

LIST OF ABBREVIATIONS
ATPase
BS A
CLP
dATP
dCTP
dGTP
dTTP
DEAE-
DTT
EGTA
EDTA
FPLC
HPLC
MOPS
PAP
PMSF
RNase A
RNase T1
rATP
SDS
PAGE
TFA
TRIS
Adenosine triphosphatase
Bovine serum albumin
Calf intestine alkaline phosphatase
2'- deoxyadenosine 5'- triphosphate
2'- deoxycytidine 5'- triphosphate
2'- deoxyguanosine 5'- triphosphate
2'- deoxythymidine 5'- triphosphate
Diethylaminoethyl-
DL-dithiothreitol
Ethyleneglycolbis-(aminoethylether) tetra-acetic acid
Ethylenediamine tetra-acetic acid
Fast protein liquid chromatography
High performance liquid chromatography
3 - [N-Morpholino] propanesulfonic acid
Linear polyacrylamide
Phenylmethyl sulfonyl fluoride
Ribonuclease A
Ribonuclease T1
Adenosine 5'- triphosphate
Sodium dodecyl sulfate
Polyacrylamide gel electrophoresis
Trifluoracetic acid
Tris (hydroxymethyl) methylamine
xiv

1. INTRODUCTION
1.1. Troponin C and Muscle Contraction
The contraction of skeletal muscle is a process that involves the coordinated
activity of proteins of the thin and thick filament in muscle fibers(l,2) (Figure 1.1-A).
The thick filament is composed of myosin, a protein that has an enzyme ATPase activity.
The thin filament is composed of the proteins tropomyosin, actin and the troponin
complex. When actin forms a complex with myosin, called actomyosin, there is an
increase in the ATPase activity of myosin. The hydrolysis of ATP by myosin provides
the energy necessary for muscle contraction. In the early 1960s it was known that
micromolar concentrations of calcium were required for ATP hydrolysis in myofibrils.
Ebashi in 1963 (3) and Ebashi et. a1 in 1964 (4) found calcium sensitivity in a
tropomyosin-like protein. In the presence of this protein, actomyosin preparations and
myofibrils became calcium sensitive. Ebashi in 1968 (5) isolated from native
tropomyosin, a new protein from the thin filament that he called troponin. Troponin was
identified as the protein that bound calcium. The actomyosin preparation was calcium
sensitive only in the presence of both troponin and tropomyosin. In the early 1970s,
Greaser and Gergely (6,7), using sodium dodecyl sulfate (SDS) polyacrylamide gels and
ion exchange chromatography in 6 M urea, established that troponin consists of three
polypeptide subunits. Troponin T (TnT) is the tropomyosin binding subunit, troponin I
(TnI) inhibits the actomyosin ATPase activity and troponin C (TnC) is the calcium-
binding subunit.
Muscle contraction is initiated by the increase of intracellular calcium
concentration that follows the release of Ca2+ from the sarcoplasmic reticulum. The
contraction /relaxation process is regulated by the binding of Ca2+ to the troponin
Muscle
Bundle of myofibers
Myofiber
Enlarged m yofibril
Plasma membrane
1 Sarcomere
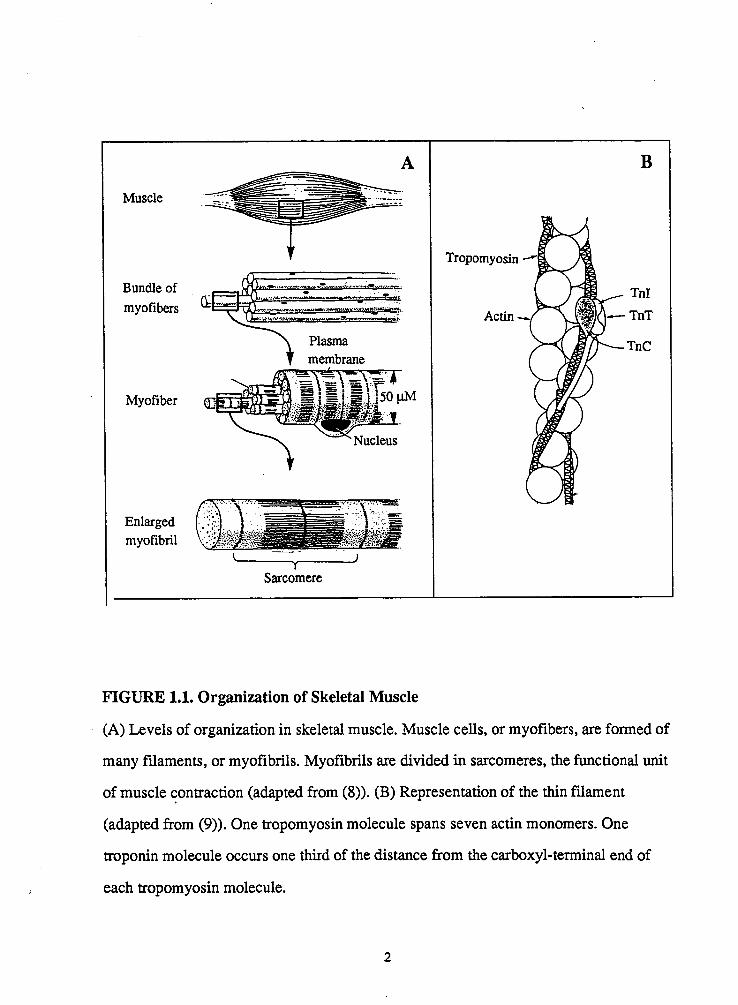
FIGURE 1.1. Organization of Skeletal Muscle
(A) Levels of organization in skeletal muscle. Muscle cells, or myofibers, are formed of
many filaments, or myofibrils. Myofibrils are divided in sarcomeres, the functional unit
of muscle contraction (adapted from (8)). (B) Representation of the thin filament
(adapted from (9)). One tropomyosin molecule spans seven actin monomers. One
troponin molecule occurs one third of the distance from the carboxyl-terminal end of
each tropomyosin molecule.

complex, more specifically, to its TnC subunit. Calcium binds to TnC and the protein
undergoes a conformational change that is transmitted to the other proteins of the thin
filament. TnI dissociates from actin, allowing tropomyosin to move. This results in the
formation of the actomyosin complex, increase in actomyosin ATPase activity and
muscle contraction.
The binding of calcium to troponin C is an important event in the process of
muscle contraction, and it is one of the objectives of this thesis project, to characterize
this interaction. The study of the interaction between calcium and troponin C and of the
relationships between the function and the structure of TnC is important in understanding
the molecular details of the regulation of muscle contraction by the troponin complex.
Studies of the relationship between function and structure of TnC are possible
since the gene encoding TnC and the three-dimensional crystal structure of the protein
are now available. The fmt TnC sequence determined was that of rabbit skeletal muscle,
by Collins et.al. (10). The sequence of chicken skeletal muscle TnC was first determined
by Wilkinson (1 I), and it has been recently revised and corrected by DNA sequencing
methods (12). The protein has 162 amino acids and a molecular weight of 18,400. It
contains no tyrosine, no tryptophan residues and only one of each cysteine, histidine and
proline residues. The protein is acidic, due to the high content of glutamic and aspartic
acid. The three dimensional X-ray crystal structure has been reported for both turkey
TnC (1 3) and chicken TnC (14). The molecule assumes a dumbbell shape in which the
globular amino and carboxy domains are linked by a long central a-helix (Figure 1.2).
Two relatively low-affinity, calcium-specific binding sites are present in the N-terminal
domain (sites I and II). Two relatively high-affinity sites able to bind either calcium or
magnesium are present in the C-terminal domain (sites III and IV). The structural unit of
the metal binding sites is characterized by a helix-loop-helix (H-L-H) configuration
(Figure 1.3). At the N-terminal domain, helix A-site I-helix B and helix C-site 11-helix D
form a pair of H-L-H motifs joined by a linking peptide. At the C-domain, helix E-site

FIGURE 1.2. Ribbon Structure of Troponin C
Representation of the crystal structure of skeletal troponin C (1). The calcium binding
sites are labeled I to IV. The helices are labeled A to H.

FIGURE 1.3. Helix-Loop-Helix Structural Motif
Schematic representation of the Helix-Loop-Helix motif (adapted from (15)). Helices are
labeled A to D. Calcium binding site are labeled I and II.

III-helix F and helix G-site IV-helix H are also joined by a linking peptide. The
functional unit exists as a pair of H-L-H motifs rather than an individual binding site
(15). This is a structural feature common to a family of highly homologous calcium
binding proteins such as Calmodulin, Parvalburnin, and Calbindin (15). Understanding
more about the relationships between structure and function in TnC can indirectly
contribute to the knowledge of other calcium binding proteins that are structurally related
to TnC, as well as contribute to our general understanding of protein structure and
function.
A variety of methods have been used to estimate binding constants for the Ca2+-
specific sites (low-affinity) and for the Ca2+/Mg2+ (high-affinity) sites in TnC. Binding
constants for the Ca2+/Mg2+ sites have been estimated by equilibrium dialysis (16, 17),
titration of covalently bound fluorescent probes (extrinsic probes) (18,19,20), by using
Ca2+ sensitive electrodes (21) and by titration of the far-UV ellipticity of the protein
(22,23). Binding constants for low-affinity Ca2+-specific sites have been more difficult to
estimate because suitable intrinsic reporters are unavailable and since calcium binding at
low-affinity sites is only responsible for about 30% to 40% of the change in the far U.V.
ellipticity associated with Ca2+ binding. Unfortunately, the results derived from these
experiments are contradictory with respect to whether there is cooperativity in the
binding of calcium to the protein which is isolated from the other proteins of the fiber.
Genes encoding chicken (24) and rabbit (25) TnC have been cloned, sequenced
and expressed in Escherichia coli. This has made it possible for relationships between the
structure and activity of TnC to be examined by site-directed mutagenesis of the cloned
genes (12,20,26). Since chicken TnC lacks tryptophan and tyrosine residues, it is an
attractive protein for the site-specific introduction of one of these amino acids as a
reporter group in a convenient location of the sequence. The presence of a single
chromophore allows one to unambiguously assign changes in the spectral features of the
protein, to changes in the environment of that residue. In this study of chicken TnC, site-

directed mutagenesis was used to substitute Phe-29 or Phe-105 by a Trp residue creating
the mutant proteins FW29 and FW105, respectively, and also the double mutant FW291
FW105. In the wild type chicken muscle TnC, Phe-29 is located at the carboxy-terminal
end of helix A, adjacent to Ca2+ binding site I (residues 30-41) (Figure 1.4). The
substitution of Phe-29 by Trp allowed the assignment of spectral features to position 29
in the low-affinity sites. Phe-105 is located at the carboxy-terminal end of helix E,
adjacent to Ca2+ binding site 111 (residues 106-1 17) (Figure 1.4.) and occupies, in the
high affinity sites, an equivalent position to that of Phe-29. The substitution of Phe-105
by Trp (mutant FW 105 ) allows Trp- 105 to be used as a probe for metal binding events
occurring at the C-terminal domain of TnC.
In the first part of the project, the spectral properties of Trp residues introduced
by site-directed mutagenesis at position 29 and 105 were used to monitor metal binding
in the N and C-terminal domains of chicken TnC. In the second part of the project,
calcium binding to the high-affinity sites of TnC was monitored by using Trp at position
105 as an intrinsic reporter. The proteins were analysed by absorption and fluorescence
methods.
1.2. Cooperativity in Calcium Binding
Many studies have addressed the question about cooperativity in the binding of
calcium by TnC, however, the issue of cooperativity has not been resolved. Cooperativity
was found to occur in the binding of Ca2+ to the structurally related proteins Calbindin,
Parvalbumin and Calmodulin (27,28,29). Based on the high homology between these
Ca2+ binding proteins, cooperativity is also likely to be found in TnC. Studies using
circular dichroism (22,23), 1H-NMR (22,30), and fluorescence (31), show that, in
solution, TnC undergoes Ca2+-induced conformational changes. The X-ray crystal
structure (14) shows that two calcium-binding sites are covalently joined by a peptide

N - H
elix
1
5 10
15
M
AS
IM
T D
AE
AR
AF
IL
S
A - H
elix
L
oop
I
B - H
elix
L
inke
r
C - H
elix
L
oop
I I
D
- Hel
ix
60
65
70
75
80
85
l5
:E
EL
DA
I
1
EE
VI
DE
DG
SG
TI
DI
FE
EF
LY
MM
VR
QM
KE
DA
Loo
p111
E
- Hel
ix
F - H
elix
9
5
100
105
110
115
120
125
130
KG
Ks
EE
EL
AN
cF
RI
FI
DK
NA
DG
FI
L
RA
TG
EH
v 1
*
I L
oop
I v
H -
Hel
ix
FIGURE 1
.4. A
min
o ac
id S
eque
nce
and
Org
aniz
atio
n of
Rec
ombi
nant
Tro
poni
nC
The
seq
uenc
e of
rec
ombi
nant
chi
cken
trop
onin
-C (2
4) is
pre
sent
ed in
one
lette
r cod
e an
d or
gani
zed
acco
rdin
g to
the
hom
olog
y be
twee
n bi
ndin
g si
tes
(ada
pted
from
(15)
). T
he re
com
bina
nt p
rote
in, p
urif
ied
from
the
vect
or p
Lcm
;X-T
nC,
has
an a
dditi
onal
met
hion
ine
resi
due
at it
s am
ino
term
inus
. The
seq
uenc
e is
num
bere
d fr
om th
e se
cond
resi
due
so a
s to
be c
onsi
sten
t with
the
non-
reco
mbi
nant
pro
tein
. Res
idue
s di
rect
ly o
r ind
irec
tly in
volv
ed in
coo
rdin
atin
g m
etal
ions
are
indi
cate
d by
ast
eris
k.

segment. It also shows that there is a close packing between adjacent binding sites due to
favorable non-covalent interactions between neighboring H-L-H motifs. There are strong
hydrophobic interactions, especially between helices AID and B/D in the N-terminal
domain and between helices E/H in the C-terminal domain. There are also hydrophobic
interactions between sites I and I1 and hydrogen bond interactions between sites I and II
and between sites III and IV. Therefore, the conformational changes that one site
undergoes upon Ca2+ binding will have an effect in the adjoining site. It is then
reasonable to believe that there is cooperativity in the binding of calcium to TnC.
In whole muscle fibre, measurements of the calcium dependence of tension
development (32) and of actomyosin ATPase activity (33), suggested cooperative metal
ion binding. Studies which measure calcium-binding by equilibrium dialysis in TnC
isolated from the other fiber components(l6) and by using a metallochromic indicator
(34) suggest that the sites are non-interacting. Cooperativity was not found between sites
in Ca2+ fluorescence titrations of extrinsic probes attached to TnC (33,35). However,
there are some reports of cooperativity between sites 111 and IV (19,36,37,38). With
respect to sites I and I1 ,no cooperativity has been demonstrated (18,20,38), except for
the recent evidence found using a combination of site-directed mutagenesis and
equilibrium dialysis methods (17). Cooperativity has not been clearly demonstrated in
TnC, possibly because the techniques used so far, measure binding to all four sites
simultaneously. In equilibrium dialysis experiments there is the possibility of oxidation
of methionine and / or cysteine residues, which may alter the functional and Ca2+ binding
properties of TnC (26). When extrinsic probes are used, their non-polar nature may
favour interactions with hydrophobic regions of the protein and this may be disruptive to
TnC. This could be responsible for the apparent loss of interactions between sites.
Tryptophan substitutions by site-directed mutagenesis are an alternative to
chemical methods for the introduction of reporter groups in chicken TnC. Tryptophan
mutants are a promising model system for the study of the interaction between calcium

and TnC. In the first part of the project described in this thesis, the properties of the
mutants FW29, FW 105 and of the double mutant FW291FW 105 were studied. The use of
the fluorescence of Trp-29 or Trp- 105 in the single mutants have the clear advantage
over other techniques used in the study of TnC, of measuring binding of Ca2+ to the high-
and low-affinity sites, independently.
1.3. Stability of Helices and Calcium Binding
Alpha helices are a common element in the secondary structure of proteins. The
amino acid residues that form an a-helix have backbone dihedral angles, phi and psi, that
are near -60. and -400, respectively (39). The characteristic hydrogen bonding pattern is
one in which the >N-H group of one amino acid is the donor, and the >C=O of the amino
acid four residues toward the C-terminal end of the protein is the acceptor. However, the
>N-H donors in the first four residues of the helix, and the >C=O acceptors in the last
four residues lack intrahelical partners. This leads to the hypothesis that helix formation
requires the presence of amino acid residues towards the helix termini, whose side chains
can hydrogen bond to the unpaired chain >N-H or >C=O groups (40). That is, at the N-
terminal end of the helix there should be an amino acid whose side chain is able to serve
as a hydrogen-bond acceptor. At the C-terminal end there should be an amino acid whose
side chain can serve as a hydrogen-bond donor. However, when the crystal structure of
proteins is examined, this side chain to main chain hydrogen bond at the termini of
helices is not always observed. This might indicate that the stabilizing effect of hydrogen
bonds at the helix termini could be of great importance in the nascent helix, but that it is
not always required for the stability of the mature protein (40,41).
There is evidence that electrostatic interactions are important in the stabilization
of a-helices (42). It is recognized that the helix backbone has a considerable dipole
moment. The a-helix macro dipole has its origins in the dipole of the individual peptide

units, whose dipole moment in an a-helix are aligned almost parallel to the helix axis.
Thus, the C-terminal constitutes the negative end, and the N-terminal constitutes the
positive end, each having a half unit charge (43). One of the effects of the electric field in
a-helices may be that negatively charged groups close to the N-terminal or positively
charged groups close to the C-terminal end of the helix could interact favorably with the
electrostatic field of the helix. The stability of a-helices has been, in many cases,
attributed to this type of interaction of charged residues with the helix dipole (44,45,
46).
A recent survey of protein structures (47) from the Brookhaven protein database
revealed preferences for amino acids at specific positions in a-helices. It was shown that
there is a preference for negatively charged residues to be located close to the N-terminal
end of helices and of positively charged residues at the C-terminal. This can be explained
if the dipolar nature of the a-helix is considered. In this structural survey, the N-cap and
C-cap were defmed as the residues in a helix "whose a carbon lies approximately in the
cylinder formed by the helix backbone and along the helical spiral path". The first and
last residues in helices can contribute to helix stability in different ways. A preference at
the N-cap position for residues whose side chain can hydrogen bond to the main chain
was observed, such as threonine, serine, asparagine, aspartic acid. These results support
the hydrogen bond hypothesis,that is, that these amino acids are preferred because they
can stabilize the helix due to their H-bonding capacities. In the case of aspartic acid,
however, its stabilizing effect at the N-cap position can also be explained in terms of the
helix dipole. The negatively charged side chain of aspartic acid could interact favourably
with the helix dipole at the N-terminal (positive) end of helices.
Synthetic peptides have been used to study the effect of amino acids in the
stability of a-helices (45,46,48,49). Experiments show that there is a pH dependence of
the helical content, which demonstrates the importance of ionizable groups in the
stability of the helices. The results indicate that charged residues stabilize a-helices by
favorable interactions with the helix dipole. Using site-directed mutagenesis, charged
amino acid substitutions at helix termini have been shown to stabilize the structure of the
enzymes T4 lysozyme (50,5 1) and Bacillus amyloliquefaciens ribonuclease (a.k.a.
Barnase) (52) by their interaction with the helix dipole. In an attempt to verify that there
is a preference for certain amino acids at the N-cap position, multiple substitutions were
made at the N-cap in two helices in the enzyme Barnase (53). The only substitution that
was found to be stabilizing was that of threonine by aspartic acid, with an increase in the
stabilizing energy of only 0.1 kcal/mol. The substitution of threonine by asparagine
resulted in destabilization, in contrast with what was expected from the structural survey
(47). Thus, it appeared that substitutions at N-cap residues must be considered in the
context of the surrounding protein, and that amino acid substitutions commonly lead to
interactions not found in the native structure.
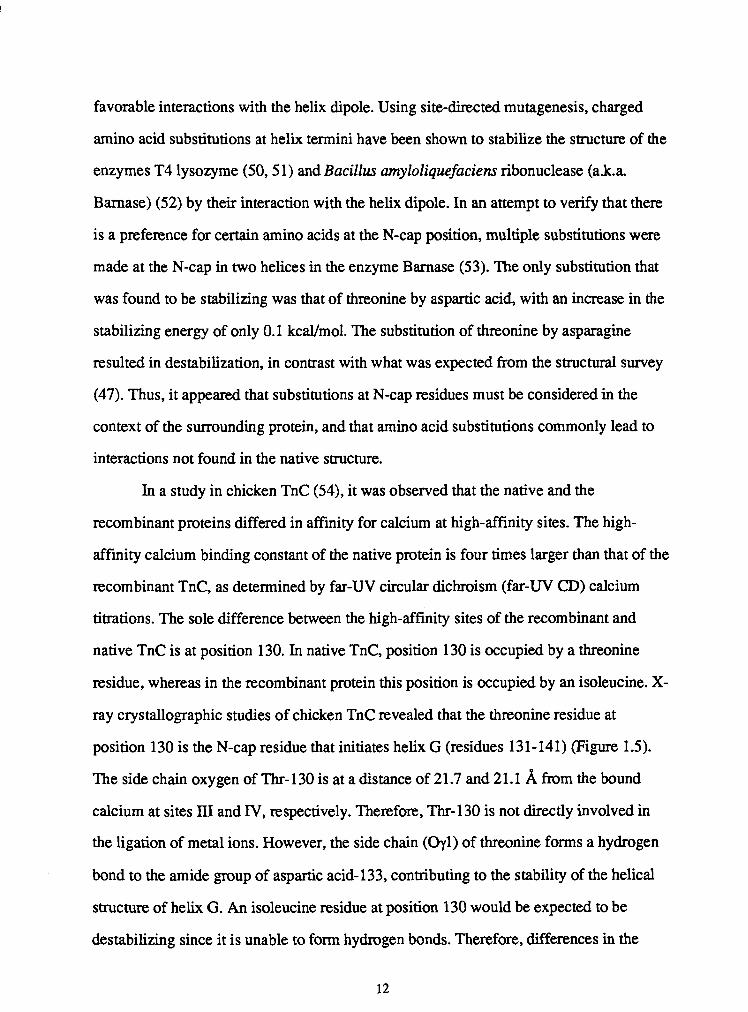
In a study in chicken TnC (54), it was observed that the native and the
recombinant proteins differed in affinity for calcium at high-affinity sites. The high-
affinity calcium binding constant of the native protein is four times larger than that of the
recombinant TnC, as determined by far-UV circular dichroism (far-W W) calcium
titrations. The sole difference between the high-affinity sites of the recombinant and
native TnC is at position 130. In native TnC, position 130 is occupied by a threonine
residue, whereas in the recombinant protein this position is occupied by an isoleucine. X-
ray crystallographic studies of chicken TnC revealed that the threonine residue at
position 130 is the N-cap residue that initiates helix G (residues 131- 141) (Figure 1.5).
The side chain oxygen of Thr-130 is at a distance of 21.7 and 21.1 A from the bound
calcium at sites IlI and IV, respectively. Therefore, Thr-130 is not directly involved in
the ligation of metal ions. However, the side chain (Oyl) of threonine forms a hydrogen
bond to the amide group of aspartic acid-133, contributing to the stability of the helical
structure of helix G. An isoleucine residue at position 130 would be expected to be
destabilizing since it is unable to form hydrogen bonds. Therefore, differences in the

FIGURE 1.5. C-Domain of Troponin-C
The C-domain of troponin-C is represented with calcium ions (spheres) bound to sites III
and IV. The positions of Thr- 130 and Phe-105 are indicated.

binding constants of the high affinity sites of native and recombinant TnC, seem to
reflect the relative abilities of threonine and isoleucine to stabilize helix G.
The study of the effect of different amino acids at the N-cap of helix G can give
an insight into the role of the a-helix in metal ion binding. For this project, several site-
specific mutations at position 130 were created, in order to probe relationships between
the stability of helix G and high-affinity metal ion binding to TnC. The substitutions
were made in the recombinant protein FW105, to create the double mutants
FW105DX130. X denotes the amino acid replacing isoleucine at position 130. High-
affinity metal ion binding events could be monitored unambiguously by changes in the
intrinsic fluorescence of the proteins. The amino acid substitutions at position 130 ( Gly,
Asp, Thr, Ser, Asn, Ile ) were expected to influence the stability of the a-helix in a
number of ways. Stabilizing effects were anticipated wirh amino acid residues whose side
chains can hydrogen bond to main chain residues and / or that can interact with the a-
helix dipole. The Asp- 130 substitution was of interest since this residue has the potential
to stabilize helix G by both means. Stabilizing effects were expected to be reflected in a
higher affinity constant for these mutant proteins. Gly and Ile, unable to hydrogen bond
would confer less stability to helix G and, therefore, these proteins would show lower
affinity constants. Thus, the relative importance of the hydrogen bonding abilities and of
interactions with the helix dipole in the high affmity sites of TnC could be studied.
1.4. Summary
The study of the function of TnC is important since the binding of calcium to this
protein is believed to regulate muscle contraction. In order to better understand the
contraction process, it is necessary to know how the different components of the muscle
fiber function. It is therefore important to identify what aspects of the structure of TnC
are important for metal ion binding, what are the features of the protein that give it

specificity for calcium or magnesium, how is the structure important in the equilibrium
between the metal-free and metal-bound states.
It is also interesting that TnC has a structure common to other calcium binding
proteins, the helix-loop-helix motif. Understanding aspects of the function and structure
of TnC is therefore of relevance in the study of related proteins.
In this study, site-directed mutagenesis was used to introduce a tryptophan residue
in chicken TnC. The usefulness of this chromophore as intrinsic reporter to monitor
metal binding to TnC was evaluated. Since the studies in isolated TnC are, in some
aspects, contradictory, it is important to find a sensitive technique to be able to
confidently address structure/function questions in TnC. Site-directed mutagenesis was
also used to prove relationships between the stability of helix G and metal ion binding.
This study can give an insight on how the protein structure affects ion affinity. The
results will be discussed in terms of an equilibrium between folded and unfolded TnC.

2. MATERIALS AND METHODS
2.1. Buffers And Other Solutions
Buffer A: 50 mM Tris-HC1 pH 8.0, 1 mM EGTA, 25% sucrose, 0.5 mM PMSF.
Buffer B: Tris pH 8.0,8 M Urea, 2 mM MgCl,, 1 mM D'IT, 85 mM KC1.
Buffer C: 50 mM Tris-HC1 pH 8.0,2 mM DTT, 1 mM CaCl,, 0.1 mM PMSF.
Buffer D: Buffer C + 1 M NaC1.
Buffer E: 50 mM Tris-HC1 pH 8.0,O.l M NaC1, 2 mM CaC1,.
Buffer F: 50 mM MOPS pH 6.95,150 mM KCl, 1 mM EGTA and 1 mM DTT.
lOxPE 1 Buffer: 200 mM Tris-HC1 pH 7.5,100 mM MgCl,, 500 mM NaC1,lO mM DTI'
lOxPE 2 Buffer: 200 mM Tris-HC1 pH 7.5,100 mM MgCl,, 100 mM DTT.
$ x Lieation Buffer: 0.25 M Tris-HC1 pH 7.6,50 mM MgCl,, 5 mM ATP, 5 mM D m ,
25 % (wlv) polyethyleneglycol- 8000.
10 x Polvnucleotide Kinase Buffer: 0.5 M Tris HCl pH 7.6,O.l M MgC&,50 mM D m ,
1 mM spermidine HC1, 1 mM EDTA pH 8.0.
10 x CIP De~hos~horvlation Buffer: 10 mM ZnC4, 10 mM MgCl,, 100 mM Tris C1 pH
8.3
10 x T4 DNA Lig.ase Buffer: 200 mM Tris C1 pH 7.6,50 mM MgCl,, 50 mM DTT, 500
pg/mL bovine serum albumin.
TE DH 8.Q: 10 mM Tris-HC1 pH 8.0, 1 mM EDTA pH 8.0.
1 x TAE: 0.04 M Tris-acetate, 1 mM EDTA.
React 1 Buffer: 50 mM Tris-HC1,lO mM MgC1,.
React 2 Buffer; 50 mM Tris-HC1,lO mM MgCl,, 50 mM NaC1.
React 3 Buffer: 50 mM Tris-HC1, lOmM MgC12,100 mM NaC1.
5 x Seauencing. - Buffer: 200 mM Tris-HC1 pH 7.5,100 mM MgCl,, 250 mM NaC1.

TfBI Buffer: 30 mM CH,COOK, 50 mM MnCl,, 100 mM KCl, 10 mM CaCl,, 15 %
glycerol. pH should be close to 7.0. Filter sterilize.
TfBII Buffer: 10 m M Na-MOPS pH 7.0,75 mM CaCl,, 10 mM KC1, 15% glycerol.
Filter sterilize.
2.2 Bacteriological
2.2.1. Media
TY/My broth: 2% tryptone, 0.5% yeast extract, 0.5% NaCl, 10 mM MgSO,. The MgSO,
is added from a 1 M filter sterilized stock.
2 x TY broth; 1.6% tryptone, 1.0% yeast extract, 0.5% NaCl.
TY plate: 1 .O% tryptone, 0.5% yeast extract, 1 % NaCl, 2% agar. 9
2 x TY-ArnD: 2 x TY broth with 100 pg/mL of ampicillin (Sigma).
TY-AmD late: TY plate with 200 pg/mL of ampicillin.
2 x TY-Tet: 2 x TY broth with 50 pg/mL of tetracycline (Sigma)
TY-Tet la^: TY plate with 50 pg/mL of tetracycline.
H- to^ a m : 1.0% tryptone, 0.8% NaC1,0.8% agar.
2.2.2 Bacterial Strains
Escherichia coli strain QY13 :Genotype (F- laca, np, B B'bio-256 N+ ~1857 AH
SmrrecA).(55)
Growth conditions: On TY-Amp plates, incubation at 300C. On 2xTY-Amp, incubation
at 30.C or 37.C. This E. coli cell strain was used in the expression of Troponin C from
the plasmid pLcIIFX-TnC. QY 13 cells were transformed with expression vector and
grown at 300C. At this temperature, the cI857 temperature-sensitive repressor is active.
The transcription from the P, promoter is then repressed. The repressor is inactivated at

42.C and the c m - T n C gene is then efficiently transcribed. Cells continue to grow at
37.C after induction.
Escherichia coli strain TG2 Genotype F( traD36 prom+ lacls lac2 AM15) A(1ac-
prom) supE hsdA.5 thi A(sr1-recA)306::TnlO(tetI') (56).
Growth conditions: On TY-Tet plates. On 2xTY, or 2xTY-Tet. Incubation at 3742.
Escherichia coli strain DHSa Genotype supE44 AlacU 169(08O lacZAM 15) hsdR17
recA 1 endA 1 gyrA96 thi- 1 relA 1 (56).
Growth conditions: On TY plates. On 2xTY broth. Incubation at 37.C.
Escherichia coli strain K12cI: This cell strain constitutively expresses cI repressor.
Growth conditions: On TY plate. On 2xTY broth. Incubation at 37C.
Escherichia coli strain RZ 1032: Dut-, Ung- cell line. A dut- strain does not synthesize
the enzyme dUTPase (dUTP nucleotidohydrolase) that hydrolyzes dUTP into dUMP and
PPi. An ung- strain lacks the enzyme uracil N-glycosylase that hydrolyzes uracil from
single stranded and double stranded DNA.
Growth conditions: On TY-Tet plates. On 2xTY or 2xTY-Tet broth. Incubation at 37.C.
2.2.3. Preparation of Competent E.coli Cells
One mL of TY/Mg broth was inoculated with a fresh E. coli colony and incubated
to a cell density = 0.5 (OD6, = 0.5) at the appropriate temperature (30•‹C or 37.C). This
culture was then used to inoculate 20 mL of TY/Mg (pre warmed at 30.C or 37.C) in a
250 mL flask and incubated to OD,, = 0.5. Two hundred mL of TY/Mg (pre warmed at
300C or 37oC) in a 1 L flask were inoculated with the 20 mL culture and incubated to an
OD,, = 0.6. The cell culture was chilled on ice and then centrifuged at 3500 rpm for 15
min at PC. The cell pellet was resuspended in 40 mL of cold TfBI buffer and centrifuged
as before. The cell pellet was then resuspended in 8 rnL of cold TfBII buffer, aliquoted
and frozen in tubes in a bath which was a mixture of dry ice and ethanol, then stored at

2.2.4. Transformation of E.coli Strains
2.2.4.1. Transformation of E.coli strain TG2 by Phage M13:
Recombinant M13 (section 2.3.1) DNA was added to 200 pL of competent TG-2
cells. The mixture was incubated on ice for 30 rnin then heat shocked for 2.5 min at
37.C. Heat shocked cells (150 pL) were mixed with 200 pL of an overnight TG-2 culture
and 3 mL of H-top agar and poured onto a TY plate. Plaques containing M13 were
visible on the lawn of TG2 growth after 6 hrs of incubation at 37C.
2.2.4.2. Transformation of E.coli strain K12
Typically, 1 pL of pLcIIFX-TnC was added to 150 pL of competent E.coli strain
K12cI. The culture was incubated on ice for 30 min and then heat shocked for 2.5 min at
3PC. After adding nine volumes of 2 x TY, the mixture was incubated for 2 hrs at 37C.
Then 0.2 mL was spread-plated onto a TY-Amp plate and incubated overnight at 37.C.
The same procedure was used to transform K12cI with 20 p L of diluted ligation
mixture (section 2.5.4.). In this case, 1 and 0.2 mL of transformed cells were spread-
plated onto TY-Amp plates.
2.2.4.3. Transformation of E.coli strain QY13 with Expression Vectors
The pLcIIFX-TnC exp~ssion vector that carried a mutated gene was added to 50
pL of competent E.coZi QY 13. The culture was incubated on ice for 30 rnin and then heat
shocked for 2.5 min at 30•‹C. Nine volumes of 2xTY were added and the suspension
incubated at 300C for 2 hrs. Usually 0.2 mL of cells were spread-plated on TY-Amp and

incubated at 30oC for 36 hrs, until colonies were visible. Protein expression tests (section
2.6.1.) were done in fresh QY13 colonies only. QY13 should not be stored on plates in
the refrigerator.
2.3. Plasmids and Bacteriophages
23.1. M13mp19 (M13) Bacteriophage:
F-specific rod-shaped filamentous phage of the mp series (57). A restriction map
is shown in Figure 2.1 that contains the TnC gene:
Expression vector which directs the synthesis of a fusion protein consisting of the
3 1 amino terminal residues of the lambda cII protein, the tetrapeptide Ile-Glu-Gly-Arg,
and the complete Troponin C sequence (58). See Figure 2.2.
2.3.3. Determination of the Multiplicity of Viral Infection
The multiplicity of viral infection is expressed in plaque forming units (pfu) per
bacterial cell (pfu/cell). To determine this, the number of pfu/mL of MI3 bacteriophage
suspension (section 2.3.1.1 .), and the number of bacteria/mL in the inoculum of E.coli
strain RZ1032 was determined as follows:
Dilutions of the bacteriophage suspension were prepared (lW, lW, 10'). Ten pL
of each dilution was mixed with 100 pL of a log phase E.coli TG2 culture and 3 mL of
H-top agar and plated on TY plates. Plaques containing bacteriophage were counted after
the plates were incubated overnight at 37C, and the number of plaque forming units per
volume @fu/mL) of phage suspension was calculated.

Hindlll- Sphl- Pstl-Sail/
FIGURE 2.1. Bacteriophage M13mpl9-clIFX-TnC
Schematic representation of bacteriophage M13mp19 containing the coding region of the
cIIFX-TnC fusion protein. The coding region for troponin C is indicated by a black
arrow. Restriction sites are indicated, as well as the polylinker region.

FIGURE 2.2. Plasmid pLcIIFX-TnC
Schematic representation of the expression vector pLcIIFX-TnC. The coding region for
troponin C is indicated by a black arrow. Restriction sites are indicated, as well as the
polylinker region.

Dilutions of the bacterial suspension were prepared (lo2, l e4 , 1Q5, 106). One
hundred pL of each dilution was spread plated onto TY-Tet plates. The number of
colonies in each plate was counted after incubation overnight at 37C, and the number of
bacteria / mL of inoculurn calculated.
23.4. Preparation of Single Stranded MI3 (ssM13) DNA For Sequencing
Two mL aliquots of 2xTY were inoculated with single plaques produced by MI3
(section 2.2.4.1.) and 20 pL of an overnight TG-2 culture (typically 24 to 48 clones were
screened for mutations by DNA sequencing). After incubation for 5 hrs at 37C, the
cultures were centrifuged to pellet the cells. About 1.2 m . of the culture supernatant was
added to 200 pL of a solution of 20% polyethyleneglycol and 3.5 M ammonium acetate.
After 15 min, the precipitated bacteriophage particles were recovered by centrifugation at
12,000 rpm for 5 min. The pellets were resuspended in 100 pL of TE buffer pH 8.0.
Fifty pL of phenol was added, mixed, and the aqueous phase was withdrawn after the
phases were separated by centrifugation. Then 100 pL of chloroform was combined with
the aqueous phase, mixed and the aqueous phase separated as before. DNA was
precipitated by combining the aqueous layer with 10 pL of 3 M sodium acetate (pH 5.5)
and 250 pL of 95% ethanol, and incubating for 15 min. The suspension was centrifuged
at 12,000 rpm for 10 min. The pellet was washed with 200 pL of 70% ethanol, dried
under vacuum and finally resuspended in 40 pL of ddH20.
2.3.5. Large Scale Preparation of Replicative Form M13 (RF M13) and Plasmid
pLcIIFX-TnC
Five mL of 2xTY were inoculated with 25 pL of an overnight culture of TG-2
and a single plaque of M13 picked from a lawn of transformed TG-2 (section 2.2.4.1.).

The cultures were incubated for 4 hrs at 370C and centrifuged for 10 min at 12,000 rpm.
to pellet cells. Supernatants were kept at 4 C as M13 bacteriophage stocks.
Two hundred mL of 2 x TY medium was inoculated with 2 mL of a mid-log
phase TG-2 culture and incubated for 2 hrs at 3 7 C A 1 mL aliquot of M13 stock
solution (section 2.3.1.) was added and the culture grown overnight at 37C with shaking.
The culture was then centrifuged at 8,000 rpm for 10 min at 4.C. The cell pellet was
resuspended in 10 mL of Solution I (50 mM glucose, 10 mM EDTA, 25 mM Tris-HC1
pH 8.0, and 4 mg/mL of lysozyme), and incubated for 10 min. Then, 20 mL of freshly
prepared solution II (0.2 N NaOH, 1% SDS) was added and the mixture was allowed to
stand at room temperature until it became clear. A 15 mL aliquot of Solution III (5 M
potassium acetate,60 mL; 11.5 mL acetic acid; 20 mL H20 ) was added and it was
incubated for 5 min. The solution was centrifuged for 10 min at 8,000 rpm. The
supernatant was removed and extracted with 25 mL of phenol and 15 mL of chloroform,
then with 25 mL of chloroform. Two volumes of ethanol were added and the solution
incubated for 10 min to precipitate DNA. The precipitated DNA was recovered by
centrifuging at 9,000 rpm for 15 min. The pellet was dried under vacuum and then
resuspended in 500 pL of H20. To the DNA solution, RNase A (O.Smg/mL) and RNase
T1 (0.5 mg/mL) were added and it was incubated for 2 hrs at 37C. An extraction with
one equal volume of phenol/chloroform (60:40) and then with one volume of chloroform
was performed. DNA was precipitated by combining the DNA solution with 125 pL of
10.0 M ammonium acetate and 1 mL of 95% ethanol and incubating for 30 min. The
suspension was centrifuged for 15 rnin at 12,000 rpm. The resulting pellet was
resuspended in 200 pL of TE pH 8.0, and precipitated again by incubation for 30 rnin
with 20 p.L of 3.0 M sodium acetate (pH 7.5) and 450 pL of 95% ethanol. The
suspension was again centrifuged. The DNA pellet was dried under vacuum and fmally
resuspended in 200 pL of sterile ddH20.

The large scale preparation of pLcm;X-TnC was essentially the same as that
described for M13 except that 1 mL of 2 x TY-Amp was inoculated with a single
pLcIIFX-TnC infected K12 colony (section 2.2.4.2.), and incubated for 6 hrs at 37C.
The resulting culture was inoculated into 200 mL of 2 x TY-Amp and grown overnight
with shaking at 37C. Cells were harvested by centrifugation at 8,000 rpm for 10 min at
4.C. DNA was extracted and purified from cell pellets as described above for RF MI3
DNA.
2.4. Site-directed Mutagenesis of Troponin C DNA
The coding region of chicken TnC had been cloned into the Eco RI site of
bacteriophage M13mp 19 (Figure 2.1). A modified recombinant MI3 DNA bearing the
substitutions phenylalanine-29 to tryptophan-29 and phenylalanine-105 to tryptophan-
105 (FW29/FW105) was obtained from K. Racher and T. Borgford (SFU). Recombinant
M13 DNA FW29/FW105 and FW29/FW105/IN130 (the third substitution of isoleucine-
130 by asparagine-130 was available after the first set of mutations using FW29/FW105
as template) were used as templates for the mutagenesis reactions in order to create the
FW 105/IX 130 mutant proteins.
Mutagenesis of the Troponin C DNA was performed by the Kunkel method (56).
In the Kunkel method, a phage DNA template is used that contains uracils instead of
thymine (U-DNA). U-DNA is obtained from M13 bacteriophage that has been grown on
a E. coli dut-, ung- strain like RZ1032. In the rnutagenesis reaction, the mutagenic
oligonucleotide is annealed to the U-DNA template. During the in vino synthesis of the
complementary strand, only thymine is incorporated. When this double stranded DNA
is used to transform a E. coli ung+ strain like DHSa, the wild type template strand (that
contains uracil) is degraded. Therefore, the majority of the progeny phage produced
should contain DNA with the desired mutation.
2.4.1. Preparation of U-DNA
Uracil containing ssDNA (U-DNA) was prepared from E.coli strain RZ1032
infected with the recombinant M13 bacteriophage stocks FW29/FW105 or FW291
FW lO5/INl3O (section 2.3.1). To prepare a stock of M13 bacteriophage, 2 mL of 2xTY
were inoculated with a single plaque of bacteriophage MI3 (section 2.2.4.1) and 0.2 mL
of an overnight culture of E. coli TG2. The C U ~ R was incubated at 37.C for 2 hrs, and
then at 60oC for 5 min. The supernatant, which contained the bacteriophage, was
recovered by centrifugation at 12,000 rpm for 10 min at 4.C, and stored at 4.C.
Three 50 mL aliquots of 2xTY containing 0.25 pg/mL of uridine, in 500 mL
flasks, were inoculated with 1 mL from a 5 mL overnight RZ1032 culture and 50 pL of
the bacteriophage M13 stock solution. The mixture was incubated at 37.C with shaking
(300 rpm) for 6 hrs. The multiplicity of infection was 0.02-0.2 pfu/cell (section 2.3.3.).
The cultures were then centrifuged at 8,000 rpm for 30 min in a GSA centrifuge rotor at
4.C. The supernatant was collected and U-DNA was purified essentially as described
previously (56). The concentration of U-DNA was determined spectrophotometrically
(56).
2.4.2. Mutagenic Oligonucleotides
Oligonucleotides were purchased from the Regional DNA Synthesis Laboratory
at the University of Calgary (Dr. R. Pons), from (Oligonucleotide Synthesis Laboratory
at the University of British Columbia) (Dr. T. Atkinson), and at the 1.M.B.B synthesis
facilities (SFU). Table 2.1. shows the sequence of the oligonucleotides used and Table
2.2. indicates their mutagenic capabilities.

TABLE 2.1. Oligonucleotide Sequences
Mutagenic Oligonucleotides
Oligonucleotide IT 130:
5 ' - G C A C G T C A C C G A G G A G G A C - 3 '
Oligonucleotide IX130- 1 : 5 ' - G C A C G T C A A C G A G G A G G A C - 3 '
GG C
Oligonucleotide IX130-2:
Oligonucleotide IX 130-3:
5 ' - G C A C G T C G A T G A G G A G G A C - 3 '
CCA
Underlined in each oligonucleotide is the sequence heterogeneity at the position
complementary to codon 130. The mutagenic capabilities are presented in Table 2.2.
Sequencing Primers
FW105 primer:
5 ' - C C G C A T C T G G G A C A A G A - 3 '
FW29 primer:
5 ' - T T G A C A T G T G G G A T G C G G A C G - 3 '
SEQ 1 primer:
5 ' - T C G A G A G T G C G T T G C T T - 3 '

2.4.3. Kinasing of Primers
The 5'-end of the oligonucleotide sequencing primer Seq 1 and the 5'-end of
mutagenic oligonucleotides (Table 2.1) were phosphorylated enzymatically (56). The
reaction mixtures (20 pL) contained oligonucleotide (0.2 nmoles), 10 mM rATP and 10 x
polynucleotide kinase buffer (2 pL). T4 DNA Kinase (10 Units) was added and the
solution was incubated at 370C for 1 hr. The kinase was then inactivated by heating at
6g•‹C for 10 min.
TABLE 2.2. Mutagenic Capabilities of Oligonucleotides
codon amino acid codon mino acid codon
G G C G ~ Y G G C G ~ Y G A T
G A C ASP G C C Ala G A A
A G C Ser G T C Val G C T
A A C Asn T G C CYs G C A
C G C A% T C C Ser C A T
C G C Arg T C C Ser C A T
C C T
C C A
amino acid
ASP Glu
Ala
Ala
His His
Pro
Pro
2.4.4. Site-specific Mutagenesis
Site-specific mutagenesis was performed by the oligonucleotide-directed method
(59) using double primers (60). The primers were the mutagenic oligonucleotide and Seq
1 (Table 2.1). Seq 1 is complementary to the cII gene in the recombinant M 13 DNA (see
the DNA sequence of cIIFX-TnC in Figure 2.3).

FIGURE 2.3. DNA and Amino Acid Sequences of cIIFX-TnC
Nucleotides are indicated by the name of the corresponding base. Amino acids are
indicated underneath the DNA sequence by the one letter code. The beginning and end of
the cn, FX, and TnC DNA sequences are indicated above the sequence.
I I I I I I I I I I I I
ATGGTTCGTGCAAACAAACGCAACGAGGCTCTACGAATCGAGAGTGCGTTGCTTAACAAA
M V R A N K R N E A L R I E S A L L N K
70 I 80 I 90 I+ 100 I I-- 110 "ft'pz I I
I I I I I I
ATCGCAATGCTTGGAACTGAGAAGACAGCGGAAGGGGGATCCATCGAGGGTAGGATGGCG
I A M L G T E K T A E G G S I E G R M A
130 140 150 160 170 180 I I I I I I I I 1 I I I
TCAATGACGGACCAGCAGGCGGAGGCCCGCGCCTTCCTCAGCGAGGAGATGATTGCTGAG
S M T D Q Q A E A R A F L S E E M I A E 190 200 210 220 230 240
I I I I I 1 l I I I I I
TTCAAAGCTGCCTTTGACATGTTTGATGCGGACGGTGGTGGGGACATCAGCACCAAGGAG
F K A A F D M F D A D G G G D I S T K E
250 260 270 280 290 300 I I I I I I I I I I I I
TTGGGCACGGTGATGAGGATGCTGGGCCAGAACCCCACCAAAGAGGAGCTGGATGCCATC
L G T V M R M L G Q N P T K E E L D A I
I E E V D E D G S G T I D F E E F L V M

370 380 390 400 410 420 I I I I I I' I I I I I I
ATGGTGCGCCAGATGAAAGAGGACGCCAAGGGCAAGTCTGAGGAGGAGCTGGCCAACTGC
M V R Q M K E D A K G K S E E E L A N C
F R I F D K N A D G F I D I E E L G E I
490 500 510 520 530 540 I I I I I I I I I 1 I I
CTCAGGGCCACTGGGGAGCACGTCATCGAGGAGGACATAGAAGACCTCATGAAGGATTCA
550 560 I I
570 580 590 600 1 I I I
1 I I 1 I I
GACAAGAACAATGACGGCCGCATTGACTTCGATGAGTTCCTGAAGATGATGGAGGGTGTG
D K N N D G R I D F D E F L K M M E G V
-4 610 620 630 640 I I I I
650 660 I I
I I I I I t
CAGTAAGGGATCAGACATTCCTCGGGCCGGATGCGGCAGCCAGCCCTGGCTCCTCTGCCC
Q - G I R H S S G R M R Q P A L A P L P
670 680 690 700 I I I I
710 720 I I
I I I I I 1
AGGAGCGGCTCCGCTGCAGCACCTGGCCTTGCTGCCCACCCGCTGGAGCCCTGCAGCAGC
R S G S A A A P G L A A H P L E P C S S
S C P S A G G - A F P - L - Q M W F M D
790 800 810 820 830 840 I I I I I I I I I I I I
GAACCTCATTAAAAGGGGAAAGGCTGAAAAAAAAAAAAAAAAAAAAAAAAAAAAAAAAAAA
E P H - K G K G - K K K K K K K K K K K 850
I 1
AAAAAAAAAGGAATTC
K K K G I

The annealing reaction (10 pL) contained U-DNA (0.5 pmoles), phosphorylated
mutagenic oligonucleotide (10 pmoles), phosphorylated Seq 1 (10 pmoles) and 10 x PE 1
buffer (1 pL). Annealing reaction mixtures were incubated for 10 min at 80.C or at 67.C.
The mixtures were allowed to cool slowly to room temperature.
Ten pL, of a solution that contained dNTP (1 mM), rATP (1 mM) and 10 x PE 2
Buffer (1 pL) was added to the 10 pL of annealing mixture described above. T4 DNA
ligase (1 Unit) was added, then T4 DNA polymerase (3 Units). This extension ligation
mixture was incubated for 5 min on ice, then for 5 rnin at room temperature and finally
for 2 hrs at 37C. E. coli strain DH5a was transformed with the extension/ligation
mixture.
2.45. Transformation of E.Coli strain DHSa
The entire extension / ligation mixture from a mutagenesis reaction was added to
50 pL of competent DHSa and incubated on ice for 30 min. The cells were heat shocked
at 370C for 2.5 min and then combined with 0.2 mL aliquots of an overnight TG-2
culture and 3 mL of H-top agar. The entire mixture was poured onto a TY plate. Plaques
of M13 carrying putative gene mutants were visible after overnight incubation at 37C.
Single stranded M13 DNA (ssM13) was obtained from M13 plaques (section 2.3.4) and
screened for mutations by DNA sequencing (section 2.4.6).
2.4.6. Sequencing of ssM13
Single stranded M13 DNA (section 2.3.4) was sequenced by the Chain
Termination Method (61), using the enzyme Sequenase (Version 2.0) and protocols
provided by the United States Biochemical Corporation). Once a mutation at position

130 was identified (FW29/FW 105/IX 130 mutants), replicative form M13 was prepared
(section 2.3.5).
2.5. Cloning into pLcIIFX-TnC Expression Vector
Wild type troponin C DNA had been cloned into the expression vector pLcIIFX
(24) yielding the expression vector pLcIIFX-TnC. In the cloning procedure, fragments of
DNA bearing the mutations FW105/IX130 were isolated from enzyme digests of
replicative form M13. The fragments were then ligated to the pLcIIFX-TnC, which had
been previously treated with the same restriction enzymes, creating pLcIIFX-TnC,,,,,.
2.5.1. Restriction Digestion of M13 and pLcIIFX-TnC
The DNA fragments bearing the substitution FW105/IX130 were obtained from
replicative form M13 by digestion with the restriction endonucleases Sal I (Pharmacia)
and BstX I (BRL) or with Cla 1, Sal I and BstX I (see restriction sites in Figure 2.1).
pLcIIFX-TnC was similarly digested with Sal I and BstX I (see restriction sites in Figure
2.2). Typically, 10 pL of RF MI3 DNA or of plasmid DNA (section 2.3.5) was digested
in a total volume of 100 pL, with 30 units of Sal I in React 3 Buffer (10 pL) and 1 mM
DTT. The reaction was incubated at 37oC for 2 hrs. Then, 30 units of BstXI was added
and the mixture incubated at 550C for further 2 hrs.
An alternative procedure was used in the restriction digestion of M13 bearing
Thr- 130 and Asp-130. MI3 DNA was incubated with 30 units of Cla 1 in React 1 Buffer
(10 pL) for 3 hrs. An extraction was performed with one volume of phenol and
chloroform (60:40) and then with one volume of chloroform. The DNA was precipitated
by incubation for 30 min with 3 M sodium acetate pH 5.6 (1110 volumes) and 2 volumes
of 95% ethanol. The pellet was resuspended in ddH20 (90 pL) and incubated with 30

units of Sal I in React 3 Buffer (10 pL) for 1.5 hrs at 37.C. Another 30 units of enzyme
was added and the reaction was incubated for further 1.5 hrs. Then, 1 mM DTI' and 30
units of BstXI were added and incubated for 1.5 hrs at 550C. A second addition of Bs~XI
was done, and the reaction was incubated for another 1.5 hrs. The DNA was purified by
extractions with one volume of phenol and chloroform (60:40), then with one volume of
chlorofom. The DNA was ethanol precipitated as described above, dried under vacuum
and finally resuspended in 10 - 20 pL of sterile ddH20.
The digested pLcIIFX-TnC and M13 fragments were purified as described in
section 2.5.3. Plasmid DNA (pLcIIFX-TnC) was dephosphorylated (Section 2.5.2) prior
to purification.
2.5.2. Dephosphorylation of pLcIIFX-TnC Fragment
The dephosphorylation reaction (60 pL) contained pLcIIFX-TnC,,, digestion
fragments (section 2.5.1), 2 units of Calf Intestine Phosphatase (Boehringer Mannheim)
and 6 pL of 10 x CIP dephosphorylation buffer. The reaction was incubated at 50.C for 1
hr and then at 65C for 15 min. The DNA was purified by extracting with one volume of
phenol and chloroform (60:40), then with one volume of chloroform. Then 1/10 volume
of sodium acetate (pH 5.6), and 2 volumes of 95% ethanol was added, and the solution
incubated for 30 min. The precipitated DNA was recovered by centrifugation, air dried
and resuspended in 20 pL of sterile ddH,O.
2.53. Purification of pLcIIFX-TnC and MI3 Fragments
The DNA was loaded onto a 0.8% agarose gel containing 0.001 mg/mL ethidium
bromide. Electrophoresis was performed at 70 V for 1.5 hrs, using lambda DNA digested
with Cla I as a size marker. A band corresponding to a DNA fragment of the correct size

was cut from the gel with a scalpel and placed in dialysis tubing with 200-300 pL of TE
buffer pH 8.0. The tubing was immersed in 1/2 TAE buffer in a gel electrophoresis
apparatus and the DNA was electroeluted at 200 V for 15 min. The polarity was reversed
for 15 sec to release DNA from the walls of the dialysis bag. The solution was then
transferred to a microfuge tube and the DNA was precipitated by combining it with 1/10
volume 0.3 M sodium acetate, 2 volumes of 95% ethanol and 1 pL of PAP. The pelleted
DNA fragment was recovered after centrifuging for 20 min at 12,000 rpm, and was then
resuspended in 5- 10 pL of sterile dd H,O.
25.4. Ligation of pLcIIFX-TnC and MI3 Fragments
The pLcIIFX-TnC and MI3 fragments were ligated to create the mutant
pLcIIFX-TnC,,,. The concentration of vector and insert was estimated by visualization
on a 1 % agarose gel containing 0.001 mglmL ethidium bromide. The ligation reaction (in
7 pL) contained an approximately 1: 1 molar ratio of vector to insert and 1 unit of T4
DNA ligase in 5 x ligation buffer. After incubating for 3 hrs, the solution was diluted
with 20 p.L of ddH20.
E.coli strain K12cI was transformed with 20 pL of diluted ligation mixture
(section 2.2.4.2.). Plasmid pLc1I.X-TnC,,, was obtained from infected K12cI and
screened for mutant genes by sequencing.
2.55. Sequencing of pLcIIFX-TnCmut
Three mL aliquots of 2xTY-Amp were inoculated with single colonies of E-coli
strain K12cI infected with ligation mixture and incubated at 370C for 8 hrs. Cells were
recovered by centrifugation at 13,000 rpm for 5 min. Plasmid DNA was prepared and
purified as in section 2.3.5.
One ~g of DNA was added to 200 mM NaOH.0.2 mM EDTA (17 pL total
volume) and left at room temperature for 3 min. Then 3 of 3 M sodium acetate pH
4.8 and 50 pL of 95% ethanol were added and the mixture was incubated at room
temperature for 5 min. The DNA was recovered by centrifugation at 12,000 rpm for 5
min and then dissolved in 7 pL of sterile ddH20.
For the annealing reaction (in 10 pL), the DNA solution was mixed with 5 x
sequencing buffer and 0.5 pmole of the appropriate primer (Seq 1, FW29 or FW105) . The solution was then incubated at 37C for 15 min, left for 10 min at room temperature
and then kept on ice until needed. The sequencing reaction was performed as described
for ssM13 (section 2.4.6).
Once the presence of a mutation gene was confirmed by DNA sequencing,
plasmid DNA was used to transform E.coli strain QY13 (section 2.2.4.3), and the
recombinant host was tested for protein expression (section 2.6.1).
Expression plasmids containing the substitutions phenylalanine-29 to tryptophan-
29 (FW29), phenylalanine- 105 to tryptophan- 105 (FW105) and the double mutant
(FW29/FW105) were obtained from K. Racher and T. Borgford (SFU).
2.6. Expression of c1.X-TnC Mutant Genes in E. coli Strain QY13
2.6.1. Test for Expression
Two mL aliquots of 2xTY-Amp were inoculated with single QY 13 colonies
infected with pLcIIFX-TnC,, (section 2.2.4.3) and grown at 300C to an OD,,, = 0.5.
The cultures were heat shocked at 42.C for 10 min to induce expression, and then
incubated at 370C for 2 hrs. Cells were harvested by centrifugation at 13,000 rpm for 10
min and then resuspended in 50 pL of TE pH 8.0 buffer with 0.5 mM PMSF. Cells were
lysed by three cycles of freezing and thawing and then sonicated for 10 rnin in a bath
sonicator (Branson Model B-32, SmithKline company). The suspension was centrifuged

at 12,000 rpm for 12 min. Expression of fusion troponin C, cIIFX-TnC (Figure 2.3) was
determined by SDS polyacrylamide gel electrophoresis of cell supernatant fractions and
comigration with known standards (62).
2.6.2. Large Scale Expression
2.6.2.1. Growth of Cultures
Four 1 L aliquots of 2xTY-Amp were inoculated with pLcIIFX-TnC,,, infected
E.coli strain QY 13 and the culture was incubated at 3@C with shaking until a cell density
OD,, = 0.8 was reached. Cultures were then heat shocked at 42C and subsequently
incubated at 37C in an environmental shaker for 4 hrs. After incubation, the flasks were
rapidly cooled on ice and cells were harvested by centrifugation at 8,000 rpm in a Sorvall
GS3 centrifuge rotor at 4.C.
2.6.2.2. Release of Troponin C by Cell Lysis
Cell pellets were resuspended in 110 mL of Buffer A. Ten rnL of a 24 mg/mL
lysozyme solution were added to the suspension, and the mixture was incubated on ice
for 30 min. After lysozyme treatment, 1.2 mL of a 1 mg/mL solution of DNase I, 2.4 mL
of a 1.0 M solution of MgC1, and 120 pL of a 1.0 M solution of MnCl, were added to the
suspension and it was further incubated on ice for 30 min. After the addition of 0.6 mL
of a 100 mM stock of PMSF in isopropanol, the suspension was sonicated with three 20
seconds bursts at a maximum power from a probe sonicator (Fisher Sonic-Dismembrator
model 300) fitted with a medium sized probe. Cell debris was removed from the
homogenate by centrifugation at 18,000 rpm in a Sorvall SS34 rotor.

2.63. Purification of Troponin C
2.63.1. Purification of Fusion Troponin C
Ninety-six grams of urea, 31 mg of D'IT and 200 pL of 1.0 M solution of Tris-
HCl pH 7.5 were dissolved in the QY 13 homogenate. The entire mixture was loaded onto
a 2.6 x 40 cm chromatography column packed with 160 mL of Q-Sepharose Fast Flow
(Pharmacia) and pre-equilibrated in Buffer B. The column was washed with 500 mL of
Buffer B and proteins were then eluted with a linear gradient of KC1 from 85 mM to 1 M
at a flow rate of 200 mL/hr. The column fractions containing fusion troponin-C were
identified by SDS-PAGE, then pooled and desalted on a 2.6 cm x 90 cm chromatography
column packed with 500 mL of G-25 Sephadex (Pharmacia). The column was pre-
equilibrated in 0.1 % TFA (in H,O) and eluted with the same solvent at a flow rate of 85
mL/hr. Fractions containing fusion proteins were pooled, lyophylized and stored
desiccated at -200C. Typically, 200 mg of fusion protein (cIIFX-TnC sequence, 200
amino acids long) was recovered from 4 L of cell culture.
Fusion protein (10rng) was resuspended in 2 mL of Buffer C and further purified
by ion exchange chromatography on a Pharmacia FPLC system equipped with a HR 515
or HR 10110: Mono Q (Pharmacia) column. cIIFX-TnC was eluted from the column in a
40 min linear gradient extending from 80% Buffer C/20% Buffer D to 100% Buffer D.
Purified recombinant cIIFX-TnC was flash frozen and stored at -20.C until needed
Fusion FW105 and fusion FW105/IX130 mutants were purified by this method.
2.63.2. Digestion of Fusion Protein with Factor X,
X, was obtained from Dr T.J.Borgford (SFU). Conditions for the digestion of
each preparation of fusion TnC by Factor X, were determined empirically. Typically,

complete digestion was achieved after incubating the fusion protein with Factor X,
(800: 1 weight ratio) for 12 hrs at room temperature in Buffer E.
Full length TnC (authentic TnC 162 amino acids long) was purified from Factor
X, digests by reversed phase chromatography on a Spectra-Physics model 88 10 HPLC
equipped with a 10 mm x 25 cm C4 (Vydac) column. The full length protein was eluted
from the column in a 20 min linear gradient extending from 65% Solvent A (0.2%
TFA/H,O) / 35% Solvent B (0.2% WAIacetonitrile) to 50% Solvent A / 50% Solvent B.
Purified recombinant TnC was lyophylized and stored at -20.C until needed. FW29,
FW105 and FW29/FW105 were purified by this method.
2.6.4. Preparation of Purified Proteins for Spectroscopic Analysis
Studies of FW105/IX130 mutants were performed on fusion proteins p d ~ e d by
FPLC as described in section 2.6.3.1. Column fractions were precipitated by the addition
of ammonium sulphate to 50% (wlv). Proteins were recovered by centrifugation for 30
min at 5,000 rpm in a SS34 rotor and pellets were resuspended in 2 mL of 50% Buffer B
/ 50% Buffer F and 3 mM Dm. TnC samples were resuspended in Buffer F with 3 mM
DTT. Protein solutions (cIIFX-TnC and TnC samples) were dialysed for 30 hrs at 4.C
against two 500 mL changes of Buffer F.
Buffer F was prepared with dclH20 and filtered through a chelating resin. To
ensure free Ca2+ conditions, only acid washed (6N HCl) and thoroughly rinsed (ddH20)
plastic containers were used. Stock protein solutions were flash frozen and stored at
-700C until analysis.
Protein concentrations were estimated by a modified version (63) of the method
of Lowry (64).
2.6.4.1. Calcium Concentration in Stock Solutions
Total calcium concentration in calcium chloride stock solutions was determined
by atomic absorbance on a Perkin-Elmer model 1100B atomic absorption
spectrophotometer. A 1.0 mglmL calcium chloride standard (BDH) was used to calibrate
measurements. All samples were prepared according to protocols supplied by Perkin-
Elmer (standard conditions for calcium).
2.7. Metal Binding Properties of Purified Proteins
2.7.1. Fluorescence Spectroscopy
Fluorescence spectra and calcium and magnesium titration of protein solutions
were recorded on a Photon Technology model LS-100 fluorimeter equipped with a
thermostated cell assembly and interfaced with a microcomputer. Spectra and titrations
were performed at 25 f 1•‹C in 1 cm square quartz cuvettes (OD,,,<0.05). For
spectroscopic studies, protein stock solutions were diluted to 5 pM with Buffer F. The
buffer was previously equilibrated to room temperature and sparged with helium to
displace dissolved oxygen. Protein solutions were pre-warmed to 25C before the assay.
The excitation wavelength was 278 nm (the excitation maxima) for all titrations.
Emissions were monitored at 335 nm (FW29 mutant) or 366 nm (FW105, FW29/FW105
and FW105/IX130 mutants) in calcium titrations, and at 345 nm in the magnesium
titrations. The intrinsic fluorescence of the recombinant proteins was titrated by the
incremental addition of calcium chloride or of magnesium chloride with a 25 pL
Hamilton syringe. The fluorescence emission spectra of the proteins was recorded before
and after the titration with the metal ion.
The relative fluorescence quantum yield was determined using a tryptophan
solution in buffer F as standard. The quantum yield of Trp is 0.12 (65). The excitation

wavelength was 286 nm and fluorescence emission was integrated between 295 nm and
420 nm. Relative fluorescence quantum yields were determined before and after the
addition of calcium chloride or of magnesium chloride to a final free calcium
concentration of 0.18.mM or a final free-magnesium concentration of 89 mM. The
protein concentration was 5 pM.
2.7.2. Circular Dichroism
Circular dichroism spectra and calcium titration of full length TnC proteins
(FW29, FW 105 and FW29/FW 105) were recorded on a Jasco J=20 spectropolarimeter
that was equipped with a thermostated cell assembly and interfaced to a microcomputer.
Spectra and titrations were performed on samples in a quartz cuvette of 2.0 mm path
length. The instrument was calibrated with D-pantolactone (@=-I6200 at 219 nm,
concentration=0.015 %w/v (66)). The far-UV CD spectra of the fusion FW105/IX130
mutants were performed on a Jasco 5710 spectropolarirneter fitted with a thermostated
cell compartment. The instrument was calibrated with ammonium d- 10-
camphorsulfonate (ACS) (0= +7910 at 290.5 nm, concentration=0.06 %w/v). All spectra
were obtained at 25.C in either 1.0 mm or 0.5 mm path length cells. Ellipticities were
measured at 10 nmlmin scan speed, 1.0 nm band width, 4 second response time, and 0.05
nm step resolution. Two to five measurements were made for each mutant. Absolute
ellipticities were converted to mean residue ellipticities, based on the protein
concentrations and 200 residues in the cm;X-TnC fusion protein. The curves were
smoothed with filter settings of 4 (top) and 10 (bottom).
Prior to spectral analysis protein solutions were diluted to a concentration about
10 pM in a total volume of 1 mL or 1.15 rnL, with buffer F. In the case of the
FW105/IX130 mutant proteins Buffer F was previously warmed to 250C and sparged
with helium,. All protein solutions were pre-warmed to 25.C before the assay.
Protein ellipticity at 221 nm was titrated by the incremental addition of calcium
chloride. The far UV CD spectra of the recombinant proteins was obtained before and
after titration.
2.7.3. UV Absorbance and UV Absorbance Difference Spectra
UV absorbance spectra were recorded on a Hewlett Packard model 8452A Diode
Array Spectrophotometer with a 1 cm path length cell and 2.0 nm resolution. A split cell
of 0.487 cm path length was used to generate absorbance difference spectra. Protein
samples prepared in Buffer F were placed in one chamber of the split cell and calcium
chloride or magnesium chloride solutions in Buffer F were placed in the other chamber.
An unmixed reference spectrum was recorded. Difference spectra were generated by
subtracting the spectrum of the sample after mixing of protein and metal solutions, from
the spectrum of the unmixed blank.
Two calcium chloride additions were done. The fmt addition to a final calcium
concentration of 0.9 pM, ensured the saturation of the high-affinity calcium binding
sites. The second addition, to a final 0.18 mM ensured the saturation of the low-affinity
sites. The absorbance difference spectra was recorded before and after each calcium
addition.
The absorbance difference spectra was also recorded before and after the addition
of magnesium chloride to a concentration of 12.1 mM.
2.8. Calculations
Free calcium or magnesium concentrations were calculated from total metal ion
in chelating buffers by a computer algorithm (67) adapted to the Macintosh
microcomputer by Dr. B. Sykes and Mr. J. Boyko. The logarithmic binding constants for

metals and H+ to EGTA used were: H+ to EGTA4-, 9.46; H+ to HEGTA3-, 8.85; H+ to
H2EGTA2-, 2.68; H+ to H3EGTAl-, 2.0; Ca2+ to EGTA4-, 10.72; Ca2+ to HEGTA3-, 4.07;
Mg2+ to EGTA4-, 5.21; Mg2+ to HEGTAr, 3.38. Titration data was fitted by an iterative,
derivative free curve fitting routine (BMDP Statistical Software Jnc.) on the IBM model
308 1 computer.
Titration data was fitted to an equation that assumes there is a single class of sites:
y = (Kl[Ca2+])h. 100 / 1+(K1[Ca2+])h
or to an equation that assumes there are two classes of sites:
y = (K, [Ca2+])hl N, / l+(K, [Ca2+])h1 + (K2[Ca2+])N N2 / 1+(K2[Ca2+1)N
The percent saturation is given by y, K is an association constant, h the Hill coefficient,
and N the percentage contribution to fluorescence of sites of class 1 or 2.
The free energy change associated with metal binding to TnC can be expressed as
AG = -RT In K
G is the Gibbs free energy, R is the universal gas constant, T is the temperature and K is
the dissociation constant. A M G term was calculated that corresponds to the difference
in free energy change associated with metal binding,
between two mutant proteins 1 and 2:
M G = - R T I n K 2 /K1
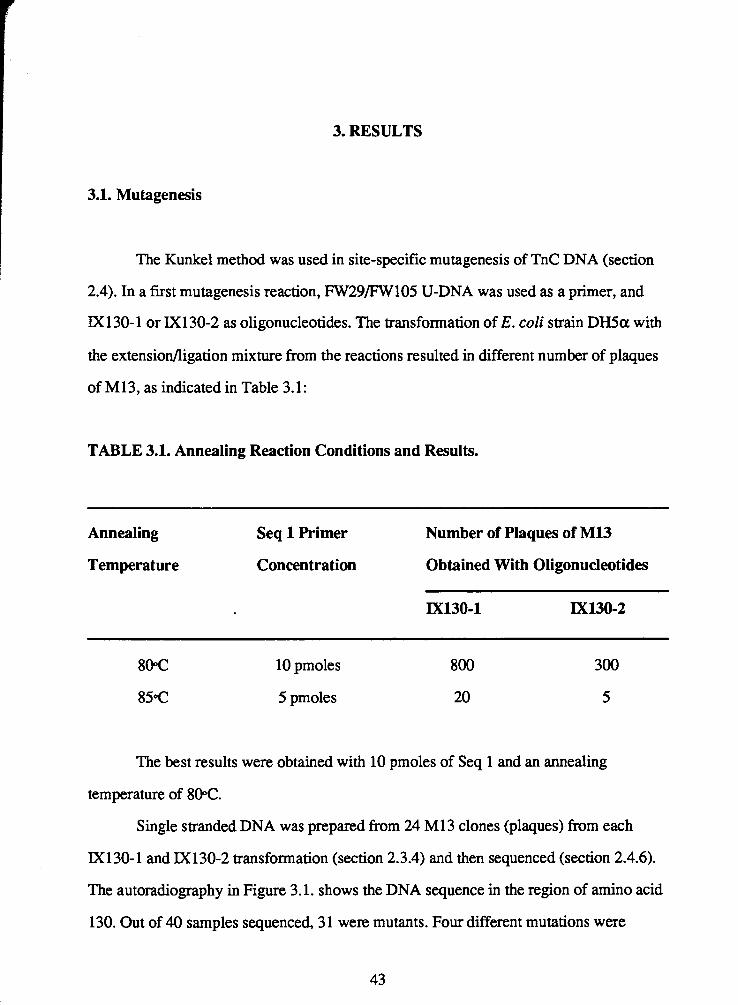
3. RESULTS
3.1. Mutagenesis
The Kunkel method was used in site-specific mutagenesis of TnC DNA (section
2.4). In a first mutagenesis reaction, FW29/FW105 U-DNA was used as a primer, and
IX130-1 or IX130-2 as oligonucleotides. The transformation of E. coli strain DWa with
the extension/ligation mixture from the reactions resulted in different number of plaques
of M 13, as indicated in Table 3.1 :
TABLE 3.1. Annealing Reaction Conditions and Results.
Annealing Seq 1 Primer Number of Plaques of M13
Temperature Concentration Obtained With Oligonucleotides
- -
10 pmoles
5 pmoles
The best results were obtained with 10 pmoles of Seq 1 and an annealing
temperature of 8@C.
Single stranded DNA was prepared from 24 MI3 clones (plaques) from each
IX130-1 and IX130-2 transformation (section 2.3.4) and then sequenced (section 2.4.6).
The autoradiography in Figure 3.1. shows the DNA sequence in the region of amino acid
130. Out of 40 samples sequenced, 3 1 were mutants. Four different mutations were

FIGURE 3.1. Autoradiography of Mutant M13 DNA Sequences
The picture shows the autoradiography of the M13 DNA sequence of 3 clones in the
region that codes for amino acid 130. A, G, C, T, correspond to the initials of the
deoxynucleotides dATP, dGTP, dCTP and d P P . The site of the mutation, the codon and
the corresponding amino acid are indicated.

AG
C r
Ser
AG
CT
A
GC
T
AG
CT

obtained in that first mutagenesis experiments: Gly- 130, Ser- 130, Val- 130 and Phe- 130.
Table 3.2 shows the sequencing results of the first mutagenesis experiments.
TABLE 3.2. Sequencing Results.
Mutant Number of Mutants Obtained Amino acid 130 IX130-1 M130-2 Total
Serine 12
Glycine 5 4
Valine 9
Phenylalanine 1
Table 3.3 summarises the results of the mutagenesis experiments. It indicates the
mutagenic oligonucleotide and U-DNA template used in the reactions to obtain the
different amino acid substitutions at position 130. Also, the codon that corresponds to the
amino acid substitution identified by sequencing of the DNA, and the name of the mutant
protein created.
The mutations Asn- 130 and Asp- 130 could not be obtained by annealing at 80C.
In order to favour the annealing of oligonucleotides of low melting temperature (Tm),
subsequent annealing reactions were performed at a temperature only SoC above the Tm.
Asn-130 was obtained by annealing at 670C. In an attempt to create the Asp-130,
FW29/FW105/IV 130 U-DNA was prepared and annealed to oligonucleotide El 30- 1.
The codon for Val- 130 was G T C. The codon for Asp in 1x130- 1 was G A C. Since
there is a difference of only one base between the template and the oligonucleotide, their
annealing should be favoured. However, the yield of this U-DNA was very low, and
mutagenesis experiments were not successful. Asp- 130 was finally obtained as indicated

TA
BL
E 3
.3. S
umm
ary
of S
ite-D
irec
ted
Mut
agen
esis
Exp
erim
ents
Mut
ant
Am
ino
Aci
d 13
0 O
ligon
ucle
otid
e U
-DN
A T
empl
ate
Cod
on
Mut
ant P
rote
in*
Asp
arag
ine
Asp
artic
aci
d
Seri
ne
Val
ine
P
-I G
l yci
ne
Phen
ylal
anin
e
Glu
tam
ic a
cid
His
tidin
e
Thr
eoni
ne
AA
C
FW10
5/IN
130
GA
T
FW10
5/ID
130
AG
C
FW10
5/IS
130
GT
C
FW29
/EW
105/
IV13
0
GG
C
FW10
5jIG
130
TT
C
FW29
/FW
1 05
/IF
130
GA
A
CA
T
AC
C
FW10
5/IT
130
*Not
e: S
ome
subc
loni
ng p
roto
cols
(i.e
. sub
clon
ing
prot
ocol
s of
mut
ant D
NA
fro
m M
I3 to
exp
ress
ion
vect
or) r
esul
ted
in
mut
ant p
rote
ins
with
one
tryp
toph
an. I
n ot
her c
ases
, sub
clon
ing
resu
lted
in d
oubl
e try
ptop
han
mut
ants
.

in Table 3.3. From that same mutagenesis reaction His-130 and Glu-130 were obtained.
Restriction digestion reactions and subsequent cloning into the expression vector
was done for the MI3 mutant DNA canying the mutations FW29/FW105/IX130 with the
substitutions at position 130 being Gly- 130, Asn-130, Asp-130, Ser-130, Thr-130, Val-
130 and Phe- 1 30 only. M 13 DNA bearing the mutations His- 130 and Glu- 130 were
identified by DNA sequencing only, and left at that stage.
3.2. Cloning into pLcIIFX-TnC
The success of the cloning of the MI3 inserts into pLcIIFX-TnC was confirmed
by plasmid sequencing (section 2.5.5). The sequencing of Val-130 and Phe-130 mutants
in the expression plasmid showed that they had Trp-29 and were FW29/FW105/D(130
mutants. The corresponding mutant proteins were expressed in E.coli QY 13 (section
2.6.2) but their activity was not tested. For the purpose of this project, these mutations
were not of great importance and the restriction digestion of MI3 and the subsequent
ligations were not attempted again.
3.3. Protein Expression and Purification
The fusion TnC mutant proteins successfully expressed in E-coli strain QY 13
were: FW29, FW 105, FW29/FW 105, FW29/FW lO5/IV 130, FW29/FWlO5/Fl3O,
FW105/IT130, FW105/IN130, FWlO5/IS130, FW105/IG130 and FW105D130. The
cells were lysed (section 2.6.2.2), and the cell lysate was loaded onto a Q-Sepharose
column (section 2.6.3.1). TnC is an acidic protein, and fusion proteins could therefore be
purified in this anion exchange column by eluting it with KCl. Native TnC has been
purified in the past using a DEAE-Sephadex anion exchange column (6). Figure 3.2
shows the chromatogram of the fractions eluted from the column. The fractions that

Fraction
FIGURE 3.2. Anion Exchange Chromatography of E.coli Extract
The figure corresponds to a chromatogram of a cell lysate sample eluted from a Q-
Sepharose column (section 2.6.3.1.). TnC was identified in fractions 33 to 38, as
determined by SDS Polyacrylamide Gel Electrophoresis (Figure 3.3).

contained TnC were identified by SDS PAGE (Figure 3.3). Lane B, which corresponds
to cell lysate, shows that recombinant TnC was the major protein expressed by E.coli
QY 13. The conductivity of the samples that eluted from the Q-sepharose column was
measured. It was established that wild type recombinant TnC eluted at a KC1
concentration between 0.16 M and 0.19 M (conductivity of 18.7 mS/cm to 21.1 mS/cm).
The Q-sepharose eluent that contained TnC was desalted in a G-25 gel fdtration
column. After this purification step fusion TnC was recovered from the column free of
urea. Figure 3.4 represents the chromatogram from the gel filtration column (section
2.6.3.1), and shows that TnC eluted as a single peak.
Proteins were further purified by either KPLC or FPLC. In theory, HPLC gives
superior purity but lower yields. However, FPLC gave a product as highly pure as HPLC
and higher yield.
The fusion FW105/IX130 mutant proteins were further purified by FPLC (section
2.6.3.1). Figure 3.5 shows the FPLC chromatogram. The protein eluted as one single
peak at a NaCl concentration between 0.36 M and 0.4 M.
Fusion FW29, FW105 and FW29/FW105 were digested with FXa (section
2.6.3.2) in order to obtain full length TnC. That the digestion reaction had gone to
completion was confirmed by SDS PAGE. The SDS PAGE in Figure 3.6. shows in
Lanes 3 and 4, two bands. One comigrates with a full length TnC standard. The band of
lower molecular weight appears to be the first 31 amino acids of the cII protein.
Reversed phase KPLC was used to purify full length TnC from the digestion reaction
mixture (2.6.3.2). The chromatogram presented in Figure 3.7 shows that TnC elutes from
the column as a single peak.

FIGURE 3.3. SDS Polyacrylamide Gel of Troponin C
SDS PAGE of Lane A: Pure FW29 standard. Lane B: Cell lysate before loaded onto the
Q-sepharose anion exchange column. Lanes 28 to 38 correspond to the number of the
fractions eluted from the Q-sepharose column (Figure 3.2).


0 10 20 30 40 50
FRACTION
FIGURE 3.4. Gel Filtration Chromatography of Fusion Troponin C
The figure corresponds to the chromatogram of TnC samples eluted from a G-25 gel
filtration column (section 2.6.3.1). Troponin C was collected from fractions 22 to 30.

FRACTION
FIGURE 3.5. FPLC Chromatography of Fusion Troponin C
The figure corresponds to the chromatogram of fusion TnC eluted from an FPLC mono-
Q column (section 2.6.3.1). The protein eluted as a single peak at a NaCl concentration
between 0.35 and 0.4 M.

FIGURE 3.6. SDS Polyacrylamide gel of Troponin C Digested with FX,
SDS PAGE shows on Lane 1: Fusion TnC standard. Lane 2: Pure TnC standard. Lanes 3
and 4: Digestion reaction of TnC with FX, (section 2.6.3.2).


Retention Time (min)
FIGURE 3.7. HPLC Chromatography of Authentic Troponin C
The figure corresponds to the chromatogram of a sample of TnC digested with FX,. The
peak with a retention time = 22.92 corresponds to purified TnC. Chromatography
conditions are described in section 2.6.3.2.

3.4. Metal Binding Properties of FW29, FW105 and FW29/FW105
3.4.1. Far-UV Circular Dichroism
The Far UV CD spectra of the recombinant mutants FW29, FW105 and
FW29/FW105, with and without calcium chloride at saturation ( pCac4.0) appear in
Figure 3.8. The corresponding ellipticity values and changes in ellipticity at 221 nm are
presented in Table 3.4. In the presence of calcium, all three mutant proteins showed an
increase in the negative ellipticities. This is associated with an increase in the helical
content of both high- and low-affinity sites of TnC. Although the absolute ellipticities of
recombinant proteins varied, the relative changes in going from the calcium-free states of
the proteins to calcium saturated states were approximately equivalent and averaged
-6.5 1 x 10³ deg cm2dmole-1.
The results of far-UV CD calcium titrations are shown in Figure 3.9 and binding
parameters are in Table 3.5. The titration data indicate that approximately 60% to 70% of
the total calcium-induced change in ellipticity is contributed by calcium ion binding to
the high-affinity sites. Only 30% to 40% of the change is contributed by metal ion
binding to the low-affinity sites. The data were best fit to a monophasic curve, of the
form y = (K, [Ca2+])h 100 / 1+(K1 [Ca2+])h (section 2.8.), although in each case there is a
deviation from an ideal curve. The average half saturation point for the three mutants was
at a pCa = 6.73 f 0.03 with a Hill Coefficient for binding of 1.59 f 0.78.

Wavelength
(nm)
n
a)
FIG
UR
E 3
.8. F
ar-U
V C
ircu
lar D
ichr
oism
Spe
ctra
Of T
rypt
opha
n M
utan
ts
u
Far-
UV
cir
cula
r dic
hroi
sm s
pect
ra (s
ectio
n 2.
7.2)
wer
e re
cord
ed o
n re
com
bina
nt p
rote
ins
(A) 11.7 pM F
W29
, (B) 10.4
pM F
W 105, (C) 10.1 pM F
W29
1FW
105
in B
uffe
r F, b
efor
e (s
olid
line
s) a
nd a
fter
(bro
ken
lines
) the
add
ition
of
calc
ium
chl
orid
e to
sat
urat
ion.
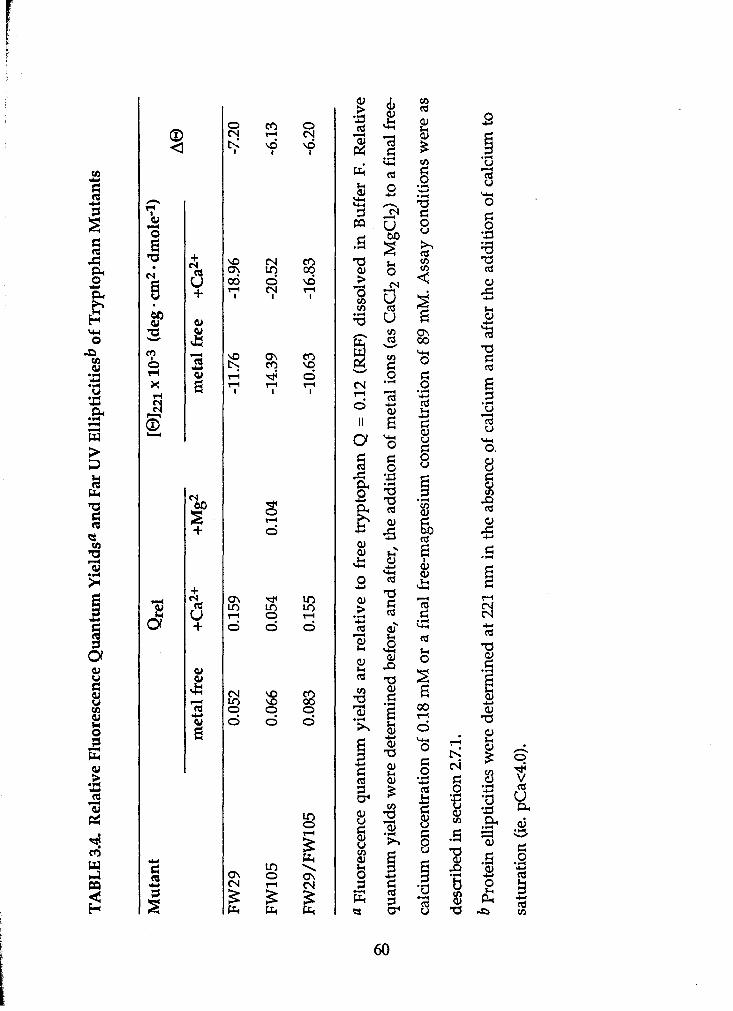
TABLE 3.
4. R
elat
ive
Flu
ores
cenc
e Q
uant
um Y
ield
s" a
nd F
ar W
~ll
i~ti
cit
iesb
of
Try
ptop
han
Mut
ants
Mut
ant
x 10-3 (
deg . cm
2 dm
ole-
1)
met
al f
ree
+Ca2
+ +M
g2
met
al f
ree
+C
a2+
a F
luor
esce
nce
quan
tum
yie
lds
are
rela
tive
to
free
try
ptop
han
Q =
0.1
2 (R
EF)
dis
solv
ed i
n B
uffe
r F.
Rel
ativ
e
quan
tum
yie
lds
wer
e de
term
ined
bef
ore,
and
aft
er, t
he a
ddit
ion
of m
etal
ion
s (a
s C
aCI2
or
MgC
12) t
o a
fina
l fre
e-
calc
ium
con
cent
rati
on o
f 0.
18 m
M o
r a
fina
l fr
ee-m
agne
sium
con
cent
rati
on o
f 89
mM
. A
ssay
con
diti
ons
wer
e as
desc
ribe
d in
sec
tion
2.7.
1.
b P
rote
in e
llip
tici
ties
wer
e de
term
ined
at 2
21 n
m i
n th
e ab
senc
e of
cal
cium
and
aft
er t
he a
ddit
ion
of c
alci
um to
satu
rati
on (
ie. p
Ca<
4.0)
.

FIGURE 3.9. Titration of Far-UV Circular Dichroism
Titration of the far-W protein ellipticity of (A) FW29, (B) W105, (C) FW29/FW105.
Experimental conditions are described in section 2.7.2.

TABLE 3.5. Binding Parameters from Far-W Circular Dichroism
-
Mutant Protein Kassoc (M-l) Hill Coefficient
3.4.2. Absorbance Difference Spectra
The absorbance difference spectra of recombinant mutants perturbed with
calcium appear in Figure 3.10. Difference spectra were generated for the mutant proteins
at two free calcium concentrations 0.9 pM and 0.18 mM. Based on the results of titration
experiments (Figure 3.13), only high affinity sites were expected to be occupied at a free
calcium concentration of 0.9 pM and all sites are expected to be occupied at a free
calcium concentration of 0.18 mM. After the frst addition of calcium chloride (0.9 pM),
no change in the environment of the tryptophan residue in the FW29 mutant (Figure
3.10-A) was apparent. Alternatively, significant changes were observed in the
absorbance of the FW105 (Figure 3.10-B) and FW29/FW105 (Figure 3.10-C) at that
same concentration. The second addition of calcium to a final free calcium concentration
of 0.18 mM caused further transitions in the spectra and tryptophan environments of
FW29 and FW29JFW105 only, but no further change in FW105. The absorbance spectra
of FWlO5 perturbed with magnesium is shown in Figure 3.12-A.
In every case, absorbance difference spectra of mutant proteins were positive in
response to calcium and magnesium ions. Therefore, the absorbance spectra of the
substituted tryptophans are red shifted by metal ions.


3.4.3. Fluorescence
The fluorescence excitation spectra of all three mutant proteins, recorded at an
emission wavelength of 335 nm, were characteristic of tryptophan and closely resembled
the near W absorbance spectra of the proteins.Fluorescence emission spectra of the
recombinant proteins recorded before and after the addition of calcium appear in Figure
3.1 1. The corresponding relative fluorescence quantum yields are presented in Table 3.4.
Calcium induced a 3.1 fold increase in the relative fluorescence quantum yield of FW29.
The addition of calcium to FW105 caused a 1.22 fold reduction in fluorescence quantum
yield and a blue shift in the absorbance maximum from 344 nm (without calcium) to 334
nm (with calcium). Calcium induced a 1.9 fold increase in the fluorescence quantum
yield of FW29/FW105 and a small blue shift in the emission spectrum from 336 nm to
333 nm. The largest difference in the fluorescence intensity of the FW105 apoprotein and
Ca2+-saturated FW105 occurred at 366 nrn and calcium titrations were monitored at this
wavelength for both FW105 and FW29/FW105 proteins.
The fluorescence emission spectra of FW105 before and after the addition of
magnesium is presented in Figure 3.12-B. The fluorescence quantum yield appears in
Table 3.4. Magnesium induced a 1.6 fold increase in the fluorescence quantum yield of
FW105. Alternatively, magnesium had no influence on the fluorescence spectrum of
FW29.
Metal-ion induced changes in the fluorescence spectra of the mutant proteins
allowed calcium binding to be titrated at low-affinity (Ca2+ specific) sites, and calcium
and magnesium binding to be titrated at high-affinity (Ca2+/Mg2+) sites. The calcium
titration curves of FW29, FW105 and FW29/FW105 mutants appear in Figure 3.13 and
binding data are presented in Table 3.6. The fluorescence titration data of FW29 and
FW105 were best fit by monophasic titration curves of the fom:
y = (K,[Ca2+])h . 100 1 1+(K1[Ca2+])h (section 2.8)

Wavelength
(nm)
FIGURE 3
.11.
Flu
ores
cenc
e Em
issi
on S
pect
ra o
f Try
ptop
han
mut
ants
Fluo
resc
ence
inte
nsiti
es (
rela
tive t
o m
axim
al f
luor
esce
nce)
are
gra
phed
as
a fu
nctio
n of
wav
elen
gth.
The
fluo
resc
ence
emis
sion
spe
ctra
(sec
tion
2.7.
1) o
f re
com
bina
nt p
rote
ins
(A) 5
.0 p
M F
W29
, (B
) 5.0
pM
FW
105,
(C) 5.0
pM
FW29
/FW
105
in B
uffe
r F w
ere
reco
rded
bef
ore
(sol
id li
nes)
and
aft
er (b
roke
n lin
es) t
he a
dditi
on o
f ca
lciu
m c
hlor
ide
to a
fina
l fre
e ca
lciu
m c
once
ntra
tion
of 0
.5 m
M o
r 1.
5 m
M.

wavelength (nm) wavelength (nm)
FIGURE 3.12. Spectroscopic Properties of FW105 in Response to Magnesium
(A) Absorbance difference spectrum of 5 pM of FWlO5 at a free magnesium
concentration of 12.1 mM (section 2.7.2). (B) Fluorescence emission spectra of 5 pM
FW105 before (solid line), and after (broken line) titration to a final free magnesium
concentration of 89 m M (section 2.7.1). (C) Titration of the magnesium-induced change
in tryptophan fluorescence of FW105 (section 2.7.1).

FIGURE 3.13. Titration of the Fluorescence of the Tryptophan Mutants
Titration of the intrinsic tryptophan fluorescence of (A) FW29, (B) FW105, (C)
FW29/FW105. Experimental conditions are described in section 2.7.1. Titration data are
plotted as a percentage of the absolute change in the fluorescence intensity.

TA
BL
E 3
.6. B
indi
ng P
aram
eter
s Det
erm
ined
by
Titr
atio
n of
Flu
ores
cenc
e of
Try
ptop
han
Mut
ants
Cal
cium
M
agne
sium
Mut
ant
Cla
ss
KSS
OC
. ( M
-I
h K
SSO
C. (
n4-I
) h
FW
29
1 (
Low
) 3.
29 +
0.01
x 1
05
1.66
Ifi 0
.03
FW
105
1 (
Hig
h)
4.6
6f0
.08
~1
06
2.
15f0
.07
4.64
+ 0.
01 x
102
1.
44 f 0
.05
FW
29/F
W10
5 1 (
Hig
h)
9.91
f 1
.26
x 10
6 2.
15 f 0
.53
2 (L
ow)
1.90
rf:O
.lO x
105
1.47
f0.0
9
$
Tit
rati
on d
ata
wer
e fi
tted
, as
desc
ribe
d in
sec
tion
2.8
, to
an
equa
tion
that
ass
umes
ther
e is
a s
ingl
e cl
ass
(K1 [
~a2
+])
h -100
of
si
tes:
y-
+(K
~
[~a2
+])
h , as
in t
he c
ase
of F
W29
and
FW
105,
or
to
an e
quat
ion
that
ass
umes
ther
e
(K1 [
Ca2
+])h
l.N1
(K2[
ca2+
])h2
N2
are
two
clas
ses
of s
ites:
=
1 +(
K1 [
ca2+
])h1
+ 1 +(~
~[~
a2
+])
h2
, a
s in
the
cas
e of
FW
29
/Fv
05
. T
he
perc
ent
satu
rati
on i
s gi
ven
by y
, K
is
an a
ssoc
iati
on c
onst
ant,
h t
he H
ill
Coe
ffic
ient
, an
d N
the
perc
enta
ge c
ontr
ibut
ion
to f
luor
esce
nce.
The
sub
scri
pts 1 an
d 2
refe
r to
the
fir
st a
nd s
econ
d cl
ass
of s
ites,
resp
ecti
vely
.

The titration data of FW29lFW105 was best fit by a binding equation that assumes there
are two classes of binding sites:
y = (K,[Ca2+])h1 . N, I 1+(K,[Ca2+])h1 + (K2[Ca2+])h2 N2 I 1+(K2[Ca2+])hZ (section 2.8).
The best fitting of these binding data assumed that the parameters N1 and N2 were equal
to -35 and 135, respectively.
The magnesium titration curve of FW105 appears in Figure 3.12-C, and binding
parameters appear in Table 3.6.
3.5. Metal Binding Properties of Fusion FW105AX130 Proteins
The metal binding studies were performed on fusion FW105/IX130 mutant
proteins ( 200 amino acids). Since the study of helix stability would be a comparative
study, working with the fusion protein was convenient, as long as the fusion proteins
could be titrated with calcium and magnesium. Working with the fusion protein reduced
the number of purification steps and therefore the risks of protein deterioration.
3.5.1. Far-UV Circular Dichroism
The far-W CD spectra of the recombinant mutants FW105/IX130. with and
without calcium chloride at saturation (pCa c 4.0) appear in Figure 3.14. Calcium
induced an increase in the negative ellipticity in all the mutant proteins. The relative
change in ellipticity in going from the calcium-free to the calcium-saturated states of the
protein is presented in Table 3.7. The changes in ellipticity values are approximately
equivalent.

FIGURE 3.14. Far-UV Circular Dichroism of FW105/IX130 Mutants
The far-UV circular dichroism (section 2.7.2) of (A) FW105/I130, (B) FW105/IG130,
(C) FWlOWID 130, (D) FW lO5/IN 130, (E) FWlOS/IS 130 and (F) FW105/IT130 was
recorded before (solid lines) and after (broken lines) the addition of calcium to saturation


TA
BL
E 3.7.
Sum
mar
y of
FW105/IX130 S
pect
rosc
opic
Dat
a
All
Sit
es
Hig
h A
ffin
ity
Sit
es
A[8I
2, (
x lo
dl
-log
Kd
AA
G~
le->
~u
t H
ill
Mut
ant
(deg
*cm
2~dm
ol'1
) (k
calm
ol")
C
oeff
icie
nt
A[e
1221
val
ues
repr
esen
t th
e m
ean
chan
ge i
n pr
otei
n el
lipt
icit
y at
221 n
m u
pon
the
addi
tion
of
calc
ium
chl
orid
e to
sat
urat
ion
(pC
ac4.
0),
for
2 - 5
exp
erim
ents
. P
rote
in s
ampl
es h
ad a
con
cent
rati
on
betw
een 7.86 p
M a
nd 1
0.63
pM.
Tit
rati
on d
ata
wer
e fi
tted
, as
desc
ribe
d in
sec
tion 2.8, to
an
equa
tion
tha
t as
sum
es th
ere
is o
ne s
ingl
e
clas
s of
bin
ding
site
s. M
G w
as e
stim
ated
as
indi
cate
d in
sec
tion
2.8.

3.5.2. Fluorescence
The fusion FW105 protein undergoes a magnesium induced increase in
fluorescence emission intensity similar to that of the full length FW105. Calcium induced
a similar decrease in the intensity of the fluorescence of both full length and fusion
FW105. The fluorescence emission spectrum of all FW105/D(130 mutant proteins was
recorded before and after the addition of calcium chloride (Figure 3.15) or of magnesium
chloride (Figure 3.16). Saturating concentrations of metal ions were obtained from
titration experiments (section 2.7.1). Fusion FW lO5/IXl3O proteins responded
differently to the addition of Ca2+ and of Mg2+. Calcium induced a decrease in the
intrinsic fluorescence of all the fusion proteins, whereas magnesium induced an increase
in the intrinsic fluorescence.
Figure 3.15 shows that the fluorescence spectra of the mutant apoproteins are the
same, as are the spectra of the calcium-saturated mutants. The reporter group then,
undergoes the same calcium-induced change in environment, regardless of the secondary
amino acid substitution at positionl30, The addition of magnesium to saturation induced
the same increase in the fluorescence emission spectra of all the fusion FW105/IX130
proteins (Figure 3.16). That is, the reporter group undergoes the same magnesium-
induced change in environment, regardless of the secondary amino acid substitution at
position 130.
The calcium titration curves of the fusion FW105/IX130 mutant proteins appear
in Figure 3.17 and binding data are presented in Table 3.7. The fluorescence titration
data were best fit by monophasic titration curves (section 2.8). Calcium titrations of the
fluorescence change show that there is an increase in the affinity for calcium in the order
Ile < Gly < Asp < Asn < Thr < Ser. The binding curves for FW105/IT130 and
FWlO5/IS130 superimpose and these two mutant proteins show essentially identical
affmities for calcium. The largest difference in half-saturation point is of 0.48 pCa units

wavelength (nm)
300 320 340 360 380 400 420
wavelength (nm)
FIGURE 3.15. Effect of Calcium on the Fluorescence Emission Spectra
of FW105/IX130 Mutants
Fluorescence emission spectra of FW105/IX130 mutant proteins were recorded before
and after the addition of calcium chloride to a final free calcium concentration of 0.5 mM
(section 2.7.1). The apoproteins presented the maximum fluorescence intensities, while
the metal bound forms showed only a fraction of the intensity.

wavelength (nm)
300 320 340 360 380 400 420
wavelength (nm)
FIGURE 3.16. Effect of Magnesium on the Ruorescence Emission Spectra
of FW105lIX130 Mutants
Fluorescence emission spectra of FW105/IX130 mutant proteins were recorded before
and after the addition of magnesium chloride to a final free magnesium concentration of
12 mM (section 2.7.1). The metal bound form presented the maximum fluorescence
intensities, while the apoproteins showed only a fraction of the intensity.
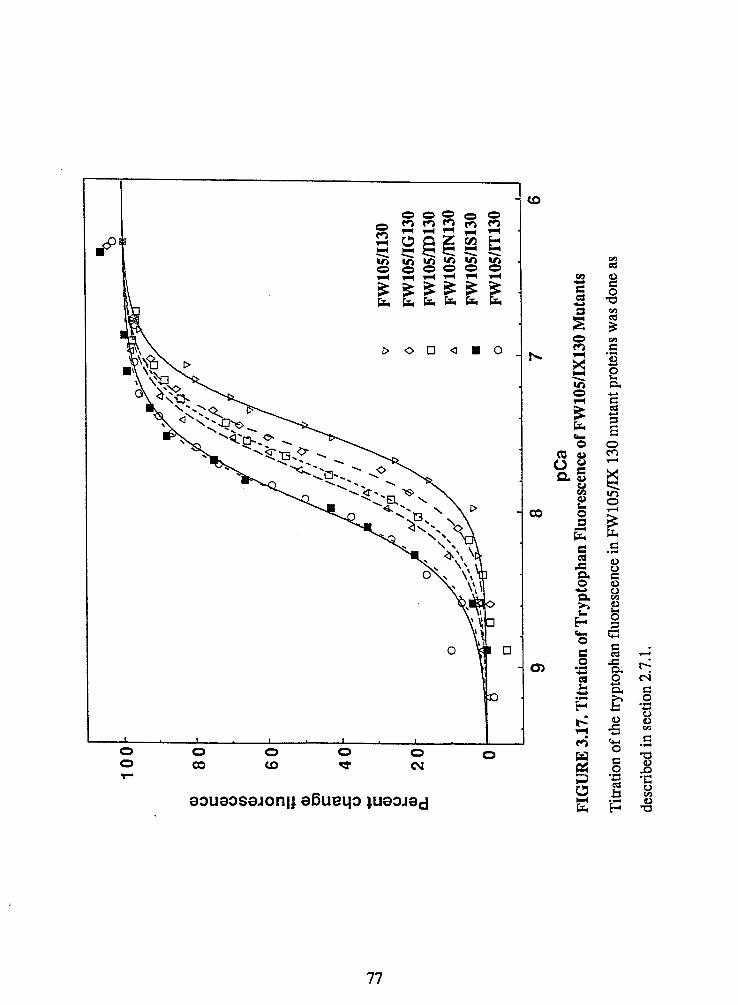
I.
I
I I
I
9 8
7
6 P
C~
FI
GU
RE
3.1
7. T
itrat
ion
of T
rypt
opha
n Fl
uore
scen
ce of
FW
105/
IX13
0 Mut
ants
Titr
atio
n of
the
tryp
toph
an f
luor
esce
nce
in F
WlO
S/IX
130
mut
ant p
rote
ins
was
don
e as
desc
ribe
d in
sec
tion
2.7.
1.

between FW lO5/Il3O and FW105/IT130 or FW lO5/IS 130 mutants. The amino acid
substitutions did not seem to affect the degree of cooperativity between the high-affinity
sites, as indicated by the similarity of the Hill coefficient in the six fitted curves.
The difference in free energy change between every FW105/IX130 mutant and
FW105/I130, M G was calculated (section 2.8) and the values appear in Table 3.7.

4. DISCUSSION
4.1. Troponin C - Tryptophan Mutants
The release of calcium ions from the sarcoplasmic reticulum produces an increase
in the concentration of intracellular calcium (1,2). Calcium binds to TnC in the thin
filaments and this initiates the process of muscle contraction. Calcium binding produces a
conformational change in TnC, which affects the interactions between the troponin
subunits, and between troponin and tropomyosin and actin (thin-filament proteins). This
causes an increase in myosin (thick-filament protein) crossbridge attachment to actin, and
increase in actomyosin ATPase activity which results in tension development in the
muscle fiber. It was the objective of this study to characterize the interaction between
calcium and TnC, and to identify the structural features of TnC that are important for its
function. TnC is the key protein in the regulation of muscle contraction and its study is
important for a better understanding of the contraction process.
The X-ray crystal structure of chicken troponin C (14) shows a protein that has
two domains connected by a long central a-helix. Each calcium binding domain consists
of a pair of binding sites with helix-loop-helix (H-L-H) structural motifs. This structural
arrangement is a common feature of a family of highly homologous intracellular calcium
binding proteins. Like TnC, their activities are regulated by the binding of calcium ions.
A better knowledge of the relationship between the function and structure of TnC can
help in understanding the way these structurally related proteins work. The results
obtained in the study of TnC can be extrapolated to other proteins and thus be of a more
general value.
The gene that codes for chicken TnC has been successfully cloned and expressed
in Escherichia coli (24), and this makes it possible to study relationships between the

structure and function of the protein by site-directed mutagenesis. The X-ray crystal
structure of native chicken TnC (14) is now available at high resolution. Structure
information is essential in the design of useful mutant proteins. An interesting feature of
the native chicken TnC, is that there are no tyrosine or tryptophans in the amino acid
sequence. These amino acids are unique in that they have absorbance maxima close to
280 nm, high extinction coefficients and high fluorescence quantum yields (68). Their
absorption and fluorescence properties are sensitive to changes in environment and
therefore tyrosine and tryptophan can be useful as reporters of ligand binding and of
conformational changes in proteins. Site-directed mutagenesis can be used to introduce
one of these amino acid residues in the TnC sequence, where it can be useful as site-
specific probe or reporter, of ligand binding and conformational change in TnC.
Phenylalanines at position 29 or 105 were substituted by a tryptophan residue to create
the mutant proteins FW29 and FW105, respectively. Also the double mutant
FW29/FW105 was created. The tryptophan residue in the TnC sequence allowed us to
unambiguously assign the fluorescence and absorbance properties of the mutant TnCs to
the position of the substitution in the high-affinity or low-affinity domains.
Phe-29 and Phe-105 occupy equivalent positions in the TnC sequence. Phe-29
precedes the fmt coordinating residue of binding loop I in the low-affinity domain
(Figure 1.4). Phe-105 precedes the first coordinating residue of binding loop III in the
high-afliinity domain. These positions were chosen since the spectral properties of
tryptophans, so close to the binding loops, were predicted to be strongly influenced by
metal ion binding and conformational change (26). The first step in the project was to
characterize the spectral properties of the tryptophan mutant proteins. Trp-29 was
predicted to be able to report binding events occurring in the N-domain. Similarly,
FW105 was designed so that Trp-105 would report binding events and conformational
changes occurring in the C-domain of TnC. In other words, FW29 and FW105 were

expected to be useful in measuring calcium binding to the N- and Cdomains,
independently . The increase in the helical content of TnC, observed in the far-UV CD spectra,
indicates that the protein is undergoing a conformational change as calcium ions bind.
The changes in ellipticity observed on going from the calcium-free to the calcium bound
forms were similar for all three tryptophan mutants and in good agreement with other
reports (22,23). For rabbit skeletal TnC, an average change in protein ellipticity of 8.86
x 103 deg cm2 drnole-1 was reported (22), comparable to 6.51 x 10³ deg cm2dmole-1 at
pH 6.95 in this study.
The data for the titration of the ellipticity of the mutant proteins (Figure 3.9)
could not be accurately fit to a model that involves two classes of binding sites. In
agreement with reports from studies of rabbit skeletal TnC, changes in far-UV circular
dichroism of all the Trp mutant proteins predominantly reflect structural changes in the
high-affmity binding domains. In fact, it was found that approximately 60% to 70% of
the total calcium induced change in ellipticity is contributed by calcium binding to the
high-affinity sites. However, the data was not fit to a biphasic curve that assumes there
are two classes of binding sites. This would have requjred a good estimate of the
contribution of each set of sites to the ellipticity change. Since the titration curves of
high- and of low-affinity sites overlap, the estimate would have been very imprecise and
of little statistical relevance.
The far UV CD studies were important in evaluating the integrity of the mutant
proteins. Regardless of the location of the tryptophan in the mutant proteins in the high-
affinity @W105), low-affinity (FW29) or both (FW29/FW105) domains, calcium
induced similar changes in their CD spectra. These results suggest that the tryptophan
substitutions did not have an effect on the overall conformation of the protein or on its
function.

The UV absorbance difference spectra of the mutant proteins (Figure 3.10)
indicate that there is a change in the environments of Trp-29 and of Trp-105, due to the
calcium-induced structural transitions in the domains. A positive difference in the
extinction coefficient is observed in the difference spectra in the UV region that
corresponds to Trp absorbance bands (from approximately 275 nm to 320 nm). This red
shift in the tryptophan absorbance is attributed to the tryptophan moving from a
relatively polar to a relatively non polar environment as calcium binds to the protein
(69).
The spectra of FW 105 (Figure 3.10-33) showed a calcium-induced transition after
the first addition only. At that concentration, only high-affinity sites were expected to be
saturated. No further changes were observed with the second addition of calcium. This
indicates that Trp- 105 is, in fact, reflecting structural changes occurring at the Cdomain
only.
In contrast, the spectra of FW29 (Figure 3.10-A) were virtually unaffected by the
first addition of calcium, in the region of the tryptophan absorbance bands. A change in
the environment of the Trp-29 was only evident after the second addition of calcium, at
an ion concentration enough to saturate the low-affinity sites.This observation is good
evidence that Trp-29 is a useful probe for monitoring calcium binding in the N-domain.
Magnesium ions also induced a red shift in the absorbance spectrum of FW105 at
wavelengths above 275 nm (Figure 3.12-A). It is interesting that the spectra in Figures
3.12-A and 3.10-A are very similar. The calcium-induced change in the environment of
Trp-29 in the N-domain, is virtually identical to the magnesium-induced change in the
environment of Trp-105 in the Cdomain.
The red shifts observed in the absorbance spectra of FW29 and FW105 imply that
Trp residues become more buried in the protein when calcium is bound. There is a
difference between these experimental results and the conformational change model
proposed by Henberg et. al(13), according to which Phe-29 would become more

exposed. The model is based on the high homology in the sequence and helical
arrangement of the C- and N-domains of TnC. The three dimensional crystal structure
shows that only the C-domain is occupied by calcium, whereas the N-domain is calcium
free. The tertiary structure of the N-domain is in these circumstances quite different from
the structure of the C-domain. According to the model, the N-domain would undergo a
structural rearrangement on binding calcium. The tertiary structure of the low-affinity
domain would then more closely resemble that of the calcium-bound high-affinity sites.
In the model, the change in conformation would result in Phe-29 becoming more
exposed. The change in surface exposure for that residue would be from 46.2 A2 to 55.7
A2, an increase of 9.5 &. A possible explanation for the difference between the
experimental results and the model is that tryptophan at position 29 may adopt a
conformation somewhat different to phenylalanine. Or the conformational change model
may not be entirely accurate.
Fluorescence was the most sensitive and reproducible method of monitoring
metal ion binding to TnC.
Calcium induced very different responses in the spectra of FW29 and FW105, as
indicated by the relative fluorescence quantum yield values (Table 3.4 and Figure 3.1 1-A
and B ). The results from FW29 show that a 3.1 fold increase in the relative fluorescence
quantum yield is associated with calcium induced transitions of the low-affinity sites.
The data from FW105 indicates a reduction in the relative quantum yield and a blue shift
in the absorbance maxima related to calcium induced structural transitions of the high
affinity sites.
The calcium induced increase in the fluorescence intensity of FW29 allowed the
titration of the low-affinity sites at 335 nm and the calcium-induced decrease in the
fluorescence intensity of FW105 allowed the titration of the high-aff~nity sites at 366 nm.
In the double mutant FW29/FW105, the tryptophans were titrated at 366 nm, in order to
be able to detect the transition of Trp-105. Since the titration curves overlap and., since

the contributions of the two tryptophans in FW29/FW 105 to total fluorescence are not
equivalent, it was not possible to estimate binding constants with the same precision as in
the single mutants.
Magnesium had no effect on the fluorescence emission of FW29 nor did it effect
the absorbance properties of the mutant. These observations are in agreement with
previous reports that magnesium does not bind at the N-domain and that the low-affinity
binding sites are calcium-specific (16). On the other hand, the fluorescence emission
spectrum of FWlM was significantly affected by magnesium. It is interesting to note that
the increase in fluorescence quantum yield (1.6 fold) of FW105 to magnesium is similar
to the response of FW29 to the addition of calcium. As was pointed out above,
magnesium induces a change in the absorbance spectrum of FW 105 similar to that
induced by calcium in FW29,
The magnesium-induced increase in the fluorescence intensity of F W 105 allowed
the titration of the high affinity sites at 345 nm (Figure 3.12-C). The association constant
was estimated Ka = 4.64 .f 0.01~102. At the high magnesium concentrations used in the
titration experiments, it is possible for calcium to be an important contaminant. This
could mean that there is a chance that calcium rather than magnesium is titrating the
sites. The absorbance difference spectra for FW105 in Figures 3.10-B and 3.12-A,
clearly show that calcium and magnesium have quite different effects on the environment
of the tryptophan. Therefore, the magnesium titration of FWlO5 is a true estimate of the
magnesium binding constant.
The absorbance difference spectra and fluorescence experiments show that
calcium and magnesium have different effects on the absorbance and fluorescence
properties of Trp- 105. This is not so surprising considering that the coordination number
for magnesium is predominantly six, and has ionic radius of 0.64 A. Calcium has an
ionic radius of 0.99 A and a seven coordinate geometry. Therefore, the conformation that
best accommodates calcium is not optimal for the coordination of magnesium. In other

words, for a calcium-binding site to bind magnesium, a slightly different organization in
the binding loop would be required (15), which would be reflected in the absorbance and
fluorescence experiments.
Both fluorescence and far-W CD calcium titrations show clear evidence of
cooperativity between Ca2+ specific and Ca2+/Mg2+ sites. The evidence of cooperativity in
troponin-C in the literature is contradictory. The techniques that have been used so far in
metal binding studies on TnC - extrinsic fluorescence probes and equilibrium dialysis -
may be disruptive to TnC, as analyzed by Golosinka et.al. (12). The use of tryptophan
chromophores introduced by site-directed mutagenesis, as intrinsic reporters seems a less
disruptive alternative for the study of TnC.
The binding constants estimated for the high-affinity sites in the recombinant
protein FW105 are lower than those found in the literature for the native TnC. Ka =
2x10⁷ (23), Ka = 1 . 8 ~ lo7 (22) for calcium binding, Ka = 4x 10³ (70), Ka = 3x10³ (16) for
the binding of magnesium. This difference was attributed to the difference in the amino
acids located in position 130. In both rabbit skeletal TnC and in the chicken TnC (non-
recombinant proteins), this position in the high-affinity domain is occupied by a
threonine residue. Instead, the recombinant protein has an isoleucine at position 130. The
effects of having a threonine or an isoleucine residue at position 130 in chicken TnC will
be discussed later in this thesis.
Site-directed mutagenesis seems an efficient alternative to chemical methods for
the introduction of reporter groups into recombinant TnC. Trp29 and Trp-105 proved to
be useful as intrinsic reporter groups to monitor metal binding in one domain of the
protein, independently of binding events in the other domain. This was particularly
important in the current study since titration curves overlapped. Titration data for FW29
and FW 105 mutants could be fit to an equation that assumes there is a single class of
sites. Only two parameters are involved in the calculation: 1 binding constant and 1 Hill
coefficient. Calculations from the data of the double mutant FW291FW105 and from far-

UV CD experiments was complicated by the fact that two classes of sites were been
titrated. Fitting the data involves six parameters: 2 binding constants, 2 Hill coefficients
and the relative conmbutions of each class of site to the spectral features. The statistical
significance of the estimated constants is then lower.
Future mutagenesis studies in this recombinant protein should be greatly
simplified by the use of the tryptophan chromophore in the single mutants. Problems
regarding the N-domain should be easier to study using FW29, whereas FW105 would be
useful for studies at the C-domain. In the second part of this project, Trp-105 was used as
an intrinsic reporter in calcium binding experiments in the double mutants FW 105/
IX130.
4.2. Stability of Helix G
In the second part of the project, an interesting structural aspect of chicken TnC
was studied in relation to the function of the protein. The mutant proteins FW105/IX130
were created to probe the relationship between N-cap residue, stability of helix G and
affinity for metal ions in TnC. Trp-105 was used to monitor metal binding at the high-
affinity site of the proteins.
The N-cap is the residue that initiates an a-helix (47). It has non helical dihedral
angles, but it participates in the hydrogen bonding network. The N-cap residue is
believed to play an important role in the stability of helices. In fact, a preference at the
N-cap position for amino acids whose side chain can hydrogen bond to main chain atoms
>NH groups of an amino acid 2 to 3 positions towards the C-terminal (n+2 or n + 3) (47)
has been attributed to the stabilizing effect this hydrogen bond would have on the helix.
The helix could also be stabilized by the favorable interaction of charged amino acids
with the helix dipole (45,50). The N-cap residue that inititates helix G in the high-
affinity domain is Thr- 130 in native TnC and Ile-130 in the recombinant protein (Figure

1.4 and 1.5). Position 130 was chosen for this study since it was previously reported that
native and recombinant TnC, which differ in the amino acid at position 130, differed also
in their affinity for calcium. That is, amino acid residues that are likely to have different
effects on the stability of the helix, confer different for calcium ions. In fact, the
3 dimensional crystal structure shows that the side chain of Thr-130 hydrogen bonds to
aspartic acid at position 133 (14). This stabilizing effect on helix G would be absent in
the recombinant TnC where Ile-130 cannot provide a hydrogen bond acceptor. It is then
interesting to explore the effect of different amino acids at position 130 on the affinity
for calcium, as a model to prove relationships between N-cap residue and helix stability
in proteins. Determining the effect of each amino acid substitution on the stability of
helix G contributes to the understanding of the relationship between amino acid sequence
and secondary structure (helix folding) in proteins.
It is widely accepted that metal binding induces conformational changes in TnC.
Far-UV circular dichroism experiments show that the helical content of the apo protein
increases from 36 % to 55 % in the metal-bound state (7 1). This equilibrium between the
metal-free and metal-bound forms of TnC can be said to be homologous to the
equilibrium between an unfolded and folded protein. The metal-free conformation of
TnC can be viewed as an unfolded stable or semistable TnC. The transition to a structure
of greater helical content in the metal-bound state would correspond to the transition to a
fully folded TnC. The studies on Barnase (53) and T4 lysozyme (5 1) show that amino
acid substitutions at the N-cap of a-helices shift the equilibrium between folded and
unfolded forms of these enzymes. Similarly, it was predicted that amino acid
substitutions at the N-cap of helix G in TnC would shift the equilibrium between a
partially folded (metal-free) and fully folded (metal-bound) protein. If Thr-130 as N-cap
provides greater stability to the helix compared to Ile- 130, it would be equivalent to say
that Thr-130 favours a fully folded conformation of TnC and Ile-130 favours a partially
folded conformation. The effect of the amino acid substitutions at the N-cap can be

interpreted in terms of the relative contribution of the amino acid to the equilibrium
between folded and partially folded proteins.
Far-UV CD experiments done on peptide fragments of TnC (71), show that the
increase in helical content in the native troponin C corresponds to an increase in the
number of helical residues from 57 in the calcium-free form, to 87 in the calcium-bound
form. Substitutions at the N-cap are expected to contribute to the stability of helix G (51,
53) and favor the calcium-bound form of the protein in the equilibrium between bound
and free states. Therefore, an increase in the helical content of TnC solutions relative to
FW105/1130 mutant might be observed before the addition of calcium. However, CD
measures the global helical content of the protein in solution, and the increase in the
number of helical residues due to the contribution of the N-cap would be negligible
compared to the overall helical content. Consequently, CD is not sensitive enough to
detect this small change and no significant differences in the helical content of the mutant
proteins were observed (Figure 3.14).
The far-UV CD spectra of the FW 1 O5/E 130 proteins (Figure 3.14) show the
expected increase in negative ellipticity with calcium bound, and changes in ellipticity
for all the mutant proteins are approximately equivalent (Table 3.7). The changes in
fluorescence intensity when calcium or magnesium bind are also the same for all the
mutant proteins, as indicated by the overlap of the spectra (Figure 3.15 and 3.16).
Therefore, though the spectra are not sensitive enough to detect small changes in the
equilibrium between bound and free states of TnC, they do indicate that the amino acid
substitutions did not affect the global structure of TnC or the conformation and function
of the high-affinity sites.
Titration data in Table 3.7 show that the Hill coefficient of all FW105/IX130
mutants do not vary significantly, that is, the amino acid substitutions at position 130 do
not affect the cooperativity of the high-affinity sites. This is evidence that the high-
affinity binding sites function in unison.

The data from the titration of the fluorescence of the FW105/IX130 mutants show
differences in their binding constants. FW105AG130 and FW105/I130 have the lower
affinities for calcium. EW105fiS 130 and WlO511Tl3O show the highest and FW lO5/
ID 130 and FW1 OS/IN 130 have intermediate values of Ka.
Ile and Gly had the expected effect on the calcium affinity at the high affmity
sites in the mutants FW10511130 and FW105/IG130. Both amino acid residues at the N-
cap are unable to hydrogen bond to unpaired backbone >NH groups and cannot
contribute to the formation of the N-terminus of helix G. There is a difference of 0.14
pCa units between Ile and Gly, which corresponds to a difference in free energy change
of 0.2 kcal/mole between FW lO5/Il3O and FWlOSIIGl30. Between FW105/IT130 and
FW lO5/Il3O there is a difference of 0.48 pCa units and a M G = 0.66 kcal/mole. Thr-130
in the wild type TnC participates in several H-bond interactions that involve water
molecules and residues in helix G . Oyl of Thr-130 H-bonds to the main chain N of Asp-
133 and to a structured water (# 36). At the same time this water molecule is H-bonded
to Os2 of Glu- 132 and to another structured water molecule (#52). Be would not
participate in these interactions and would destabilize the helix. This could explain the
large difference in affmity for calcium between FW lO5/ITl3O and FWlO51Il30. Gly
would allow more space for a more adequate hydrogen bonding with water, which would
account for the higher affinity for calcium observed for FW10511G130 with respect to the
Ile mutant protein.
The titration curves of FWlOS/IS 130 and FW105/IT130 overlap and have
estimated Ka that are very similar. These amino acid residues differ only by a y-methyl
group. In the crystal s m c t m this y-methyl group does not appear to have hydrophobic
interactions with neighboring residues. It can be expected then that Ser and Thr at the N-
cap position will not differ very much in their contributions to the stability of helix G.
This can explain the similar calcium affki ties of FW lO5/IS 130 and EW1 OWIT1 30
mutants.
Aspartic acid and asparagine at position 130 were expected to show higher
affinities than what was observed experimentally. The side chain of aspartic acid can
serve as H-bond acceptor and will thus stabilize the helix. On the other side, the negative
charge of aspartic acid could favorably interact with the helix dipole at the N-terminal
end. However, FW105D130 is not the best N-cap. To explain this, the structure that
surrounds the N-cap position must be considered. The sequence immediately following
position 130 is Glu - Glu - Asp. The high concentration of negatively charged residues
close to the N-cap position may lead to charge repulsion interactions. Aspartic acid at
position 130 would then have a more destabilizing than stabilizing effect.
These results may indicate that the preference for one amino acid over another
will depend on the sequence context in which the amino acid is found. Aspartic acid
might be a preferred N-cap when there are no adjacent negative charges in the sequence.
According to the study by Richardson et. al. (47), asparagine is highly preferred
as N-cap residue. Experimentally it was observed that FW105/IN130 has an affinity
lower than FW105/IT130 by 0.19 pCa units, which corresponds to a M G = 0.26
kcdmole. It is difficult to explain this difference, since the carbonyl oxygen (Oy) in
asparagine can accept a hydrogen bond from the backbone >NH group. The side chain -
NH, group is available for other hydrogen bond interactions with water, for instance. It is
also possible for the-NH, group to discourage helix propagation in the N-terminal
direction, since it can compete with the backbone to provide the interaction. In the
absence of a crystal structure for this mutant protein, it is difficult to interpret these
results. Contrary to what was expected, Asn was not the best N-cap for helix G. These
results agree with those from a study on Barnase (53) where the substitution of Thr by
Asn at the N-cap was also destabilizing.
The overall results indicate that threonine is the preferred residue, together with
serine at the N-terminus of helix G. It is worth noting that Thr is always the N-cap in
helix G and in helix C of TnC and of calmodulin. Either Ser or Thr are the N-cap

residues in helices A, B and E (15). In the case of TnC, the results show that the native
protein has a N-cap residue that guaranties the highest affinity for calcium at the N-
domain.
Substitutions at the N-cap had a measurable effect on the affinity for calcium in
the C-domain of TnC. The evidence from the literature (40,45,47,50,51,53), shows
that the N-cap residues affect the stability of helices. Therefore, it is possible that the
observed difference in ion affinity is due to the different contribution of the N-cap
residues to the stability of helix G. If a thermodynamic relationship truly exists between
helix stability and ion affinity in the C-domain, the same relationship may exist in the N-
domain and in structurally related proteins. Factors that affect the stability of the helix
will regulate the affinity for calcium, and in this way calcium-affinity is fine-tuned in
calcium binding proteins with helix-loop-helix motifs.
More detail and a better understanding of the relationship between N-cap residue,
stability of helix G and calcium affinity would be possible if the structure of mutants
proteins were determined, for example, by *H-NMR or X-ray crystallography.
If the N-cap residue is important in determining the equilibrium between metal-
free and metal-bound states of TnC, it would also be important in the equilibrium
between unfolded and folded TnC. It would be interesting to characterize the mechanism
by which the N-cap contributes to this equilibrium. The N-cap residue could destabilize
the unfolded free-state of TnC, it could stabilize the folded, metal-bound state, or both.
These situations are represented in Figure 3.18 for the FW105/IT130 mutant, relative to
FW105/1130. AG,T represents the destabilization of the unfolded free-state of TnC by
Thr-130, AG,T represents the stabilization of the folded, metal-bound state, and (AGcT )
represents both situations occurring simultaneously. These possibilitites could be
analyzed in a future study by urea denaturation experiments on both the metal-free and
metal-bound FW lO5/IXl3O mutants.

1 b
Re
ac
tio
n
Co
or
din
ate
Fig
ure
3.18
. Com
para
tive
Gib
bs F
ree
Ene
rgy
Dia
gram
of
FW
105/
IT13
0 ve
rsus
FW
105/
1130
The
figu
re re
pres
ents
the
Gib
bs fr
ee e
nerg
y (G
) dia
gram
for t
he e
quili
briu
m b
etw
een
calc
ium
-bou
nd (T
nC . C
Q+)
and
calc
ium
-fre
e for
ms
(TnC
+ 2C
a2+)
of t
he h
igh-
affi
nity
site
s in
the
mut
ants
FW105/1130 a
nd FW105/IT130.
The
upp
er b
ars
repr
esen
t the
cal
cium
-bou
nd fo
rms
of t
he p
rote
in, t
he lo
wer
bar
s th
e ca
lciu
m-f
ree
form
s. A
G is
the
free
ene
rgy
chan
ge in
the
equi
libri
um b
etw
een
thes
e tw
o pr
otei
n fo
rms.
AG
aT, A
GZ
and
, A
G,T
repr
esen
t thr
ee p
ossi
bilit
ies
for t
he th
reon
ine
mut
ant t
o
have
a s
mal
ler A
G th
an th
e is
oleu
cine
mut
ant (
AG
1), a
ccou
ntin
g fo
r the
AA
G o
bser
ved
expe
rim
enta
lly.

In other future studies, it will be interesting to determine the physiological
consequences that mutations at the N-cap position can have. Muscle fibers depleted of
TnC can be reconstituted with FW105DX130 variants. TnC with different high-affinities
for calcium incorporated into a fibre system can tell about the contribution of the C- and
N-domains to the regulation of muscle contraction.
4.3. Conclusions
The characterization of the tryptophan mutants was an important first step in the
study of TnC by the method of site-directed mutagenesis. FW29 and FW105 enable us to
monitor metal binding to the N-domain without interferences due to metal binding at the
C-domain. Trp-105 proved to be sensitive to subtle changes in the conformation of the
high-affinity sites. This can be as important in future mutagenesis studies of structure and
function relationships in TnC as it was in the study of the FW105/IX130 mutants.
The substitutions at position 130 by site-directed mutagenesis revealed important
aspects of the function of the high-affinity sites in TnC. The calcium affinity at the C-
domain appears to be related to the stability of an a-helix, and this relationship could
also exist in the N-domain, and maybe in structurally related proteins. Future
experiments with the FW105/IX130 mutants will help to obtain a more complete view
of the function of the high-affinity domain in the regulation of muscle contraction by
TnC.
Site-directed mutagenesis was a useful method to probe the structure and function
of TnC. Other aspects of the structure and function of this important muscle protein can
also be addressed in future experiments using this powerful technique.

5. REFERENCES
1. Zot, A., Potter, J. (1987) Ann. Rev. Biophys. Chem. 16,535-559
2. Potter, J.D., & Johnson, J.D. (1982) in Calcium and Cell Function. 2, 145-173., ed.
W. Cheung, New York: Academic
3. Ebashi, S. (1963) Namre 200, 1010.
4. Ebashi, S., & Ebashi, F. (1964) J. Biochem. 55,604-613
5. Ebashi, S., Kodama, A., & Ebashi, F. (1968) J. Biochem. 64,465-477
6. Greaser, M.L., & Gergely, J. (1971) J. Biol. Chem. 246,4226-4233
7. Greaser, M.L., & Gergely, J. (1973) J. Biol. Chem. 248,2125-2133
8. Darnell, J., Lodish, H., & Baltimore, D. (1986) in Molecdar Cell Biology, pp 821. Ed.
W. H. Freeman and Company, N.Y.
9. Stryer, L. (1988) in Biochemistry, pp 933. Ed. W. H. Freeman and Company, N.Y.
10. Collins, J.H., Potter, J.D., Horn, M.J., Wilshire, G. & Jackson, N. (1973) FEBS Lett,
36,268-272
11. Wilkinson, J.M. (1976) FEBS Lett. 70,254-256
12. Golosinka, K., Pearlstone, J.R., Borgford, T., Oikawa, K., Kay, C.M. Carpenter,
M.R. & Smillie, L.B. (1991) J. Biol. Chem. 266,15797-15809
13. Herzberg, O., & James, M.N.G. (1985) Nature 313,653-659
14. Satyshur, K.A., Rao, S.T., Pyzalska,D., Drendel,W., Greaser,M., & Sundaralingam,
M. (1988) J. Biol Chem. 263,1628-1647
15. Strynadka, N.C.J., & James, M.N.G. (1989) Ann. Rev. Biochem. 58,951-998
16. Potter, J., & Gergely, J. (1975) J. Biol. Chem. 250,4628-4633
17. Sheng, Z., Strauss, W.L., Francois, J., & Potter, J.D. (1990) J. Biol. Chem. 265,
21554- 21560
18. Zot, H.G., Guth, K., & Potter, J.D. (1986) J. Biol. Chem. 261, 15883-15890

19. Grabarek, Z., Grabarek, J., Leavis, P.C., & Gergely, J. (1983) J. Biol. Chem
258,14098-14102
20. Grabarek, Z., Tan, R., Wang, J., Tao, T., & Gergely, J. (1990) Nature 345,132-135
21. Iida, S. (1988) J. Biol. 103,482-486
22. Hincke, M.T., Mc Cubbin, W.D., & Kay, C.M. (1978) Can. J. Biochem. 56,384-395
23. McCubbin, W.D., Oikawa, K., Sykes,B.D. & Kay, C.M. (1982) Biochemistry
21,5948-5956
24. Reinach, F.C., & Karlsson, R. (1988) J. Biol. Chem. 263,2371-2376
25. Xu, G-Q., & Hitchcock-DeGregori, S.E. (1988) J. Biol. Chem, 263,13962-13970
26. Pearlstone, J.R., Borgford, T., Chandra, M., Oikawa, K., Kay, C.M. & Smillie, L.B.
(1992) Biochemisny accepted for publication
27. Forsen, S., Vogel, H.J., & Drakenberg, T. (1986) Calcium and Cell Function
(Cheung,W.Y.ed) 6,113- 157, Academic Press,N.Y.
28. Haiech, J., Klee, C.B., Demaille, J.G. (1981) Biochemistry 20,3890-3897
29. Linse, S., Brodin, P., Drakenberg, T., Thulin, E., Sellers, P., Elmden, K.,
Grundstrom, T., & Forse, S. (1987) Biochemistry 26,6723-6735
30. Tsuda, S., Hasegawa, Y., Yoshida, M., Yagi, K. & Hickichi, K. (1988) Biochemistry
27,4120-41 26
31. Yamakita, Y., & Iio, T. (1989) J. Biochem. 105,870-874
32. Brandt, P.W., Cox, R.N., & Kawai, M. (1980) Proc. Natl. Acad. Sci. 77,4717-4720
33. Grabarek, Z., Grabarek, J., Leavis, P.C. & Gergely,J. (1983) J. Biol. Chem.
258,14098-14102
34. Ogawa, Y. (1985) J. Biochem. 97,101 1-1023
35. Zot, H.G., & Potter, J.D. (1987) J. Musc. Res. Cell. Motil. 8,428-436
36. Leavis, P.C., Rosenfeld, S.S., & Gergely. (1978) J. Biol. Chem. 253,5452-5459
37. Grabarek, Z., Leavis, P.C., & Gergely, J. (1986) J. Biol. Chem. 261,608-613
38. Iida, S. (1988) J. Biochem. 103,482-486

39. Richardson, J.S. Adv. Protein. Chem. (1981) 34, 167
40. Presta, L.G., & Rose, G.D. (1988) Science 240,1632-1641
41. Chou, P.Y., & Fasman, G.D. (1974) Biochemistry 13,211-222
42. Hol, W.G.J. (1985) Prog. Biophys, Molec. Biol. 45, 149-195
43. Hol, W.G.J., van Duijnen, P.T., & Berendsen, H.J.C. (1978) Nature 273,443-446
44. Marqusee, S., & Baldwin, R.L. (1987) Proc. Natl. Acad. Sci. 84,8898-8902
45. Shoemaker, K.R., Kim, P.S., York, E.J., Stewart, J.M., & Baldwin,R.L. (1987)
Nature 326,563-567
46. Shoemaker, K.R., Kim J.S., Brems, D.N., Marqusee, S., York, E.J., Chaiken, I.M.,
Stewart, J.M., & Baldwin, R.L. (1985) Proc. Natl. Acad. Sci. 82,2349-2353
47. Richardson, J.S., & Richardson, D.C. (1988) Science 240, 1648-1652
48. Fairman, R., Shoemaker, K.R., York, E.J., Stewart, J.M., & Baldwin, R.L. (1989)
Proteins: Structure, Function, and Genetics 5,l-7
49. Shaw, G.S., Hodges, R.S., & Sykes, B.D. (1991) Biochemistry 30,8339-8347
50. Nicholson, H., Becktel, W.J., & Mathews, B.W. (1988) Nature 336,651-656
51. Nicholson, H., Anderson, D.E., Dao-pin, S., & Mathews, B.W. (1991) Biochemistry
30,9816-9828
52. Sali, D., Bycroft, M., & Fersht, A.R. (1988) Nature 335,740-743
53. Serrano, L., & Fersht, A.R. (1989) Nature 342,269-299
54. Golosinka, K., Pearlstone, J.R., Borgford, T., Oikawa, K., Kay, C.M. Carpenter,
M.R., & Smillie, L.B. (1991) J. Biol. Chem. 266,15797-15809
55. Nagai, K., Perutz,M.F., & Poyart,C.(1985) Proc.NatlAcad.Sci. USA 82,7252-7255
56. Sambrook, J., Fritsch,E.F., & Maniatis, T. 1989. Molecular Cloning, 2nd Ed. Cold
Spring Harbor Laboratory Press.
57. Messing, J.(1983) Methods Enzymol.l01,20-78
58. Nagai,K., & ThogersenJ3.C. (1987) Methods Enzymol. 153,461-481
59.Zoller,M., & Smith,M.(1982) Nucleic Acids Res. 10,6487-6500

60. Carter,P., Bedouelle,H., & Winter,G.(1985) Nucleic Acids Res.l3,4431-4443
61. Sanger, F., Nicklen, S., & Coulson, R.(1977) ProcNatlAcadSci. USA 74,5463-
5467
62. Laemmli, U.K. (1970) Nature 227,680-685
63. Markwell, M.A.K., Haas, S.M., Tolbert, N.E., & Bieber,L.L. (1981) Methodr
Enzyrn01.72~296-303
64. Lowry, O.H., Rosebrough, N.J., Farr, A.L., & Randall, R.J.(1951) J.Biol.Chem.193,
5-275
65. Borresen, H. C. (1967) Acta. Chem. Scand. 21,920-936
66. Schippers, P.H., & Dekkers, H.P.J.M.(1981) Anal.Chem.53,778-782
67. Perrin, D.D., & Sayce, I.G.(1967) Talantal4,833-842
68. Cantor, C.R., & Schimmel, P.R. in Biophysical Chemistry. Part 11: Techniques for
The Study of Biological Structure and Function.
69. Donovan, J.W. (1969) in Physical Principles and Techniques of Protein Chemistry,
Part A (Leach, S.J., Ed) pp 101-170, Academic Press, N.Y.
70. Johnson, J.D., Collins, J.H., & Potter, J. D. (1978) J. Biol. Chem. 253,6451-6458.
71. Reid, R.E., Gariepy, J., Saund, A.K., & Hodges, R.S. (1981) J. Biol. Chem.53,2742-
2751.


![Alternative splicing of [ -tropomyosin pre-mRNA: cis-actinggenesdev.cshlp.org/content/5/11/2096.full.pdf · [Key Words: [3-Tropomyosin gene; alternative splicing; RNA processing]](https://img.pdfslide.net/doc/110x75/5f0253b47e708231d403b8ce/alternative-splicing-of-tropomyosin-pre-mrna-cis-key-words-3-tropomyosin.jpg)