Embed Size (px)
Citation preview
ISBN 978-92-897-1007-7
9 7 8 9 2 89 7 1 0 07 7
Second European Quality of Life Survey
The European Foundation for the Improvement of Living and Working Conditions (Eurofound) is a tripartite EU body, whose role is to provide key actors in social policymaking with findings, knowledge and advice drawn from comparative research. The Foundation was established in 1975 by Council Regulation EEC No 1365/75 of 26 May 1975.
Participation in volunteering and unpaid work
4 5 TJ-79-11-104-EN-C
doi: 10.2806/1399
Just over 20% of Europeans take part in voluntary and charitable activities,
though there are wide differences between Member States with the participation
rate in the EU15 exceeding that in the New Member States. The highest rates are
seen in the Nordic Member States (Denmark, Finland, Sweden) and the lowest
rates are in Bulgaria, Greece, Malta, Portugal, Romania and Spain. People with
a high level of educational attainment are more likely to be volunteers, as are
those who attend religious services regularly. Based on data from the second
European Quality of Life Survey (EQLS), conducted by Eurofound in 2007,
this report examines the factors underpinning people’s decision to volunteer,
the amount of time devoted to volunteering among those who participate and
whether participation is associated with greater life satisfaction. The study also
looks at unpaid work (which includes caring and housework), the amount of
time spent on it and the characteristics of those who do it frequently.
Second European Quality of Life Survey
Participation in volunteering and unpaid work

Authors: Patrick McCloughan, William H. Batt, Mark Costine and Derek ScullyResearch institute: Indecon International Economic ConsultantsResearch managers: Klára Fóti and Robert AndersonResearch project: European Quality of Life Survey
Wyattville Road, Loughlinstown, Dublin 18, Ireland - Tel: (+353 1) 204 31 00 - Fax: (+353 1) 282 42 09 / 282 64 56
email: [email protected] - website: www.eurofound.europa.eu
Second European Quality of Life Survey
Participation in volunteering and unpaid work
Cataloguing data can be found at the end of this publication.
Luxembourg: Publications Office of the European Union, 2011
doi: 10.2806/1399ISBN 978-92-897-1007-7
© European Foundation for the Improvement of Living and Working Conditions, 2011
For rights of translation or reproduction, applications should be made to the Director, European Foundation for the Improvement of Living and Working Conditions, Wyattville Road, Loughlinstown, Dublin 18, Ireland.
The European Foundation for the Improvement of Living and Working Conditions (Eurofound) is an autonomous body of the European Union, created to assist in the formulation of future policy on social and work-related matters. Further information can be found on the Foundation website at www.eurofound.europa.eu
European Foundation for the Improvement of Living and Working ConditionsWyattville RoadLoughlinstownDublin 18IrelandTelephone: (+353 1) 204 31 00Fax: (+353 1) 282 42 09 / 282 64 56Email: [email protected]
Printed in Denmark
The paper used in this book is chlorine-free and comes from managed forests in northern Europe. For every tree felled, at least one new tree is planted.
Printed matter541 006
NORD
IC ENVIRONMENTAL LABEL
v
Foreword
The European Quality of Life Survey (EQLS) was carried out by the European Foundation for the Improvement of Living and Working Conditions (Eurofound) for the first time in 2003, when it covered 28 countries (the 15 EU Member States, 12 forthcoming Member States and Turkey). Eurofound’s second wave of the EQLS, which was carried out in 2007, offers a wide-ranging view of the diverse social realities in 31 countries – the current 27 EU Member States, along with Norway and the three candidate countries of Croatia, the Former Yugoslav Republic of Macedonia and Turkey. Many of the questions posed in the first EQLS in 2003 were asked again on issues such as employment, income, education, housing, family, health, work–life balance, life satisfaction and the perceived quality of society.
In 2008, Eurofound commissioned secondary analyses of the EQLS data around key policy themes. The selected themes for the first set of secondary analyses were: trends in quality of life in Europe 2003–2008; living conditions, social exclusion and mental well-being; family life and work; subjective well-being; and quality of society and public services.
This report is the first in a second set of secondary themes and examines participation in volunteering and unpaid work. Its publication is timely – since 2011 is designated European Year of Voluntary Activities Promoting Active Citizenship – and topical, since volunteering can help ease economic and social tensions arising in the wake of the current economic crisis.
The analysis provides empirical evidence on volunteering and unpaid work activities across the European Union, examining issues such as the factors underpinning people’s decision to volunteer, the amount of time devoted to volunteering among those who participate and whether participation is associated with higher life satisfaction. The study also looks at unpaid work, which includes caring and housework, the amount of time spent on it and the characteristics of those who do it frequently. The relationship between religious participation and voluntary activities is also explored, as is the extent of participation in political activities and civil society.
The study found a wide variation between Member States over the extent of volunteering and unpaid work. It also confirmed previous research findings that, while many people are willing – in principle – to volunteer, most do not. This has implications for future EU policy initiatives to promote volunteering and unpaid work.
Volunteering contributes to skills development and economic growth, and strengthens social cohesion. We hope that this report will fuel the EU policy debate on how best to promote volunteering against a background of the celebrations during the European Year of Volunteering of the commitment of existing volunteers and the challenge to those many Europeans who are not yet active volunteers.
Juan Menéndez-Valdés Erika Mezger Director DeputyDirector
vi
Country codes
EU15 15 EU Member States prior to enlargement in 2004 (Austria, Belgium, Denmark, Finland, France, Germany, Greece, Ireland, Italy, Luxembourg, the Netherlands, Portugal, Spain, Sweden and the United Kingdom)
NMS12 12 new Member States, 10 of which joined the EU in 2004 (Cyprus, the Czech Republic, Estonia, Hungary, Latvia, Lithuania, Malta, Poland, Slovakia and Slovenia) and the remaining two in 2007 (Bulgaria and Romania)
EU27 27 EU Member States
EU27
AT Austria LV Latvia
BE Belgium LT Lithuania
BG Bulgaria LU Luxembourg
CY Cyprus MT Malta
CZ Czech Republic NL Netherlands
DK Denmark PL Poland
EE Estonia PT Portugal
FI Finland RO Romania
FR France SK Slovakia
DE Germany SI Slovenia
EL Greece ES Spain
HU Hungary SE Sweden
IE Ireland UK United Kingdom
IT Italy
vii
Contents
Foreword v
Executivesummary 1
Introduction 3
1 – Reviewofpreviousresearchonvolunteering 7
Factors influencing volunteering 7
Incidence and frequency of volunteering in Europe 7
Determinants of volunteering 8
Volunteering and subjective well-being 9
Religious and civic participation and volunteering 10
Unpaid work 10
2 – Volunteering 13
Frequency of participation 13
Time spent on volunteering 17
Subjective well-being and volunteering 18
Conclusions 20
3 – Unpaidwork 21
Frequency of unpaid work 21
Time spent on unpaid work 25
Conclusions 29
4 – Religiousparticipationandcivicandpoliticalinvolvement 31
Frequency of religious participation 31
Civic and political involvement 32
Feelings regarding time spent on volunteering and political activities 34
Conclusions 35
5 – Conclusionsandpolicyimplications 37
Overall conclusions 37
Policy implications 38
SecondEuropeanQualityofLifeSurvey–Participationinvolunteeringandunpaidwork
viii
Bibliography 40
Annex:AnalyticalapproachtothesecondEQLSdata 46
Dependent variables 46
Explanatory variables 47
Econometric methods 48
Religious participation, civil society and political participation 49
Summary of econometric regression results for volunteering 50
Summary of econometric regression results for unpaid work 51
Summary of econometric regression results for civil society and political involvement 54
1
Overview
This study provides empirical evidence on volunteering and unpaid work activities in the European Union. The definition of volunteering is challenging, particularly in a cross-country comparison. A clear distinction between formal and informal volunteering is desirable but difficult to achieve, given that traditions and perceptions in the Member States are diverse. This study focuses on formal volunteering – that is, voluntary work performed in an organised manner, usually under the auspices of an organisation.
The findings are based on the second European Quality of Life Survey (EQLS), which was carried out by the European Foundation for the Improvement of Living and Working Conditions (Eurofound) in 2007. Among the issues examined in this study are the factors underpinning people’s decision to volunteer, the amount of time devoted to volunteering among those who participate and whether participation is associated with greater life satisfaction. The study also looks at unpaid work, which includes caring and housework, the amount of time spent on it and the characteristics of those frequently involved in it.
Policycontext
Volunteering can be a means of gaining knowledge, exercising skills and extending social networks. This can lead to new or better employment opportunities as well as personal development. But volunteers are also motivated by a basic desire to help others, especially the more vulnerable. Volunteering, therefore, not only contributes to skills development and the economy but also strengthens solidarity and social cohesion, and can make a contribution to inclusive growth, as envisaged by the Europe 2020 strategy.
This study comes at the start of the European Year of Voluntary Activities Promoting Active Citizenship (2011). The main aim of the European Year is ‘to promote deeper and more structured dialogue and exchange of good practices on these issues between authorities and other stakeholders’. Further objectives are to raise awareness of the importance of volunteering across Europe as well as to help voluntary organisations improve the quality of their activity through encouraging networking and cooperating with other sectors and organisations. The European Year could help make this people-to-people activity more efficient even in those Member States where volunteering is less traditional and this type of activity is less widespread.
Keyfindings
■ More than one fifth of Europeans (slightly above 20%) participate in voluntary and charitable activities. The highest rates of participation are in Denmark, Finland and Sweden, where on average 45% of those aged 18 years and above participate in volunteering. In Greece, Malta, Portugal and Spain and the newest Member States – Bulgaria and Romania – the participation rate averages between 10% and 15%. The participation rate in the EU15 exceeds that in the New Member States (NMS12).
■ People with a high level of educational attainment are more likely to be volunteers. In terms of age, the peak age for frequent volunteering is between 45 and 50 years. Moreover, people who regularly attend religious services are also more likely to participate frequently in voluntary and charitable activities.
Executive summary
SecondEuropeanQualityofLifeSurvey–Participationinvolunteeringandunpaidwork
2
■ Those who do participate in voluntary and charitable activities spend on average 6.5 hours per week in both the EU15 and NMS12, which suggests that people in countries with relatively low levels of participation nevertheless tend to devote longer average spells of time when they do participate.
■ People with high levels of educational attainment devote, on average, between 1.5 and 1.7 hours more per week to voluntary and charitable activities than those with lower levels of attainment; men devote, on average, about one hour more per week than women.
■ Those who are, overall, satisfied with their lives in general are more likely to participate in volunteering frequently.
■ People frequently involved in unpaid caring, be it for children or elderly/disabled relatives, are less likely to participate in voluntary and charitable activities.
■ On average, people in the NMS12 spend more hours per week on unpaid work activities than those in the EU15. Women spend almost twice as many hours per week on unpaid work than men.
■ There is a higher level of regular attendance of religious services in the NMS12 than with the EU15. Young people, people with high levels of educational attainment and those in the upper income quartile are less likely to attend frequently.
■ Most people in the EU15 and NMS12 do not participate in political or civil activities, although residents of the former report a higher level of involvement than those of the latter.
■ People who feel that they spend ‘too little’ time on voluntary work or political activities tend to be in employment or self-employed, with low levels of educational attainment. They are more likely to be women and part of a household consisting of a couple plus children.
Policypointers
The European Year (2011) provides a unique opportunity to promote volunteering across Europe. This is all the more topical, since volunteering has the potential to ease the economic and societal tensions arising in the wake of the current economic crisis. Exchange of good practice across Member States, as well as exploring and showing the opportunities volunteering can provide, is essential.
Research suggests that the number of people willing to engage in voluntary activity is much higher than those who actually do so. According to this study, people with low levels of educational attainment tend to feel that they spend too little time on volunteering. This points to a need to review existing legal and other barriers (such as high requirements for specific skills), which discourage less skilled people from volunteering. Exchange of good practice should include voluntary activities requiring low and less specific skills. Good practice examples for skill development, aimed specifically at preparing potential volunteers, would also be useful.
Practical arrangements are needed for more recognition of experience and skills gained during voluntary work. In this respect, the publication of European guidelines for the validation of non-formal and informal learning is a noteworthy initiative. Such initiatives could also help those currently out of work or with low educational attainment to be integrated into the labour market.
Women and people who are part of a household with children are also among those who believe that they spend too little time on voluntary work or political activities. Unpaid work activities seem to have an important influence on people’s capacity to be involved in volunteering. The precise relationship needs to be examined further before developing policies that would facilitate a better combination of unpaid work and volunteering.
3
Introduction
This study is primarily concerned with volunteering and other forms of activity outside of paid work in the European Union (EU). Based on the findings of the second European Quality of Life Survey (EQLS) carried out by the European Foundation for the Improvement of Living and Working Conditions (Eurofound) in 2007, the results of new empirical analysis on the frequency of participation and on hours per week spent on volunteering and unpaid work activities are reported. The report also seeks to identify factors that increase the likelihood of a person being involved in volunteering. A better understanding of these factors will help decision-makers to devise policies that could increase levels of volunteering.
Volunteering and other forms of participation in civil society are closely linked to the core values of the European social model, mainly through the positive and significant influence they exert on the functioning of a democratic society. Volunteering can be regarded as a direct expression of solidarity due to the role it has traditionally played, among other things, in protecting vulnerable groups and individuals. Raising awareness of its importance across Europe is the main aim of the European Year of Voluntary Activities Promoting Active Citizenship (2011). If the campaigns, events and other programmes during the European Year meet expectations, it could also contribute to the long-term goal of an inclusive growth, one of the key objectives of the Europe 2020 strategy. Indeed, volunteering could help in meeting the long-term challenges Europe has to face: demographic change, an ageing workforce, sustainable public finances (including welfare provisions), etc.
It is clear that volunteering cannot substitute for social services. However, it can play a complementary role. For example, in view of population ageing across Europe, an increased demand for elderly care is expected. This is an activity where there is much scope for volunteering – as examples in some Member States have already shown. Undoubtedly, voluntary activity also has an important role to play in a broader context: in providing and sustaining good quality social services through more volunteers being involved both as service providers and as persons helping in users’ assessment of services. The challenge is how to provide adequate professional guidance and supervision for volunteers, which allows them to support the provision and delivery of these services.
This report is structured in five chapters.
Chapter 1 provides a short overview of previous research on the issue, conducted by both Eurofound and other organisations.
Chapter 2 examines EQLS data on volunteering. Volunteering generally comprises a large range of activities undertaken of a person’s own free will, choice or motivation without concern for financial gain. Participation in voluntary activities is a ‘win–win’ situation in which individual volunteers, local communities and society more generally benefit. In the second EQLS, volunteering is captured in two ways:
■ as an activity outside of paid work (‘voluntary and charitable activities’);
■ as an area of daily life in which people can spend their time (‘taking part in voluntary work or political activities’).
For the first of these definitions, survey data provide us with information on the frequency with which Europeans are involved in voluntary and charitable activities, ranging from ‘never’ to ‘every day’. The second question provides us with data on average hours per week spent by volunteers on their chosen activities.
SecondEuropeanQualityofLifeSurvey–Participationinvolunteeringandunpaidwork
4
The latter data are a small subset of the former data, since most EU residents report not participating in voluntary activities at all. It is important to bear in mind that analysis based on ‘frequency of participation’ data produces different results compared with analysis based on ‘average hours per week’ data, since we are looking at two different groups of people, that is:
■ European citizens in general;
■ European citizens involved in volunteering.
The second EQLS also examines whether people think that the time they spend taking part in voluntary work or political activities is ‘too much’, ‘just right’ or ‘too little’. These particular survey data allow an examination of the characteristics of those people who feel that they devote toolittletime to these activities, which may help to sharpen policy pointers for decision-makers.
Chapter 3 turns to unpaid work. Unpaid work comprises non-remunerated family- and household-related activities. Generally linked to work–life distributional arrangements within households it is regarded as a building block of societal functioning. The frequency and amount of time devoted to unpaid work activities goes to the heart of work–family balance. In the second EQLS, unpaid work activities are captured in three ways:
■ ‘caring for and educating children’;
■ ‘cooking and housework’;
■ ‘caring for elderly/disabled relatives’.
Survey data are available on the frequency with which Europeans are involved in each of the three forms of unpaid work activity and on the average number of hours per week that people devote to each of the three. Like volunteering, the results based on the ‘average hours per week’ data differ from those based on the ‘frequency of participation’ data in each type of unpaid work activity, highlighting the importance of measurement in the survey data.
Chapter 4 looks at religious participation and participation in civil society. Previous research generally reports a positive relationship between volunteering and the frequency with which individuals participate in religious services. This relationship is further explored in this study and the possibility that people attending religious services regularly have higher or lower life satisfaction or subjective well-being scores (as reported in the second EQLS) is also investigated.
The concept of civil society is to a certain extent related to voluntary activities. As explained in an earlier Eurofound report (Rose, 2006), civil society is an ‘elastic’ term potentially covering a variety of organisations or institutions and, whether participation occurs formally or informally, it is generally aimed at furthering the ‘public interest’. In the second EQLS, participation in civil society is captured in two ways. The first refers to whether people, during the past year, attended a political activity such as a political party meeting or a demonstration, or contacted a politician or public official (other than routine contact arising from the use of public services). The second way refers to whether people voted in the last national election in their country of residence. Both are considered in this study.
Chapter 5 brings together the overall conclusions from the study and the policy implications from its findings.
The new evidence from the second EQLS presented in this report is based on two types of analysis. First, the frequency of involvement and the average hours spent per week for groups with different
5
Introduction
socio-economic characteristics has been captured. This allows differences between men and women, different age groups, employed and unemployed people, those living in rural areas and those living in cities, etc. to be described (a descriptive statistical analysis). However, it is also important to find out which of the observed differences really matter. An attempt has therefore been made to identify those factors that help to explain and predict the likelihood of people with certain characteristics to engage in volunteering and unpaid work (an econometric analysis). The results point to gender, educational attainment, age and country as the key factors accounting for the extent of volunteering. For unpaid work, gender surfaces as the key explanatory variable: being a woman increases the likelihood of doing unpaid work significantly.

7
1Factorsinfluencingvolunteering
Although previous studies have used various different data sources, the research findings are nonetheless reasonably consistent in highlighting a number of key influences on people’s decision to take part in volunteering. These are:
■ gender (males tend to be more likely to participate than females);
■ age (participation tends to peak during middle age);
■ educational attainment (participation is observed to be higher among people with higher educational attainment);
■ life satisfaction (people reporting greater life satisfaction tend to be more likely to volunteer, though it is also recognised that volunteering can have a positive effect on subjective well-being);
■ religious participation (people who regularly attend religious services are found to be more likely to volunteer);
■ country (certain Member States have higher rates of participation in volunteering than others).
These factors are considered in this study. The second EQLS also enables consideration of various additional factors with the potential to affect participation in voluntary and charitable activities – including social inclusion, population density, social interaction and economic hardship.
IncidenceandfrequencyofvolunteeringinEurope
According to GHK (2010), somewhere between 92 million and 94 million people aged over 15 are involved in voluntary activities in the EU, implying that about 22%–23% of Europeans are involved as volunteers. These volunteers are active in a wide variety of fields including education, training, sport (the single most common form of voluntary activity), heritage and protecting the environment.
GHK (2010) and other bodies, including the European Volunteer Centre, report an upward trend in the number of volunteers in the EU. Underlying reasons for this trend include:
■ increased awareness of social and environmental issues;
■ recent public initiatives to promote volunteering;
■ increasing numbers of voluntary organisations;
■ growing numbers of volunteers needed to support the delivery of public services;
■ increasing numbers of individuals involved in project-based or short-term volunteering;
■ increased involvement of older people, whose life expectancy has increased with higher living standards;
■ changes in attitudes toward volunteering, including in the New Member States (NMS12).
The GHK study delineates the extent of volunteering among Member States using a five-point scale as follows:1
1 The results for Hungary ‘show a high degree of variance (from 5.5% to 40%)’ (GHK, 2010, p. 7) and are not included in the delineation in this regard.
Review of previous research on volunteering
SecondEuropeanQualityofLifeSurvey–Participationinvolunteeringandunpaidwork
8
■ very high in Austria, the Netherlands, Sweden and the UK with over 40% of adults involved in voluntary activities;
■ high in Denmark, Finland, Germany and Luxembourg where 30%–39% of adults volunteer;
■ medium high in Estonia, France and Latvia in which 20%–29% of adults are engaged in voluntary activities;
■ relatively low in Belgium, Cyprus, the Czech Republic, Ireland, Malta, Poland, Portugal, Slovakia, Romania, Slovenia and Spain where 10%–19% of adults carry out voluntary activities;
■ low in Bulgaria, Greece, Italy and Lithuania in which less than 10% of adults are involved in voluntary activities.
Determinantsofvolunteering
One perspective sees a person’s decision to participate in voluntary activities as the result of a wish to add to their capital, which may in turn result in higher returns to the individual over their lifetime. In this way, volunteering acts like an additional educational qualification or form of work experience, boosting a person’s curriculum vitae and adding to their monetary rewards over time. Another view sees volunteering as a function of people’s basic desire to help others, which may indirectly result in people extending their social networks and/or acquiring new skills and talents. Compared with the first approach, the second approach considers the decision to volunteer as less strategic from a career point of view.
Evidence in support of the human-capital approach is reported by Handy and Srinivasan (2005), Hackl et al (2007), Antoni (2009), and Destefanis and Maietta (2009). For instance, Hackl et al (2007) find ‘strong statistical evidence’ that the number of volunteering hours plays a major role in explaining the wage differential between people who volunteer and those who do not (though this may reflect the fact that volunteers tend to have higher educational attainment). However, the studies by Prouteau and Wolff (2005, 2008) suggest that participation in voluntary activities is driven largely by the desire to build friendships.
The GHK study (2010) found that, in many Member States, gender is a more significant factor in specific sectors (such as sport, health, social and rescue services) and in voluntary roles (such as managerial and operational roles) than in overall participation rates in volunteering. However, in general, most countries tend to have either a greater number of male volunteers than female (in 11 Member States) or an equal participation between men and women (in nine Member States). In many European countries, GHK (2010) concluded that the dominance of male volunteers can be explained by the fact that the sports sector attracts the highest number of volunteers and that more men than women tend to volunteer in sport.
In respect of the age dimension to volunteering, GHK (2010) found that the highest levels of volunteering tend to be among adults aged between 30 and 50 years. The same study also found that, in a substantial number of countries, the number of older people volunteering is increasing.
GHK (2010) reports a positive correlation between educational attainment and the tendency to volunteer in the EU and, in the majority of EU countries, employed individuals are found to be the most active volunteers.
9
Reviewofpreviousresearchonvolunteering
Volunteeringandsubjectivewell-being
It is generally agreed that volunteering can play an important role in contributing to people’s subjective well-being or perceived life satisfaction – for example, by helping to build social connections and giving a sense of purpose and belonging within their communities (Dolan et al, 2008).
Research on the influence of volunteering on well-being has also considered older people (Luoh and Herzog, 2002; Morrow-Howell et al, 2003). According to Plagnol and Huppert (2010), the research has often been guided by the observation that older people appear to benefit more from volunteering than younger people. These authors offer a possible explanation in the form of volunteering giving older people a new sense of purpose, which may be more significant for this group given other empirical evidence suggesting that older people tend to be more prone to feeling lonely (for example, Pinquart and Sørensen, 2001).
Using two waves of panel data from the Americans’ Changing Lives survey,2 Thoits and Hewitt (2001) examined the relationships between volunteer work in the community and six aspects of subjective well-being:
■ happiness;
■ life satisfaction;
■ self-esteem;
■ sense of control over life;
■ physical health;
■ depression.
The results indicate that volunteering enhances all six aspects of subjective well-being and that people reporting greater well-being tend to invest more hours in volunteering, suggesting a two-way relationship between volunteering and subjective well-being. Mellor et al (2009) found that:
■ volunteers have greater personal and neighbourhood well-being than non-volunteers;
■ volunteering contributes additional explanation to well-being even after psychosocial and personality factors are accounted for.
The report by the (US) Corporation for National and Community Service (2009) considers the main findings from over 30 published studies examining the relationship between health and volunteering, with particular emphasis on studies seeking to determine the causal connection between the two. The studies, in which other factors are controlled for, found that volunteering leads to improved physical and mental health. The report considers an ‘optimal’ level of voluntary activity to comprise about 100 hours per year or approximately two hours per week. According to the report, individuals who reach this level tend to enjoy significant health benefits, although additional benefits beyond the 100-hour per year mark tend to be negligible or not to occur. A similar review study by Howlett (2004) for the Institute of Volunteering Research suggests that there are mental health benefits to be gained from volunteering.
2 For information about this survey and its four waves, see http://www.icpsr.umich.edu/icpsrweb/NACDA/studies/04690
SecondEuropeanQualityofLifeSurvey–Participationinvolunteeringandunpaidwork
10
Religiousandcivicparticipationandvolunteering
Wuthnow (1991) and Wilson (2000) found that church attendance is associated with increased levels of volunteering. Mattis et al (2004) reported that – in the US, among African-American men – church involvement is a positive predictor of the likelihood of volunteering. This study also found that church involvement is positively related to the number of hours that these men dedicated to volunteer work. Dekker and Halman (2003) found that volunteers in the Netherlands are almost three times as likely as non-volunteers to be active in religious institutions, while Brooks (2003) estimated that people who participate in religious activity are more than 50% more likely to volunteer than those who do not.
The extent to which religious participation facilitates participation in civil society (as well as volunteering) has also been investigated. Studies by Peterson (1992), Wilcox and Sigelman (2001) and Beyerlein and Chaves (2003) found that religious participation is positively correlated with voting and political activity, which may reflect the view that congregations provide a natural environment for the development of civil skills (Verba et al, 1995). However, studies by Park and Smith (2000), Lam (2002) and Driskell et al. (2008a) suggest a negative correlation between religious participation and engagement in civil society, which may reflect differences among particular religious denominations.
Turning to civil society and political involvement, a previous study by Eurofound (Rose, 2006) –based on the first EQLS conducted by Eurofound in 2003 – found that while 79% of respondents reported that they voted only 13% reported that they attended political meetings and an even smaller proportion (9%) reported contacting officials on a matter of policy. In respect of volunteering, the study concluded that more transparent government encourages participation and suggested that a policy direction to encourage greater participation in civil society and volunteering would be to increase transparency and reduce corruption in government:
...increasedtransparencyingovernmentwouldnotonlyenhancegovernmentefficiencyandbefavourablefortheeconomy,butcouldalsoencouragemorepeopletobecomeactiveincivilsocietyorganisations’(Rose,2006,p.62).
Unpaidwork
Theimportanceofgender
According to information from the Family Database of the Organisation of Economic Cooperation and Development (OECD),3 women spend approximately twice as much time on unpaid work activities as men (OECD, 2009). The largest recorded differences are apparent in Japan and Turkey, where women spent on average four and six times more time on caring than men, respectively. The OECD study emphasises that the amount of time allocated to care activities is largely determined by the presence of children in households.
This finding is echoed in a recent study by Eurofound (Kotowska, 2010) which found that the presence of children (under 13 years of age) strongly affects both weekly time spent on caring and time spent on domestic work. However, the impact varies according to gender. Women with children spend almost 20 hours more on unpaid care than women living in households without young children. Fathers, however, spend 11.5 more hours in unpaid work compared with fathers living in households without young children. The Eurofound study also found that:
3 Available online: search for ‘OECD family database’.
Reviewofpreviousresearchonvolunteering
11
■ the highest amount of domestic work and caring is carried out by women aged 25–34 years and 35–49 years respectively;
■ employment status has no impact on men’s involvement in caring for and educating children as they devote on average the same amount of time to this activity, regardless of whether they are employed, economically inactive or unemployed.
Otherdeterminantsofunpaidwork
Heitmueller and Inglis (2004) suggested that the decision to engage in caring may not necessarily be by choice, but may also reflect systematic disadvantage among carers compared with non-carers (working and caring) in respect of labour market characteristics, including educational attainment and previous work experience.

13
2Volunteering
Frequencyofparticipation
Statisticalanalysis–MemberState
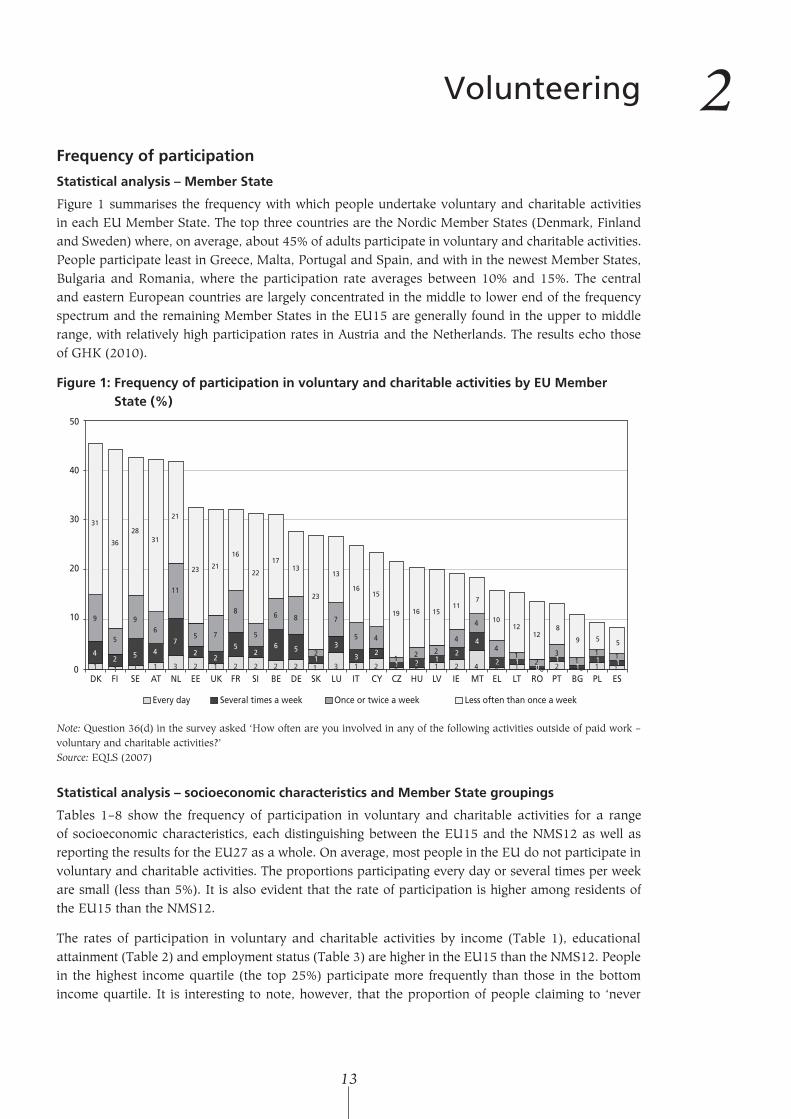
Figure 1 summarises the frequency with which people undertake voluntary and charitable activities in each EU Member State. The top three countries are the Nordic Member States (Denmark, Finland and Sweden) where, on average, about 45% of adults participate in voluntary and charitable activities. People participate least in Greece, Malta, Portugal and Spain, and with in the newest Member States, Bulgaria and Romania, where the participation rate averages between 10% and 15%. The central and eastern European countries are largely concentrated in the middle to lower end of the frequency spectrum and the remaining Member States in the EU15 are generally found in the upper to middle range, with relatively high participation rates in Austria and the Netherlands. The results echo those of GHK (2010).
Figure1:FrequencyofparticipationinvoluntaryandcharitableactivitiesbyEUMemberState(%)
0
10
20
30
40
50
DK FI SE AT NL EE UK FR SI BE DE SK LU IT CY CZ HU LV IE MT EL LT RO PT BG PL ES
Every day Several times a week Once or twice a week Less often than once a week
42 5 4
7
22
52
6 51
3
3 2
1 2 12
4
2 10
11
1 1
9
5
96
11
5 7
8
5
6 8
2
7
5 4
1 2 2
4
4
41
23
11 1
1 1 1 3 2 1 2 2 2 2 1 3 1 2 0 0 1 2 4 0 1 20 0 1 11
31
36
2831
21
23 21
16
22
1713
23
13
1615
19 16 1511
7
1012
128
9 5 5
Note: Question 36(d) in the survey asked ‘How often are you involved in any of the following activities outside of paid work – voluntary and charitable activities?’Source: EQLS (2007)
Statisticalanalysis–socioeconomiccharacteristicsandMemberStategroupings
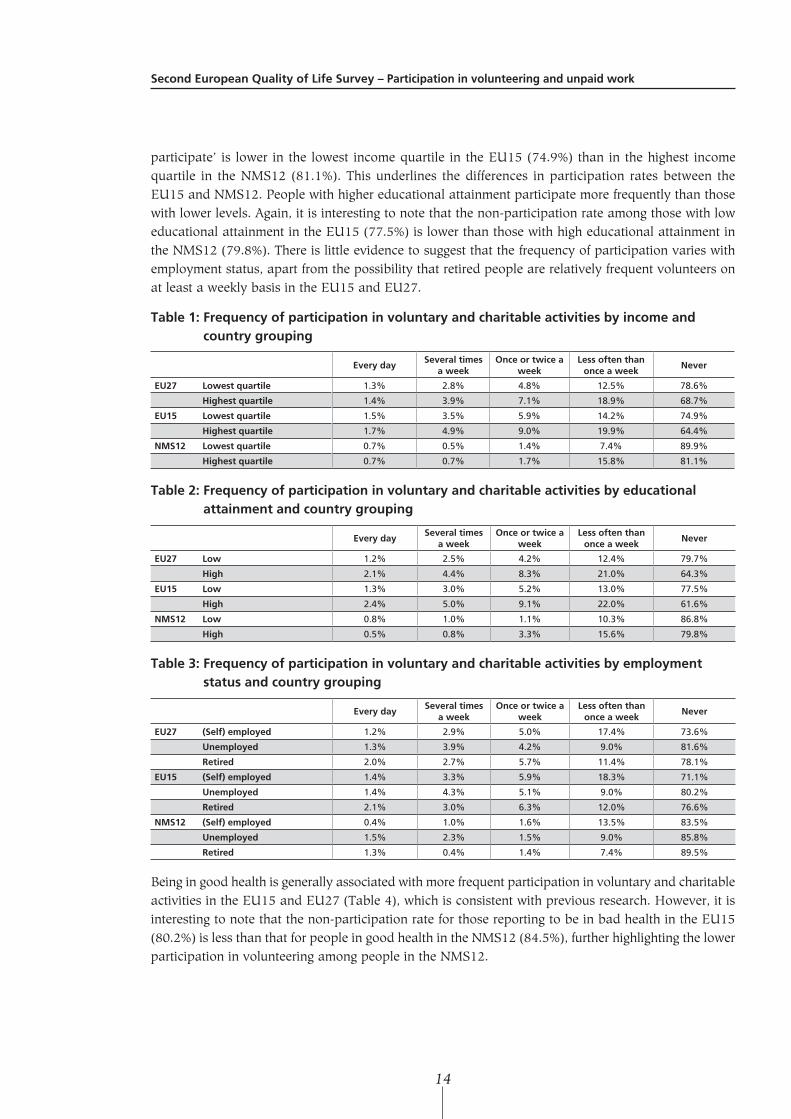
Tables 1–8 show the frequency of participation in voluntary and charitable activities for a range of socioeconomic characteristics, each distinguishing between the EU15 and the NMS12 as well as reporting the results for the EU27 as a whole. On average, most people in the EU do not participate in voluntary and charitable activities. The proportions participating every day or several times per week are small (less than 5%). It is also evident that the rate of participation is higher among residents of the EU15 than the NMS12.
The rates of participation in voluntary and charitable activities by income (Table 1), educational attainment (Table 2) and employment status (Table 3) are higher in the EU15 than the NMS12. People in the highest income quartile (the top 25%) participate more frequently than those in the bottom income quartile. It is interesting to note, however, that the proportion of people claiming to ‘never
SecondEuropeanQualityofLifeSurvey–Participationinvolunteeringandunpaidwork
14
participate’ is lower in the lowest income quartile in the EU15 (74.9%) than in the highest income quartile in the NMS12 (81.1%). This underlines the differences in participation rates between the EU15 and NMS12. People with higher educational attainment participate more frequently than those with lower levels. Again, it is interesting to note that the non-participation rate among those with low educational attainment in the EU15 (77.5%) is lower than those with high educational attainment in the NMS12 (79.8%). There is little evidence to suggest that the frequency of participation varies with employment status, apart from the possibility that retired people are relatively frequent volunteers on at least a weekly basis in the EU15 and EU27.
Table1:Frequencyofparticipationinvoluntaryandcharitableactivitiesbyincomeandcountrygrouping
EverydaySeveraltimes
aweekOnceortwicea
weekLessoftenthanonceaweek
Never
EU27 Lowestquartile 1.3% 2.8% 4.8% 12.5% 78.6%
Highestquartile 1.4% 3.9% 7.1% 18.9% 68.7%
EU15 Lowestquartile 1.5% 3.5% 5.9% 14.2% 74.9%
Highestquartile 1.7% 4.9% 9.0% 19.9% 64.4%
NMS12 Lowestquartile 0.7% 0.5% 1.4% 7.4% 89.9%
Highestquartile 0.7% 0.7% 1.7% 15.8% 81.1%
Table2:Frequencyofparticipationinvoluntaryandcharitableactivitiesbyeducationalattainmentandcountrygrouping
EverydaySeveraltimes
aweekOnceortwicea
weekLessoftenthanonceaweek
Never
EU27 Low 1.2% 2.5% 4.2% 12.4% 79.7%
High 2.1% 4.4% 8.3% 21.0% 64.3%
EU15 Low 1.3% 3.0% 5.2% 13.0% 77.5%
High 2.4% 5.0% 9.1% 22.0% 61.6%
NMS12 Low 0.8% 1.0% 1.1% 10.3% 86.8%
High 0.5% 0.8% 3.3% 15.6% 79.8%
Table3:Frequencyofparticipationinvoluntaryandcharitableactivitiesbyemploymentstatusandcountrygrouping
EverydaySeveraltimes
aweekOnceortwicea
weekLessoftenthanonceaweek
Never
EU27 (Self)employed 1.2% 2.9% 5.0% 17.4% 73.6%
Unemployed 1.3% 3.9% 4.2% 9.0% 81.6%
Retired 2.0% 2.7% 5.7% 11.4% 78.1%
EU15 (Self)employed 1.4% 3.3% 5.9% 18.3% 71.1%
Unemployed 1.4% 4.3% 5.1% 9.0% 80.2%
Retired 2.1% 3.0% 6.3% 12.0% 76.6%
NMS12 (Self)employed 0.4% 1.0% 1.6% 13.5% 83.5%
Unemployed 1.5% 2.3% 1.5% 9.0% 85.8%
Retired 1.3% 0.4% 1.4% 7.4% 89.5%
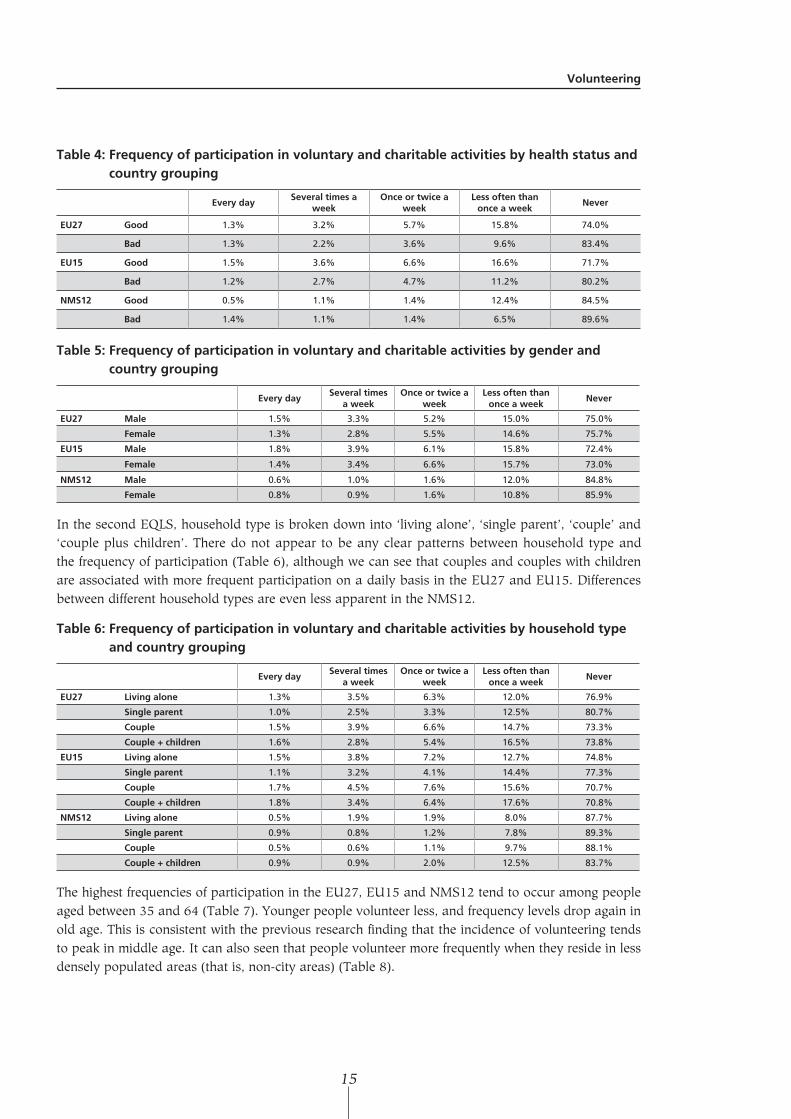
Being in good health is generally associated with more frequent participation in voluntary and charitable activities in the EU15 and EU27 (Table 4), which is consistent with previous research. However, it is interesting to note that the non-participation rate for those reporting to be in bad health in the EU15 (80.2%) is less than that for people in good health in the NMS12 (84.5%), further highlighting the lower participation in volunteering among people in the NMS12.
Volunteering
15
Table4:Frequencyofparticipationinvoluntaryandcharitableactivitiesbyhealthstatusandcountrygrouping
EverydaySeveraltimesa
weekOnceortwicea
weekLessoftenthanonceaweek
Never
EU27 Good 1.3% 3.2% 5.7% 15.8% 74.0%
Bad 1.3% 2.2% 3.6% 9.6% 83.4%
EU15 Good 1.5% 3.6% 6.6% 16.6% 71.7%
Bad 1.2% 2.7% 4.7% 11.2% 80.2%
NMS12 Good 0.5% 1.1% 1.4% 12.4% 84.5%
Bad 1.4% 1.1% 1.4% 6.5% 89.6%
Table5:Frequencyofparticipationinvoluntaryandcharitableactivitiesbygenderandcountrygrouping
EverydaySeveraltimes
aweekOnceortwicea
weekLessoftenthanonceaweek
Never
EU27 Male 1.5% 3.3% 5.2% 15.0% 75.0%
Female 1.3% 2.8% 5.5% 14.6% 75.7%
EU15 Male 1.8% 3.9% 6.1% 15.8% 72.4%
Female 1.4% 3.4% 6.6% 15.7% 73.0%
NMS12 Male 0.6% 1.0% 1.6% 12.0% 84.8%
Female 0.8% 0.9% 1.6% 10.8% 85.9%
In the second EQLS, household type is broken down into ‘living alone’, ‘single parent’, ‘couple’ and ‘couple plus children’. There do not appear to be any clear patterns between household type and the frequency of participation (Table 6), although we can see that couples and couples with children are associated with more frequent participation on a daily basis in the EU27 and EU15. Differences between different household types are even less apparent in the NMS12.
Table6:Frequencyofparticipationinvoluntaryandcharitableactivitiesbyhouseholdtypeandcountrygrouping
EverydaySeveraltimes
aweekOnceortwicea
weekLessoftenthanonceaweek
Never
EU27 Livingalone 1.3% 3.5% 6.3% 12.0% 76.9%
Singleparent 1.0% 2.5% 3.3% 12.5% 80.7%
Couple 1.5% 3.9% 6.6% 14.7% 73.3%
Couple+children 1.6% 2.8% 5.4% 16.5% 73.8%
EU15 Livingalone 1.5% 3.8% 7.2% 12.7% 74.8%
Singleparent 1.1% 3.2% 4.1% 14.4% 77.3%
Couple 1.7% 4.5% 7.6% 15.6% 70.7%
Couple+children 1.8% 3.4% 6.4% 17.6% 70.8%
NMS12 Livingalone 0.5% 1.9% 1.9% 8.0% 87.7%
Singleparent 0.9% 0.8% 1.2% 7.8% 89.3%
Couple 0.5% 0.6% 1.1% 9.7% 88.1%
Couple+children 0.9% 0.9% 2.0% 12.5% 83.7%
The highest frequencies of participation in the EU27, EU15 and NMS12 tend to occur among people aged between 35 and 64 (Table 7). Younger people volunteer less, and frequency levels drop again in old age. This is consistent with the previous research finding that the incidence of volunteering tends to peak in middle age. It can also seen that people volunteer more frequently when they reside in less densely populated areas (that is, non-city areas) (Table 8).
SecondEuropeanQualityofLifeSurvey–Participationinvolunteeringandunpaidwork
16
Table7:Frequencyofparticipationinvoluntaryandcharitableactivitiesbyageandcountrygrouping
EverydaySeveraltimesa
weekOnceortwicea
weekLessoftenthanonceaweek
Never
EU27 18–34years 0.8% 2.4% 3.9% 14.5% 78.4%
35–64years 1.7% 3.4% 5.9% 16.5% 72.5%
65+years 1.5% 3.3% 6.0% 11.1% 78.0%
EU15 18–34years 0.9% 2.8% 4.7% 15.2% 76.4%
35–64years 1.9% 4.0% 7.0% 17.6% 69.5%
65+years 1.7% 3.9% 7.1% 12.0% 75.4%
NMS12 18–34years 0.5% 1.2% 1.4% 12.3% 84.6%
35–64years 0.9% 0.9% 1.7% 12.3% 84.2%
65+years 0.5% 0.9% 1.5% 7.2% 89.8%
Table8:Frequencyofparticipationinvoluntaryandcharitableactivitiesbypopulationdensityandcountrygrouping
EverydaySeveraltimes
aweekOnceortwicea
weekLessoftenthanonceaweek
Never
EU27 Opencountryside 1.5% 3.5% 5.6% 17.7% 71.8%
Village/smalltown 1.6% 3.5% 6.2% 14.3% 74.5%
Medium/largetown 1.5% 2.7% 4.5% 13.6% 77.7%
City/citysuburb 0.9% 2.4% 4.8% 15.3% 76.6%
EU15 Opencountryside 1.8% 4.3% 6.9% 19.0% 68.0%
Village/smalltown 1.8% 4.0% 7.2% 14.9% 72.1%
Medium/largetown 1.6% 3.4% 5.2% 14.4% 75.4%
City/citysuburb 1.1% 2.8% 5.7% 16.5% 73.9%
NMS12 Opencountryside 0.3% 0.4% 0.7% 13.0% 85.5%
Village/smalltown 0.9% 1.4% 1.7% 11.5% 84.6%
Medium/largetown 1.1% 0.5% 2.0% 10.4% 86.1%
City/citysuburb 0.4% 1.2% 1.5% 11.4% 85.6%
Resultsofeconometricanalysis
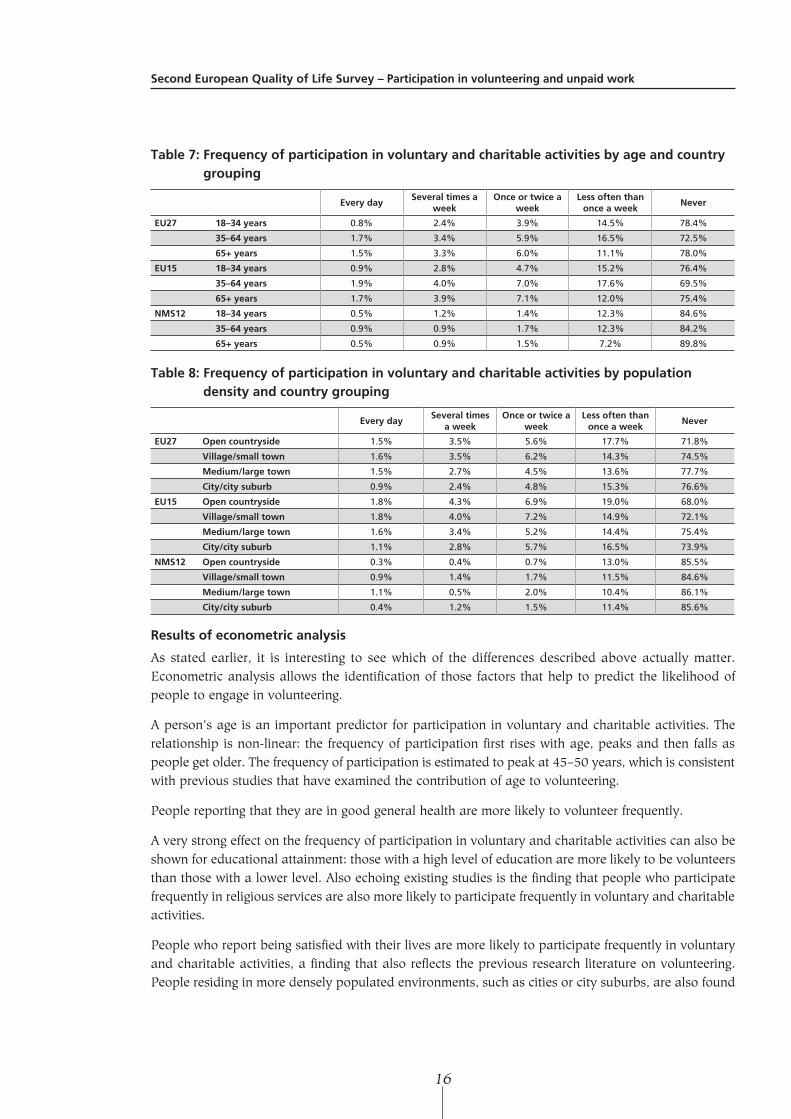
As stated earlier, it is interesting to see which of the differences described above actually matter. Econometric analysis allows the identification of those factors that help to predict the likelihood of people to engage in volunteering.
A person’s age is an important predictor for participation in voluntary and charitable activities. The relationship is non-linear: the frequency of participation first rises with age, peaks and then falls as people get older. The frequency of participation is estimated to peak at 45–50 years, which is consistent with previous studies that have examined the contribution of age to volunteering.
People reporting that they are in good general health are more likely to volunteer frequently.
A very strong effect on the frequency of participation in voluntary and charitable activities can also be shown for educational attainment: those with a high level of education are more likely to be volunteers than those with a lower level. Also echoing existing studies is the finding that people who participate frequently in religious services are also more likely to participate frequently in voluntary and charitable activities.
People who report being satisfied with their lives are more likely to participate frequently in voluntary and charitable activities, a finding that also reflects the previous research literature on volunteering. People residing in more densely populated environments, such as cities or city suburbs, are also found
Volunteering
17
to be less likely to be frequently involved in voluntary and charitable activities, possibly reflecting a larger range of other activities to occupy these people.
People living in Austria, Belgium, Denmark, Finland, France, Germany Luxembourg, the Netherlands or Sweden are more likely to participate frequently in voluntary and charitable activities. People in Bulgaria, Cyprus, Greece, Italy, Malta, Portugal, Romania or Spain are likely to volunteer less frequently. Being a resident of the Czech Republic, Estonia, Hungary, Latvia, Lithuania, Poland, Slovakia or Slovenia does not seem to have an effect on frequency of participation.
Employment status is not a good predictor for frequent participation in volunteering and charitable activities. The analysis does not support a claim that any of the four groups examined (employed, self-employed, unemployed and retired) are more likely to participate frequently. There is some evidence that people in economic hardship are less likely to participate frequently in voluntary and charitable activities.
In summary, a person’s age, general health and educational attainment are important factors accounting for participation in voluntary and charitable activities. Population density (that is, whether someone lives in a city or a rural area), is also an important predictor. So is participation in religious services on a regular basis and, interestingly, subjective well-being or life satisfaction.
In addition, we can observe country effects: for some, but not all, EU Member States living in that country either increases or decreases the likelihood to participate in voluntary and charitable activities.
Timespentonvolunteering
Statisticalanalysis–socioeconomiccharacteristicsandMemberStategroupings
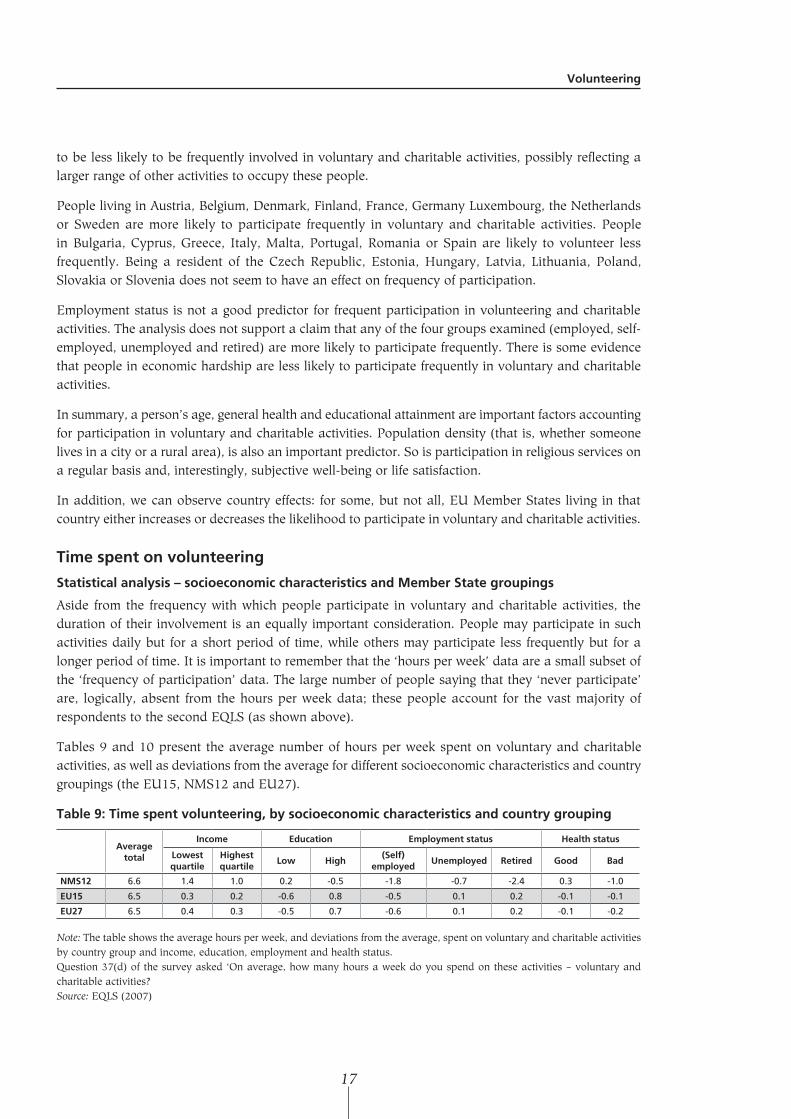
Aside from the frequency with which people participate in voluntary and charitable activities, the duration of their involvement is an equally important consideration. People may participate in such activities daily but for a short period of time, while others may participate less frequently but for a longer period of time. It is important to remember that the ‘hours per week’ data are a small subset of the ‘frequency of participation’ data. The large number of people saying that they ‘never participate’ are, logically, absent from the hours per week data; these people account for the vast majority of respondents to the second EQLS (as shown above).
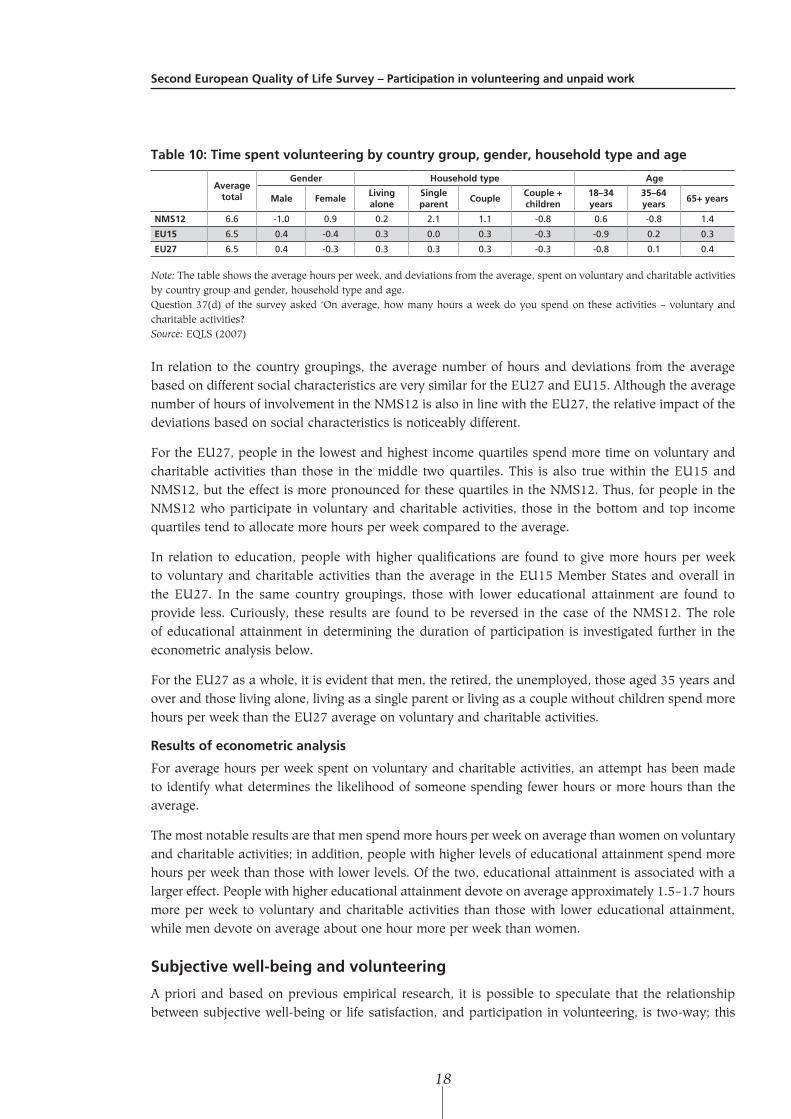
Tables 9 and 10 present the average number of hours per week spent on voluntary and charitable activities, as well as deviations from the average for different socioeconomic characteristics and country groupings (the EU15, NMS12 and EU27).
Table9:Timespentvolunteering,bysocioeconomiccharacteristicsandcountrygrouping
Averagetotal
Income Education Employmentstatus Healthstatus
Lowestquartile
Highestquartile
Low High(Self)
employedUnemployed Retired Good Bad
NMS12 6.6 1.4 1.0 0.2 -0.5 -1.8 -0.7 -2.4 0.3 -1.0
EU15 6.5 0.3 0.2 -0.6 0.8 -0.5 0.1 0.2 -0.1 -0.1
EU27 6.5 0.4 0.3 -0.5 0.7 -0.6 0.1 0.2 -0.1 -0.2
Note: The table shows the average hours per week, and deviations from the average, spent on voluntary and charitable activities by country group and income, education, employment and health status.Question 37(d) of the survey asked ‘On average, how many hours a week do you spend on these activities – voluntary and charitable activities?Source: EQLS (2007)
SecondEuropeanQualityofLifeSurvey–Participationinvolunteeringandunpaidwork
18
Table10:Timespentvolunteeringbycountrygroup,gender,householdtypeandage
Averagetotal
Gender Householdtype Age
Male FemaleLivingalone
Singleparent
CoupleCouple+children
18–34years
35–64years
65+years
NMS12 6.6 -1.0 0.9 0.2 2.1 1.1 -0.8 0.6 -0.8 1.4
EU15 6.5 0.4 -0.4 0.3 0.0 0.3 -0.3 -0.9 0.2 0.3
EU27 6.5 0.4 -0.3 0.3 0.3 0.3 -0.3 -0.8 0.1 0.4
Note: The table shows the average hours per week, and deviations from the average, spent on voluntary and charitable activities by country group and gender, household type and age.Question 37(d) of the survey asked ‘On average, how many hours a week do you spend on these activities – voluntary and charitable activities?Source: EQLS (2007)
In relation to the country groupings, the average number of hours and deviations from the average based on different social characteristics are very similar for the EU27 and EU15. Although the average number of hours of involvement in the NMS12 is also in line with the EU27, the relative impact of the deviations based on social characteristics is noticeably different.
For the EU27, people in the lowest and highest income quartiles spend more time on voluntary and charitable activities than those in the middle two quartiles. This is also true within the EU15 and NMS12, but the effect is more pronounced for these quartiles in the NMS12. Thus, for people in the NMS12 who participate in voluntary and charitable activities, those in the bottom and top income quartiles tend to allocate more hours per week compared to the average.
In relation to education, people with higher qualifications are found to give more hours per week to voluntary and charitable activities than the average in the EU15 Member States and overall in the EU27. In the same country groupings, those with lower educational attainment are found to provide less. Curiously, these results are found to be reversed in the case of the NMS12. The role of educational attainment in determining the duration of participation is investigated further in the econometric analysis below.
For the EU27 as a whole, it is evident that men, the retired, the unemployed, those aged 35 years and over and those living alone, living as a single parent or living as a couple without children spend more hours per week than the EU27 average on voluntary and charitable activities.
Resultsofeconometricanalysis
For average hours per week spent on voluntary and charitable activities, an attempt has been made to identify what determines the likelihood of someone spending fewer hours or more hours than the average.
The most notable results are that men spend more hours per week on average than women on voluntary and charitable activities; in addition, people with higher levels of educational attainment spend more hours per week than those with lower levels. Of the two, educational attainment is associated with a larger effect. People with higher educational attainment devote on average approximately 1.5–1.7 hours more per week to voluntary and charitable activities than those with lower educational attainment, while men devote on average about one hour more per week than women.
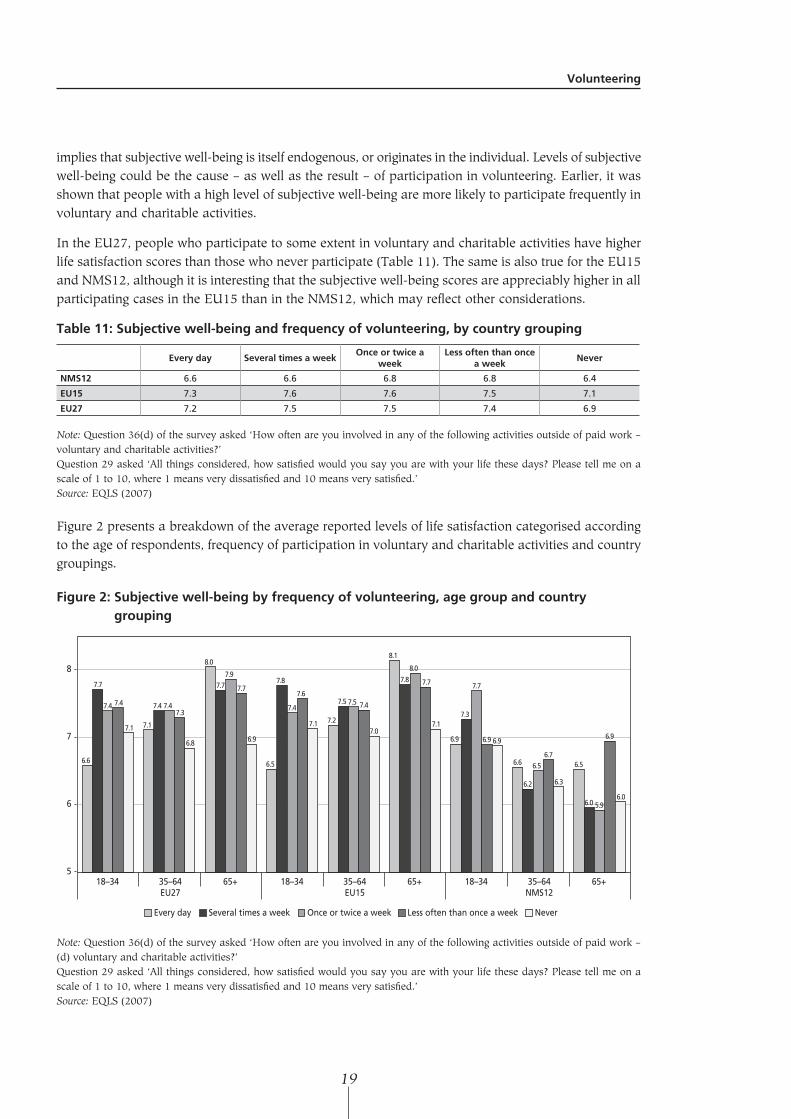
Subjectivewell-beingandvolunteering
A priori and based on previous empirical research, it is possible to speculate that the relationship between subjective well-being or life satisfaction, and participation in volunteering, is two-way; this
Volunteering
19
implies that subjective well-being is itself endogenous, or originates in the individual. Levels of subjective well-being could be the cause – as well as the result – of participation in volunteering. Earlier, it was shown that people with a high level of subjective well-being are more likely to participate frequently in voluntary and charitable activities.
In the EU27, people who participate to some extent in voluntary and charitable activities have higher life satisfaction scores than those who never participate (Table 11). The same is also true for the EU15 and NMS12, although it is interesting that the subjective well-being scores are appreciably higher in all participating cases in the EU15 than in the NMS12, which may reflect other considerations.
Table11:Subjectivewell-beingandfrequencyofvolunteering,bycountrygrouping
Everyday SeveraltimesaweekOnceortwicea
weekLessoftenthanonce
aweekNever
NMS12 6.6 6.6 6.8 6.8 6.4
EU15 7.3 7.6 7.6 7.5 7.1
EU27 7.2 7.5 7.5 7.4 6.9
Note: Question 36(d) of the survey asked ‘How often are you involved in any of the following activities outside of paid work – voluntary and charitable activities?’Question 29 asked ‘All things considered, how satisfied would you say you are with your life these days? Please tell me on a scale of 1 to 10, where 1 means very dissatisfied and 10 means very satisfied.’Source: EQLS (2007)
Figure 2 presents a breakdown of the average reported levels of life satisfaction categorised according to the age of respondents, frequency of participation in voluntary and charitable activities and country groupings.
Figure2:Subjectivewell-beingbyfrequencyofvolunteering,agegroupandcountrygrouping
5
6
7
8
18–34 35–64EU27
65+ 18–34 35–64EU15
65+ 18–34 35–64NMS12
65+
Every day Several times a week Once or twice a week Less often than once a week Never
6.6
7.1
8.0
6.5
7.2
8.1
6.9
6.6 6.5
7.7
7.4
7.77.8
7.5
7.8
7.3
6.2
6.0
7.4 7.4
7.9
7.47.5
8.0
7.7
6.5
5.9
7.47.3
7.77.6
7.4
7.7
6.9
6.7
6.97.1
6.8 6.9
7.17.0
7.1
6.9
6.3
6.0
Note: Question 36(d) of the survey asked ‘How often are you involved in any of the following activities outside of paid work – (d) voluntary and charitable activities?’Question 29 asked ‘All things considered, how satisfied would you say you are with your life these days? Please tell me on a scale of 1 to 10, where 1 means very dissatisfied and 10 means very satisfied.’ Source: EQLS (2007)
SecondEuropeanQualityofLifeSurvey–Participationinvolunteeringandunpaidwork
20
On average, the reported level of life satisfaction in the NMS12 is below that of the EU15 and EU27. In addition, the trend observable in the EU27 and EU15 appears to be reversed in the NMS12, with average levels of life satisfaction decreasing with age across the different frequencies of volunteering activity.
In the EU15, for people aged 65 years and over, the highest average levels of life satisfaction are reported by those who are involved in voluntary and charitable activities on a daily basis. The reported levels of life satisfaction for these people are the highest for any group in the graph.
Conclusions
The key factors for the frequency of participation in voluntary and charitable activities are:
■ educational attainment – those with a higher level are more likely to participate frequently;
■ general health – those in good health are again more likely to participate frequently;
■ age – the frequency of participation first rises with a peak between 45 and 50 years before falling.
For average hours per week spent on voluntary and charitable activities, educational attainment is a key factor: people with a higher level educational attainment (post-secondary qualifications or higher) devote on average approximately between 1.5 and 1.7 more hours per week to voluntary and charitable activities than those with a lower level of attainment.
People with higher educational attainment, the retired, the unemployed, men, those aged 35 years and above and those living alone, as a single parent or as a couple with no children tend to spend more hours per week than the EU27 average on voluntary and charitable activities if they participate. Men devote on average about one hour more per week than women. People who are satisfied with their lives are more likely to participate frequently in voluntary and charitable activities.
People experiencing economic hardship are found to be less likely to participate in voluntary and charitable activities on a frequent basis.
The average number of hours per week spent on voluntary and charitable – 6.5 per week – activities is very similar for the EU15 and NMS12. This suggests that people residing in those Member States with relatively low frequencies of participation in volunteering tend nevertheless to devote longer average spells of time when they do participate.
21
3Unpaid work
Frequencyofunpaidwork
Resultsofstatisticalanalysis
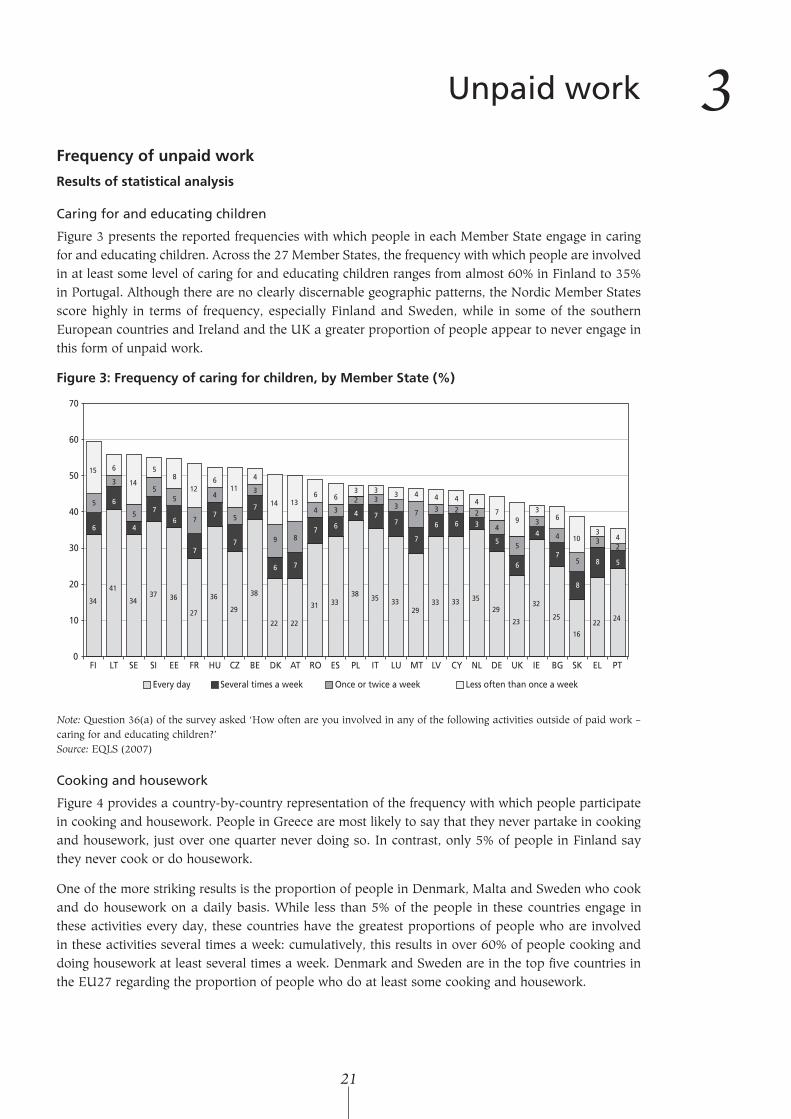
Caring for and educating children
Figure 3 presents the reported frequencies with which people in each Member State engage in caring for and educating children. Across the 27 Member States, the frequency with which people are involved in at least some level of caring for and educating children ranges from almost 60% in Finland to 35% in Portugal. Although there are no clearly discernable geographic patterns, the Nordic Member States score highly in terms of frequency, especially Finland and Sweden, while in some of the southern European countries and Ireland and the UK a greater proportion of people appear to never engage in this form of unpaid work.
Figure3:Frequencyofcaringforchildren,byMemberState(%)
0
10
20
30
40
50
60
70
FI LT SE SI EE FR HU CZ BE DK AT RO ES PL IT LU MT LV CY NL DE UK IE BG SK EL PT
Every day Several times a week Once or twice a week Less often than once a week
34
41
3437 36
27
36
29
38
22 22
31 3338 35 33
2933 33 35
29
23
32
25
16
2224
6
6
4
76
7
7
7
7
6 7
7 6
4 77
7
6 6 3
5
6
4
7
8
8 5
5
3
5
55
7
4
5
3
9 8
4 32 3
37 3 2 2
4
5
3
4
5
32
15 6
14
58
126
11
4
14 136 6
3 3 3 4 4 4 47
93
6
103
4
Note: Question 36(a) of the survey asked ‘How often are you involved in any of the following activities outside of paid work – caring for and educating children?’Source: EQLS (2007)
Cooking and housework
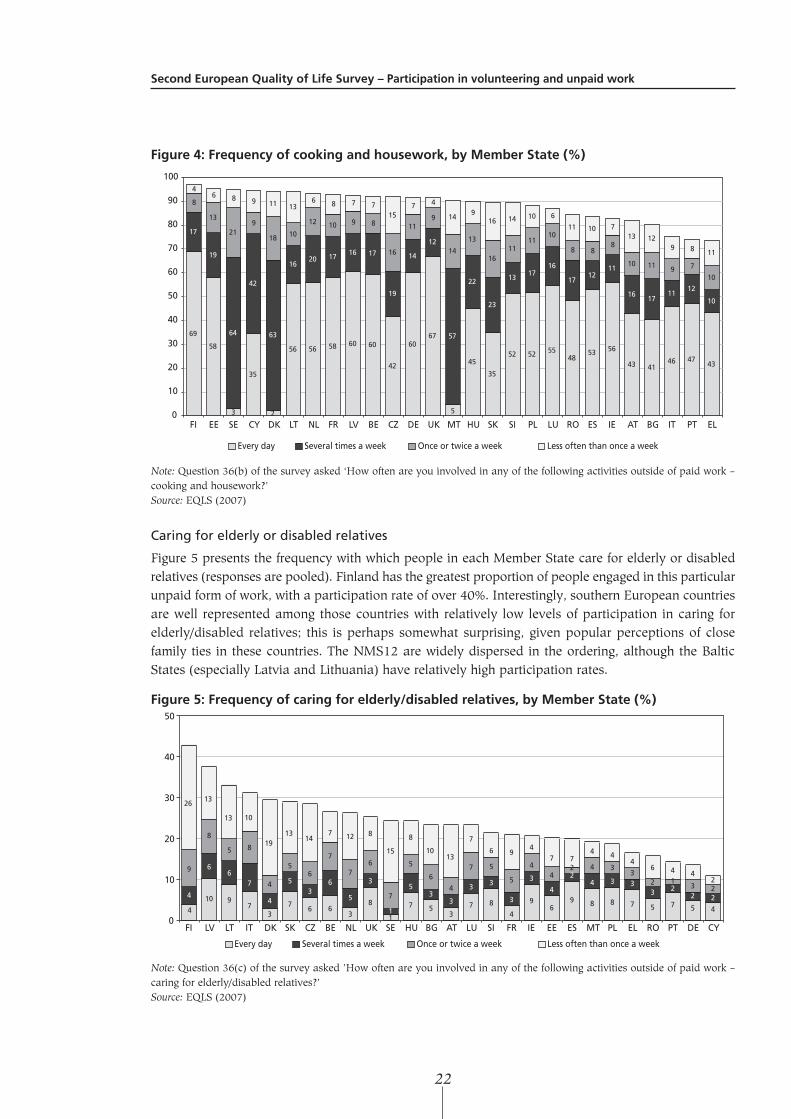
Figure 4 provides a country-by-country representation of the frequency with which people participate in cooking and housework. People in Greece are most likely to say that they never partake in cooking and housework, just over one quarter never doing so. In contrast, only 5% of people in Finland say they never cook or do housework.
One of the more striking results is the proportion of people in Denmark, Malta and Sweden who cook and do housework on a daily basis. While less than 5% of the people in these countries engage in these activities every day, these countries have the greatest proportions of people who are involved in these activities several times a week: cumulatively, this results in over 60% of people cooking and doing housework at least several times a week. Denmark and Sweden are in the top five countries in the EU27 regarding the proportion of people who do at least some cooking and housework.
SecondEuropeanQualityofLifeSurvey–Participationinvolunteeringandunpaidwork
22
Figure4:Frequencyofcookingandhousework,byMemberState(%)
19
64
42
63
1620 17 16 17
19
14
12
57
22
23
1317
16
1712
11
1617
1112
10
0
10
20
30
40
50
60
70
80
90
100
FI EE SE CY DK LT NL FR LV BE CZ DE UK MT HU SK SI PL LU RO ES IE AT BG IT PT EL
Every day Several times a week Once or twice a week Less often than once a week
17
8
13
219
18 10
12 10 9 8
16
119
46 8 9 11 13
6 8 7 715
7 4
149
16 14
1110
8 88
10 11 9 7
10
10 6
11 10 713
8 1114
13
1611
129
69
58
3
35
56 56 58 60 60
42
6067
5
45
35
52 52 5548
53 56
43 4146 47
43
2
Note: Question 36(b) of the survey asked ‘How often are you involved in any of the following activities outside of paid work – cooking and housework?’Source: EQLS (2007)
Caring for elderly or disabled relatives
Figure 5 presents the frequency with which people in each Member State care for elderly or disabled relatives (responses are pooled). Finland has the greatest proportion of people engaged in this particular unpaid form of work, with a participation rate of over 40%. Interestingly, southern European countries are well represented among those countries with relatively low levels of participation in caring for elderly/disabled relatives; this is perhaps somewhat surprising, given popular perceptions of close family ties in these countries. The NMS12 are widely dispersed in the ordering, although the Baltic States (especially Latvia and Lithuania) have relatively high participation rates.
Figure5:Frequencyofcaringforelderly/disabledrelatives,byMemberState(%)
0
10
20
30
40
50
FI LV LT IT DK SK CZ BE NL UK SE HU BG AT LU SI FR IE EE ES MT PL EL RO PT DE CY
Every day Several times a week Once or twice a week Less often than once a week
4
10 97
37
6 63
8
1
7 53
7 8
4
96
9 8 8 7 5 7 5 4
4
66
7
4
53
6
5
3
1
53
3
3 3
3
3
4
24 3 3
3 22 2
9
8
5 8
4
56
7
76
7
5
6
4
7 5
5
44
2 4 33
2 13 2
2613
13 10
1913
147 12 8
15
8
1013
7
6 94
7 74 4
46 4 4
2
Note: Question 36(c) of the survey asked ’How often are you involved in any of the following activities outside of paid work – caring for elderly/disabled relatives?’Source: EQLS (2007)
Unpaidwork
23
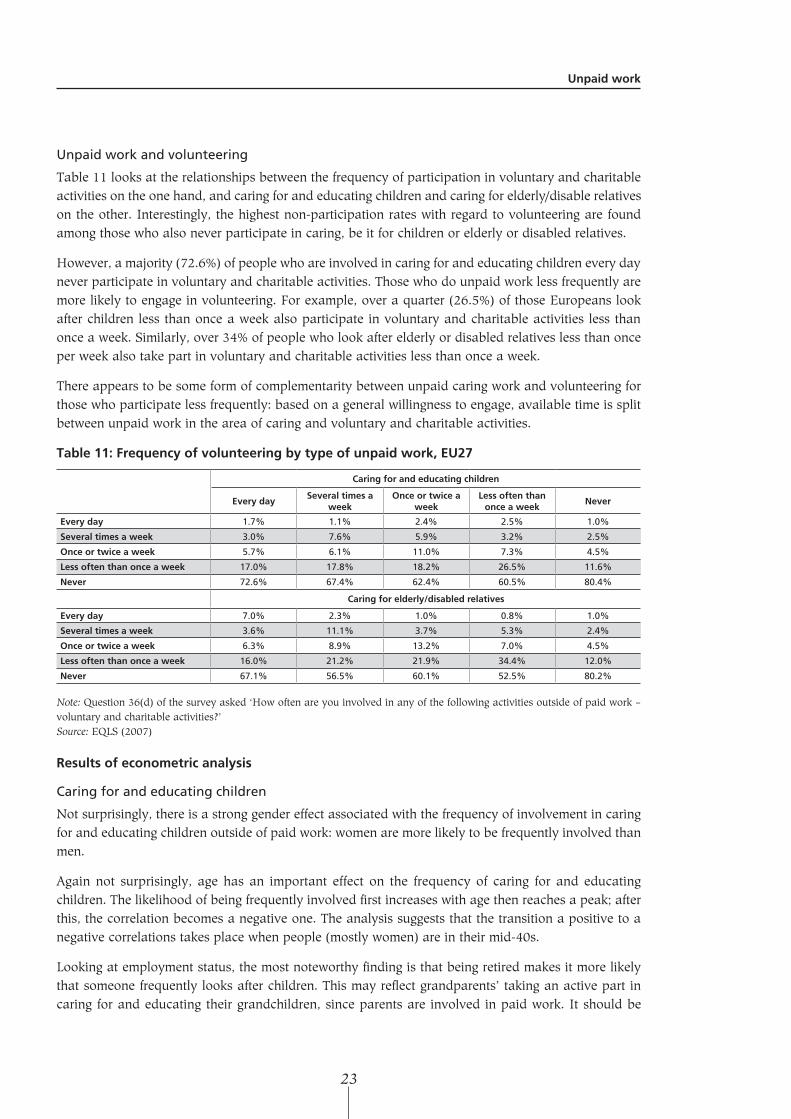
Unpaid work and volunteering
Table 11 looks at the relationships between the frequency of participation in voluntary and charitable activities on the one hand, and caring for and educating children and caring for elderly/disable relatives on the other. Interestingly, the highest non-participation rates with regard to volunteering are found among those who also never participate in caring, be it for children or elderly or disabled relatives.
However, a majority (72.6%) of people who are involved in caring for and educating children every day never participate in voluntary and charitable activities. Those who do unpaid work less frequently are more likely to engage in volunteering. For example, over a quarter (26.5%) of those Europeans look after children less than once a week also participate in voluntary and charitable activities less than once a week. Similarly, over 34% of people who look after elderly or disabled relatives less than once per week also take part in voluntary and charitable activities less than once a week.
There appears to be some form of complementarity between unpaid caring work and volunteering for those who participate less frequently: based on a general willingness to engage, available time is split between unpaid work in the area of caring and voluntary and charitable activities.
Table11:Frequencyofvolunteeringbytypeofunpaidwork,EU27
Caringforandeducatingchildren
EverydaySeveraltimesa
weekOnceortwicea
weekLessoftenthanonceaweek
Never
Everyday 1.7% 1.1% 2.4% 2.5% 1.0%
Severaltimesaweek 3.0% 7.6% 5.9% 3.2% 2.5%
Onceortwiceaweek 5.7% 6.1% 11.0% 7.3% 4.5%
Lessoftenthanonceaweek 17.0% 17.8% 18.2% 26.5% 11.6%
Never 72.6% 67.4% 62.4% 60.5% 80.4%
Caringforelderly/disabledrelatives
Everyday 7.0% 2.3% 1.0% 0.8% 1.0%
Severaltimesaweek 3.6% 11.1% 3.7% 5.3% 2.4%
Onceortwiceaweek 6.3% 8.9% 13.2% 7.0% 4.5%
Lessoftenthanonceaweek 16.0% 21.2% 21.9% 34.4% 12.0%
Never 67.1% 56.5% 60.1% 52.5% 80.2%
Note: Question 36(d) of the survey asked ‘How often are you involved in any of the following activities outside of paid work – voluntary and charitable activities?’Source: EQLS (2007)
Resultsofeconometricanalysis
Caring for and educating children
Not surprisingly, there is a strong gender effect associated with the frequency of involvement in caring for and educating children outside of paid work: women are more likely to be frequently involved than men.
Again not surprisingly, age has an important effect on the frequency of caring for and educating children. The likelihood of being frequently involved first increases with age then reaches a peak; after this, the correlation becomes a negative one. The analysis suggests that the transition a positive to a negative correlations takes place when people (mostly women) are in their mid-40s.
Looking at employment status, the most noteworthy finding is that being retired makes it more likely that someone frequently looks after children. This may reflect grandparents’ taking an active part in caring for and educating their grandchildren, since parents are involved in paid work. It should be
SecondEuropeanQualityofLifeSurvey–Participationinvolunteeringandunpaidwork
24
pointed out that only a very small proportion (less than 10%) of people in this category (those who have retired and who frequently look after children) have actually reached retirement age and are over 65 years of age. This would explain the discrepancy between high participation rates in this category and low participation rates in the age category 65 and older.
Other things being equal, people who say they are in good general health are more likely to be more frequently involved in looking after children.
Educational attainment does not seem to be a factor in determining the frequency of involvement in caring for and educating children outside of paid work. The same is true of subjective well-being: levels of life satisfaction do not seem to influence frequency of involvement.
In terms of country effects, people in Belgium, Denmark, Finland, France, Luxembourg, the Netherlands and Sweden – and in central and eastern European Member States – are more likely to be frequently involved in caring for and educating their children outside of their paid work. The opposite is the case for people living in Cyprus, Greece, Italy, Malta, Portugal and Spain, and Bulgaria or Romania.
Among the statistically significant explanatory variables, the most important in terms of their quantitative impact on the frequency of participation in caring for and educating children are the retirement variable (positive) and the male variable (negative). In other words, women are much more likely to be involved in caring for and educating children than men, which accords with intuition and is consistent with previous research studies. Relative to those who are employed or unemployed, retired people are more likely to be involved in this form of unpaid work on a frequent basis.
Cooking and housework
Not surprisingly and consistent with previous research, there is a significant gender effect associated with the frequency of involvement in cooking and housework outside of paid employment: men are less likely to be frequently involved compared with women.
There is also an age effect: the frequency of participation in cooking and housework increases with age, peaks and then falls again. According to the analysis, the turning point from a positive to a negative relationship between age and the frequency of participation occurs when people (mostly women) are in their late 40s.
People in employment are less likely to be frequently involved in cooking and housework outside of paid work. Retired people, on the other hand, are more likely to be frequently involved in this unpaid work activity, which is to be expected given that they tend to be less time-constrained and may prefer (perhaps out of economic necessity) to do more cooking and household work themselves, insofar as they are able.
People with a higher level of educational attainment are more likely to frequently do cooking and perform housework. On the other hand, religious participation does not seem to be a factor in the frequency with which people are involved in these activities. The same is also true of subjective well-being and social inclusion. However, people who have had direct (face-to-face) contact with family, friends and neighbours at least once in the last week are less likely to be frequently involved in cooking and housework outside of paid work, perhaps because of sharing such activities with family and/or friends.
Unpaidwork
25
People living in the Nordic Member States (Denmark, Finland and Sweden) are more likely to cook and do housework outside of paid their work, while the opposite is the case in Cyprus, Greece, Italy, Malta, Portugal or Spain, and in Bulgaria and Romania.
Caring for elderly or disabled relatives
Like the other categories of unpaid work examined, there is a gender effect: men are less likely to be frequently involved in caring for elderly/disabled relatives.
As previously, there is also an age effect in respect of caring for elderly/disabled relatives outside of paid work, with a positive relationship (higher likelihood to be involved) up to a maximum age before a negative relationship (lower likelihood to be involved) takes effect. The analysis suggests that the turning point occurs at the age of 51. Possibly, beyond this age, outside help (for example in the form of professional care or publicly funded home help) is used to complement or substitute for unpaid care provided by a member of the family.
Retired people are more likely to be frequently involved in caring for elderly/disabled relatives. A common situation behind this research result is probably one spouse looking after the other or a retired person looking after their parent. Again, it should be noted that only a very small proportion of people in this category have actually reached retirement age and are over 65 years of age.
People with a higher level of educational attainment are more likely to be frequently involved in caring for elderly/disabled relatives outside of paid work as are people who participate more frequently in religious services. Also people who have had direct (face-to-face) contact with family, friends and neighbours at least once in the last week are more likely to be frequently involved in caring for elderly/disabled relatives, as might be expected. On the other hand, people who feel less excluded from society are less likely to be involved in caring for elderly/disabled relatives on a frequent basis
With regard to country effects, people living in Denmark, Finland or Sweden are likely to be more frequently involved in caring for elderly/disabled relatives, while the opposite effect is observed for Austria and Germany. It is interesting to note that the latter are countries where there is a system of care insurance.
Among the statistically significant explanatory variables, those exerting the largest quantitative effects on the frequency of involvement in caring for elderly/disabled relatives are the retired variable (positive), being a male (negative) and the country effects (Nordic Member States, positive; Austria and Germany, negative; and Bulgaria and Romania, negative).
Timespentonunpaidwork
Resultsofstatisticalanalysis
Caring for and educating children
When examining the average hours per week spent on unpaid work activities, it is important to bear in mind that the survey data in this regard exclude those respondents reporting that they are never involved in unpaid work (which comprises a large section of the respondents). This explains why the factors previously found to influence the frequency of participation in unpaid work may have a different effect or none at all when examining time spent on unpaid work activities.
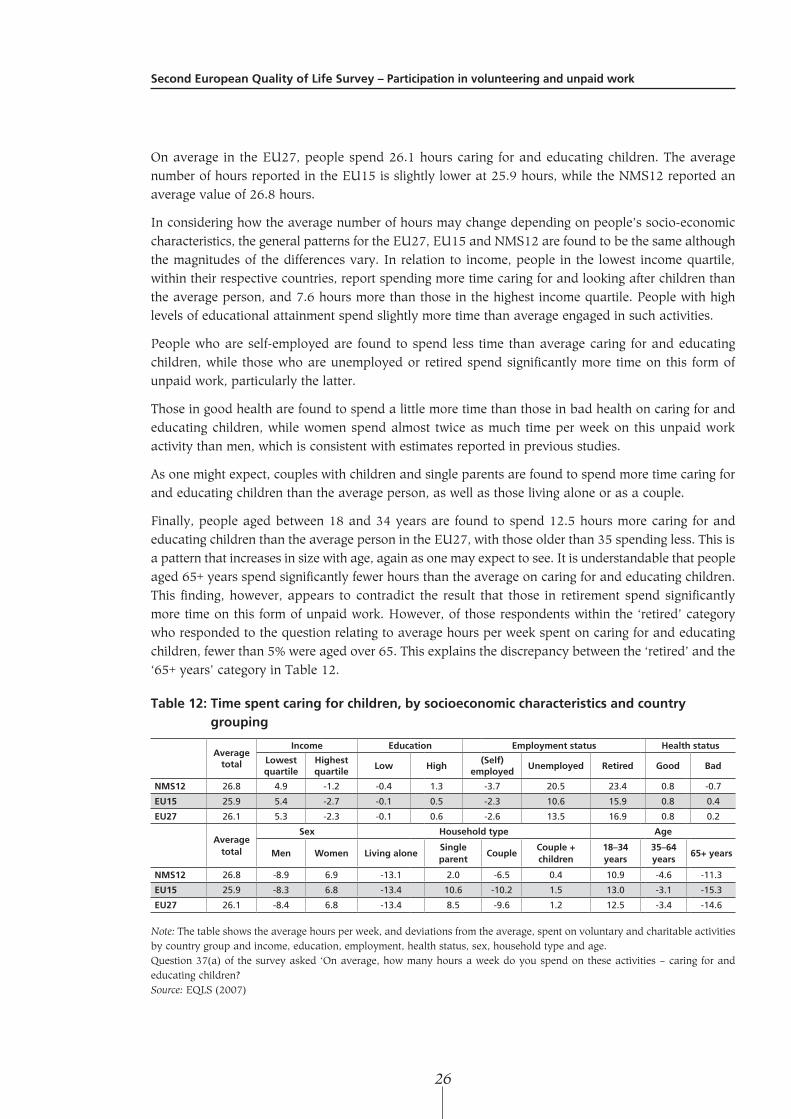
Table 12 presents a breakdown of the average number of hours (per week) people have reported to be involved in caring for and educating children by different social characteristics and country groupings.
SecondEuropeanQualityofLifeSurvey–Participationinvolunteeringandunpaidwork
26
On average in the EU27, people spend 26.1 hours caring for and educating children. The average number of hours reported in the EU15 is slightly lower at 25.9 hours, while the NMS12 reported an average value of 26.8 hours.
In considering how the average number of hours may change depending on people’s socio-economic characteristics, the general patterns for the EU27, EU15 and NMS12 are found to be the same although the magnitudes of the differences vary. In relation to income, people in the lowest income quartile, within their respective countries, report spending more time caring for and looking after children than the average person, and 7.6 hours more than those in the highest income quartile. People with high levels of educational attainment spend slightly more time than average engaged in such activities.
People who are self-employed are found to spend less time than average caring for and educating children, while those who are unemployed or retired spend significantly more time on this form of unpaid work, particularly the latter.
Those in good health are found to spend a little more time than those in bad health on caring for and educating children, while women spend almost twice as much time per week on this unpaid work activity than men, which is consistent with estimates reported in previous studies.
As one might expect, couples with children and single parents are found to spend more time caring for and educating children than the average person, as well as those living alone or as a couple.
Finally, people aged between 18 and 34 years are found to spend 12.5 hours more caring for and educating children than the average person in the EU27, with those older than 35 spending less. This is a pattern that increases in size with age, again as one may expect to see. It is understandable that people aged 65+ years spend significantly fewer hours than the average on caring for and educating children. This finding, however, appears to contradict the result that those in retirement spend significantly more time on this form of unpaid work. However, of those respondents within the ‘retired’ category who responded to the question relating to average hours per week spent on caring for and educating children, fewer than 5% were aged over 65. This explains the discrepancy between the ‘retired’ and the ‘65+ years’ category in Table 12.
Table12:Timespentcaringforchildren,bysocioeconomiccharacteristicsandcountrygrouping
Averagetotal
Income Education Employmentstatus Healthstatus
Lowestquartile
Highestquartile
Low High(Self)
employedUnemployed Retired Good Bad
NMS12 26.8 4.9 -1.2 -0.4 1.3 -3.7 20.5 23.4 0.8 -0.7
EU15 25.9 5.4 -2.7 -0.1 0.5 -2.3 10.6 15.9 0.8 0.4
EU27 26.1 5.3 -2.3 -0.1 0.6 -2.6 13.5 16.9 0.8 0.2
Averagetotal
Sex Householdtype Age
Men Women LivingaloneSingleparent
CoupleCouple+children
18–34years
35–64years
65+years
NMS12 26.8 -8.9 6.9 -13.1 2.0 -6.5 0.4 10.9 -4.6 -11.3
EU15 25.9 -8.3 6.8 -13.4 10.6 -10.2 1.5 13.0 -3.1 -15.3
EU27 26.1 -8.4 6.8 -13.4 8.5 -9.6 1.2 12.5 -3.4 -14.6
Note: The table shows the average hours per week, and deviations from the average, spent on voluntary and charitable activities by country group and income, education, employment, health status, sex, household type and age.Question 37(a) of the survey asked ‘On average, how many hours a week do you spend on these activities – caring for and educating children?Source: EQLS (2007)
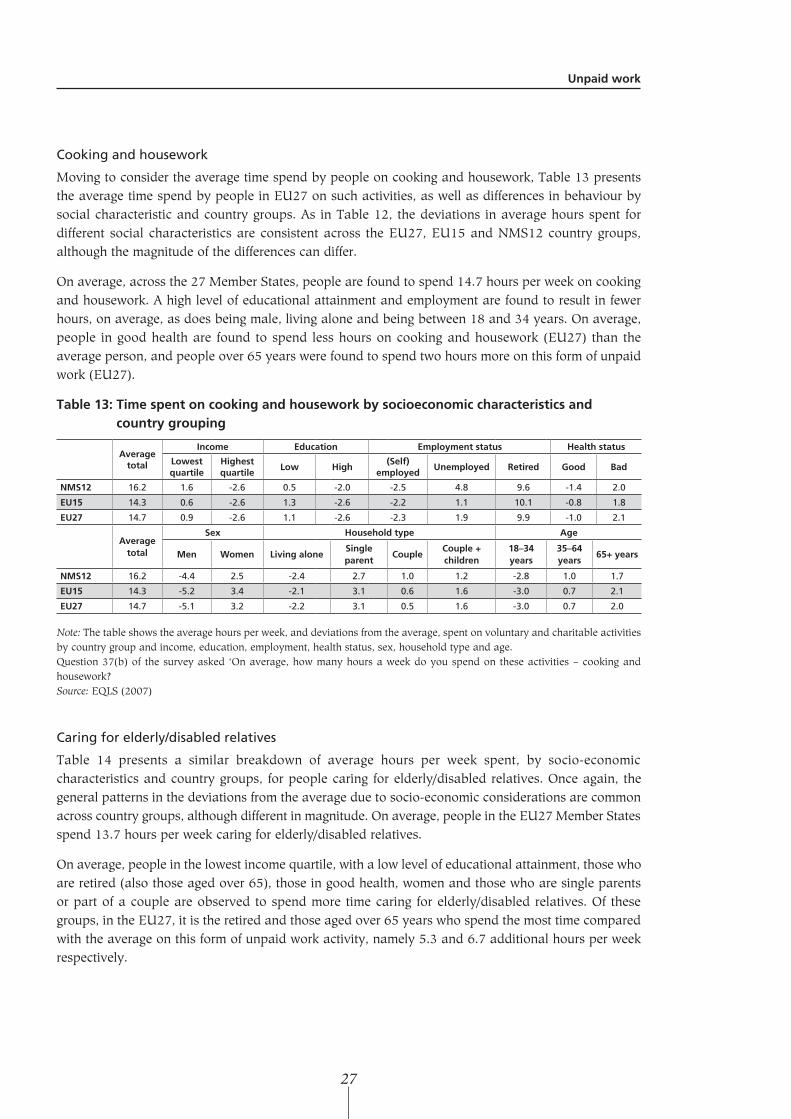
Unpaidwork
27
Cooking and housework
Moving to consider the average time spend by people on cooking and housework, Table 13 presents the average time spend by people in EU27 on such activities, as well as differences in behaviour by social characteristic and country groups. As in Table 12, the deviations in average hours spent for different social characteristics are consistent across the EU27, EU15 and NMS12 country groups, although the magnitude of the differences can differ.
On average, across the 27 Member States, people are found to spend 14.7 hours per week on cooking and housework. A high level of educational attainment and employment are found to result in fewer hours, on average, as does being male, living alone and being between 18 and 34 years. On average, people in good health are found to spend less hours on cooking and housework (EU27) than the average person, and people over 65 years were found to spend two hours more on this form of unpaid work (EU27).
Table13:Timespentoncookingandhouseworkbysocioeconomiccharacteristicsandcountrygrouping
Averagetotal
Income Education Employmentstatus Healthstatus
Lowestquartile
Highestquartile
Low High(Self)
employedUnemployed Retired Good Bad
NMS12 16.2 1.6 -2.6 0.5 -2.0 -2.5 4.8 9.6 -1.4 2.0
EU15 14.3 0.6 -2.6 1.3 -2.6 -2.2 1.1 10.1 -0.8 1.8
EU27 14.7 0.9 -2.6 1.1 -2.6 -2.3 1.9 9.9 -1.0 2.1
Averagetotal
Sex Householdtype Age
Men Women LivingaloneSingleparent
CoupleCouple+children
18–34years
35–64years
65+years
NMS12 16.2 -4.4 2.5 -2.4 2.7 1.0 1.2 -2.8 1.0 1.7
EU15 14.3 -5.2 3.4 -2.1 3.1 0.6 1.6 -3.0 0.7 2.1
EU27 14.7 -5.1 3.2 -2.2 3.1 0.5 1.6 -3.0 0.7 2.0
Note: The table shows the average hours per week, and deviations from the average, spent on voluntary and charitable activities by country group and income, education, employment, health status, sex, household type and age.Question 37(b) of the survey asked ‘On average, how many hours a week do you spend on these activities – cooking and housework?Source: EQLS (2007)
Caring for elderly/disabled relatives
Table 14 presents a similar breakdown of average hours per week spent, by socio-economic characteristics and country groups, for people caring for elderly/disabled relatives. Once again, the general patterns in the deviations from the average due to socio-economic considerations are common across country groups, although different in magnitude. On average, people in the EU27 Member States spend 13.7 hours per week caring for elderly/disabled relatives.
On average, people in the lowest income quartile, with a low level of educational attainment, those who are retired (also those aged over 65), those in good health, women and those who are single parents or part of a couple are observed to spend more time caring for elderly/disabled relatives. Of these groups, in the EU27, it is the retired and those aged over 65 years who spend the most time compared with the average on this form of unpaid work activity, namely 5.3 and 6.7 additional hours per week respectively.
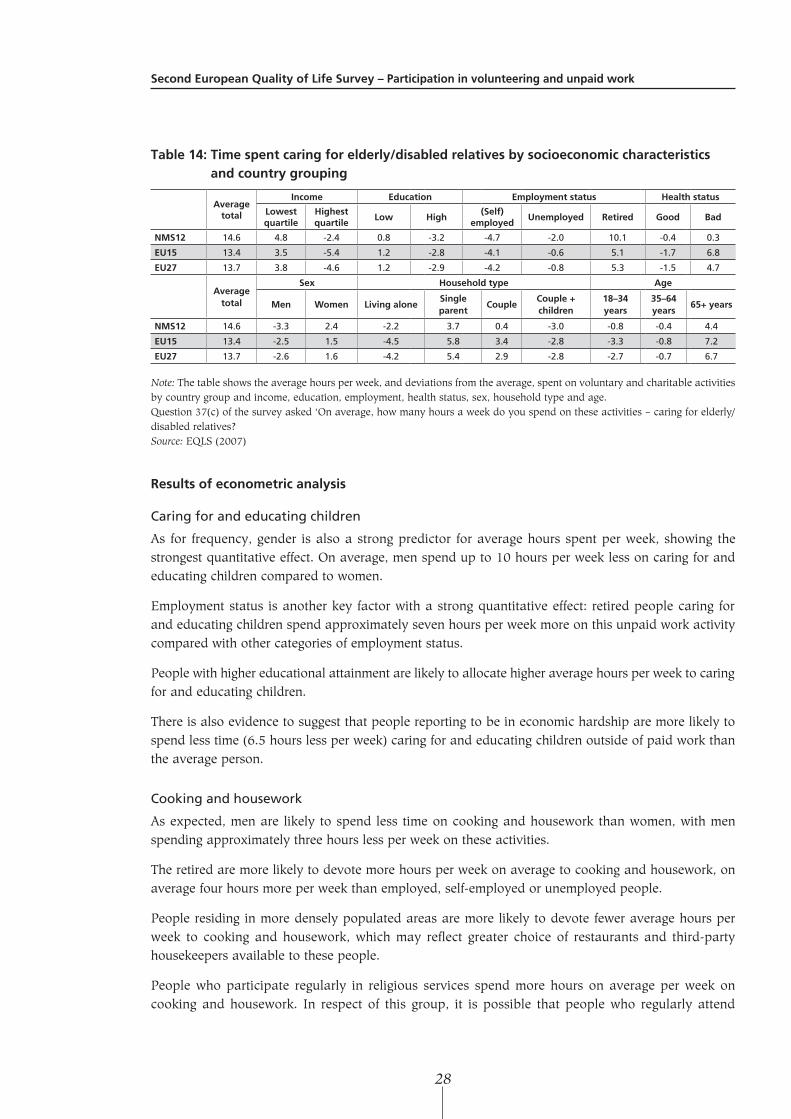
SecondEuropeanQualityofLifeSurvey–Participationinvolunteeringandunpaidwork
28
Table14:Timespentcaringforelderly/disabledrelativesbysocioeconomiccharacteristicsandcountrygrouping
Averagetotal
Income Education Employmentstatus Healthstatus
Lowestquartile
Highestquartile
Low High(Self)
employedUnemployed Retired Good Bad
NMS12 14.6 4.8 -2.4 0.8 -3.2 -4.7 -2.0 10.1 -0.4 0.3
EU15 13.4 3.5 -5.4 1.2 -2.8 -4.1 -0.6 5.1 -1.7 6.8
EU27 13.7 3.8 -4.6 1.2 -2.9 -4.2 -0.8 5.3 -1.5 4.7
Averagetotal
Sex Householdtype Age
Men Women LivingaloneSingleparent
CoupleCouple+children
18–34years
35–64years
65+years
NMS12 14.6 -3.3 2.4 -2.2 3.7 0.4 -3.0 -0.8 -0.4 4.4
EU15 13.4 -2.5 1.5 -4.5 5.8 3.4 -2.8 -3.3 -0.8 7.2
EU27 13.7 -2.6 1.6 -4.2 5.4 2.9 -2.8 -2.7 -0.7 6.7
Note: The table shows the average hours per week, and deviations from the average, spent on voluntary and charitable activities by country group and income, education, employment, health status, sex, household type and age.Question 37(c) of the survey asked ‘On average, how many hours a week do you spend on these activities – caring for elderly/disabled relatives?Source: EQLS (2007)
Resultsofeconometricanalysis
Caring for and educating children
As for frequency, gender is also a strong predictor for average hours spent per week, showing the strongest quantitative effect. On average, men spend up to 10 hours per week less on caring for and educating children compared to women.
Employment status is another key factor with a strong quantitative effect: retired people caring for and educating children spend approximately seven hours per week more on this unpaid work activity compared with other categories of employment status.
People with higher educational attainment are likely to allocate higher average hours per week to caring for and educating children.
There is also evidence to suggest that people reporting to be in economic hardship are more likely to spend less time (6.5 hours less per week) caring for and educating children outside of paid work than the average person.
Cooking and housework
As expected, men are likely to spend less time on cooking and housework than women, with men spending approximately three hours less per week on these activities.
The retired are more likely to devote more hours per week on average to cooking and housework, on average four hours more per week than employed, self-employed or unemployed people.
People residing in more densely populated areas are more likely to devote fewer average hours per week to cooking and housework, which may reflect greater choice of restaurants and third-party housekeepers available to these people.
People who participate regularly in religious services spend more hours on average per week on cooking and housework. In respect of this group, it is possible that people who regularly attend
Unpaidwork
29
religious services place a relatively high degree of importance on sharing meals with their brethren and/or that attending religious services provides an environment to meet people and invite them around to one’s home.
Educational attainment is also an important predictor: people with a higher level of educational attainment spend roughly two hours less per week on housework and cooking.
Residents of the Nordic Member States are more likely to spend lower than average hours on housework and cooking. Residents of Denmark, Finland and Sweden report spending approximately four hours less per week on this form of unpaid work than people who reside in Ireland or the UK.
Caring for elderly or disabled relatives
There is once again, and as expected, a strong gender effect. Men are more likely to spend fewer hours per week – around four fewer per week than women – caring for elderly or disabled relatives.
Surprisingly, frequent participation in religious services is associated with less time spent caring for elderly or disabled relatives. Those who participate frequently in religious services spend on average roughly one hour less per week caring for relatives than those who do not participate frequently. The reason for this is not clear from the survey data.
Conclusions
Like voluntary and charitable activities, there are distinct country patterns in the frequency of participation in unpaid work activities.
Finland has the highest participation rates (although the average number of hours per week is low) in terms of involvement in unpaid work:
■ caring for and educating children (60%);
■ cooking and housework (97%);
■ caring for elderly/disabled relatives (43%).
The frequency of participation is also relatively high in the other Nordic Member States (Denmark and Sweden).
The key factors determining the frequency of participation in caring for and educating children are being retired, which increases the likelihood of frequent participation, and being a man, which decreases it.
In respect of cooking and housework, again the most important factor is gender.
With regard to the frequency of involvement in caring for elderly/disabled relatives, one of the key factors is employment status. Retired people are more likely to be involved more frequently than employed, self-employed or unemployed people. Men are less likely to be involved frequently. Also, there are certain country effects: residents of the Nordic Member States are more likely to be frequently involved, while residents of Germany or Austria are less likely (as are residents of Bulgaria or Romania).
Age is also a determinant of unpaid work, albeit with a smaller quantitative impact. The frequency of involvement first increases, then reaches a maximum before decreasing. The turning points are:
■ the mid 40s in the case of caring for and educating children;
SecondEuropeanQualityofLifeSurvey–Participationinvolunteeringandunpaidwork
30
■ the late 40s in respect of cooking and housework;
■ the early 50s for caring for elderly/disabled relatives.
These respective turning points pertain mostly to women.
On average in the EU27, people spend 26.1 hours per week caring for and educating children; The average figure for the EU15 is slightly lower at 25.9 hours, while on average in the NMS12 it is 26.8 hours.
The corresponding figures for cooking and housework are 14.7 hours in the EU27, 14.3 hours in the EU15 and 16.2 hours in the NMS12.
And the corresponding figures for caring for elderly/disabled relatives are 13.7 hours in the EU27, 13.4 hours in the EU15 and 14.6 hours in the NMS12.
Hours per week devoted to these unpaid work activities are therefore higher on average in the NMS12 than in the EU15.
Echoing previous research and in accord with intuition, women spend substantially more time than men on unpaid work. The analysis shows that women spend almost twice as many hours per week on unpaid work than men.
People who participate to some extent in caring for and educating children report higher life satisfaction scores, whereas those who never participate in caring for elderly or disabled relatives report higher life satisfaction scores than those engaged in this activity on a daily basis. However, in statistical terms no relationship between the frequency of participation in unpaid work activities and life satisfaction scores can be shown. This means that how happy a person is with life does not help to predict frequency of their participation in unpaid work. The same is evident in respect of life satisfaction and average hours per week on unpaid work activities: in statistical terms there is no relationship between the two.
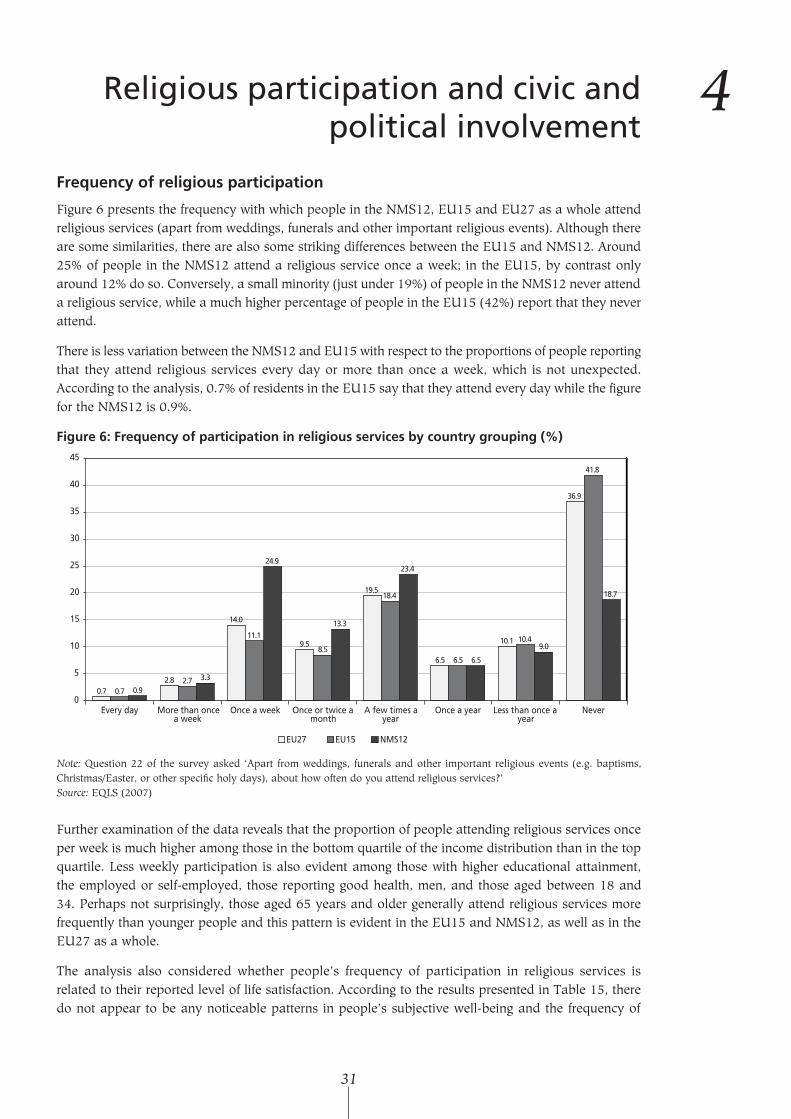
31
4Religious participation and civic and political involvement
Frequencyofreligiousparticipation
Figure 6 presents the frequency with which people in the NMS12, EU15 and EU27 as a whole attend religious services (apart from weddings, funerals and other important religious events). Although there are some similarities, there are also some striking differences between the EU15 and NMS12. Around 25% of people in the NMS12 attend a religious service once a week; in the EU15, by contrast only around 12% do so. Conversely, a small minority (just under 19%) of people in the NMS12 never attend a religious service, while a much higher percentage of people in the EU15 (42%) report that they never attend.
There is less variation between the NMS12 and EU15 with respect to the proportions of people reporting that they attend religious services every day or more than once a week, which is not unexpected. According to the analysis, 0.7% of residents in the EU15 say that they attend every day while the figure for the NMS12 is 0.9%.
Figure6:Frequencyofparticipationinreligiousservicesbycountrygrouping(%)
0
5
10
15
20
25
30
35
40
45
Every day More than oncea week
Once a week Once or twice amonth
A few times ayear
Once a year Less than once ayear
Never
EU27 EU15 NMS12
0.72.8
14.0
9.5
19.5
6.5
10.1
36.9
0.72.7
11.1
8.5
18.4
6.5
10.4
41.8
0.9
3.3
24.9
13.3
23.4
6.5
9.0
18.7
Note: Question 22 of the survey asked ‘Apart from weddings, funerals and other important religious events (e.g. baptisms, Christmas/Easter, or other specific holy days), about how often do you attend religious services?’Source: EQLS (2007)
Further examination of the data reveals that the proportion of people attending religious services once per week is much higher among those in the bottom quartile of the income distribution than in the top quartile. Less weekly participation is also evident among those with higher educational attainment, the employed or self-employed, those reporting good health, men, and those aged between 18 and 34. Perhaps not surprisingly, those aged 65 years and older generally attend religious services more frequently than younger people and this pattern is evident in the EU15 and NMS12, as well as in the EU27 as a whole.
The analysis also considered whether people’s frequency of participation in religious services is related to their reported level of life satisfaction. According to the results presented in Table 15, there do not appear to be any noticeable patterns in people’s subjective well-being and the frequency of
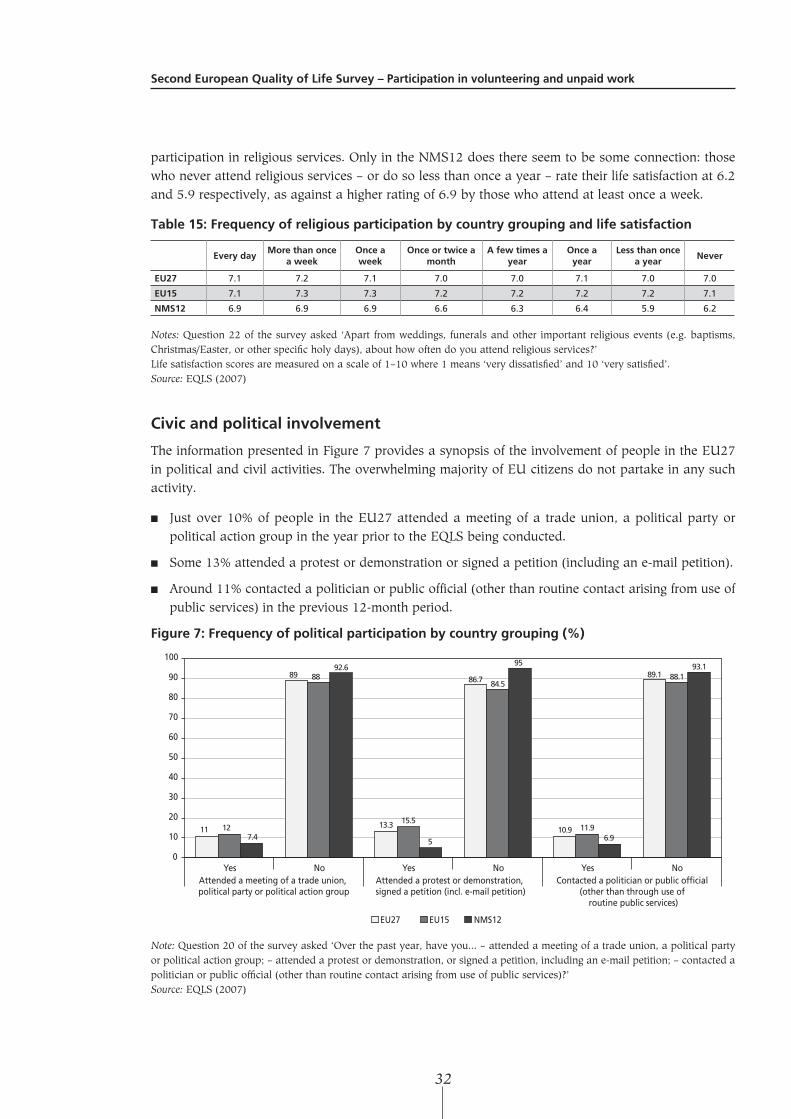
SecondEuropeanQualityofLifeSurvey–Participationinvolunteeringandunpaidwork
32
participation in religious services. Only in the NMS12 does there seem to be some connection: those who never attend religious services – or do so less than once a year – rate their life satisfaction at 6.2 and 5.9 respectively, as against a higher rating of 6.9 by those who attend at least once a week.
Table15:Frequencyofreligiousparticipationbycountrygroupingandlifesatisfaction
EverydayMorethanonce
aweekOnceaweek
Onceortwiceamonth
Afewtimesayear
Onceayear
Lessthanonceayear
Never
EU27 7.1 7.2 7.1 7.0 7.0 7.1 7.0 7.0
EU15 7.1 7.3 7.3 7.2 7.2 7.2 7.2 7.1
NMS12 6.9 6.9 6.9 6.6 6.3 6.4 5.9 6.2
Notes: Question 22 of the survey asked ‘Apart from weddings, funerals and other important religious events (e.g. baptisms, Christmas/Easter, or other specific holy days), about how often do you attend religious services?’Life satisfaction scores are measured on a scale of 1–10 where 1 means ‘very dissatisfied’ and 10 ‘very satisfied’.Source: EQLS (2007)
Civicandpoliticalinvolvement
The information presented in Figure 7 provides a synopsis of the involvement of people in the EU27 in political and civil activities. The overwhelming majority of EU citizens do not partake in any such activity.
■ Just over 10% of people in the EU27 attended a meeting of a trade union, a political party or political action group in the year prior to the EQLS being conducted.
■ Some 13% attended a protest or demonstration or signed a petition (including an e-mail petition).
■ Around 11% contacted a politician or public official (other than routine contact arising from use of public services) in the previous 12-month period.
Figure7:Frequencyofpoliticalparticipationbycountrygrouping(%)
0
10
20
30
40
50
60
70
80
90
100
Yes No Yes No Yes NoAttended a meeting of a trade union, political party or political action group
Attended a protest or demonstration, signed a petition (incl. e-mail petition)
Contacted a politician or public official (other than through use of
routine public services)
EU27 EU15 NMS12
11
89
13.3
86.7
10.9
89.1
12
88
15.5
84.5
11.9
88.1
7.4
92.6
5
95
6.9
93.1
Note: Question 20 of the survey asked ‘Over the past year, have you… – attended a meeting of a trade union, a political party or political action group; – attended a protest or demonstration, or signed a petition, including an e-mail petition; – contacted a politician or public official (other than routine contact arising from use of public services)?’Source: EQLS (2007)
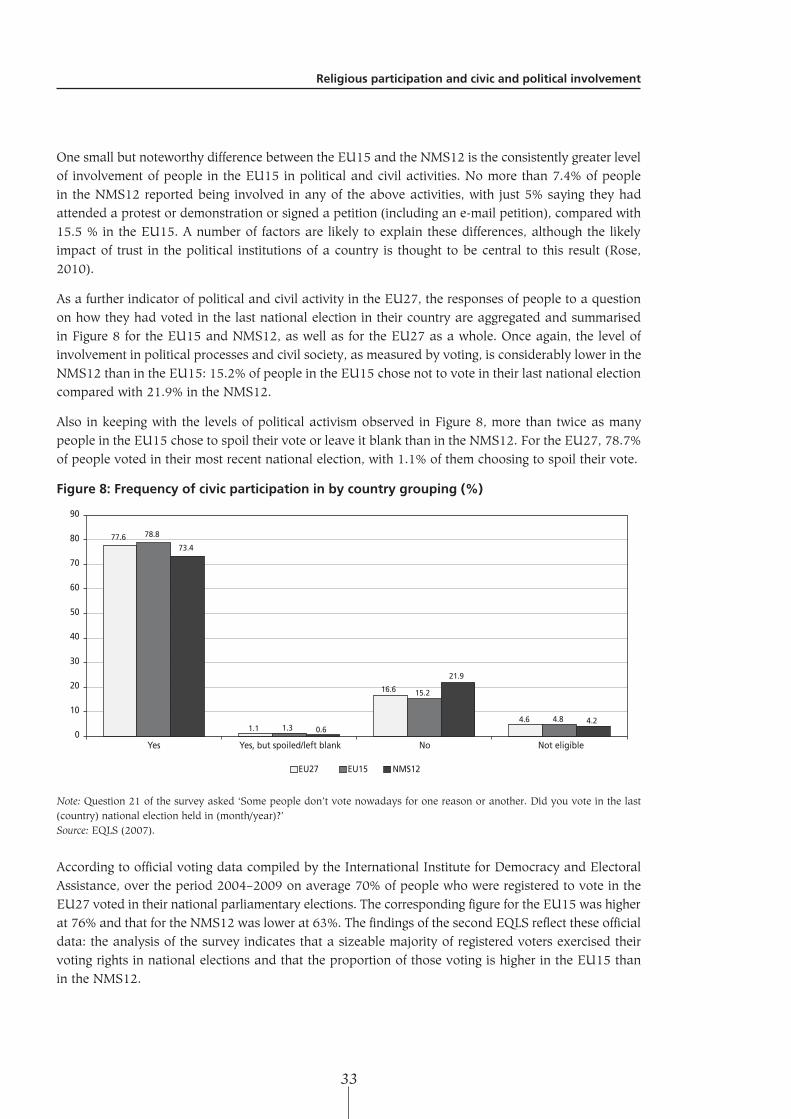
Religiousparticipationandcivicandpoliticalinvolvement
33
One small but noteworthy difference between the EU15 and the NMS12 is the consistently greater level of involvement of people in the EU15 in political and civil activities. No more than 7.4% of people in the NMS12 reported being involved in any of the above activities, with just 5% saying they had attended a protest or demonstration or signed a petition (including an e-mail petition), compared with 15.5 % in the EU15. A number of factors are likely to explain these differences, although the likely impact of trust in the political institutions of a country is thought to be central to this result (Rose, 2010).
As a further indicator of political and civil activity in the EU27, the responses of people to a question on how they had voted in the last national election in their country are aggregated and summarised in Figure 8 for the EU15 and NMS12, as well as for the EU27 as a whole. Once again, the level of involvement in political processes and civil society, as measured by voting, is considerably lower in the NMS12 than in the EU15: 15.2% of people in the EU15 chose not to vote in their last national election compared with 21.9% in the NMS12.
Also in keeping with the levels of political activism observed in Figure 8, more than twice as many people in the EU15 chose to spoil their vote or leave it blank than in the NMS12. For the EU27, 78.7% of people voted in their most recent national election, with 1.1% of them choosing to spoil their vote.
Figure8:Frequencyofcivicparticipationinbycountrygrouping(%)
0
10
20
30
40
50
60
70
80
90
Yes Yes, but spoiled/left blank No Not eligible
EU27 EU15 NMS12
77.6
1.1
16.6
4.6
78.8
1.3
15.2
4.8
73.4
0.6
21.9
4.2
Note: Question 21 of the survey asked ‘Some people don’t vote nowadays for one reason or another. Did you vote in the last (country) national election held in (month/year)?’Source: EQLS (2007).
According to official voting data compiled by the International Institute for Democracy and Electoral Assistance, over the period 2004–2009 on average 70% of people who were registered to vote in the EU27 voted in their national parliamentary elections. The corresponding figure for the EU15 was higher at 76% and that for the NMS12 was lower at 63%. The findings of the second EQLS reflect these official data: the analysis of the survey indicates that a sizeable majority of registered voters exercised their voting rights in national elections and that the proportion of those voting is higher in the EU15 than in the NMS12.
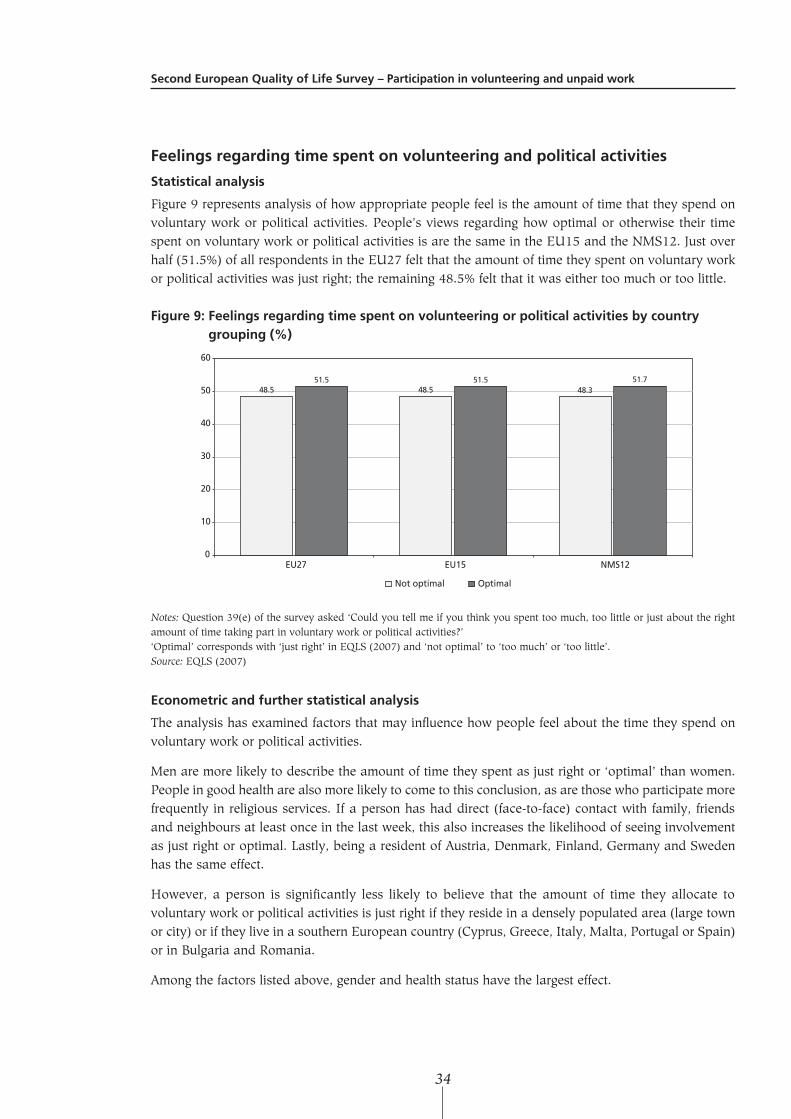
SecondEuropeanQualityofLifeSurvey–Participationinvolunteeringandunpaidwork
34
Feelingsregardingtimespentonvolunteeringandpoliticalactivities
Statisticalanalysis
Figure 9 represents analysis of how appropriate people feel is the amount of time that they spend on voluntary work or political activities. People’s views regarding how optimal or otherwise their time spent on voluntary work or political activities is are the same in the EU15 and the NMS12. Just over half (51.5%) of all respondents in the EU27 felt that the amount of time they spent on voluntary work or political activities was just right; the remaining 48.5% felt that it was either too much or too little.
Figure9:Feelingsregardingtimespentonvolunteeringorpoliticalactivitiesbycountrygrouping(%)
48.5 48.5 48.351.5 51.5 51.7
0
10
20
30
40
50
60
EU27 EU15 NMS12
Not optimal Optimal
Notes: Question 39(e) of the survey asked ‘Could you tell me if you think you spent too much, too little or just about the right amount of time taking part in voluntary work or political activities?’‘Optimal’ corresponds with ‘just right’ in EQLS (2007) and ‘not optimal’ to ‘too much’ or ‘too little’.Source: EQLS (2007)
Econometricandfurtherstatisticalanalysis
The analysis has examined factors that may influence how people feel about the time they spend on voluntary work or political activities.
Men are more likely to describe the amount of time they spent as just right or ‘optimal’ than women. People in good health are also more likely to come to this conclusion, as are those who participate more frequently in religious services. If a person has had direct (face-to-face) contact with family, friends and neighbours at least once in the last week, this also increases the likelihood of seeing involvement as just right or optimal. Lastly, being a resident of Austria, Denmark, Finland, Germany and Sweden has the same effect.
However, a person is significantly less likely to believe that the amount of time they allocate to voluntary work or political activities is just right if they reside in a densely populated area (large town or city) or if they live in a southern European country (Cyprus, Greece, Italy, Malta, Portugal or Spain) or in Bulgaria and Romania.
Among the factors listed above, gender and health status have the largest effect.
Religiousparticipationandcivicandpoliticalinvolvement
35
To investigate further the socioeconomic characteristics of people who say that they spend ‘too little’ time on voluntary work or political activities, additional analysis was carried out on this particular group.
The salient features associated with those reporting spending ‘too little’ time on voluntary work and political activities in the EU27 include:
■ educational attainment – 70% of those with low educational attainment (that is, whose highest educational attainment is upper secondary)4 believe that they spend too little time on voluntary work and political activities compared with 30% of those high educational attainment;
■ employment status – 57% of those who are employed or self-employed believe that they devote too little time to voluntary work and political activities;
■ health status – 70% of people who feel themselves to be in good health say that they spend too little on voluntary work and political activities;
■ gender – women (53%) are more likely than men (47%) to feel that the time spent on voluntary work and political activities is too little;
■ household type – 40% of households comprising a couple plus children feel they spend too little time on voluntary work and political activities, whereas the corresponding proportion for people living alone, for example, is 13%.
Conclusions
Religious participation is more extensive in the NMS12 than in the EU15. Almost 25% of people in the NMS12 attend a religious service once a week, as against less half this in the EU15. Conversely, only a small minority (18.7%) of people in the NMS12 never attend religious services. This figure stands at 42% for the EU15. The appreciably higher levels of regular attendance of religious services in the NMS12 may reflect different factors, including the traditional role of religious practice in some of these countries (for example, Poland), the expression of which has become more apparent in the past 20 years following the collapse of their communist regimes.
There do not appear to be any noticeable relationship between people’s subjective well-being and the frequency of their participation in religious services in the EU15. There is a slightly clearer pattern in which more frequent participation in religious services is associated with higher life satisfaction scores in the NMS12.
As already discussed in Chapter 2, people who participate frequently in religious activities are more likely to participate frequently in voluntary and charitable activities. Interestingly, people participating frequently in religious activities are more likely to feel that the time they spend taking part in voluntary work or political activities is ‘just right’.
The vast majority of people in the EU15 and NMS12 tend not to partake in political or civil activities. One small but noteworthy difference between the EU15 and the NMS12 is the consistently greater level of involvement of people in the EU15 in political and civil activities than in the NMS12. This includes the extent of voting, which is lower in the NMS12.
4 International Standard Classification of Education (ISCED) 3
SecondEuropeanQualityofLifeSurvey–Participationinvolunteeringandunpaidwork
36
People’s views regarding the ‘optimality’ of their time spent on voluntary work or political activities are uniform across the EU27 and do not differ between the EU15 and the NMS12. Over half (51.5%) of all respondents in the EU27 considered the amount of time taking part in voluntary work or political activities to be just right; the remaining 48.5% considered the time given to such activities to be too much or too little.
It is interesting to look in more detail at those reporting that they spend ‘too little’ time on voluntary work or political activities. It can be seen that respondents with relatively low educational attainment are more likely to feel that they are not spending enough time. Since building up skills and networks are known to be among the reasons for getting involved in volunteering, people with higher educational attainment may feel more satisfied with their level of participation. The employed or self-employed are more likely to feel that they spend too little time, as do women and people who are part of a household consisting of a couple plus children; more severe time constraints are the most likely explanation for this.
37
5Conclusions and policy implications
Overallconclusions
This study provides new empirical evidence on volunteering and unpaid work activities in the EU based on analyses of data from the second EQLS. The results are consistent with previous empirical research on volunteering and unpaid work. The study also considered religious participation and its relationship with voluntary and charitable activities, and has looked at civil society and political involvement.
According to the analysis made, one fifth of Europeans participate in voluntary and charitable activities. People with a high level of educational attainment are also more likely to be volunteers. The peak time to be a frequent volunteer is between the ages of 45 and 50. Not surprisingly, people in good health are more likely to volunteer; those suffering from economic hardship are less likely to do so. In terms of a country effect, we see that residents of the Nordic Member States (Denmark, Finland, Sweden) are more likely to volunteer; residents of southern European countries – Cyprus, Greece, Italy, Malta, Portugal and Spain – are less likely.
For those who participate, the average number of hours per week spent on voluntary and charitable activities is similar for the EU15 and NMS12 at 6.5 hours per week, suggesting that people residing in those countries with relatively low frequencies of participation nevertheless tend to devote longer average spells of time when they do participate.
People with high levels of educational attainment (at least post-secondary) devote on average approximately between 1.5 and 1.7 hours more per week to voluntary and charitable activities than do those with lower educational attainment, while men devote on average about one hour more per week than women. People with high scores for subjective well-being or life satisfaction are more likely to participate frequently in voluntary and charitable activities. But life satisfaction has no significant impact in respect of the average number of hours per week devoted to voluntary and charitable activities.
People who are involved in caring for and educating children and caring for elderly or disabled relatives on a frequent basis are less likely to be involved in voluntary and charitable activities. As might be expected, women are more likely than men to frequently perform unpaid work of all three types under examination (caring for and educating children, cooking and housework, and caring for elderly or disabled relatives).
The average number of hours per week spent is higher for all three unpaid work activities in the NMS12 than in the EU15. Again, women spend substantially more time than men on unpaid work – nearly twice as many hours per week. This is a likely factor in explaining the fact that men devote on average about one hour more per week to formal volunteering.
There is a noticeably higher level of regular attendance of religious services in the NMS12 compared with the EU15, which may reflect the importance of Poland in the survey-weighted data. There is no evidence for the EU27 as a whole to suggest that people who attend religious services regularly are happier than those who do not, though within the NMS12 there is evidence to suggest that such people report being slightly more satisfied with their lives. However, people who regularly attend religious services are also more likely to participate frequently in voluntary and charitable activities.
The majority of people in the EU15 and NMS12 do not participate in political or civil activities. For example, just over one in ten people in the EU27 reported that they attended a meeting of a trade union, a political party or political action group in the past year. A small but noteworthy difference between the EU15 and the NMS12 is the consistently greater level of involvement of people in the
SecondEuropeanQualityofLifeSurvey–Participationinvolunteeringandunpaidwork
38
EU15 in political and civil activities compared with those in the NMS12. Only 7.4% of people in the NMS12 reported being involved in any of the above activities, with just 5% reporting attending a protest or demonstration or signing a petition (including an e-mail petition) compared to 15.5 % in the EU15. The extent of voting is considerably lower in the NMS12 than in the EU15; just 15.2% of people in the EU15 chose not to vote in their last national election, compared with 21.9% in the NMS12. These results are consistent with official voting data.
Finally, people’s views regarding the ‘optimality’ of their time spent on voluntary work or political activities differ little between the EU15 and NMS12. People reporting that they spend ‘too little’ time on voluntary work or political activities are found to be characterised by relatively low educational attainment, are employed or self-employed, report being in good health, are more likely to be women and are more likely to be part of a household consisting of a couple with children.
Policyimplications
The analysis shows that the extent of volunteering, unpaid work and civil participation differs widely across the Member States. The European Year of Voluntary Activities Promoting Active Citizenship (2011) provides a unique opportunity to raise awareness of the importance of volunteering across Europe. The events, programmes and campaigns during the European Year serve as platforms for exchange of good practice and valuable information, helping to overcome some of the barriers which exist, for example, in countries with less tradition in this activity.
The evidence in the study also revealed that participation in volunteering is relatively low in those countries where much time is spent on family and household-related unpaid work. This may partly explain why scope for volunteering is rather limited in some countries where its tradition is also relatively weak. Reasons other than the framework conditions for voluntary work arrangements may play a role in this. The analysis of the characteristics of those people whose time on volunteering or other civil society activities is felt to be ‘too little’ seems to confirm this assumption; the results show that women and people who are part of a household consisting of a couple plus children believe that the time they spend on voluntary work or political activities is ‘too little’; they are presumably more involved in unpaid work activities within their household than most other groups.
As revealed by previous research, although a large number of people are in principle willing to volunteer, most of them do not do so in practice. Therefore, as a first step in discovering the reasons for this discrepancy, this topic was further investigated. The findings identify other groups who think that they have too little time for volunteering – these include people with low educational attainment and those who are in employment or who are self-employed. This finding points to a need to lift existing legal and other barriers that discourage less skilled people from volunteering. Such barriers may include demanding requirements (specifying too specific a skillset, for instance) and too strict legal regulations (for example, in terms of insurance requirements).
When exchanging good practice, it could therefore be useful to focus on voluntary activities that require lower skills levels and less specific skills; in addition, skills development practices aimed specifically at preparing potential volunteers could be valuable.
At the same time, practical arrangements are needed for more recognition of those experiences and skills gained during voluntary work. In this respect, the publication in 2009 by the European Centre for the Development of Vocational Training (Cedefop) of European guidelines(Cedefop, 2009) on the
Conclusionsandpolicyimplications
39
validation of non-formal and informal learning is a noteworthy initiative;5 a number of countries have the practice of validation of non-formal and informal learning in place and others have established arrangements to do so. Such initiatives could help those currently out of work and/or with low educational attainment to be integrated into the labour market. Although the significance of voluntary work experience is widely recognised in public employment services, greater promotion of volunteering opportunities at job centres, work clubs and resource centres would be required to help the unemployed with training and getting back to work.
5 http://ec.europa.eu/education/lifelong-learning-policy/doc52_en.htm
40
Bibliography
Ammerman, N.T., Pillarsoffaith:Americancongregationsandtheirpartners,Berkeley, University of California Press, 2005.
Anderson, R., Mikuliç, B., Vermeylen, G., Lyly-Yrjänäinen, M. and Zigante, V., European Foundation for the Improvement of Living and Working Conditions (Eurofound), SecondEuropeanQualityofLifeSurvey:Overview, Luxembourg, Publications Office of the European Union, 2009.
Antoni, G.D., ‘Intrinsic vs. extrinsic motivations to volunteer and social capital formation’, Kyklos, Vol. 62, Issue 3, 2009, pp. 359–70.
Antonopoulos, R., Theunpaidcarework–paidworkconnection, Geneva, International Labour Office, Policy Integration and Statistics Department, 2009.
Baines, S. and Hardill, I., ‘At least I can do something: the work of volunteering in a community beset by worklessness’, SocialPolicyandSociety, Vol. 7, Issue 3, 2008, pp. 207–317.
Becker, P.E. and Dhingra P.H., ‘Religious involvement and volunteering: implications for civil society’,SociologyofReligion, Vol. 62, 2001, pp. 315–335.
Beyerlein, K. and Chaves, M., ‘The political activities of religious congregations in the United States’,JournalfortheScientificStudyofReligion, Vol. 42, 2003, pp. 229–246.
Beyerlein, K. and Hipp, J.R., ‘From pews to participation: the effects of congregation activity and context on bridging civic engagement’,SocialProblems, Vol. 53, 2006, pp. 97–117.
Boaz, R.F. and Muller, C.F., ‘Paid work and unpaid help by caregivers of the disabled and frail elders’, MedCare, Vol. 30, Issue 2, 1992, pp. 149–158.
Brooks, A. C., ‘Religious faith and charitable giving’, PolicyReview, No. 121, 2003, available online at http://www.hoover.org/publications/policy-review/article/6577.
Bruno, B. and Fiorillo, D., Whywithoutpay?theintrinsicmotivationbetweeninvestmentandconsumptioninunpaidlaboursupply, CELPE Discussion Papers 111, Salerno, Italy, University of Salerno, Centre of Labour Economics and Economic Policy (CELPE), 2009.
Burr, J.A., Choi, N.G., Mutchler, J.E. and Caro, F.C., ‘Caregiving and volunteering: are private and public helping behaviours linked?’, JournalofGerontology, SocialScience Vol. 60B, 2005, S247–256.
Cedefop (European Centre for the Development of Vocational Training), European guidelines forvalidatingnon-formalandinformallearning, Luxembourg, Publications Office of the European Union, 2009.
Chang, W.C., ‘Religious giving, non-religious giving, and after-life consumption’, TheB.E.JournalofEconomicAnalysis&Policy, Vol. 5, Issue 1, 2005.
Chaves, M., CongregationsinAmerica,Cambridge, MA, Harvard University Press, 2004.
Clain, S.H. and Zech, C., ‘Determinants of the allocation of volunteer time: church-related versus non-market activities’, AtlanticEconomicJournal, Vol. 36, Issue 4, 2008, pp. 455–467.
Coneus, K., Goggel, K. and Muhler, G., Determinantsofchildcareparticipation, Discussion Paper No. 07-074, Mannheim, Germany, Centre for European Economic Research, 2007.
Corporation for National and Community Service, Thehealthbenefitsofvolunteering:areviewofrecentresearch, Washington, DC, Corporation for National and Community Service, 2009.
Bibliography
41
Day K.M. and Devlin, R.A., ‘Can volunteer work help explain the male–female earnings gap?’, AppliedEconomics, Vol. 29, Issue 6, 1997, pp. 707–721.
Dekker, P. and Halman, L. (eds.), Thevaluesofvolunteering:cross-culturalperspectives, Dordrecht, Springer, 2003.
Dentinger, E. and Clarkberg, M., ‘Informal caregiving and retirement timing among men and women’, JournalofFamilyIssues, Vol. 23, Issue 7, 2002, pp. 857–879.
Destefanis, S. and Maietta, O.W., ‘The productivity of volunteer labour: DEA-based evidence from Italy, in paid and unpaid labour in the social economy’, in Destefanis, S. and Musella, M. (eds.), Paidandunpaidlabourinthesocialeconomy:aninternationalperspective, AIEL Series in Labour Economics, Heidelberg, Physica-Verlag, 2009, pp. 143–164.
Djupe, P.A. and Grant J.T., ‘Religious institutions and political participation in America’,JournalfortheScientificStudyofReligion, Vol. 40, 2001, pp. 303–314.
Dolan, P., Peasgood, T. and White, M., ‘Do we really know what makes us happy? A review of the economic literature on the factors associated with well-being’, JournalofEconomicPsychology, Vol. 29, 2008, pp. 94–122.
Dolnica, S. and Randle, M., ‘What motivates which volunteers? Psychographic heterogeneity among volunteers in Australia’, Voluntas, Vol. 18, 2007, pp. 135–155.
Doyle, M.E. and Smith, M.K., Bornandbred?Leadership,heartandinformaleducation, London, YMCA George Williams College and The Rank Foundation, 1999.
Driskell, R., Lyon, L. and Embry, E., ‘Civic engagement and religious activities: examining the influence of religious tradition and participation’,SociologicalSpectrum, Vol. 28, 2008a, pp. 578–601.
Driskell, R., Embry E. and Lyon L., ‘Faith and politics: the influence of religious beliefs on political participation’,SocialScienceQuarterly, Vol. 89, 2008b, pp. 294–314.
European Commission, Proposal for councildecisionon theEuropeanyear for volunteering (2011), COM(2009) 254 final, Brussels, European Commission, 2009.
Fischer, L.R. and Schaffer, K.B., Oldervolunteers, Newbury Park, CA, Sage Publications, 1993.
Fursman, L. and Callister, P., Men’sparticipation inunpaidcare–a reviewof the literature,2009, Auckland, Ministry of Women’s Affairs, Department of Labour, Government of New Zealand.
Gagne, M. and Deci, E.L., ‘Self-determination theory and work motivation’, JournalofOrganisationalBehaviour, Vol. 26, 2005, pp. 331–362.
GHK, Volunteering in theEuropeanUnion, Study commissioned by the Education, Audiovisual & Culture Executive Agency (EAC-EA) and the Directorate General for Education and Culture (DG EAC), Brussels, GHK, 2010.
Greene, W., (6th edn.), Econometricanalysis, London, Prentice Hall, 2008.
Gujarati, D., (4th edn.), Basiceconometrics, Boston, MA, McGraw-Hill, 2003.
Hackl, F., Halla, M. and Pruckner, G. J., ‘Volunteering and income – the fallacy of the good Samaritan?’, Kyklos, Vol. 60, Issue 1, 2007, pp. 77–104.
Hadzi-Miceva, K., ‘Comparative analysis of European legal systems and practices regarding volunteering’, TheInternationalJournalofNot-for-ProfitLaw, Vol. 9, Issue 3, 2007, pp. 37–59.
SecondEuropeanQualityofLifeSurvey–Participationinvolunteeringandunpaidwork
42
Halpern, D., Socialcapital, Cambridge, Polity, 2005.
Handy, F. and Srinivasan, N., ‘The demand for volunteer labor: a study of hospital volunteers’, NonprofitandVoluntarySectorQuarterly, Vol. 34, Issue 4, 2005, pp. 491–509.
Hank, K. and Stuck, S., Volunteerwork, informalhelp,and careamong the50+ inEurope: furtherevidencefor‘linked’productiveactivitiesatolderages, Discussion Papers 733, Berlin, German Institute for Economic Research, 2007.
Heath, S., ‘Widening the gap: pre-university gap years and the ‘economy of experience’’, BritishJournalofSociologyofEducation, Vol. 28, Issue 1, 2007, pp. 89–103.
Heckman, J., ‘Sample selection bias as a specification error’, Econometrica, Vol. 47, 1979, pp. 153–161.
Heitmueller, A. and Inglis, K., Carefree?ParticipationandpaydifferentialsforinformalcarersinBritain, IZA Discussion Paper No. 1273, Bonn, Institute for the Study of Labour, 2004, available online at http://ftp.iza.org/dp1273.pdf.
Hodgkinson, V. and Weitzman, M.S., Nonprofitalmanac1996–1997:Dimensionsoftheindependentsector, San Francisco, Jossey-Bass, 1996a.
Hodgkinson, V. and Weitzman, M.S., GivingandvolunteeringintheUnitedStates, Washington, DC, Washington, DC, Independent Sector, 1996b.
Howlett, S., Volunteeringandmentalhealth:a literature review, London, Institute for Volunteering Research, 2004.
Huppert, F.A. and Whittington, J.E., ‘Evidence for the independence of positive and negative well-being: implications for quality of life assessment’, BritishJournalofHealthPsychology, Vol. 8, 2003, pp. 107–122.
Huppert, F.A., Marks, N., Clark, A., Siegrist, J., Stutzer, A., Vittersø, J. and Wahrendorf, M., ‘Measuring well-being across Europe: Description of the ESS well-being module and preliminary findings’, SocialIndicatorsResearch, Vol. 93, Issue 3, 2009, pp. 301–315.
Hustinx, L., ‘Individualism and new styles of youth volunteering: an empirical exploration’, VoluntaryAction, Vol. 3, Issue 2, 2001, pp. 57–76.
Independent Sector, GivingandvolunteeringintheUnitedStates,Washington, DC, Independent Sector, 2001.
Judge, T.A., Thoresen, C.J., Bono, J.E. and Patton, G.K., ‘The job satisfaction–performance relationship: a qualitative and quantitative review’, PsychologicalBulletin, Vol. 127, Issue 3, 2001, pp. 376–407.
Kellstdet, L.A., Green, J.C., Guth, J.L. and Smidt, C.E., ‘Grasping the essentials: the social embodiment of religion and political behaviour’,in Green, J.C., Guth, J.L., Smidt, C.E. and Kellstedt, L.A., Religionandtheculturewars:dispatchesfromthefront, Lanham, MD, Rowman and Littlefield, 1996, pp. 174–192.
Knapp, M., Vasiliki, K. and Davis Smith, J., Whovolunteersandwhy?Thekeyfactorswhichdeterminevolunteering, London, The Volunteering Centre, 1995.
Kotowska, I.E., Matysiak, A., Styrc, M., Pailhé, A., Solaz, A., Vignoli, D., European Foundation for the Improvement of Living and Working Conditions, SecondEuropeanQualityofLifeSurvey:Familylifeandwork, Luxembourg, Publications Office of the European Union, 2010.
Bibliography
43
Lam, P., ‘As the flocks gather: how religion affects voluntary association participation’,JournalfortheScientificStudyofReligion, Vol. 41, 2002, pp. 405–422.
LaPlante, M.P., Harrington, C. and Kang T., ‘Estimating paid and unpaid hours of personal assistance services in activities of daily living provided to adults living at home’, HealthServiceResearch, Vol. 37, Issue 2, 2002, pp. 397–415.
Lázaro, N., Moltó M.L. and Sanchez, R., ‘Paid employment and unpaid caring work in Spain’, AppliedEconomics, Vol. 36, Issue 9, 2004, pp. 977–986.
Lie, M., Baines, S. and Wheelock, J., ‘Citizenship, volunteering and active ageing’,SocialPolicyandAdministration, Vol. 43, No. 7, 2009, pp. 702–718.
Luoh, M.C. and Herzog, A.R., ‘Individual consequences of volunteer and paid work in old age: Health and mortality’, JournalofHealthandSocialBehaviour, Vol. 43, Issue 4, 2002, pp. 490–509.
Mattis, J.S., Beckham, W.P., Saunders, B.A., Williams, J.E., McAllister, D., Myers, V., Knight, D., Rencher, D. and Dixon, C., ‘Who will volunteer? Religiosity, everyday racism, and social participation among African American men’, JournalofAdultDevelopment, Vol. 11, Issue 4, 2004, pp. 261–262.
Meier, S. and Stutzer, A, ‘Is volunteering rewarding in itself?’, Economica, Vol. 75, Issue 297, 2008, pp. 39–59.
Mellor, D., Hayashi, Y., Stokes, M., Firth, L., Lake, L., Staples, M., Chambers, S. and Cummins, R., ‘Volunteering and its relationship with personal and neighborhood well-being’, NonprofitandVoluntarySectorQuarterly, Vol. 38, Issue 1, 2009, pp. 144–159.
Michelutti, M. and Schenkel, M., ‘Working for nothing and being happy: the determinants of the satisfaction of volunteers and paid workers’, in Destefanis, S. and Musella, M. (eds.), Paidandunpaidlabourinthesocialeconomy:aninternationalperspective, AIEL Series in Labour Economics, Heidelberg, Physica-Verlag, 2009, pp. 81–95.
Moerbeek, H., Friendsandfoesintheoccupationalcareer:theinfluenceofsweetandsoursocialcapitalonthelabourmarket, Doctoral dissertation, Nijmegen, Katholieke Universiteit Nijmegen, 2001.
Morrow-Howell, N., Hinterlong, J., Rozario, P.A. and Tang, F., ‘Effects of volunteering on the well-being of older adults’,JournalofGerontology:SocialScience, Volume 58B, Issue 3, 2008, pp. S137–S145.
Musick, M.A. and Wilson, J., ‘Volunteering and depression: the role of psychological and social resources in different ages groups’, SocialScienceandMedicine, Vol. 56, 2003, pp. 259–269.
Musick, M.A., Wilson, J. and Bynum, W.B., Jr. ‘Race and formal volunteering: The differential effects of class and religion’, SocialForces, Vol. 78, Issue 4, 2000, pp. 1539–1570.
Mutchler, J.E., Burr, J.A. and Caro, F.G., ‘From paid worker to volunteer: leaving the paid labour force and volunteering in later life’, SocialForces, Vol. 81, 2003, pp. 1267–1293.
Naurushima, M., ‘Payback time: community volunteering among older adults as a transformative mechanism’, AgeingandSociety, Vol. 25, 2005, pp. 567–584.
Oakley, A., Thesociologyofhousework, London, Martin Robertson, 1974.
OECD (Organisation for Economic Development and Cooperation), Measuringandfosteringtheprogressofsocieties, 2nd World Forum in Istanbul, Turkey, 27–30 June, 2007.
SecondEuropeanQualityofLifeSurvey–Participationinvolunteeringandunpaidwork
44
OECD (Organisation for Economic Development and Cooperation), Timeuseforwork,careandotherday-to-dayactivities, OECD Family Database LMF2.5, OECD Social Policy Division, Directorate of Employment, Labour and Social Affairs, 2009, available online at http://www.oecd.org/dataoecd/1/50/43199641.pdf.
Pahl, R., (ed.), Onwork:historical,comparativeandtheoreticalperspectives, Oxford, Blackwell, 1988.
Park, J.Z. and Smith, C., ‘To whom much has been given...: religious capital and community voluntarism among churchgoing Protestants’,JournalfortheScientificStudyofReligion, Vol. 39, Issue 3, 2000, pp. 272–286.
Peterson, S.A., ‘Church participation and political participation: the spillover effect’,AmericanPoliticsQuarterly, Vol. 20, 1992, pp. 123–139.
Pinquart, M. and Sørensen, S., ‘Influences on loneliness in older adults: a meta-analysis’,BasicandAppliedSocialPsychology, Vol. 23, Issue 4, 2001, pp. 245–266.
Plagnol, A.C. and Huppert, F.A., ‘Happy to help? Exploring the factors associated with variations in rates of volunteering across Europe’, SocialIndicatorsResearch, Vol. 97, 2010, pp. 157–176.
Prouteau, L., and Wolff, F.C., ‘Does volunteer work pay off in the labor market?’, JournalofSocio-Economics, Vol. 35, Issue 6, 2005, pp. 992–1013.
Prouteau L. and Wolff, F.C., ‘On the relational motive for volunteer work’, Journal of EconomicPsychology, Vol. 29, 2008, pp. 314–335.
Ravanera, Z., Beaujot, R. and Liu, J., Determinantsofmodelsofearningandcaring:ananalysisusingthe2005generalsocialsurveyontimeuse, presented at the 2008 European Population Conference Barcelona, 10–12 July, 2008.
Robins, P.K. and Spiegelman, R.G., ‘An econometric model of the demand for child care’, EconomicInquiry, Vol. 16, Issue 1, 2007, pp. 83–94.
Rose, R., European Foundation for the Improvement of Living and Working Conditions, FirstEuropeanQualityofLifeSurvey:participationincivilsociety, Luxembourg, Publications Office of the European Union, 2006.
Rose, R. and Newton, K., European Foundation for the Improvement of Living and Working Conditions, SecondEuropeanQualityofLifeSurvey:evaluatingthequalityofsocietyandpublicservice, Luxembourg, Publications Office of the European Union, 2010.
Ruiter, S., and De Graff, N.D., ‘Socio-economic payoffs of voluntary association involvement: a Dutch life course study’, EuropeanSociologicalReview, Vol. 25, Issue 4, 2009, pp. 425–442.
Scurria, M., ReportontheproposalforaCouncildecisionontheEuropeanYearofVolunteering(2011), COM (2009) 254 final, Brussels, European Parliament, 2009.
SPES (Centro di Servizio per il Voluntariato del Lazio), VolunteeringacrossEurope:organisations,promotion,participation, Rome, SPES, 2008.
Thoits, P.A. and Hewitt, L.N., ‘Volunteer work and well-being’, JournalofHealthandSocialBehavior, Vol. 42, 2001, pp. 115–131.
Verba, S., Schlozman, L., and Brady, H.E., Voiceandequality:civicvolunteerisminAmericanpolitics,Cambridge, MA, Harvard University Press, 1995.
Bibliography
45
Wardell, F., Lishman, J. and Whalley, L., ‘Who volunteers?’ TheBritishJournalofSocialWork, Vol. 30, 2000, pp. 227–248.
Wilcox, C. and Sigelman, L., ‘Political mobilization in the pews: religious contacting and electoral turnout’,SocialScienceQuarterly, Vol. 82, 2001, pp. 524–535.
Wilson, J., ‘Volunteering’,AnnualReviewofSociology, Vol. 26, 2000, pp. 215–240.
Wilson, J. and Musick, M., ‘Who cares? Towards an integrated theory of volunteer work’, AmericanSociologicalReview, Vol. 62, 1997, pp. 694–713.
Wilson, J. and Musick, M., ‘Doing well by doing good: volunteering and occupational achievement among American women’,TheSociologicalQuarterly, Vol. 44, No. 3, 2003, pp. 433–450.
Wuthnow, R., ‘Religion and the voluntary spirit in the United States: Mapping the terrain’, in Wuthnow, R., Hodgkinson, V. and Associates (eds.), FaithandphilanthropyinAmerica:exploringtheroleofreligioninAmerica’svoluntarysector, San Francisco, Jossey-Bass, 1990, pp. 3–21.
Wuthnow, R., ‘The voluntary sector: legacy of the past, hope for the future’, in Wuthnow, R. (ed.),Betweenstatesandmarkets: thevoluntarysectorincomparativeperspective, Princeton, NJ, Princeton University Press, 1991, pp. 3–29.
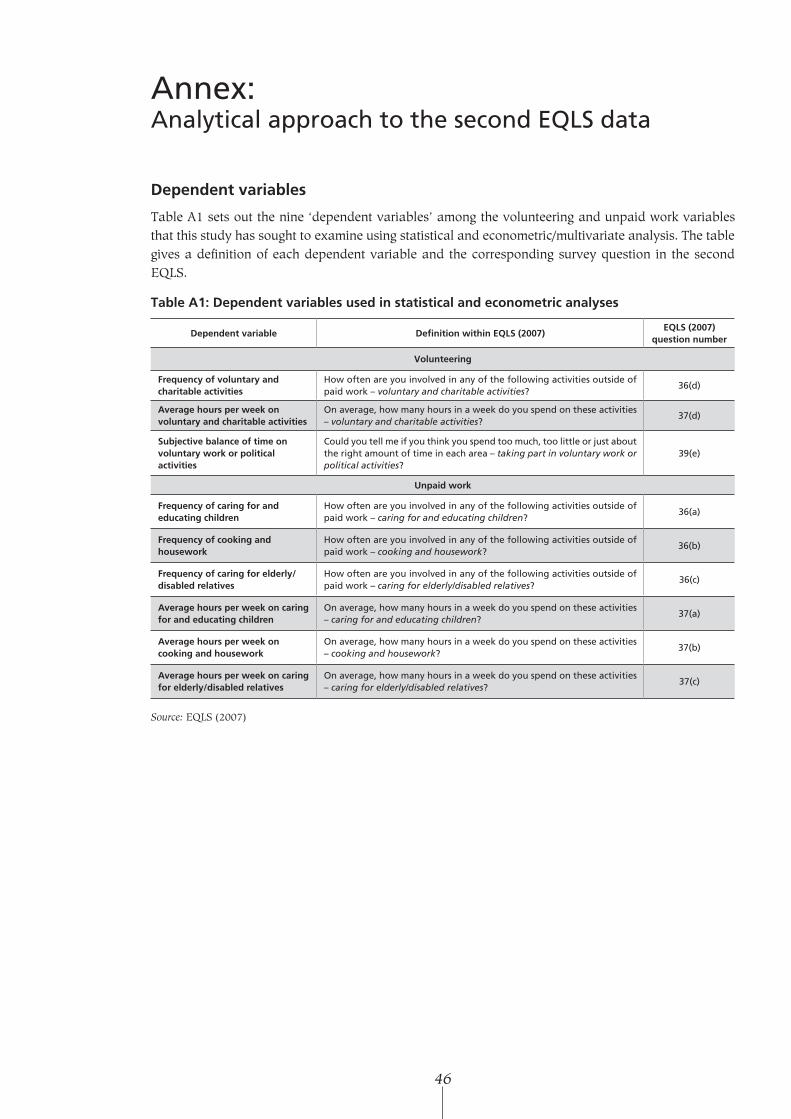
46
Annex: Analytical approach to the second EQLS data
Dependentvariables
Table A1 sets out the nine ‘dependent variables’ among the volunteering and unpaid work variables that this study has sought to examine using statistical and econometric/multivariate analysis. The table gives a definition of each dependent variable and the corresponding survey question in the second EQLS.
TableA1:Dependentvariablesusedinstatisticalandeconometricanalyses
Dependentvariable DefinitionwithinEQLS(2007)EQLS(2007)
questionnumber
Volunteering
Frequencyofvoluntaryandcharitableactivities
How often are you involved in any of the following activities outside of paid work – voluntary and charitable activities?
36(d)
Averagehoursperweekonvoluntaryandcharitableactivities
On average, how many hours in a week do you spend on these activities – voluntary and charitable activities?
37(d)
Subjectivebalanceoftimeonvoluntaryworkorpoliticalactivities
Could you tell me if you think you spend too much, too little or just about the right amount of time in each area – taking part in voluntary work or political activities?
39(e)
Unpaidwork
Frequencyofcaringforandeducatingchildren
How often are you involved in any of the following activities outside of paid work – caring for and educating children?
36(a)
Frequencyofcookingandhousework
How often are you involved in any of the following activities outside of paid work – cooking and housework?
36(b)
Frequencyofcaringforelderly/disabledrelatives
How often are you involved in any of the following activities outside of paid work – caring for elderly/disabled relatives?
36(c)
Averagehoursperweekoncaringforandeducatingchildren
On average, how many hours in a week do you spend on these activities – caring for and educating children?
37(a)
Averagehoursperweekoncookingandhousework
On average, how many hours in a week do you spend on these activities – cooking and housework?
37(b)
Averagehoursperweekoncaringforelderly/disabledrelatives
On average, how many hours in a week do you spend on these activities – caring for elderly/disabled relatives?
37(c)
Source: EQLS (2007)
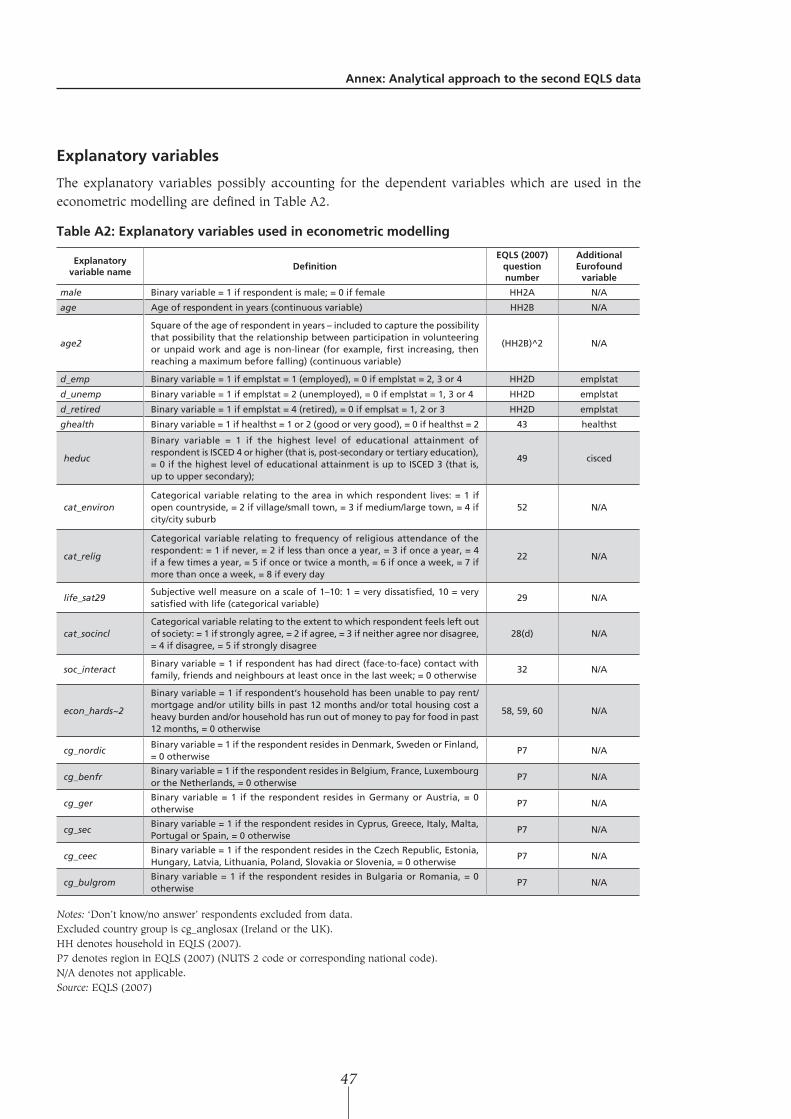
Annex:AnalyticalapproachtothesecondEQLSdata
47
Explanatoryvariables
The explanatory variables possibly accounting for the dependent variables which are used in the econometric modelling are defined in Table A2.
TableA2:Explanatoryvariablesusedineconometricmodelling
Explanatoryvariablename
DefinitionEQLS(2007)questionnumber
AdditionalEurofoundvariable
male Binary variable = 1 if respondent is male; = 0 if female HH2A N/A
age Age of respondent in years (continuous variable) HH2B N/A
age2
Square of the age of respondent in years – included to capture the possibility that possibility that the relationship between participation in volunteering or unpaid work and age is non-linear (for example, first increasing, then reaching a maximum before falling) (continuous variable)
(HH2B)^2 N/A
d_emp Binary variable = 1 if emplstat = 1 (employed), = 0 if emplstat = 2, 3 or 4 HH2D emplstat
d_unemp Binary variable = 1 if emplstat = 2 (unemployed), = 0 if emplstat = 1, 3 or 4 HH2D emplstat
d_retired Binary variable = 1 if emplstat = 4 (retired), = 0 if emplsat = 1, 2 or 3 HH2D emplstat
ghealth Binary variable = 1 if healthst = 1 or 2 (good or very good), = 0 if healthst = 2 43 healthst
heduc
Binary variable = 1 if the highest level of educational attainment of respondent is ISCED 4 or higher (that is, post-secondary or tertiary education), = 0 if the highest level of educational attainment is up to ISCED 3 (that is, up to upper secondary);
49 cisced
cat_environCategorical variable relating to the area in which respondent lives: = 1 if open countryside, = 2 if village/small town, = 3 if medium/large town, = 4 if city/city suburb
52 N/A
cat_relig
Categorical variable relating to frequency of religious attendance of the respondent: = 1 if never, = 2 if less than once a year, = 3 if once a year, = 4 if a few times a year, = 5 if once or twice a month, = 6 if once a week, = 7 if more than once a week, = 8 if every day
22 N/A
life_sat29Subjective well measure on a scale of 1–10: 1 = very dissatisfied, 10 = very satisfied with life (categorical variable)
29 N/A
cat_socinclCategorical variable relating to the extent to which respondent feels left out of society: = 1 if strongly agree, = 2 if agree, = 3 if neither agree nor disagree, = 4 if disagree, = 5 if strongly disagree
28(d) N/A
soc_interactBinary variable = 1 if respondent has had direct (face-to-face) contact with family, friends and neighbours at least once in the last week; = 0 otherwise
32 N/A
econ_hards~2
Binary variable = 1 if respondent’s household has been unable to pay rent/mortgage and/or utility bills in past 12 months and/or total housing cost a heavy burden and/or household has run out of money to pay for food in past 12 months, = 0 otherwise
58, 59, 60 N/A
cg_nordicBinary variable = 1 if the respondent resides in Denmark, Sweden or Finland, = 0 otherwise
P7 N/A
cg_benfrBinary variable = 1 if the respondent resides in Belgium, France, Luxembourg or the Netherlands, = 0 otherwise
P7 N/A
cg_gerBinary variable = 1 if the respondent resides in Germany or Austria, = 0 otherwise
P7 N/A
cg_secBinary variable = 1 if the respondent resides in Cyprus, Greece, Italy, Malta, Portugal or Spain, = 0 otherwise
P7 N/A
cg_ceecBinary variable = 1 if the respondent resides in the Czech Republic, Estonia, Hungary, Latvia, Lithuania, Poland, Slovakia or Slovenia, = 0 otherwise
P7 N/A
cg_bulgromBinary variable = 1 if the respondent resides in Bulgaria or Romania, = 0 otherwise
P7 N/A
Notes: ‘Don’t know/no answer’ respondents excluded from data. Excluded country group is cg_anglosax (Ireland or the UK). HH denotes household in EQLS (2007). P7 denotes region in EQLS (2007) (NUTS 2 code or corresponding national code). N/A denotes not applicable.Source: EQLS (2007)
SecondEuropeanQualityofLifeSurvey–Participationinvolunteeringandunpaidwork
48
Econometricmethods
Various types of econometric/multivariate model (limited dependent variable models and linear regression models) have been applied to explain the dependent variables in conjunction with the explanatory variables (see Chapter 1). Below is a brief outline of the models and their relevance in this study; more detailed accounts are provided, for example, in Gujarati (2003) and Greene (2008).
Limited dependent variable models are suited to situations in which the dependent variable assumes a limited range of values (for example: 0 or 1; or 1, 2, 3, 4 etc.). This is the case with the frequency of participation data in the second EQLS. For example, Question 36 asks ‘How often are you involved in any of the following activities outside of paid work…’ and for each of the four categories of non-paid work activities given, the following frequency options are listed for the respondent: ‘every day’; several times a week’; once or twice a week’; ‘less often than once a week’, ‘never’; and ‘don’t know’. Excluding the latter category, the frequency responses are ordinal and may be ranked in ascending order from ‘never’ to ‘every day’, yielding a positive index of the frequency of participation. This positive index (dependent variable) can be modelled econometrically in either of three ways:
■ using a linear regression model (in which the dependent variable takes the values 1–7);
■ a binary dependent variable model (0 for never and 1 for the other frequencies grouped together), meaning a probit or logit specification;
■ as an ordered probit or ordered logit specification, which exploits the complete ordinal nature of the dependent variable (the dependent variable takes the values 1–7).
Thus, five different econometric specifications can be applied to the frequency of participation in volunteering or unpaid work data in the second EQLS: linear, probit, logit, ordered probit and ordered probit.
The merits of linear specification models are their relative simplicity in estimation and the interpretation of the estimates and the fact that they recognise all individual response possibilities. The merits of the ordered probit and ordered logit specifications is that they recognise the ordinal nature of the dependent variable, while the probit and logit specifications aggregate the ordinal responses into just two values (0 and 1).
On balance, the ordered probit and ordered logit specifications are the most appropriate specifications in the econometric analysis of the frequency of participation in voluntary and charitable activities and in the unpaid work activities. The availability of modern software, such as Stata,6 means that they can be applied with ease. Nevertheless, robust results are likely to arise when all five specifications produce highly statistically significant coefficient estimates (p <0.01) of the same sign.
In the econometric/multivariate analysis of the average hours per week data associated with volunteering and unpaid work, a linear specification can be applied since the dependent variable is more continuous. Another type of model that can be applied is the Heckman two-stage specification (Heckman, 1979). In principle, this is likely to be more appropriate than the linear specification because it accounts for the possibility of sample selection bias in the average-hours-per-week data. In the first stage of the Heckman, a probit specification is applied to account for the decision to participate in volunteering or unpaid work; in the second step, a linear specification of average hours per week is estimated that includes, among the explanatory variables, an additional term controlling for the likelihood of
6 Developed by StataCorp LP (http://www.stata.com/).
Annex:AnalyticalapproachtothesecondEQLSdata
49
participation in the first place (gained from the first stage probit estimation). In the step 1 equation, the frequency of participation in respect of the other three as well as the explanatory variables listed in Table A2 are included for each of voluntary and charitable activities and the three types of unpaid work to ensure that the Heckman procedure is identified.7
The third type of econometric/multivariate model applied in this study considers the subjective balance of time spent on voluntary work or political activities. Here, it is possible to model the dependent variable as a binary (0/1) variable, with ‘1’ capturing respondents who feel that they spend the ‘right’ amount of time and ‘0’ for those reporting that they spend ‘too little’ or ‘too much’ time on this particular activity. This involves application of probit and logit models.
All econometric/multivariate specifications have been applied to the survey weighted as well as the survey unweighted data (the weights were developed by Eurofound and included as part of the raw data provided to the authors).8 Reported presently are summaries of the econometric results in respect of the survey-weighted data (the unweighted data produce similar results and for space reasons it is not necessary to include them here). The requirement to apply the econometric analysis to the survey-weighted data arises from the inclusion of country effects in our multivariate analysis as well as the fact that the descriptive statistical analysis is applied to the survey-weighted data (so as to enable consistency between the statistical and econometric/multivariate analysis). Failure to account for the country weights in the econometric analysis precludes the possibility that some countries are over- or under-represented in the survey outcomes and this in turn risks erroneous inferences being drawn regarding the statistical significance of particular explanatory variables. All of the econometric specifications applied perform well in terms of their explanatory power or goodness of fit.
Religiousparticipation,civilsocietyandpoliticalparticipation
The data used for religious participation relate to Question 22 of the second EQLS, which provides categorical/ordinal data regarding the frequency with which people attend religious services excluding weddings, funerals and other important religious events (such as baptisms, Christmas/Easter or other specific holy days).
For civil society and political participation, the data in second EQLS from two questions were used:
■ Question 20, which asks people about political involvement over the past year;
■ Question 21, which asks people whether they voted in the last national (general) election in their country.
7 Including more explanatory variables in the first stage of the Heckman procedure serves to reduce the risk of omitted (explanatory) variable bias.
8 The ‘don’t know’ responses in the second EQLS are excluded in the statistical and econometric analyses.
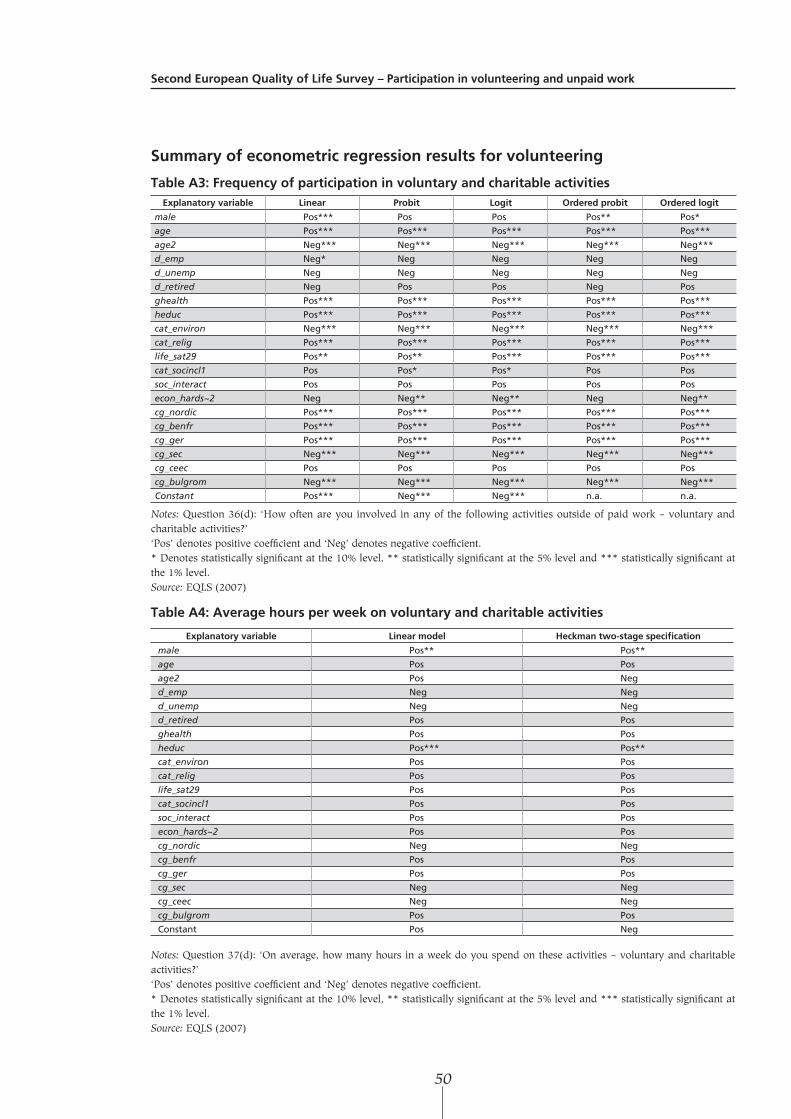
SecondEuropeanQualityofLifeSurvey–Participationinvolunteeringandunpaidwork
50
Summaryofeconometricregressionresultsforvolunteering
TableA3:FrequencyofparticipationinvoluntaryandcharitableactivitiesExplanatoryvariable Linear Probit Logit Orderedprobit Orderedlogit
male Pos*** Pos Pos Pos** Pos*
age Pos*** Pos*** Pos*** Pos*** Pos***
age2 Neg*** Neg*** Neg*** Neg*** Neg***
d_emp Neg* Neg Neg Neg Neg
d_unemp Neg Neg Neg Neg Neg
d_retired Neg Pos Pos Neg Pos
ghealth Pos*** Pos*** Pos*** Pos*** Pos***
heduc Pos*** Pos*** Pos*** Pos*** Pos***
cat_environ Neg*** Neg*** Neg*** Neg*** Neg***
cat_relig Pos*** Pos*** Pos*** Pos*** Pos***
life_sat29 Pos** Pos** Pos*** Pos*** Pos***
cat_socincl1 Pos Pos* Pos* Pos Pos
soc_interact Pos Pos Pos Pos Pos
econ_hards~2 Neg Neg** Neg** Neg Neg**
cg_nordic Pos*** Pos*** Pos*** Pos*** Pos***
cg_benfr Pos*** Pos*** Pos*** Pos*** Pos***
cg_ger Pos*** Pos*** Pos*** Pos*** Pos***
cg_sec Neg*** Neg*** Neg*** Neg*** Neg***
cg_ceec Pos Pos Pos Pos Pos
cg_bulgrom Neg*** Neg*** Neg*** Neg*** Neg***
Constant Pos*** Neg*** Neg*** n.a. n.a.
Notes: Question 36(d): ‘How often are you involved in any of the following activities outside of paid work – voluntary and charitable activities?’‘Pos’ denotes positive coefficient and ‘Neg’ denotes negative coefficient. * Denotes statistically significant at the 10% level, ** statistically significant at the 5% level and *** statistically significant at the 1% level.Source: EQLS (2007)
TableA4:Averagehoursperweekonvoluntaryandcharitableactivities
Explanatoryvariable Linearmodel Heckmantwo-stagespecification
male Pos** Pos**
age Pos Pos
age2 Pos Neg
d_emp Neg Neg
d_unemp Neg Neg
d_retired Pos Pos
ghealth Pos Pos
heduc Pos*** Pos**
cat_environ Pos Pos
cat_relig Pos Pos
life_sat29 Pos Pos
cat_socincl1 Pos Pos
soc_interact Pos Pos
econ_hards~2 Pos Pos
cg_nordic Neg Neg
cg_benfr Pos Pos
cg_ger Pos Pos
cg_sec Neg Neg
cg_ceec Neg Neg
cg_bulgrom Pos Pos
Constant Pos Neg
Notes: Question 37(d): ‘On average, how many hours in a week do you spend on these activities – voluntary and charitable activities?’‘Pos’ denotes positive coefficient and ‘Neg’ denotes negative coefficient. * Denotes statistically significant at the 10% level, ** statistically significant at the 5% level and *** statistically significant at the 1% level.Source: EQLS (2007)
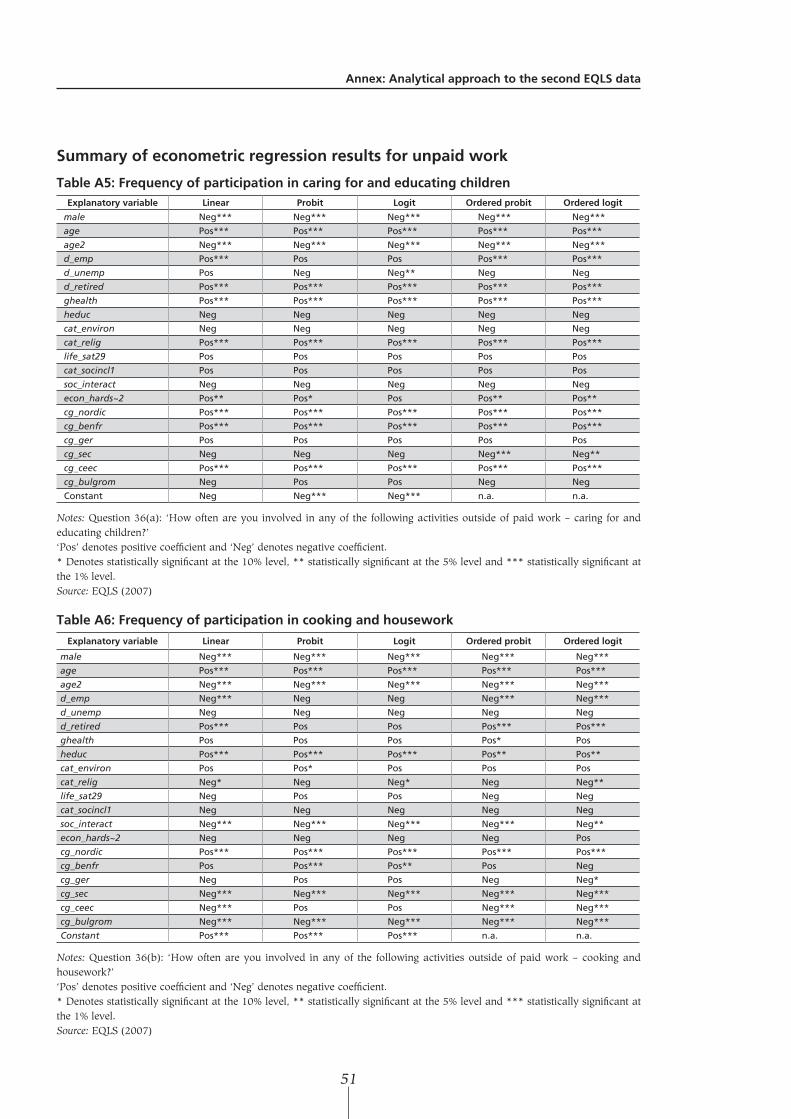
Annex:AnalyticalapproachtothesecondEQLSdata
51
Summaryofeconometricregressionresultsforunpaidwork
TableA5:FrequencyofparticipationincaringforandeducatingchildrenExplanatoryvariable Linear Probit Logit Orderedprobit Orderedlogit
male Neg*** Neg*** Neg*** Neg*** Neg***
age Pos*** Pos*** Pos*** Pos*** Pos***
age2 Neg*** Neg*** Neg*** Neg*** Neg***
d_emp Pos*** Pos Pos Pos*** Pos***
d_unemp Pos Neg Neg** Neg Neg
d_retired Pos*** Pos*** Pos*** Pos*** Pos***
ghealth Pos*** Pos*** Pos*** Pos*** Pos***
heduc Neg Neg Neg Neg Neg
cat_environ Neg Neg Neg Neg Neg
cat_relig Pos*** Pos*** Pos*** Pos*** Pos***
life_sat29 Pos Pos Pos Pos Pos
cat_socincl1 Pos Pos Pos Pos Pos
soc_interact Neg Neg Neg Neg Neg
econ_hards~2 Pos** Pos* Pos Pos** Pos**
cg_nordic Pos*** Pos*** Pos*** Pos*** Pos***
cg_benfr Pos*** Pos*** Pos*** Pos*** Pos***
cg_ger Pos Pos Pos Pos Pos
cg_sec Neg Neg Neg Neg*** Neg**
cg_ceec Pos*** Pos*** Pos*** Pos*** Pos***
cg_bulgrom Neg Pos Pos Neg Neg
Constant Neg Neg*** Neg*** n.a. n.a.
Notes: Question 36(a): ‘How often are you involved in any of the following activities outside of paid work – caring for and educating children?’‘Pos’ denotes positive coefficient and ‘Neg’ denotes negative coefficient. * Denotes statistically significant at the 10% level, ** statistically significant at the 5% level and *** statistically significant at the 1% level.Source: EQLS (2007)
TableA6:Frequencyofparticipationincookingandhousework
Explanatoryvariable Linear Probit Logit Orderedprobit Orderedlogit
male Neg*** Neg*** Neg*** Neg*** Neg***
age Pos*** Pos*** Pos*** Pos*** Pos***
age2 Neg*** Neg*** Neg*** Neg*** Neg***
d_emp Neg*** Neg Neg Neg*** Neg***
d_unemp Neg Neg Neg Neg Neg
d_retired Pos*** Pos Pos Pos*** Pos***
ghealth Pos Pos Pos Pos* Pos
heduc Pos*** Pos*** Pos*** Pos** Pos**
cat_environ Pos Pos* Pos Pos Pos
cat_relig Neg* Neg Neg* Neg Neg**
life_sat29 Neg Pos Pos Neg Neg
cat_socincl1 Neg Neg Neg Neg Neg
soc_interact Neg*** Neg*** Neg*** Neg*** Neg**
econ_hards~2 Neg Neg Neg Neg Pos
cg_nordic Pos*** Pos*** Pos*** Pos*** Pos***
cg_benfr Pos Pos*** Pos** Pos Neg
cg_ger Neg Pos Pos Neg Neg*
cg_sec Neg*** Neg*** Neg*** Neg*** Neg***
cg_ceec Neg*** Pos Pos Neg*** Neg***
cg_bulgrom Neg*** Neg*** Neg*** Neg*** Neg***
Constant Pos*** Pos*** Pos*** n.a. n.a.
Notes: Question 36(b): ‘How often are you involved in any of the following activities outside of paid work – cooking and housework?’‘Pos’ denotes positive coefficient and ‘Neg’ denotes negative coefficient. * Denotes statistically significant at the 10% level, ** statistically significant at the 5% level and *** statistically significant at the 1% level.Source: EQLS (2007)
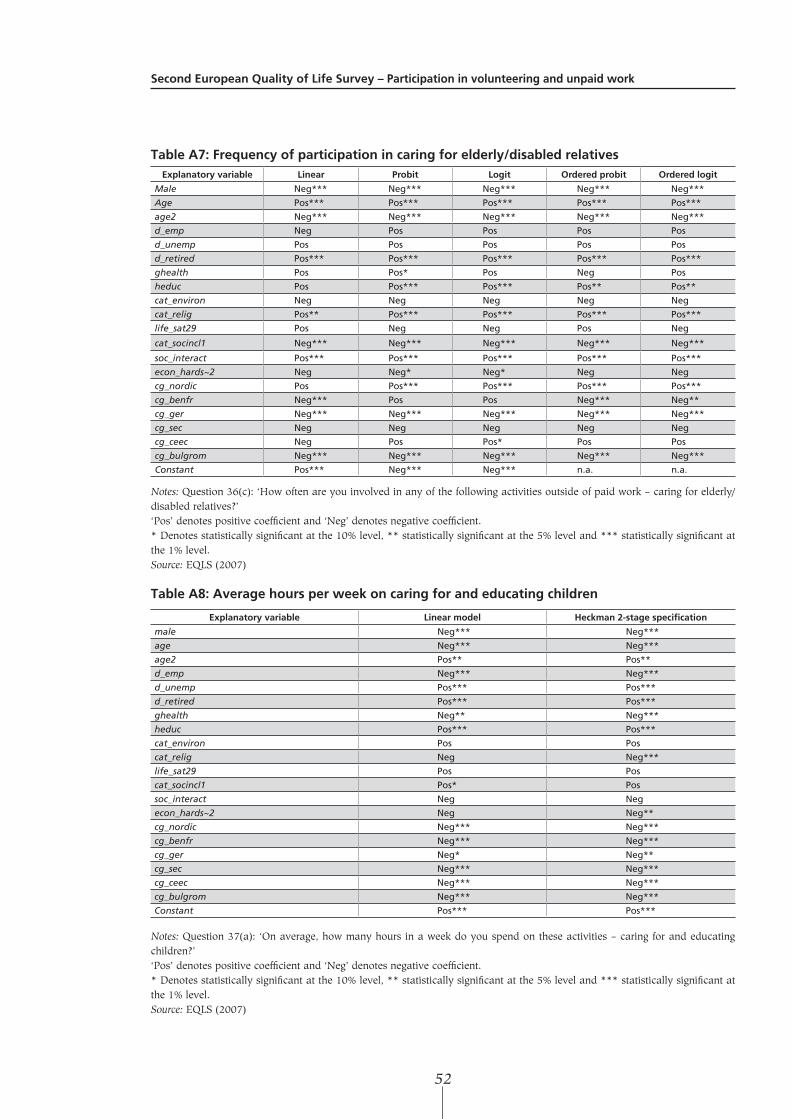
SecondEuropeanQualityofLifeSurvey–Participationinvolunteeringandunpaidwork
52
TableA7:Frequencyofparticipationincaringforelderly/disabledrelativesExplanatoryvariable Linear Probit Logit Orderedprobit Orderedlogit
Male Neg*** Neg*** Neg*** Neg*** Neg***
Age Pos*** Pos*** Pos*** Pos*** Pos***
age2 Neg*** Neg*** Neg*** Neg*** Neg***
d_emp Neg Pos Pos Pos Pos
d_unemp Pos Pos Pos Pos Pos
d_retired Pos*** Pos*** Pos*** Pos*** Pos***
ghealth Pos Pos* Pos Neg Pos
heduc Pos Pos*** Pos*** Pos** Pos**
cat_environ Neg Neg Neg Neg Neg
cat_relig Pos** Pos*** Pos*** Pos*** Pos***
life_sat29 Pos Neg Neg Pos Neg
cat_socincl1 Neg*** Neg*** Neg*** Neg*** Neg***
soc_interact Pos*** Pos*** Pos*** Pos*** Pos***
econ_hards~2 Neg Neg* Neg* Neg Neg
cg_nordic Pos Pos*** Pos*** Pos*** Pos***
cg_benfr Neg*** Pos Pos Neg*** Neg**
cg_ger Neg*** Neg*** Neg*** Neg*** Neg***
cg_sec Neg Neg Neg Neg Neg
cg_ceec Neg Pos Pos* Pos Pos
cg_bulgrom Neg*** Neg*** Neg*** Neg*** Neg***
Constant Pos*** Neg*** Neg*** n.a. n.a.
Notes: Question 36(c): ‘How often are you involved in any of the following activities outside of paid work – caring for elderly/disabled relatives?’‘Pos’ denotes positive coefficient and ‘Neg’ denotes negative coefficient. * Denotes statistically significant at the 10% level, ** statistically significant at the 5% level and *** statistically significant at the 1% level.Source: EQLS (2007)
TableA8:Averagehoursperweekoncaringforandeducatingchildren
Explanatoryvariable Linearmodel Heckman2-stagespecification
male Neg*** Neg***
age Neg*** Neg***
age2 Pos** Pos**
d_emp Neg*** Neg***
d_unemp Pos*** Pos***
d_retired Pos*** Pos***
ghealth Neg** Neg***
heduc Pos*** Pos***
cat_environ Pos Pos
cat_relig Neg Neg***
life_sat29 Pos Pos
cat_socincl1 Pos* Pos
soc_interact Neg Neg
econ_hards~2 Neg Neg**
cg_nordic Neg*** Neg***
cg_benfr Neg*** Neg***
cg_ger Neg* Neg**
cg_sec Neg*** Neg***
cg_ceec Neg*** Neg***
cg_bulgrom Neg*** Neg***
Constant Pos*** Pos***
Notes: Question 37(a): ‘On average, how many hours in a week do you spend on these activities – caring for and educating children?’‘Pos’ denotes positive coefficient and ‘Neg’ denotes negative coefficient. * Denotes statistically significant at the 10% level, ** statistically significant at the 5% level and *** statistically significant at the 1% level.Source: EQLS (2007)
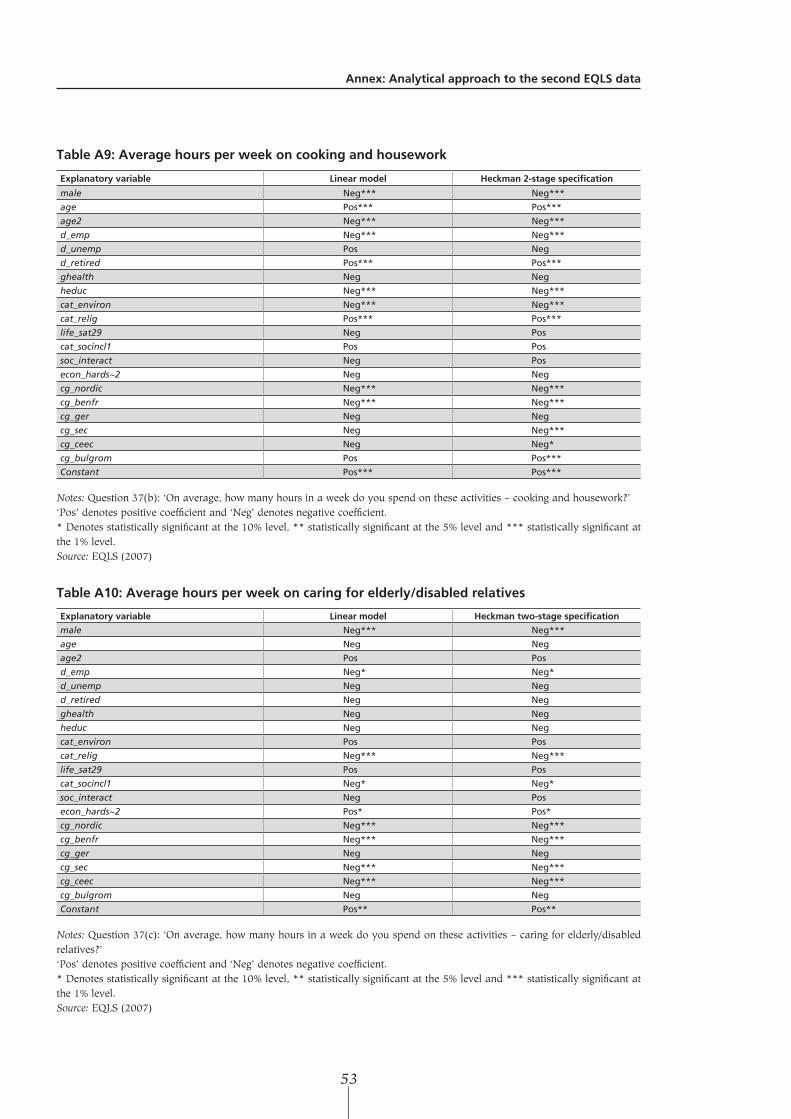
Annex:AnalyticalapproachtothesecondEQLSdata
53
TableA9:Averagehoursperweekoncookingandhousework
Explanatoryvariable Linearmodel Heckman2-stagespecification
male Neg*** Neg***
age Pos*** Pos***
age2 Neg*** Neg***
d_emp Neg*** Neg***
d_unemp Pos Neg
d_retired Pos*** Pos***
ghealth Neg Neg
heduc Neg*** Neg***
cat_environ Neg*** Neg***
cat_relig Pos*** Pos***
life_sat29 Neg Pos
cat_socincl1 Pos Pos
soc_interact Neg Pos
econ_hards~2 Neg Neg
cg_nordic Neg*** Neg***
cg_benfr Neg*** Neg***
cg_ger Neg Neg
cg_sec Neg Neg***
cg_ceec Neg Neg*
cg_bulgrom Pos Pos***
Constant Pos*** Pos***
Notes: Question 37(b): ‘On average, how many hours in a week do you spend on these activities – cooking and housework?’‘Pos’ denotes positive coefficient and ‘Neg’ denotes negative coefficient. * Denotes statistically significant at the 10% level, ** statistically significant at the 5% level and *** statistically significant at the 1% level.Source: EQLS (2007)
TableA10:Averagehoursperweekoncaringforelderly/disabledrelatives
Explanatoryvariable Linearmodel Heckmantwo-stagespecification
male Neg*** Neg***
age Neg Neg
age2 Pos Pos
d_emp Neg* Neg*
d_unemp Neg Neg
d_retired Neg Neg
ghealth Neg Neg
heduc Neg Neg
cat_environ Pos Pos
cat_relig Neg*** Neg***
life_sat29 Pos Pos
cat_socincl1 Neg* Neg*
soc_interact Neg Pos
econ_hards~2 Pos* Pos*
cg_nordic Neg*** Neg***
cg_benfr Neg*** Neg***
cg_ger Neg Neg
cg_sec Neg*** Neg***
cg_ceec Neg*** Neg***
cg_bulgrom Neg Neg
Constant Pos** Pos**
Notes: Question 37(c): ‘On average, how many hours in a week do you spend on these activities – caring for elderly/disabled relatives?’‘Pos’ denotes positive coefficient and ‘Neg’ denotes negative coefficient. * Denotes statistically significant at the 10% level, ** statistically significant at the 5% level and *** statistically significant at the 1% level.Source: EQLS (2007)
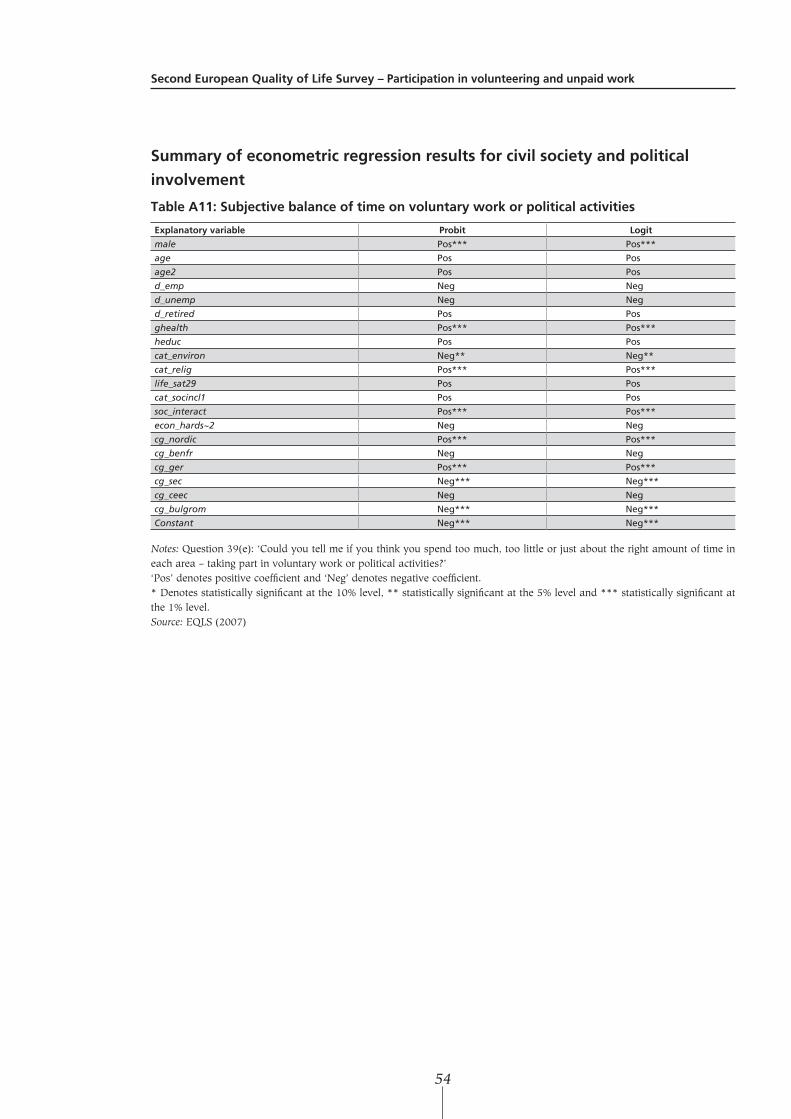
SecondEuropeanQualityofLifeSurvey–Participationinvolunteeringandunpaidwork
54
Summaryofeconometricregressionresultsforcivilsocietyandpolitical
involvement
TableA11:Subjectivebalanceoftimeonvoluntaryworkorpoliticalactivities
Explanatoryvariable Probit Logit
male Pos*** Pos***
age Pos Pos
age2 Pos Pos
d_emp Neg Neg
d_unemp Neg Neg
d_retired Pos Pos
ghealth Pos*** Pos***
heduc Pos Pos
cat_environ Neg** Neg**
cat_relig Pos*** Pos***
life_sat29 Pos Pos
cat_socincl1 Pos Pos
soc_interact Pos*** Pos***
econ_hards~2 Neg Neg
cg_nordic Pos*** Pos***
cg_benfr Neg Neg
cg_ger Pos*** Pos***
cg_sec Neg*** Neg***
cg_ceec Neg Neg
cg_bulgrom Neg*** Neg***
Constant Neg*** Neg***
Notes: Question 39(e): ‘Could you tell me if you think you spend too much, too little or just about the right amount of time in each area – taking part in voluntary work or political activities?’‘Pos’ denotes positive coefficient and ‘Neg’ denotes negative coefficient. * Denotes statistically significant at the 10% level, ** statistically significant at the 5% level and *** statistically significant at the 1% level.Source: EQLS (2007)

European Foundation for the Improvement of Living and Working Conditions
Second European Quality of Life Survey: Participation in volunteering and unpaid work
Luxembourg: Publications Office of the European Union
2011 – VIII, 56 p. – 21 x 29.7 cm
doi: 10.2806/1399 ISBN 978-92-897-1007-7


EF/11/02/EN
SALES AND SUBSCRIPTIONS
Publications for sale produced by the Publications Office of the European Union are available from our sales agents throughout the world.
How do I set about obtaining a publication?
Once you have obtained the list of sales agents, contact the sales agent of your choice and place your order.
How do I obtain the list of sales agents?
• Go to the Publications Office website: http://www.publications.europa.eu/
• Or apply for a paper copy by fax (352) 2929 42758
ISBN 978-92-897-1007-7
9 7 8 9 2 89 7 1 0 07 7
Second European Quality of Life Survey
The European Foundation for the Improvement of Living and Working Conditions (Eurofound) is a tripartite EU body, whose role is to provide key actors in social policymaking with findings, knowledge and advice drawn from comparative research. The Foundation was established in 1975 by Council Regulation EEC No 1365/75 of 26 May 1975.
Participation in volunteering and unpaid work
4 5 TJ-79-11-104-EN-C
doi: 10.2806/1399
Just over 20% of Europeans take part in voluntary and charitable activities,
though there are wide differences between Member States with the participation
rate in the EU15 exceeding that in the New Member States. The highest rates are
seen in the Nordic Member States (Denmark, Finland, Sweden) and the lowest
rates are in Bulgaria, Greece, Malta, Portugal, Romania and Spain. People with
a high level of educational attainment are more likely to be volunteers, as are
those who attend religious services regularly. Based on data from the second
European Quality of Life Survey (EQLS), conducted by Eurofound in 2007,
this report examines the factors underpinning people’s decision to volunteer,
the amount of time devoted to volunteering among those who participate and
whether participation is associated with greater life satisfaction. The study also
looks at unpaid work (which includes caring and housework), the amount of
time spent on it and the characteristics of those who do it frequently.