Embed Size (px)
Citation preview
Please cite at Haklay, M., and Francis, L., 2018. Participatory GIS and community-based citizen science for
environmental justice action, in Chakraborty, J., Walker, G. and Holifield, R.(eds.), The Routledge Handbook of Environmental Justice. Abingdon: Routledge, pp. 297-308
1
Participatory GIS and community-based citizen science for environmental justice action
INTRODUCTION
When facing local environmental issues, maps are a very effective tool. They can help in collecting facts about an area, bring issues to the table, allow for comparison between areas, act as a tool of communication with local decision makers, and identify key issues for action. While the maps on their own do not alter the power relationships within which communities live their lives, many studies and examples have shown the purposeful role of mapping as part of community mobilisation and action (e.g. Chambers 2006; Sieber 2006). The use of maps and geographical information to address community concerns is integrating different areas, including participatory mapping (Chambers 2006), participatory geographic information systems (PGIS) or Public Participation GIS (PPGIS) (Sieber 2006), and the emerging area of citizen science (Haklay 2013).
The aim of this chapter is to provide an overview of the way in which these areas contributed to local community environmental action with a particular focus on the role of participatory mapping and citizen science. The proliferation of accessible techniques for community-based environmental monitoring, combined with practices that emerged from the environmental justice movement, provides the basis for new applications of mapping and sensing that are now within reach of individuals and communities.
The rest of the chapter is structured as follows. The next section provides a brief introduction to geographical and localised elements of environmental justice, PGIS and citizen science. Following this, a detailed discussion of a methodology that has been developed and deployed by us for the past decade is provided. The methodology is illustrated in a case study of community-led noise monitoring at the Pepys Estate in Deptford, London. Following the case study, we conclude with observations on the integration of citizen science, participatory mapping and environmental justice.
ENVIRONMENTAL JUSTICE, PARTICIPATORY GEOGRAPHIC INFORMATION SYSTEMS AND CITIZEN SCIENCE
As noted in other chapters in this volume, the history of environmental justice goes back to the 1980s with a clear focus in the USA on health concerns due to the location of waste and toxic facilities (Walker 2012). Over the years, the scope of what is included in environmental justice, as well as the scale of the interactions, has grown dramatically. While concepts of justice in liberal philosophy have a long history in Western thought (Sandel 2009), the manner in which justice is understood within environmental justice discourse is more complex in ways that challenge simple definitions (Whyte, this volume). As Schlosberg (2007) demonstrates, in environmental justice there is a direct link between aspects of distribution, participation and recognition. Distribution deals with access to resources and has been central to the political theory of justice – for example, is it just to provide the potential to access resources or is it vital to ensure that every individual is capable of access? In addition, within the environmental justice discourse, there is a need to understand that recognition of communities and individuals by wider society and accepting their right to have a say in decisions that influence them are also important. The definition of access to environmental benefits and the impact of burdens is not a simple one, and while some burdens have a proven link
2
to health and wellbeing (e.g. noise), others are culturally and contextually based. As a result, the list of social dimensions that are included in environmental justice discourse includes aspects such as ethnicity, gender, class and inter-generational distribution, while the environmental topics that are covered range from air pollution and urban dereliction to outdoor recreation, mineral extraction and the wider impact of deforestation and climate change (Walker 2012). Yet, while environmental justice discourse went through an expansive process of themes and issues, many of its everyday manifestations are locally based and experienced in the interaction of communities and the local geographic context in which they live.
Throughout the development of environmental justice discourse, mapping has played an important part in understanding and demonstrating the patterns of exposure and benefits, and the use of Geographic Information Systems (GIS) for the analysis of environmental inequalities is common (Mitchell & Walker 2007, Mennis 2011). Some of this analysis has been carried out without the direct involvement of the communities that are affected by the analysis (e.g. Mitchell 2005), but of particular interest here is the use of mapping techniques within participatory settings, as these are the situations in which community mobilisation around the process of mapping and gathering evidence about local environmental conditions occurs. The linkage between participatory processes, applications of GIS and environmental justice is in the area of participatory GIS.
While building on existing practices in participatory planning, participatory GIS is different as a result of the use of information and communication technologies and their influence on the process (Chambers 2006). Participatory GIS emerged in the mid-1990s, out of concerns of the societal impact of increasing use of GIS by local and central government and large corporations, with an increased exchange of digital maps within planning and management processes. While the move to GIS streamlined and accelerated decision making processes, it marginalised communities and individuals who did not have access to the systems or to the information that they contain. Participatory applications of GIS try to rectify this problem by providing access to information and technology so those affected by the authorities use of GIS can benefit from more equitable access to it. The literature in this area uses two related terms: Participatory GIS (PGIS) and Public Participation GIS (PPGIS). These two related areas of practice and research are similar in their methods and overall aims, although with a stronger emphasis on applications in the global South within the PGIS literature, while the PPGIS is linked to urban planning practice in the global North (Verplanke et al. 2016; Sieber 2006). In both, there is an explicit attempt to use digital mapping technologies to give voice, amplify, and represent local needs – especially of marginalised groups. Both areas echo concerns related to environmental justice, with Harris et al. (1995) explicitly calling for applications that are ‘broad-based, inclusive, gender-sensitive, and biased towards marginalised people’ (p. 218). While Sieber (2006) as well as Verplanke et al. (2106) provides a comprehensive review of the PGIS/PPGIS field, in the area of environmental management, Participatory GIS has an additional legitimacy due to the development of Principle 10 of the Rio Declaration (Haklay 2002). Principle 10 emphasised public access to environmental information, participation in decision making and access to justice in environmental matters. The three pillars of Principle 10 were later enshrined into legislation through the Aarhus convention (UNECE 1998), and the movement to provide open data by governments across the world facilitated the potential of using PGIS in cases of environmental justice further, as access to basic environmental information that can be manipulated and visualised is critical to the creation of GIS-based representations.
In addition to official environmental information that can be provided through mechanisms such as open data and Aarhus mechanisms, a new source of data has emerged since the late 1990s. This, in part, has been possible with the proliferation of equipment for sensing the environment as it became
3
part of routine, large-scale monitoring programmes at local and national levels and also became within reach of non-governmental organisations and community groups. An example of this is the Global Community Monitor – an organisation that, since 1998, has developed a method to allow communities to monitor air quality near polluting factories (Scott & Barnett 2009). The sampling is done by members of the affected community using widely available plastic buckets and bags followed by analysis in an air quality laboratory. Finally, the community is provided with guidance on how to understand the results. This activity is termed ‘Bucket Brigade’ and is used across the world in environmental justice campaigns, for example in the struggle of local African-American residents in Diamond, Louisiana against a polluting Shell Chemical plant (Ottinger 2010).
This type of data collection, carried out outside professional settings (be it university or environmental authority), is now recognised as citizen science (Silvertown 2009), which is defined as: ‘the scientific activities in which non-professional scientists volunteer to participate in data collection, analysis and dissemination of a scientific project’ (Haklay, 2013: 106). Importantly, citizen science also contains within it the notion that science need to work together with communities and individuals, in ways that appreciate local knowledge and practices (Irwin 1995). Stilgoe (2009: 11) articulated the obligation on scientists in stating that ‘All scientists are citizens, but not all scientists are Citizen Scientists. Citizen Scientists are the people who intertwine their work and their citizenship, doing science differently, working with different people, drawing new connections and helping to redefine what it means to be a scientist.’ Citizen science contributes to the wider pool of environmental information by creating local information that represents the issues that the local community is concerned about, as well as up-to-date information that is, at times, difficult or challenging for the authorities to collect.
METHODOLOGY FOR PARTICIPATORY MAPPING AND CITIZEN SCIENCE
As noted above, environmental justice is context dependent and, as it is framed within specific social and political understandings of place, it is important to first understand the local conditions before turning to the description of the methodologies and approaches that we have used in our studies. In the rest of this chapter, we focus on a detailed explanation of a methodology that we have developed originally in London, and later on tested in other locations across the UK, Poland, Italy and Finland. Yet, it is important to explain and contextualise the approach within the local conditions. In the UK, environmental justice discourse has been ‘imported’ by academics and governmental bodies, who sometimes prefer to use the term environmental inequalities (Agyeman & Evans 2004). A significant proportion of UK work has been characterised by a top-down approach, in which researchers use geographical datasets and information to analyse a locale’s environmental conditions, then either act with the local community to change the situation or publish the results together with NGOs to advocate policy changes (e.g. Mitchell 2005). This approach to environmental justice evaluation can be attributed, at least partially, to the richness of the national data available in the UK, including the highly detailed digital maps from the Ordnance Survey that lend themselves easily to large-scale analysis. Importantly, until the last decade and the growth in open data, most of the official mapping data were out of reach for community organisations because of the costs associated with purchasing the data, as well as the technical skills required to analyse it effectively. In addition, as environmental decision making is characterised by strong scientific framing of problems and solutions (Haklay 2009), any community that intend to use environmental justice arguments is required to collect evidence to support its claims. Thus, there is a need for evidence gathering, which can be facilitated through participatory mapping and citizen science.
4
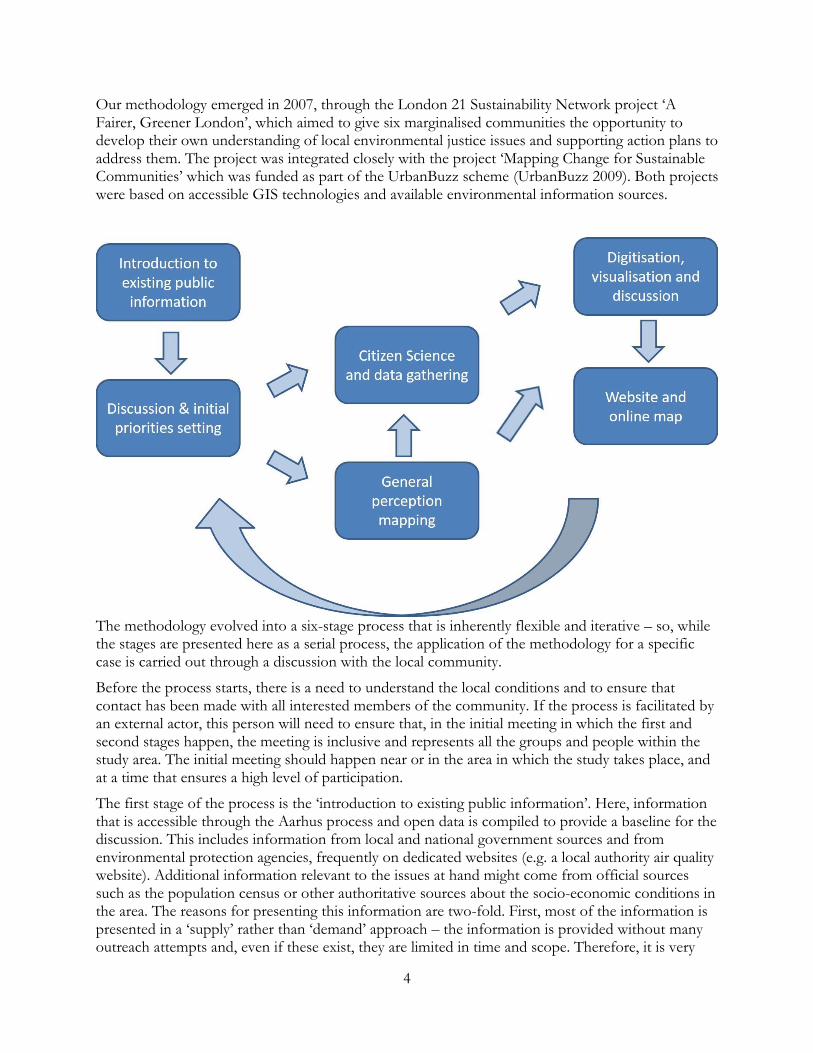
Our methodology emerged in 2007, through the London 21 Sustainability Network project ‘A Fairer, Greener London’, which aimed to give six marginalised communities the opportunity to develop their own understanding of local environmental justice issues and supporting action plans to address them. The project was integrated closely with the project ‘Mapping Change for Sustainable Communities’ which was funded as part of the UrbanBuzz scheme (UrbanBuzz 2009). Both projects were based on accessible GIS technologies and available environmental information sources.
The methodology evolved into a six-stage process that is inherently flexible and iterative – so, while the stages are presented here as a serial process, the application of the methodology for a specific case is carried out through a discussion with the local community.
Before the process starts, there is a need to understand the local conditions and to ensure that contact has been made with all interested members of the community. If the process is facilitated by an external actor, this person will need to ensure that, in the initial meeting in which the first and second stages happen, the meeting is inclusive and represents all the groups and people within the study area. The initial meeting should happen near or in the area in which the study takes place, and at a time that ensures a high level of participation.
The first stage of the process is the ‘introduction to existing public information’. Here, information that is accessible through the Aarhus process and open data is compiled to provide a baseline for the discussion. This includes information from local and national government sources and from environmental protection agencies, frequently on dedicated websites (e.g. a local authority air quality website). Additional information relevant to the issues at hand might come from official sources such as the population census or other authoritative sources about the socio-economic conditions in the area. The reasons for presenting this information are two-fold. First, most of the information is presented in a ‘supply’ rather than ‘demand’ approach – the information is provided without many outreach attempts and, even if these exist, they are limited in time and scope. Therefore, it is very
5
likely that the participants in the meeting will not be familiar with it – as a succinct response from a participant in one of our early workshops demonstrates: ‘this is not community information, expressed in community language that we can understand.’ Second, the information used at the beginning of the meeting frames the environmental issues that will be explored, while allowing for flexibility and openness in deciding the exact direction that will be followed by community members. All too often, researchers can have a preconceived idea about the problem that the community faces, and therefore introduce the project as a ‘fait accompli’ before any detailed discussion about what issue should be addressed. By presenting a portfolio of information and issues, the discussion starts with an emphasis on community control over the process.
The second stage, ‘discussion and initial priorities setting’, is a facilitated discussion around large-scale maps of the local area is carried out (Figure 2). The discussion is aimed at identifying issues that the specific project will focus on. An exercise such as ‘identify places on the map that you like and dislike’ can assist in ensuring that all the participants can use maps effectively. Although digital maps can be used for this purpose, the advantage of the paper map is to ensure that participants who are unfamiliar with technology can contribute to the discussion, without the need to dedicate time for training. The result of the discussion is an agreement on what should be recorded and how. Here, there is a choice between two possible stages (perception mapping or citizen science) or a combination of both.
The discussion needs to establish how the problem that was identified by the community will be addressed through data collection. This can be by establishing the concrete situation on the ground or gathering evidence that can be used in discussions with decision makers and public bodies. What is then required, as in any typical scientific process, is to decide what information will be collected, the data collection protocol, the process of collating the information and, importantly, what analysis or presentation will be needed with the data. Of course, decisions on analysis and visualisation for the purpose of communication are taken in stages five and six, but preliminary ideas are useful at this stage, to help consider whether the process will yield the required information. It is also worth carefully considering the protocol for data collection – the instruments that will be used, the information that will be captured, and the level of skills and training that the participants need to carry out the work. The protocol requires special attention – here there is a need to balance robust, systematic and consistent data gathering that will be effective and won’t be dismissed as ‘anecdotal’, while at the same time taking into account the practices, skills, resources and time availability of those that are involved in the process. For example, assumptions about the availability of smartphones with certain types of sensors might not stand up in a marginalised community, or when working with people of certain age groups. The same is true for expecting people to carry out activities around the common working day when some participants might be shift workers or in other employment with less-structured working days. Use of similar instruments and methods to those used by the authorities has the advantage of making the information easier for communication with them, although that might add burden on the community in terms of learning the appropriate data collection and interpretation methods.
6
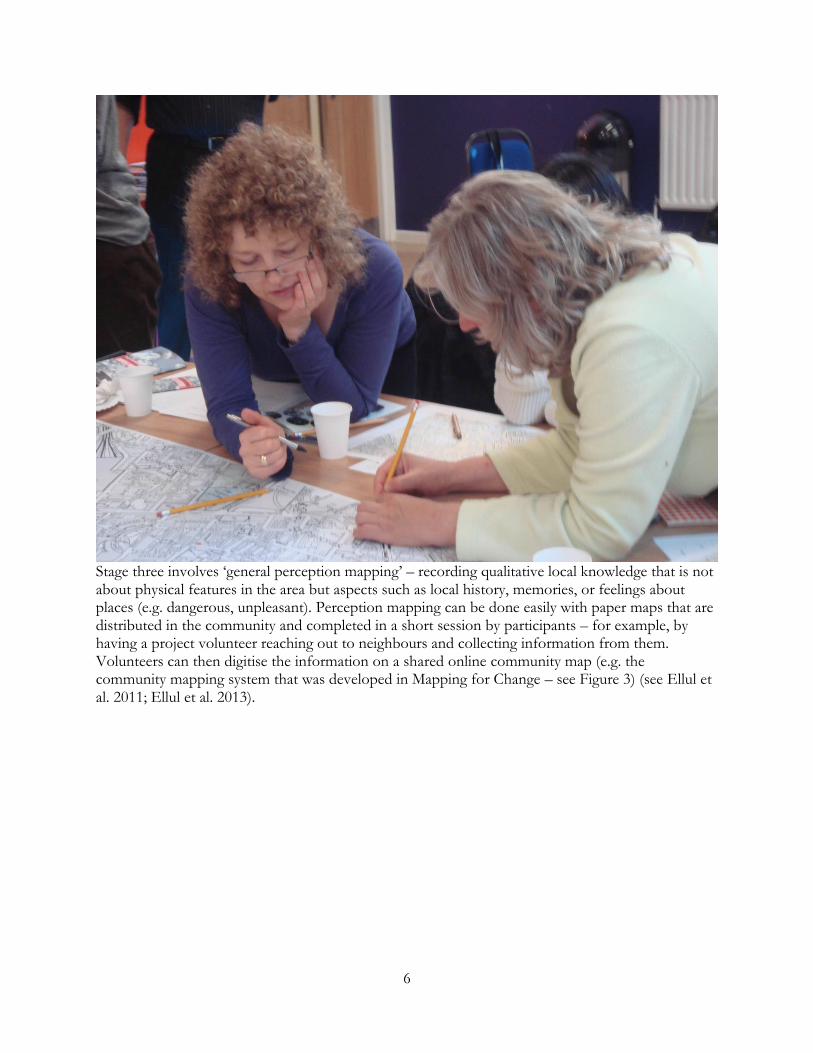
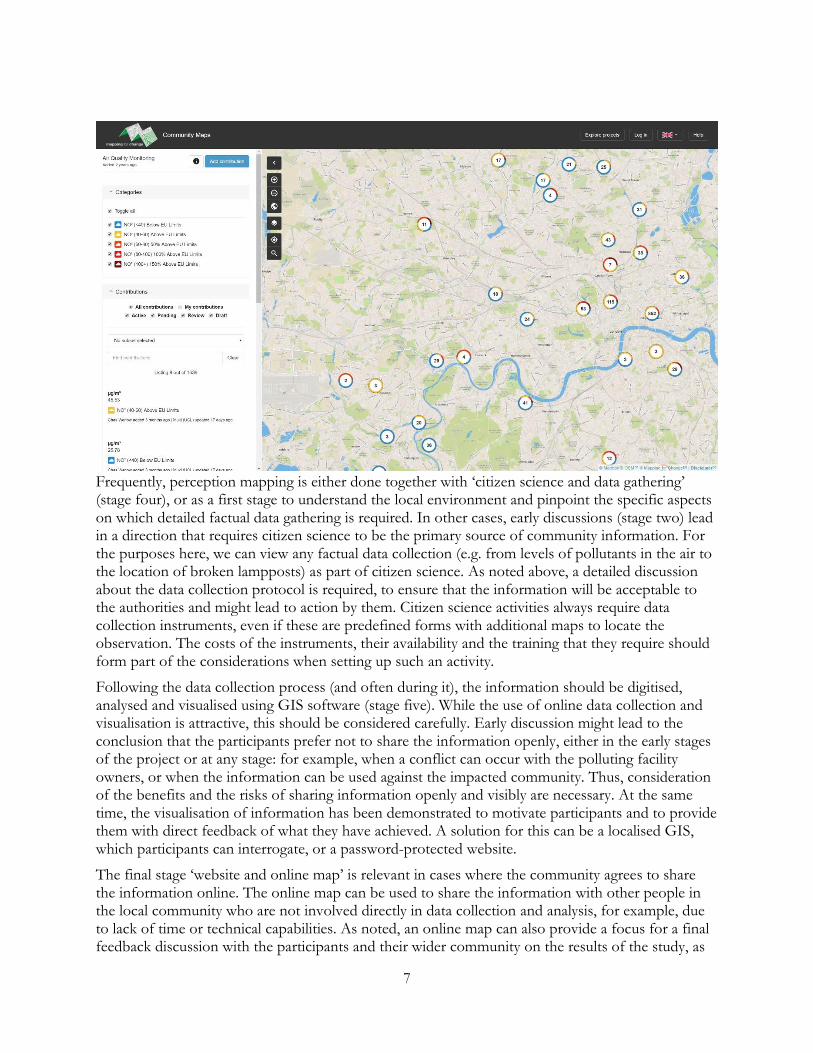
Stage three involves ‘general perception mapping’ – recording qualitative local knowledge that is not about physical features in the area but aspects such as local history, memories, or feelings about places (e.g. dangerous, unpleasant). Perception mapping can be done easily with paper maps that are distributed in the community and completed in a short session by participants – for example, by having a project volunteer reaching out to neighbours and collecting information from them. Volunteers can then digitise the information on a shared online community map (e.g. the community mapping system that was developed in Mapping for Change – see Figure 3) (see Ellul et al. 2011; Ellul et al. 2013).
7
Frequently, perception mapping is either done together with ‘citizen science and data gathering’ (stage four), or as a first stage to understand the local environment and pinpoint the specific aspects on which detailed factual data gathering is required. In other cases, early discussions (stage two) lead in a direction that requires citizen science to be the primary source of community information. For the purposes here, we can view any factual data collection (e.g. from levels of pollutants in the air to the location of broken lampposts) as part of citizen science. As noted above, a detailed discussion about the data collection protocol is required, to ensure that the information will be acceptable to the authorities and might lead to action by them. Citizen science activities always require data collection instruments, even if these are predefined forms with additional maps to locate the observation. The costs of the instruments, their availability and the training that they require should form part of the considerations when setting up such an activity.
Following the data collection process (and often during it), the information should be digitised, analysed and visualised using GIS software (stage five). While the use of online data collection and visualisation is attractive, this should be considered carefully. Early discussion might lead to the conclusion that the participants prefer not to share the information openly, either in the early stages of the project or at any stage: for example, when a conflict can occur with the polluting facility owners, or when the information can be used against the impacted community. Thus, consideration of the benefits and the risks of sharing information openly and visibly are necessary. At the same time, the visualisation of information has been demonstrated to motivate participants and to provide them with direct feedback of what they have achieved. A solution for this can be a localised GIS, which participants can interrogate, or a password-protected website.
The final stage ‘website and online map’ is relevant in cases where the community agrees to share the information online. The online map can be used to share the information with other people in the local community who are not involved directly in data collection and analysis, for example, due to lack of time or technical capabilities. As noted, an online map can also provide a focus for a final feedback discussion with the participants and their wider community on the results of the study, as
8
well as a discussion on what the next steps should be in using the information to lead to a change in local conditions.
As Figure 1 clarifies, there is no simple route through the process. The elements that we have found as effective in terms of engagement and empowerment include flexible use of the stages in the process to allow co-design and co-determination by the community of the process (see the framework of ‘Extreme Citizen Science’ in Haklay 2013). The flow of the process emphasises flexibility, iterative cycles and alternative pathways for different levels of participation so the activity can be inclusive.
COMMUNITY NOISE POLLUTION MONITORING AND ACTION IN PEPYS ETATE, LONDON
To demonstrate the application of the methodologies, we describe a case study in the area of noise in the Pepys Estate in Lewisham, London, where residents took part in early activities that led to the consolidation of the methodology. The Pepys Estate is a social housing complex near the banks of the Thames, originally built in 1966. The Estate had a complex history with its own ups and down, and in the 2000s was classified in the national Index of Multiple Deprivation within the 20% poorer parts of England (see the history of the estate at Municipal Dreams 2015). In stage one of the process, after consulting with the Pepys Community Forum – a local community organisation, and dedicated effort to recruit people from across the estate, residents pointed to the daily banging and grinding of a scrapyard near the centre of the estate, in close proximity to both a primary and nursery school. The residents were frustrated that previous complaints had gone unanswered and felt they had little means to address the situation. Discussions with the local authority revealed that the scrapyard is considered as a recycling facility, and is therefore regulated by the environmental authority (The Environment Agency), which limits the power of the local authority to regulate the activity. At the same time, the permission for such a noisy, and polluting, industrial activity to be located near a school and residential area was associated with the limited resources and power of the community in the estate. Once the noise problem was identified, a participatory data collection effort ensued, using paper forms and maps, and Class 2 Noise Meters available from electronics shops (where they are available for workplace assessment). Importantly, the participants were interested in expressing their views and perception of the noise that they had measured, thus mixing between ‘perception mapping’ and ‘citizen science’ in stage three and four. For the Pepys Estate community, the data collection was a n opportunity for representation of their daily experiences of the nuisance, but experientially and scientifically.
Over seven weeks in early 2008 a group of residents conducted a comprehensive noise pollution mapping survey (stage three). The participants were trained to take noise readings at all hours of the day and night across the whole of the Pepys Estate. In total, over 1000 individual readings were taken across all the sites. In addition to recording dBA sound levels, residents also collected qualitative information expressing how they felt about the noise. They were asked to choose words such as relaxing, annoying or disturbing to describe the sound. In addition, participants were asked to detail the principal noise source and provide any further information on how they were affected by the noise. During the engagement period, completed survey sheets were collected on a weekly basis by the project team and reviewed to make sure a good distribution through time and space was being achieved. Feedback was then given to residents about which areas and times needed more attention.
The data was then analysed using a GIS to produce noise pollution maps for the areas (stage four).
9
Qualitative information was summarised using charts and graphs. These results showed that the vast majority of readings were described as either Loud, Very Loud or Extremely Loud. In addition, results revealed that individuals were quite accurate in their perception of noise levels, suggesting that the perceptions of noise by people are very reliable. Members of the community also found disturbingly high levels of noise, affecting quality of life up to 350 metres from the scrapyard.
At the final stage of the process (stage six), a public meeting with Lewisham Council and the Environment Agency was organised and according to the Community Forum people, shown one of the highest level of participation in terms of the number of residents that came to it. Over two hours, the results were presented by the residents who collected the data, as well as a facilitated discussion in which many residents used the opportunity to explains their own frustration and concerns about the impact of noise on them and their children. The authorities accepted that the effort of the residents is providing enough evidence that there was a problem and carried out their own study, leading to a tightening of the regulations for the operation of the scrapyard.
The study, as well as another study near London City Airport, led to large-scale engagement with communities around London Heathrow Airport, and the use of smartphones as noise sensing devices to create an extensive noise and perception survey of the area (see Becker et al. 2013 for a detailed discussion).
CONCLUSIONS
The methodology that we have described above have proven to be effective and useful in assisting communities in addressing environmental justice concerns. The requirements of environmental decision making process to rely on scientific information make the use of citizen science and comprehensive qualitative data collection through perception mapping especially useful for this context. However, we should also notice the limitations and issues that we have identified.
Similar to other PGIS methodologies, such as Participatory 3D Modelling (P3DM) which is used in development plans, and include the building of a physical model of the location with the local community (CTA 2016), the methodology relies on high level of engagement and participation by the local community. In order to be effective, it requires significant effort in ensuring that the process is inclusive and represent all those who would like to have their voice heard through it. There is also a need for constant contact with the participants, to provide them feedback and encouragement throughout the process. This usually result in relatively time limited activity that last for 4 to 8 weeks.
Secondly, as a bottom-up approach, there is a risk of misreading, or misunderstanding of the issues that can make a difference – for example, in terms of local power relationship. The case of the Pepys Estate demonstrate that the local authority was not the body with ability to influence the activities of the problematic facility, even though it was the body with which the residents were familiar and comfortable. There is therefore a need to critically evaluate the activity and the purpose of the information that is collected, and plan ahead on the use of the outputs from the project.
Thirdly, there is a territorial issue – in many of the cases in which the methodology was used, we have explained to the participants that it will be beneficial to collect data beyond their own neighbourhood, as this can demonstrate the disparity in distribution of environmental nuisances and strengthen their case. We have observed that not only the participants were reluctant to use the term ‘environmental justice’, the plotting of the data that was collected usually delineates the boundary of the local neighbourhood. It seemed as if the participants were not interested, or confident, to collect
10
data beyond their area. We can assume that despite of the internal perceptions about the distribution of environmental burdens, the assessment of the political purchase of using environmental justice argument was not perceived as strong as a direct complaint about noise, air quality, or (in a case in Katowice, Poland) dog fouling. Understanding the exact reasons for localised data collection and the assessment of political arguments are open questions that require further research.
In summary, this chapter explored the intersection between citizen science, participatory GIS and environmental justice, explaining and demonstrating a methodology for carrying out such projects. The general methodology allows the participants to understand the official data about their area, and to identify gaps in information and in representation of their local conditions. Following Schlosberg (2007), Walker (2012) notes that the discourse on environmental justice requires a multifaceted approach that allows not only the demonstration of the inequity but also aspects of representation. Participation, mapping and local data collection through citizen science provide the means to create such a representation through the sharing of information that carries with it the authority of the scientific practice in being reliable, objective and trustworthy. Yet, there is a need to provide space for perceptions, emotions, memories and other qualitative aspects as part of this representation. This qualitative expression should also be seen as part of the participation and representation. The combination between (frequently qualitative) local knowledge and (often quantitative) scientific measurements is never simple or straightforward, and it is a mistake to attempt to simply scale it and treat it quantitatively. The maps and outputs that are produced from the process need to take into account the wishes of the community and what they would like to express through their activities.
Finally, there is also a need to note here the dual meaning of citizen science – as Irwin (1995) and Stilgoe (2009) pointed out, citizen science can also be understood to be science in the service of citizens. The methodology that is proposed here is structured around the approach that the researchers and scientists who are involved in it accept their role as facilitators, with ample space for the participants to shape the project, the data collection methodology and the interpretation of the results. Accepting that local knowledge and expertise are on a par with scientific expertise, and the development of a more egalitarian mode of knowledge production, is a challenge that frequently arises in the context of using the methodology.
We do not suggest that the methodology provides a panacea for participatory mapping and citizen science in environmental justice cases – the social, environmental, economic and political contexts of each locality and community require an adaptation that sensitively takes into account these factors and allows for an inclusive and productive collaboration of all those involved.
REFERENCES
Agyeman, J., & Evans, B. (2004). “Just sustainability”: The emerging discourse of environmental justice in Britain The Geographical Journal 170:155-164.
Becker, M., Caminiti, S., Fiorella, D., Francis, L., Gravino, P., Haklay, M., Hotho, A., Loreto, V., Mueller, J., Ricchiuti, F., Servedio, V.D.P., Sîrbu, A., & Tria F. (2013). Awareness and learning in Participatory Noise Sensing. PLoS One 8(12):e81638.
CTA - Technical Centre for Agricultural and Rural Cooperation ACP-EU (2016). The Power of Maps: Bringing the Third Dimension to the Negotiation Table. Proud Press, Neatherlands.
Chambers, R. (2006). Participatory Mapping and Geographic Information Systems: Whose Map? Who is Empowered and Who Disempowered? Who Gains and Who Loses? The Electronic Journal of Information Systems in Developing Countries. 25.
11
Ellul, C., Gupta. S., Haklay, M., & Bryson, K. (2013). A Platform for Location Based App Development for Citizen Science and Community Mapping. In Krisp, J. M. (ed.) Progress in Location-Based Services, Lecture Notes in Geoinformation and Cartography, Springer, Berlin pp 71.
Ellul, C., Francis, L., & Haklay, M. (2011). A Flexible Database-Centric Platform for Citizen Science Data Capture, Computing for Citizen Science Workshop, in Proceedings of the 2011 Seventh IEEE International Conference on eScience (eScience 2011)71-90.
Haklay, M. (2002). Public Environmental Information – Understanding Requirements and Patterns of Likely Public Use, Area, 34(1), 17-28.
Haklay, M. (2009). The contradictions of access to environmental information and public participation in decision making, Nordic Environmental Social Science 2009, London, 10-12 June.
Haklay, M. (2013). Citizen Science and Volunteered Geographic Information – overview and typology of participation. In Sui, D.Z., Elwood, S. and M.F. Goodchild (eds.), 2013. Crowdsourcing Geographic Knowledge. Berlin: Springer. pp. 105-122.
Harris, T.M., Weiner, D., Warner, T.A., & Levin, R. (1995). Pursuing social goals through participatory geographic information systems. Ground truth: the social implications of geographic information systems, New York: Guilford, pp.196-222.
Irwin, A. (1995). Citizen science: A study of people, expertise and sustainable development. Psychology Press.
Verplanke, J., McCall, M.K., Uberhuaga, C., Rambaldi, G. and Haklay, M., 2016. A Shared Perspective for PGIS and VGI. The Cartographic Journal
Mennis, J. (2011). Integrating remote sensing and GIS for environmental justice research. In Yang, X. (Ed.) Urban remote sensing: Monitoring, synthesis and modeling in the urban environment, 225-237.
Mitchell, G. (2005). Forecasting environmental equity: Air quality responses to road user charging in Leeds, UK, Journal of Environmental Management, 77 212-226. John Wiley & Sons.
Mitchell, G., and Walker, G. P. (2007). Methodological issues in the assessment of environmental equity and environmental justice. In: Sustainable urban development: the environmental assessment methods, Routledge, London, pp. 447-472.
Municipal Dreams (2015). The Pepys Estate, Deptford: for ‘the peaceful enjoyment and well-being of Londoners’, available at https://municipaldreams.wordpress.com/2015/08/04/the-pepys-estate-deptford-for-the-peaceful-enjoyment-and-well-being-of-londoners/
Ottinger, G. (2010). Buckets of resistance: Standards and the effectiveness of citizen science. Science, technology & human values, 35(2), pp.244-270.
Sandel, M. (2009). Justice: What's the Right Thing to Do? Farrar, Straus and Giroux.
Schlosberg, D. (2007). Defining Environmental Justice: Theories, Movements, and Nature. Oxford University Press.
Scott, D., & Barnett, C. (2009). Something in the air: civic science and contentious environmental politics in post-apartheid South Africa. Geoforum, 40(3), 373-382.
Sieber, R. (2006). Public participation geographic information systems: A literature review and framework. Annals of the Association of American Geographers, 96(3), pp.491-507.
Silvertown, J. (2009). A new dawn for Citizen Science. Trends in Ecology & Evolution 24(9), 467-471.
Stilgoe, J. (2009). Citizen Scientists: reconnecting science with civil society. London: Demos.
12
United Nations Economic Commission for Europe (UNECE) (1998). Convention on Access to Information, Public Participation in Decision-Making and Access to Justice in Environmental Matters, ECE Committee on Environmental Policy, Aarhus, Denmark.
UrbanBuzz (2009). UrbanBuzz: Building sustainable communities. London, UCL.
Walker, G. (2012). Environmental Justice: Concepts, Evidence and Politics, Routledge.
BIOGRAPHY
Muki Haklay is a Professor of Geographic Information Science at University College London (UCL). He is co-director of UCL Extreme Citizen Science group, and a co-founder of the social enterprise ‘Mapping for Change’, which provides services in participatory mapping and citizen science. His research focuses on public access to environmental information, participatory mapping, and citizen science.
Louise Francis is a Researcher at University College London (UCL) and a Practitioner of citizen science and community mapping programmes. She is a co-founder and Managing Director of the social enterprise ‘Mapping for Change’. Her research interest is in the role that participatory mapping, VGI and citizen science plays in generating positive environmental and social change.