Embed Size (px)
Citation preview
Partition of Plastic Work into Heat and Stored Energy in Metals
by J. Hodowany, G. Ravichandran, A. J. Rosakis and P. Rosakis
ABSTRACT--This study investigates heat generation in met- als during plastic deformation. Experiments were designedto measure the partition of plastic work into heat and stored en- ergy during dynamic deformations under adiabatic conditions. A servohydraulic load frame was used to measure mechanical properties at lower strain rates, 10 -3 s -1 to 1 s -1. A Kolsky pressure bar was used to determine mechanical properties at strain rates between 103 s -1 and 104 s -1. For dynamic loading, in situ temperature changes were measured using a high-speed HgCdTe photoconductive detector. An aluminum 2024-T3 alloy and c~-titanium were used to determine the de- pendence of the fraction of plastic work converted to heat on strain and strain rate. The flow stress and 13 for 2024-T3 alu- minum alloy were found to be a function of strain but not strain rate, whereas they were found to be strongly dependent on strain rate for c~-titanium.
KEY WORDS--plastic work, heat, infrared detectors, dy- namic, stored energy, cold work, high strain rates, Kolsky bar/SHPB
Introduction
When metals deform plastically, significant amounts of heat can be generated, especially in cases of highly localized deformation. If the deformation process is rapid, heat gen- eration can lead to large temperature increases, since there is no time to conduct heat away from the deforming metal, conditions being essentially adiabatic. The temperature in- crease can cause thermal softening in the metal and alter its mechanical performance. Even at moderate strain rates, plas- tic deformation can often be treated as essentially adiabatic. This phenomenon will be considered in detail in the following sections. To predict temperature fields and associated ther- mal softening in mechanics of materials, one must understand the coupling between plastic deformation and heat evolution. Examples of applications in which accurate models for heat generation are necessary include high-speed machining,1 bal- listic penetration, 2 shear banding, 3'4 dynamic void growth 5 and dynamic fracture. 6
Part of the mechanical energy expended during a plastic deformation process in metals is converted into heat, with the
J. Hodowany is Principal Engineer, Boeing, Seattle, WA 98124-2207. G. Ravichandran (SEM Member) is a Professor, andA. J. Rosakis (SEM Mem- ber) is a Professor, Graduate Aeronautical Laboratories, California Institute of Technology, Pasadena, CA 91125. P. Rosakis is an Associate Profes- sor, Department of Theoretical and Applied Mechanics, Cornell University, Ithaca, NY 14853-1503.
Original manuscript submitted: June 22, 1999. Final manuscript received." October 23, 1999.
remainder stored in the material microstructure. The stored energy is an essential feature of the cold-worked state and represents the change in internal energy of the metal. In addition, the stored energy of cold work remains in the ma- terial after removal of external loads. This fact distinguishes cold work from reversible thermoelastic energy, which is re- covered upon removal of the external loads. It is generally accepted that most of the mechanical energy is dissipated as heat during plastic deformation. The fraction of the rate of plastic work dissipated as heat 1~ is often assumed to be a con- stant parameter of 0.9 for most metals. Measurements of the ratio of stored energy to dissipated energy have varied con- siderably, even for nominally similar materials. In this paper, we present an experimental methodology for measuring 13 at different plastic strains and plastic strain rates. The experi- mental results clearly show that ~ could indeed be a function of these variables. The theoretical thermodynamical foun- dations leading to the observed plastic strain and strain rate dependence of 13 are discussed in Ref. 7.
For elastoplastic solids, a number of specializing assump- tions are often made, including infinitesimal deformations, the additive decomposition of strain into elastic and plastic parts, a relation between stress and elastic strain identical to that ofisotropic linear thermoelasticity and linear Fourier heat conduction law. These reduce the first law, or energy balance equation, to the following customary form under conditions of uniaxial stress:
pcO - kOxx = ~c~ p - a E O U . (1)
Here, 0 is absolute temperature and a, se and e p are the com- ponents of stress, elastic strain and plastic strain, respectively, viewed as functions of coordinate x and time t. Subscripts indicate partial derivatives with respect to the correspond- ing variable, and superposed dots denote time derivatives. The material constants O, c, k, ct, E and v are mass density, specific heat, thermal conductivity, thermal expansion coeffi- cient, Young's modulus and Poisson's ratio, respectively. For a detailed discussion of the theoretical models and assump- tions involved in the derivation of this equation, see Ref. 7.
It is assumed that some of the irreversible plastic work con- tributes to heat generation while the rest is stored as energy of crystal defects accompanying plastic deformation, tradi- tionally known as the stored energy of cold work. Hence, 13 in (1) is the fraction ofplasti.c work rate W P = a~P converted into thermoplastic heating Q P = 13ae p, that is, 13 = OP/I~Vp. Unfortunately, there seems to be no consensus on quantitative aspects of the stored energy of cold work. If adiabatic con- ditions prevail and the thermoelastic heating {)e = _oLEO~e
Expetfmental Mechanics �9 113

is negligible compared with the thermoplastic heating, (1) simplifies to ocO = I~ae p, allowing one to write
ocO 13 = c~P" (2)
As a result, under adiabatic conditions, 13 can be measured from experimental records of the temperature, stress and plas- tic strain versus time.
G. I. Taylor 8,9 first published a series of experiments on the latent energy remaining in copper after cold working. Without knowledge of microstructural mechanisms for en- ergy storage and strain hardening, Taylor concluded that "the fact that the absorption of latent energy and the increase in strength with increasing strain both cease when the same amount of cold work has been applied suggests that the strength of pure metals may depend only on the amount of cold work~ which is latent in them." The review article by Bever and colleagues 1~ provides a comprehensive overview of various attempts to measure the stored energy of cold work. It also covers basic thermodynamic aspects of plasticity and microstructural characteristics of the cold-worked state, Ma- son and colleagues n made the first systematic attempt to measure the strain dependence of the partition of plastic work during dynamic deformations. Although demonstrating that the amount of stored energy should be treated as a function of strain, the experiments were limited by a lack of resolution of the thermal detector used at near-ambient temperatures.
Experimental Procedure
Methods of Measuring the Stored Energy of Cold Work
The techniques for measuring the stored energy of cold work can be separated into two broad categories: in situ methods, in which measurements are made during deforma- tion, and postmortem methods, in which the stored energy is measured after deformation. A detailed description of these methods can be found in Ref. I0.
Measuring Mechanical Properties
Typically, the amount of energy given off as heat is mea- sured independent of the total amount of external work. The total external work is generally calculated from load- displacement diagrams. Thus, the loading device must have the means to record all relevant forces and displacements acting on the specimen.
DYNAMIC EXPERIMENTS
The Kolsky (split-Hopkinson) pressure bar shown in Fig. 1 is by now a well-established apparatus for the high-strain-rate testing of metals. Many references with regard to this tech- nique exist (e.g., Ref. 12); thus, only a cursory review of the governing equations will be presented here. The apparatus consists of a striker bar, an input bar and an output bar, all of which are assumed to remain elastic during a test. A test sample of length L is placed between the input and output bars. For a sample assumed to undergo homogeneous defor- mation, Kolsky 13 showed that the nominal strain rate, ~(t), is given by
k(t) = -2c~ ~R(t), (3) / . ,
where eR(t) is the time-resolved strain in the input bar and c 0 ( ~ is the one-dimensional bar wave speed. Eb and 9h axe the Young's modulus and density of the bar material, respectively. The strain in the sample can be calculated from (3) by integration:
t
. ) = f ~(x)d'~. 0
(4)
The nominal stress is calculated from the load in the output bar divided by the original sample area:
An g(t) = ---~ EeT(t), (5)
A
where A is the undeformed area of the test sample and er (t) is the time-resolved strain in the output bar of cross-sectional area A0. The input and output bars are assumed to be com- posed of the same material and have identical and uniform cross-sectional areas.
QUASI-STATIC EXPERIMENTS
A Materials Test System (MTS) compression/torsion load frame was used for axial compressive loading at strain rates at and below 1 s - i . To ensure uniaxial loading, a supple- mentary alignment fixture shown schematically in Fig. 2 was employed. Strain was calculated from the output of a linear variable displacement transducer placed across the sample gage length. Stress was calculated from load cell measurements.
Temperature Measurement
INFRARED PHOTON DETECTORS
There exist several types of transducers available for the measurement of temperature, each having relative advan- tages and disadvantages. Important factors that influence the choice of temperature transducer are time resolution, ex- pected temperature range, materials involved in the experi- ments and ease of implementation. Photon detectors measure temperature remotely and have high-speed response; thus, they are particularly suitable for short time events.
A single photoconductive HgCdTe detector, with maximal responsivity at infrared wavelengths between 8 to 12 txm, was used for this study. This wavelength range was chosen to match the peak spectral power distribution of a body be- tween 300 and 400 K, the range of temperatures expected during a cold-working cycle. In general, the time response of an infrared detector system is not limited by the detector element but, rather, by the electronics associated with it. 14 The detector-amplifier combination used in this study had a bandwidth of 5 Hz to 2 MHz. DC signals were blocked by an AC-coupling capacitor located in the preamplifier circuit; thus, only dynamic temperature changes could be resolved by the infrared detector.
INFRARED OPTICS
Most infrared optical systems are a variation of one of the basic catoptric telescope designs. Zehnder and Rosakis 6 and Mason and colleagues u used an Offner optical system, which is a modification of a classical Cassegrain telescope,
114 �9 VoL 40, No. 2, June 2000

Fig. 1--Schematic of Kolsky pressure bar with high-speed infrared thermography
Fig. 2--Schematic of experimental apparatus for quasi-static loading
for their temperature measurements. The Offner system is useful when imaging at no magnification. It consists of two spherical mirrors located such that their centers of curva- ture are coincident. This system is excellent for eliminat- ing spherical aberrations but is limited to unit magnification, which may not be suitable for all applications. The Newto- nian system, consisting of a concave and a flat mirror, allows for easy adjustment of magnification, and formed the basis of the optical system used in this study.
INTEGRATING MECHANICAL TESTING AND IN SITU TEMPERATURE MEASUREMENT
To calculate the partition of plastic work into heat and stored energy, the temperature measurement device was in- tegrated with the loading device mentioned above. Accurate results depended on resolving certain issues involved in inte- grating thermal and mechanical measurement. The detector optics are focused onto the sample face by using heated wires placed in the same plane as an actual test sample. After con- firming the focal position, the intersection of the heated wires
is marked remotely by the laser, which ensures repeatable sample alignment between tests.
CALIBRATION ISSUES
Perhaps the most important experimental issue was the calibration of the infrared detectors. For all tests in- cluded here, an experimental approach to calibration was adopted.& 11 After a series of Kolsky bar tests, without mov- ing the position of the detector and optics, a cylindrical sam- ple was placed in the same location as an actual test specimen. The calibration specimen was held in place by a holding fix- ture, designed to minimize conductive heat transfer from the specimen ends. A laser was used to position the calibration specimen, as in an actual test. On the lateral side farthest from the detectors, a thermocouple was placed into a premachined slot and held in place by a setscrew of the same material as the calibration specimen. The calibration specimen was then removed, placed in a furnace to raise its temperature above the expected maximum temperature of an actual test
Expefimental Mechanics �9 115

and returned to the holding fixture. As the specimen cooled, detector output and temperature were recorded.
The surface roughness of some metals, such as aluminum alloys, can change dramatically during deformation, which can affect the validity of calibrations during Kolsky bar exper- iments. For example, Fig. 3 shows three calibration curves plotted on the same axis; each represents a different level of deformation. Initially, the samples had smooth, machined surfaces. One sample was calibrated in this state; the remain- ing two were subjected to 15 percent and 25 percent plastic strain, respectively, prior to calibration. Clearly, large strains increase surface emissivity. The technique of remachining and reloading samples has an added advantage of extending the validity of calibrations over large strains.
LARGE-STRAIN DYNAMIC EXPERIMENTS
One drawback of using a Kolsky pressure bar is the in- ability to obtain large plastic strains through homogeneous deformation during a single loading cycle. In addition, accu- mulation of plastic strain in compression can produce large changes in surface emissivity, as mentioned above.
To obtain large plastic strains in compression, a technique of reloading samples was used. The reflection of input stress waves from the free end of the input bar can cause repeated loading of the sample. To avoid repeated loading during one test, a short output bar was used. In this configuration, the tensile stress wave that results from reflection from the free end of the output bar will cause the output bar to pull away from the sample, ending the test before a second loading. 15 For a given sample, the dimensions before and after testing were recorded. The sample was then remachined, result- ing in a virgin surface finish. The remachined sample was tested with a known initial value of plastic strain. This pro- cess was repeated until the desired value of plastic strain was attained. This technique works especially well with rate in- sensitive materials, since any strain rate differences between tests would be inconsequential. However, the technique will also work with rate sensitive materials, provided the strain rates are carefully duplicated between successive loading cycles.
140
120
100
80
~" 60
40
i i I i I
2024 ~ u m i n u m
20 I [ I I | I I
0.0 0.2 0.4- 0.6 0.8 Detector Output (V)
Fig. 3--Calibration curves for the HgCdTe photoconductive high-speed infrared detector
QUASI-STATIC COMPRESSION WITH TEMPERATURE MEASUREMENT
Mechanical tests at low strain rates are often nearly isothermal. The particular strain rate below which the de- formation process can be considered isothermal depends on the thermal properties of the material and specimen geome- try. It turns out that for some materials, deformations at the highest strain rates achievable on the MTS servohydraulic load frame are nearly adiabatic.
Using the infrared detector system with the MTS load frame is problematic. The passband of the detector and am- plifier rejects low-frequency signals. Instead, a fast, E-type thin wire thermocouple was used to measure temperature changes in the MTS load frame. The diameter of the thermo- couple wire was 25 txm. Voltage changes produced by the thermocouple were registered directly on a Nicolet 440 oscil- loscope using the equivalent thermocouple circuit of Fig. 2. The thermocouple was bonded to the center of the specimen with epoxy. During bonding, an intimate contact between the thermocouple and the specimen was verified with a magnify- ing lens. The nonconductive epoxy also electrically isolated the lead wires from the specimen, and each other. The rise time of the thermocouple in this configuration was limited only by the rate of heat transfer into the junction. The time response of the E-type thermocouple was determined to be approximately 1 ms. This was determined by placing the thermocouple junction in boiling (100~ water.
Sources o f Error
HEAT TRANSFER DURING MECHANICAL LOADING
During the deformation of metals, heat transfer from the sample to the loading medium is inevitable. Over a short enough time scale, the process can be considered nearly adi- abatic for the purposes of analyzing the resultant tempera- ture rise in the sample volume. Using a one-dimensional, unsteady heat transfer model, the relative error in assuming adiabatic deformation processes was investigated. The anal- ysis of the heat conduction in the specimen and the bar is given in the appendix.
Typical duration of Kolsky bar tests was about 100 txs. Using Table A1, this implies a normalized duration of 6.25 x 10 -4 for 2024-T3 aluminum and 7.64 • 10 -5 for c~-titanium. From Figs. A2 and A3, this gives an error in mid- specimen temperature of less than 0.5 percent for 2024-T3 aluminum and less than 0.2 percent for c~-titanium, respec- tively. A possible source of error is also due to the translation of the movement of the bars and, hence, the specimen during the test. From Figs. A2 and A3, it is evident that the tempera- ture is nearly uniform over 90 percent of the specimen length and varies significantly only in the vicinity the specimen-bar interface. For typical duration of loading in a Kolsky bar test, the infrared detector remains focused on the central region where temperature gradients are negligible. Errors for MTS experiments, whose duration was 500 ms, were 2 percent for 2024-T3 aluminum and 1 percent for a-titanium. These are conservative estimates, since the actual specimen and bar have rough surfaces and heat transfer does not occur over the entire area of the bar, as assumed.
116 �9 Vol. 40, No. 2, June 2000

VALIDITY OF EXPERIMENTAL ASSUMPTIONS
Calculating the stored energy of cold work using the method outlined above relies on certain basic assumptions.
�9 Homogeneous deformation. Equations (3) and (5) rep- resent average measures of strain rate and stress based on the load applied by and relative motions of the ends of the bar in contact with the sample. In the Kolsky bar, under normal testing conditions, the sample de- forms under nominally homogeneous conditions. 12 In the case where stress and strain are not uniform in the sample, one can still use the Kolsky bar analysis to calculate total input power. However, temperature is measured over a fraction of the sample surface and is in fact an average of temperature over that area. To calculate ~ from (2), the calculated plastic power must be an accurate average measure of plastic power over the area where temperature information is collected.
�9 No temperature gradients in the sample. This assump- tion is related to homogeneous deformation. For a material undergoing homogeneous deformation, one would expect heat to evolve uniformly inside the sam- ple volume in the absence of heat conduction. We neglect temperature gradients and assume the process to be adiabatic. Actual temperature gradients are the lowest in the center of the sample, as suggested by the calculations in the appendix.
�9 Adiabatic deformation. The validity of this assump- tion was analyzed above. In addition to the theoretical analysis above, one may examine the temperature pro- file during a test to estimate heat loss. The slope of the temperature trace after unloading provides an estimate of heat loss.
�9 Thermoelastic heating is negligible. For the heat con- duction equation to reduce to (2), it is necessary to neglect thermoelastic heating. The temperature rise due to the thermoelastic term in (1) has been measured by several investigators (e.g., Ref. 10) and is seldom greater than 0.2 K. Depending on the relative differ- ence between the elastic and plastic work, the temper- ature rise from thermoelastic heating may or may not be significant. For a metal deforming homogeneously at dynamic rates, a temperature rise of 80-100 K is not uncommon. If the metal hardens only mildly, the elastic strain rate is negligible after the onset of plastic flow. The elastic strain rate was typically only a few percent of the plastic strain rate in our tests, as shown in Fig. 4.
Calibration
Another potential source of error is associated with tem- perature calibration. No single calibration can account for all conditions of a sample during dynamic loading. The afore- mentioned calibration procedure minimizes error by dupli- cating test conditions as much as possible.
D a t a A n a l y s i s
Format of Raw Data
Figure 5 is a plot of the raw mechanical end thermal data from the Kolsky bar test. In comparison with the temperature
0.04 i �9 1 �9 i .
0. ,
0.02
o.oo ................. " r ~ ' - " \ \ , ~ o.o o=
-0 .02
~ ] Input Bar --0.4
- - 0 . 0 4 I I 1 I I r f I I
0 "I00 200 300 400 time (~)
Fig. 4--Example of raw data output from a dynamic com- pression experiment
M J
r,,)
0
Fig. loading experiment. transducer
. ' 10 fast thermocouple
0
0
3 load cell
' t J
0 . . . . I . . . . , , - 0
0.0 " 0.5 1.0 1.5 2.0 2.5 time (s)
5--Example of raw data output from a quasi-static LVDT = linear variable displacement
signal, stress and strain measurements are delayed by the time required for elastic waves to travel from the specimen to the strain gages in the Kolsky bar. From the nearly zero slope of the temperature signal beyond its peak value, it can be concluded that the heat loss is negligible in the duration of interest, namely, that of the experiments. This is in agreement with the results of the heat conduction analysis presented in the appendix.
The MTS universal test frame was used to load samples at lower strain rates. Raw data from this type of test are shown in Fig. 6. The load and displacement were measured directly from the MTS, whereas temperature was measured from a thermocouple mounted on the sample surface. The acquisition rate of the Nicolet oscilloscope corresponds to the approximate rise time of the thermocouple. In contrast to Kolsky bar experiments, no time delay existed between thermal and mechanical measurements. This fact eliminates possible errors involved in time shifting the measured signals.
Experimental Mechanics �9 117

3000
2500
2000
1500
1000
50O e
i
0.00 0.05 0.10 0.15 0.20
E
Fig. 6--Comparison of elastic and plastic components of strain rates
Data Reduct ion
KOLSKY BAR EXPERIMENTS
The plastic power WP was calculated from strain gage sig- nals using (3) and (5). The plastic strain rate was determined by subtracting the elastic strain rate from the total strain rate:
~P( t ) = ~( t ) - - ~e( t ) = ~( t ) - - 6 ( 0 = ~( t ) 1 - - E - ~ e ) '
(6)
where E is the elastic modulus and d e r i d e is the tangent modulus.
Heat evolution was calculated from the measured temper- ature signal. Differentiation of the time-resolved temperature signal was needed to determine the rate of heat evolution in (2). Temperature-dependent heat capacity was used in all the calculations.
For each test, the signals were time shifted such that the maximum temperature was correlated with the point of max- imum strain. This criterion was effectively equivalent to equating the point of zero strain rate (the start of unload- ing on the stress-strain curve) with the point at which the time derivative of the temperature is zero.
MTS EXPERIMENTS
Analyzing the measured thermal and mechanical quanti- ties from quasi-static tests was somewhat different in com- parison with Kolsky bar tests. The MTS load frame provided a direct measurement of load and displacement, from which engineering stress and engineering strain were calculated. Plastic strain was calculated from
1 ~P(t) = e( t ) - 2 ~ ( t ) . (7)
The plastic work rate ff'P was calculated using the time derivative of (7) and the stress. The heating rate was cal- culated from the output of the attached thermocouple in the
same manner as that of the infrared thermal detector data with the Kolsky bar. The primary difference was that the thermal and mechanical measurements did not need to be time shifted relative to each other.
Results
Rate- independent 2024-T3 A lum inum A l loy
Figure 7 plots the true compressive stress versus true strain curves for the 2024-T3 aluminum alloy at two strain rates. Over the first 25 to 30 percent of strain, the flow stress was nearly the same over a range of strain rates from 10 -3 s -1 to 3000 s -1. Although the 10 -3 s -1 test was nearly isother- mal and the 3000 s -1 was nearly adiabatic, the stress-strain curves closely overlapped. The temperature rise during a dynamic compression test was never more than 30~ above room temperature, which is less than 5 percent of the melting temperature. This explains the lack of significant thermal softening for the 3000 s - ] test in Fig. 7. The dependence of temperature O on plastic strain e p for 2024-T3 aluminum is shown in Fig. 8 for three strain rates, 10-3 s - ] , 1 s - ] and 3000 s -1. It should be noted that within experimental error, the three curves are identical. For strain rate insensitive solids such as 2024-T3 aluminum, it is expected that this should be the case.
The fraction ~ of plastic work rate converted to heating computed using (2) for 2024-T3 aluminum alloy in compres- sion is shown in Fig. 9 for two strain rates, 1 s - 1 and 3000 s - ~. These curves represent the functional dependence of 13 on en- gineering plastic strain after yield for values of the strain rate of 3000 s -1 at strains less than 15 percent. The two curves at 3000 s -1 represent two separate tests at that strain rate and provide some measure of repeatability of the experimental method. There was no observed dependence of 13 on strain rate. For plastic strains between 0.05 and 0.15, only 30 to 35 percent of plastic work was dissipated as heat.
I000
800
~ , 600
400
200
AI2024-T3
~ = 3 0 0 0 s -~
..... ~ =10-3 s-I
0.0
! , , i i | r i , i �9 | , , , f
0.1 0.2 0.3 0.4
E
Fig. 7--Engineering stress versus engineering strain curves at two different strain rates (10 -3 s - ] and 3000 s - ] ) for 2024- T3 aluminum alloy
118 �9 Vol. 40, No. 2, June 2000

2 5 -
I s -x . . . . . . . . . . . 1000 s.~
3000 s -1 9-0
�9 ~ 15 7 /
E "~ v
10 ../" j,/,~
5 / / ~ . s ' "
0 , , , , I i i i z [ I I 0.I 0.2
s
Fig. 8--Adiabatic temperature rise versus engineering plas- tic strain at three different strain rates (1 s -1, 1000 s - ] and 3000 s -1) for 2024-T3 aluminum alloy
1.0
0.8
0.6
0.4
0.2
A I 2 0 2 4 - T 3
- - ~ = 3000s ~1
~ = I s -1
, e ,r
0 . 0 . . . . ! ' ' ' ' ! ' ' ' ' I . . . . I I I
0.00 0.05 0.10 0.15 0.20
E P
Fig. 9--Fraction of plastic work rate converted to heating 13 versus engineering plastic strain at two different strain rates (1 s -1 and 3000 s -1) for 2024-T3 aluminum alloy
1000
8OO
600
200
0 i
A12024-T3
- - ~ = 3000s-1
, , , , l . . . . I , , . ,
, " ~ . . . . I , ,
0.0 0.1 0.2 0.3 0.4 0.5 0.6 0.7 s
Fig. 10--Engineering stress versus engineering strain curves from successive loading sequences (remachining-reloading) for 2024-T3 aluminum alloy at a strain rate of 3000 s -~
1.0
0.8
0.6
0.4
0 . 2 A 1 2 0 2 4 - T 3
- - ~ = 3000s -1
i i , i , I . . . . I , , , , I , , , �9 I . . . . I . . . . 0.0 I I I I I I
0.0 0.1 0.2 0.3 0.4 0.5 0.6
EP
Fig. 11--Fraction of plastic work rate converted to heating versus engineering plastic strain from successive loading
sequences for 2024-T3 aluminum alloy
To determine the relative partition of plastic work at higher levels of strain in compression, the reloading technique, de- scribed earlier, was employed. The emissivity of aluminum changes appreciably as plastic strain is accumulated, so the remachining-reloading technique was necessary to maintain nearly constant emissivity relative to strain. The true stress- true strain curves in Fig. 10 were produced from three sep- arate samples, each with varying amounts of residual defor- mation but identical surface finish.
The calculated [3 for the three tests of Fig. 10 is shown in Fig. 11. From 0 to 0.15 plastic strain, the dependence of 13 on strain resembled that in the tests of Fig. 8. Above
0.15 plastic strain, the ability to store energy decreases and [3 rapidly increases toward 1.0. Above 0.4 plastic strain, nearly all input work was dissipated as heat.
Rate-dependent a-t i tanium
The true compressive stress versus true strain curves for a-titanium are shown in Fig. 12 for two strain rates, 1 s -1 and 3000 s - 1 This figure shows that the flow stress for a-titanium is clearly dependent on the strain rate during loading. Similar results have been reported for a-titanium over a wider range of strain rates (10 -3 to 106 s - l ) . 16 In this study, large strains
Experimental Mechanics �9 119
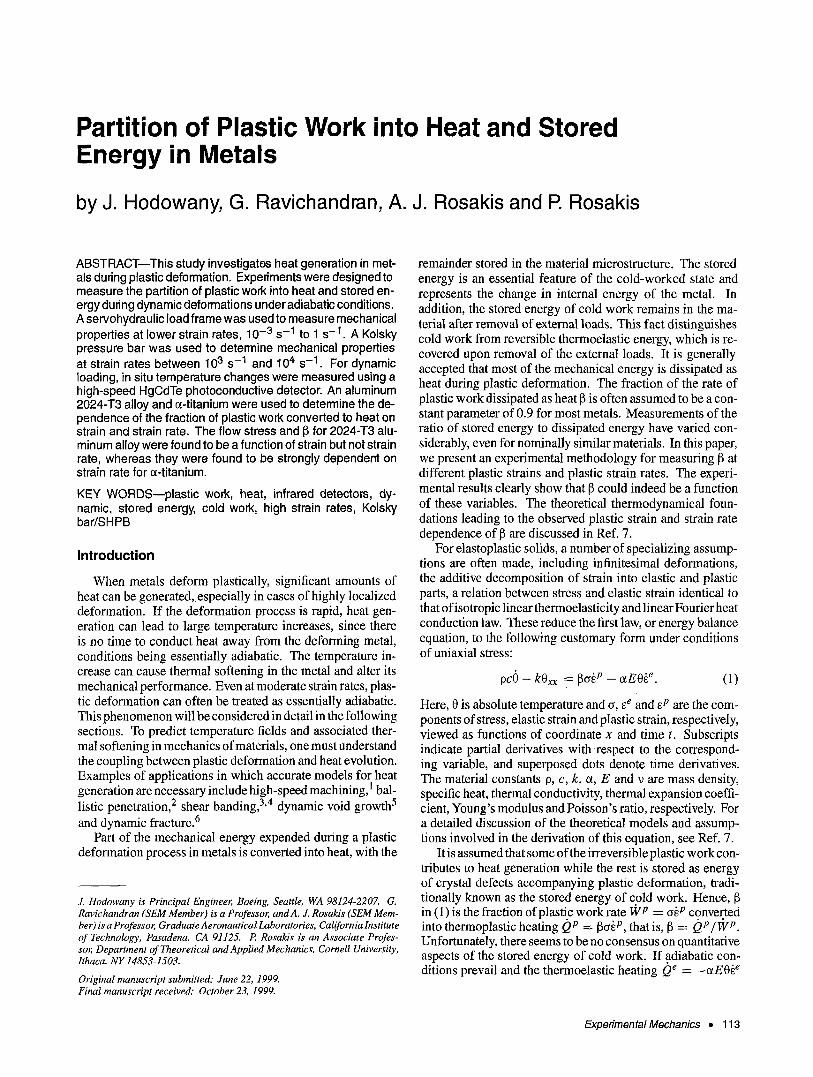
were attained on the compression Kolsky bar by a recovery and reloading technique similar to that used for the aluminum. Figure 13 shows the true stress-strain curves produced from this technique. For et-titanium and other rate sensitive metals, care must be exercised to match strain rates between loading sequences. Figure 14 shows the curves of the temperature rise O versus plastic strain e p for two strain rates, 1 s -1 and 3000 s -1. In this case, the temperature is not only a function of strain but also depends on strain rate.
1200 I
1000 ~ = 3000 s "1
800
000 400
2000 " ~
0.0 0.1 0.2 0.3 0.4 8
Fig. 12--Engineering stress versus engineering strain curves at two different strain rates (1 s - l and 3000 s -1) for c~-titanium
i200 t o~-titanium
1000 - - ~ = 3000 s -t
600
400
200 e p = 0 eo p =21%
I I I l . . . . . . I I I I . . . . 0 I I , , , ~ I I I I I I I I I
0.0 0.1 0.2 0.3 0.4 0.5 0.6 E
Fig. 13--Engineering stress versus engineering strain curves from successive loading sequences (remachining-reloading) for c~-titanium at a strain rate of 3000 s - ]
I s -t 100 3000 s -z
~'J 75
~ 5o N 1/' [...
25
0.1 0.2 0.3 0 4 8P
Fig. 14--Adiabatic temperature rise versus engineering plastic strain at two different strain rates (1 s -1 and 3000 s -1) for c~-titanium
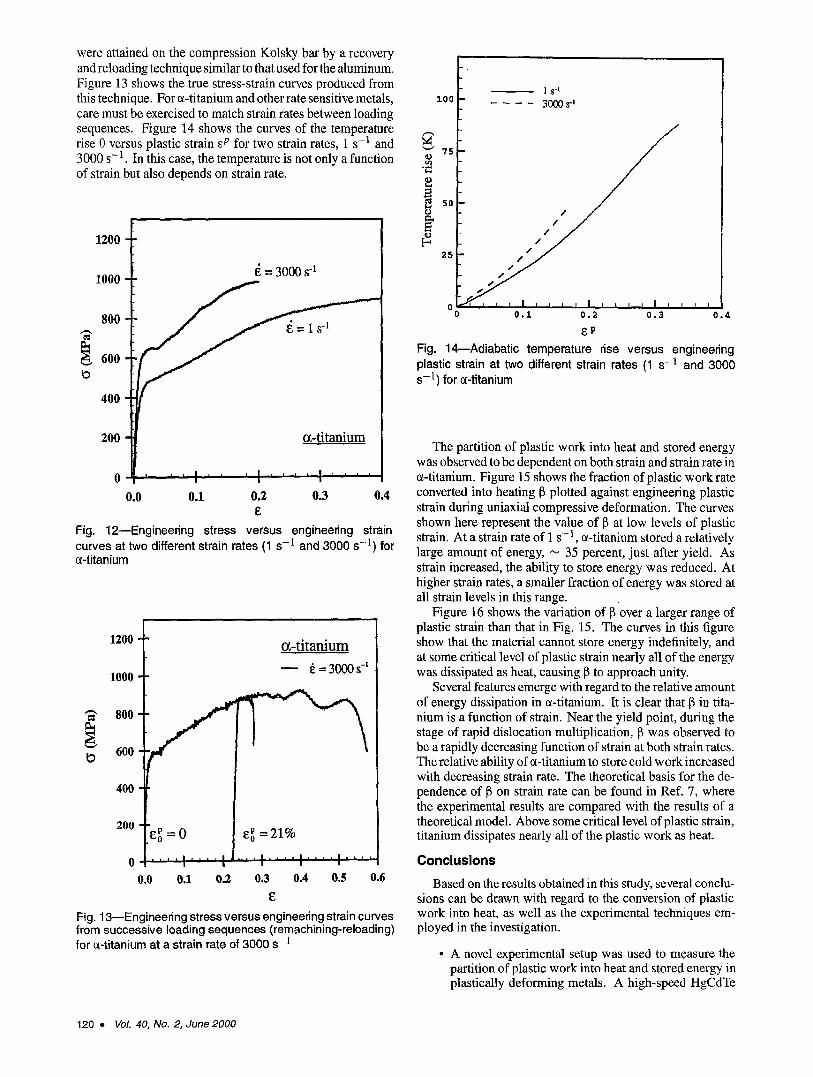
The partition of plastic work into heat and stored energy was observed to be dependent on both strain and strain rate in m-titanium. Figure 15 shows the fraction of plastic work rate converted into heating I~ plotted against engineering plastic strain during uniaxial compressive deformation. The curves shown here represent the value of 13 at low levels of plastic strain. At a strain rate of 1 s- l , c~-titanium stored a relatively large amount of energy, ,-, 35 percent, just after yield. As strain increased, the ability to store energy was reduced. At higher strain rates, a smaller fraction of energy was stored at all strain levels in this range.
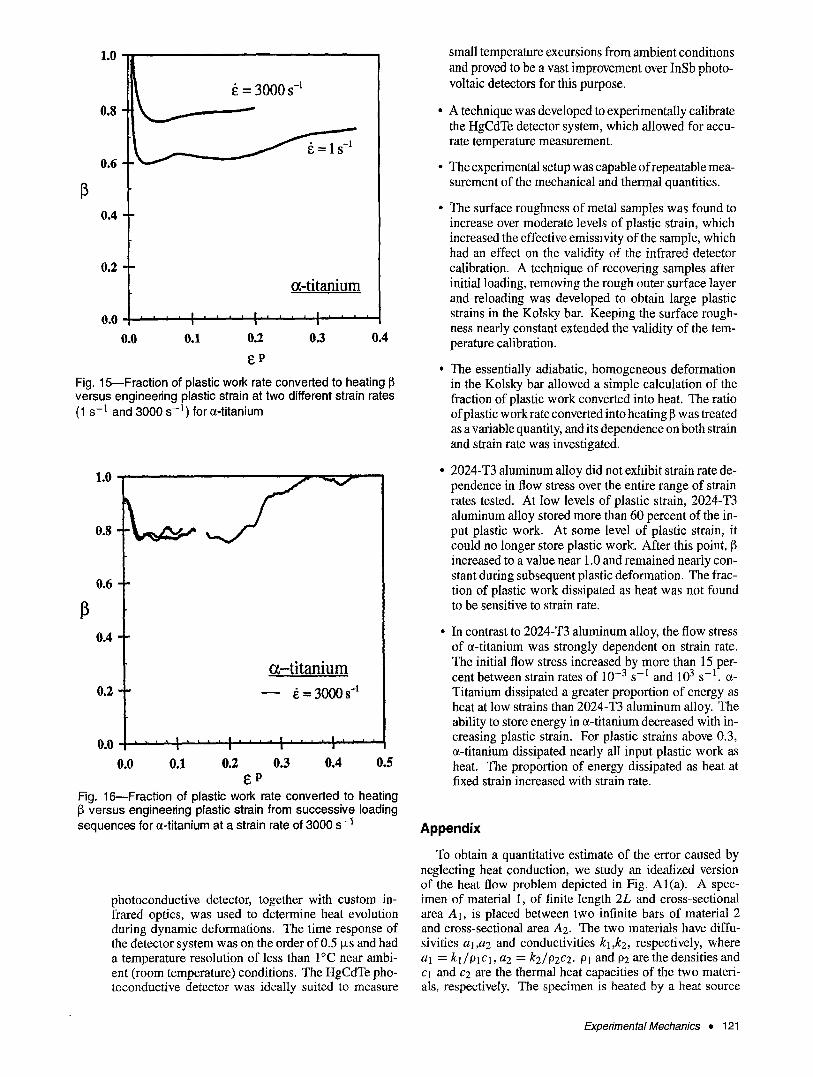
Figure 16 shows the variation of I~ over a larger range of plastic strain than that in Fig. 15. The curves in this figure show that the material cannot store energy indefinitely, and at some critical level of plastic strain nearly all of the energy was dissipated as heat, causing 13 to approach unity.
Several features emerge with regard to the relative amount of energy dissipation in e~-titanium. It is clear that ~ in tita- nium is a function of strain. Near the yield point, during the stage of rapid dislocation multiplication, ~ was observed to be a rapidly decreasing function of strain at both strain rates. The relative ability of s-titanium to store cold work increased with decreasing strain rate. The theoretical basis for the de- pendence of 13 on strain rate can be found in Ref. 7, where the experimental results are compared with the results of a theoretical model. Above some critical level of plastic strain, titanium dissipates nearly all of the plastic work as heat.
C o n c l u s i o n s
Based on the results obtained in this study, several conclu- sions can be drawn with regard to the conversion of plastic work into heat, as well as the experimental techniques em- ployed in the investigation.
�9 A novel experimental setup was used to measure the partition of plastic work into heat and stored energy in plastically deforming metals. A high-speed HgCdTe
120 �9 VoI. 40, No. 2, June2000
1.0
0.8
= 3000 s -1
�9 - - 1 - 1
0.4
0.2
a - t i t a n i u m
0 . 0 f I ! , , , , | , , , , I . . . . I I I
0.0 0.1 0.2 0.3 0.4
EP
Fig. 4 5--Fraction of plastic work rate converted to heating [~ versus engineering plastic strain at two different strain rates (1 s - I and 3000 s -1) for a-titanium
0.8
0.6
0.4
0.2
a - t i t a n i u m
~ = 3 0 0 0 s -1
0.0 ' ' ' ' 1 ' ' ' ' ~ . . . . ', . . . . ', . . . .
0.0 0,1 0.2 0.3 0.4 0.5 ~ P
Fig. 16--Fraction of plastic work rate converted to heating 13 versus engineering plastic strain from successive loading sequences for a-titanium at a strain rate of 3000 s -1
photoconductive detector, together with custom in- frared optics, was used to determine heat evolution during dynamic deformations. The time response of the detector system was on the order of 0.5 t~s and had a temperature resolution of less than I~ near ambi- ent (room temperature) conditions. The HgCdTe pho- toconductive detector was ideally suited to measure
small temperature excursions from ambient conditions and proved to be a vast improvement over InSb photo- voltaic detectors for this purpose.
�9 A technique was developed to experimentally calibrate the HgCdTe detector system, which allowed for accu- rate temperature measurement.
�9 The experimental setup was capable ofrepeatable mea- surement of the mechanical and thermal quantities.
�9 The surface roughness of metal samples was found to increase over moderate levels of plastic strain, which increased the effective emissivity of the sample, which had an effect on the validity of the infrared detector calibration. A technique of recovering samples after initial loading, removing the rough outer surface layer and reloading was developed to obtain large plastic strains in the Kolsky bar. Keeping the surface rough- ness nearly constant extended the validity of the tem- perature calibration.
�9 The essentially adiabatic, homogeneous deformation in the Kolsky bar allowed a simple calculation of the fraction of plastic work converted into heat. The ratio of plastic work rate converted into heating 13 was treated as a variable quantity, and its dependence on both strain and strain rate was investigated.
�9 2024-T3 aluminum alloy did not exhibit strain rate de- pendence in flow stress over the entire range of strain rates tested. At low levels of plastic strain, 2024-T3 aluminum alloy stored more than 60 percent of the in- put plastic work. At some level of plastic strain, it could no longer store plastic work. After this point, 1~ increased to a value near 1.0 and remained nearly con- stant during subsequent plastic deformation. The frac- tion of plastic work dissipated as heat was not found to be sensitive to strain rate.
�9 In contrast to 2024-T3 aluminum alloy, the flow stress of a-titanium was strongly dependent on strain rate. The initial flow stress increased by more than 15 per-
3 I 3 1 cent between strain rates of 10- s - and 10 s- . a- Titanium dissipated a greater proportion of energy as heat at low strains than 2024-T3 aluminum alloy. The ability to store energy in ct-titanium decreased with in- creasing plastic strain. For plastic strains above 0.3, a-titanium dissipated nearly all input plastic work as heat. The proportion of energy dissipated as heat at fixed strain increased with strain rate.
Appendix
To obtain a quantitative estimate of the error caused by neglecting heat conduction, we study an idealized version of the heat flow problem depicted in Fig. Al(a). A spec- imen of material 1, of finite length 2L and cross-sectional area At, is placed between two infinite bars of material 2 and cross-sectional area A2. The two materials have diffu- sivities a],a2 and conductivities k],k2, respectively, where al = k] /plc l , a2 = k2/02c2. Pl and P2 are the densities and c] and c2 are the thermal heat capacities of the two materi- als, respectively. The specimen is heated by a heat source
Experimental Mechanics �9 121

due to the thermoplastic heating 0 p and assumed constant for this benchmark calculation. Because of symmetry, this reduces to the problem depicted in Fig. Al(b). We neglect heat loss from free surfaces compared with conduction in the solids. Also, we idealize the problem as one-dimensional, taking the cross-sectional area mismatch into account in the interface conditions at x = L while the specimen middle x = 0 is insulated due to symmetry. Given an initial uniform temperature 0o, we introduce the nondimensional variables
(O -- 00) a l t t L 2 O - - - , 1 : = - - = --, 'r = -
00 L 2 "to al
x L20 p X = ~ , ~ = kO0 (A1)
These are the dimensionless versions of temperature rise, time, characteristic time (for material 1), distance and heat source, respectively. We let O = | x) for 0 < X < 1 (specimen) and | = O2(X, x) for 1 < X < c~ (bar). The heat source (forcing term ~) is constant in the specimen but vanishes in the bar, where there is no thermoplastic heat- ing. The nondimensional forms of the linear heat conduction equation for the specimen and the bar are, respectively:
0201 0Ol
O X 2 O~
0202 I~ 2 002_ = -qb,
8 X 2 O't
0 < X < I , "~>0,
I < X < ~ , x > 0 , (A2)
where tx = v~]-d2. The temperature is subject to the bound- ary condition
O0 ~-~ (0, x) = 0 (A3)
(middle of the insulated specimen at X = 0) and jump con- ditions at the specimen-bar interface X = 1:
O1 (1, x) = O2(1, "t) (A4)
0| .. 0| klA 1 - ~ ( 1 , z) = k2A2"-~t~, "t). (A5)
These enforce continuity of temperature and heat flux through the interface. In addition, we require
O 2 ( X , 1;) ~ 0 as X ~ cx~. (A6)
These are to be supplemented by the initial condition
| 0 ) = 0 0 < X < o o . (A7)
The jump conditions (A4),(A5) assume perfect contact at the interface. Actual surfaces are rough, and only a fraction of the cross-sectional area is in contact and available for con- duction. Thus, our calculation may overestimate the error of neglecting heat conduction. Note, however, that the contact area increases with pressure, so that resistance to conduction is lower at higher pressures.
If the interface X = 1 were insulated, the solution of (A2) for the specimen would yield a spatially uniform adiabatic temperature rise Oad &) = ~x. The solution of the conduc- tion problem (A2)-(A7) for the temperature rise 01 in the
Fig. A1--Schematics for one-dimensional model heat con- duction problem during mechanical loading: (a) experimental, (b) idealized
specimen, normalized by the adiabatic temperature rise | is given in Ozisik: 17
O l(g, T) _ _ 1 f <(x, ,_,)as, (AS) o
where
| ( l - Y ) ~ - ' ~ u 2v'~
n=0
+ er/c , (A9)
where, erfc stands for the complementary error function and
kl A1 - k2 A2~ oq Y = kl A1 + k2A2IX b~ = ~ 1 2 �9 (A10)
Expression (A8) provides an estimate of the temperature error in neglecting heat conduction. Material properties and characteristic times for steel (bar material), 2024-T3 alu- minum and a-titanium (specimen materials) are given in Ta- ble A1. Specimens were cylindrical, with a diameter of 6.35 mm. Kolsky bar specimens and MTS specimens had differ- ent lengths of 6.35 mm and 10 mm, respectively. As a result, they had different characteristic times x0 denoted separately in Table A1. Temperature profiles obtained from numerical integration of (A8) for several normalized times x are shown in Fig. A2 for 2024-T3 aluminum alloy and in Fig. A3 for ~- titanium. The error is clearly smallest in the specimen middle (X = 0), where 0 is measured in the experiments.
Acknowledgments
The second and third authors gratefully acknowledge sup- port from the Office of Naval Research (Grant N0014-95-1- 0453) and the National Science Foundation (Grant CMS- 9204026). The fourth author would like to thank J. K. Knowles and the Caltech Faculty for their hospitality dur- ing his visit to the California Institute of Technology, and the National Science Foundation (Grant MSS-9312858).
122 �9 VoL 40, No. 2, June2000
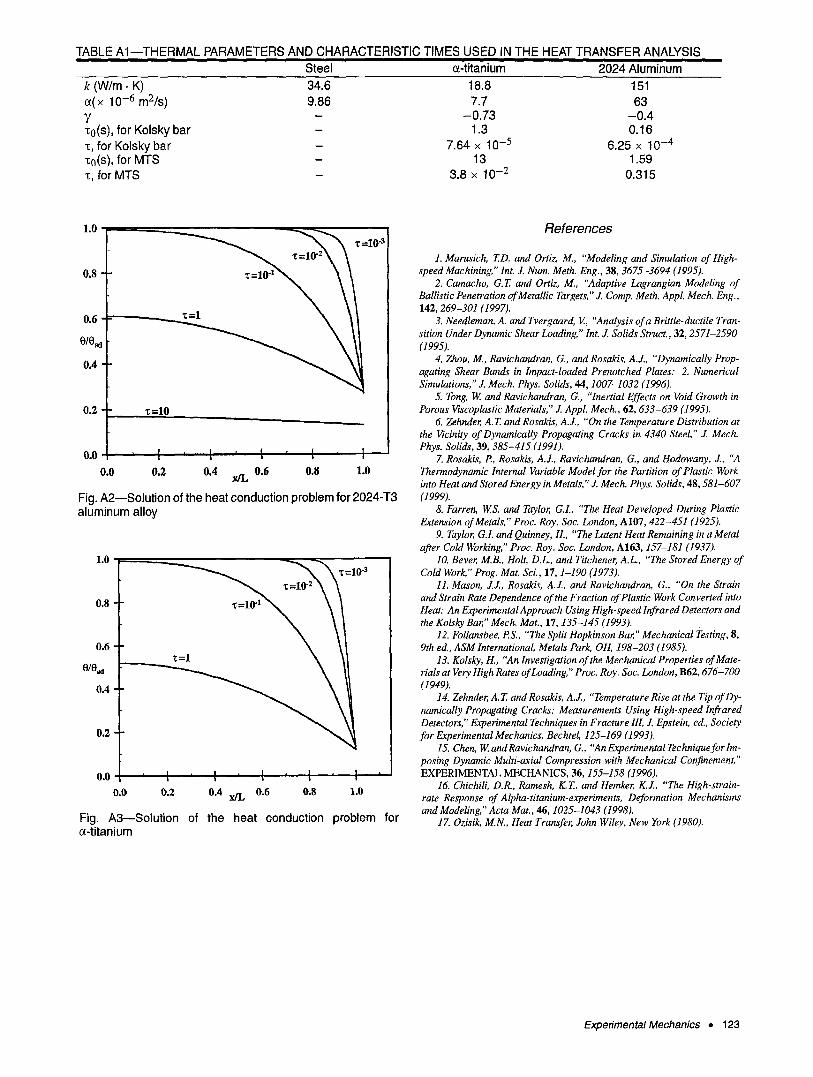
TABLE A1--THERMAL PARAMETERS AND CHARACTERISTIC TIMES USED IN THE HEAT TRANSFER ANALYSIS I
Steel c~-titanium 2024 Aluminum k (W/m. K) 34.6 c~(x 10 -6 m2/s) 9.86 ~, "to(S ), for Kolsky bar �9 t, for Kolsky bar "to(s), for MTS -t, for MTS
= "c =I0 "3
. \ / / o, \ \ / I
0.2 z =10 /
t o . o , l , t ' i ' [ , l
0 . 0 0 . 2 0 . 4 0 . 6 0 . s 1 .0 x/L
Fig. A2--Solution of the heat conduction problem for 2024-T3 aluminum alloy
1.0
0.8
0.6
0.4
0.2
- ~ ' ~ ' c = 1 o -3 "c=10"2 \ ~
Fig. A3--Solution c~-titanium
o .o r I ' I ' I ' I ' I '
o . o 0 . 2 0 .4 x / L 0 .6 0 .8 1 .0
of the heat conduction problem for
18.8 151 7.7 63
-0 .73 - 0 . 4 1.3 0.16
7.64 x t0 -5 6.25 x 10 -4 13 1.59
3.8 x 10 -2 0.315
References
1. Marusich, T.D. and Ortiz, M., "Modeling and Simulation of High- speed Machining," Int. J. Num. Meth. Eng., 38, 3675-3694 (1995).
2. Camacho, G.T. and Ortiz, M., "Adaptive Lagrangian Modeling of Ballistic Penetration of Metallic Targets,'" J. Comp. Meth. Appl. Mech. Eng., 142, 269-301 (1997).
3. Needleman, A. and Tvergaard, V., "Analysis of a Brittle-ductile Tran- sition Under Dynamic Shear Loading," Int. J. Solids Struct., 32, 2571-2590 (1995).
4. Zhou, M., Ravichandran, G., and Rosakis, A.J., "Dynamically Prop- agating Shear Bands in Impact-loaded Prenotched Plates: 2. Numerical Simulations," J. Mech. Phys. Solids, 44, 1007-1032 (1996).
5. Tong, W and Ravichandran, G., "Inertial Effects on Void Growth in Porous Viscoplastic Materials," J. AppL Mech., 62, 633-639 (1995).
6. Zehnder, A.T. and Rosakis, A.J., "'On the Temperature Distribution at the Vicinity of Dynamically Propagating Cracks in 4340 Steel," J. Mech. Phys. Solids, 39, 385-415 (1991).
7. Rosakis, P, Rosakis, A.J., Ravichandran, G., and Hodowany, J., "A Thermodynamic Internal Variable Model for tl~e Partition of Plastic Work into Heat and Stored Energy in Metals," J. Mech. Phys. Solids, 48, 581-607 (1999).
8. Farren, W.S. and Taylor, G.I., "The Heat Developed During Plastic Extension of Metals," Proc. Roy. Soc. London, A107, 422-451 (1925).
9. Taylor, G.L and Quinney, H., "The Latent Heat Remaining in a Metal after CoM Working," Proc. Roy. Soc. London, A163, 157-181 (1937).
10. Bever, M.B., Holt, D.L., and Titchener, A.L., "The Stored Energy of Cold Work," Prog. Mat. Sci., 17, 1-190 (1973).
I1. Mason, J.J., Rosakis, A.J., and Ravichandran, G., "On the Strain and Strain Rate Dependence of the Fraction of Plastic Work Converted into Heat: An Experimental Approach Using High-speed Infrared Detectors and the Kolsky Bar," Mech. Mat., 17, 135-145 (1993).
12. Follansbee, PS., "The Split Hopkinson Bar," Mechanical Testing, 8, 9th ed., ASM International, Metals Park, OH, 198-203 (1985).
13. Kolsky, H., "An Investigation of the Mechanical Properties of Mate- rials at Very High Rates of Loading," Proc. Roy. Soc. London, B62, 676-700 (1949).
14. Zehnder, A.Z and Rosakis, A.J., "Temperature Rise at the Tip of Dy- namically Propagating Cracks: Measurements Using High-speed Infrared Detectors," Experimental Techniques in Fracture IIl, J. Epstein, ed., Society for Experimental Mechanics, Bechtel, 125-169 (1993).
15. Chen, W. and Ravichandran, G., "'An Experimental Technique for Im- posing Dynamic Multi-axial Compression with Mechanical Confinement," EXPERIMENTAL MECHANICS, 36, 155-158 (1996).
16. Chichili, D.R., Ramesh, K.T., and Hemker, K.J., "The High-strain- rate Response of Alpha-titanium-experiments, Deformation Mechanisms and Modeling," Acta Mat., 46, 1025-1043 (1998).
17. Ozisik, M.N., Heat Transfer, John Wiley, New York (1980).
Experimental Mechanics �9 123