Embed Size (px)
Citation preview

Partnering with New Zealand
Financial Condition Report 2018Accident Compensation Corporation
Te Kaporeihana Āwhina Hunga Whara


1FINANCIAL CONDITION REPORT 2018
An online version of this report can be found at www.acc.co.nz/about-us/corporate
Contents
Executive summary �������������������������������� 2
Progress against recommendations �������� 8
How ACC operates and how it’s changing ������������������������������������ 14
Claim volumes, types and costs ������������ 34
How ACC services are funded ��������������� 46
Financial results ����������������������������������� 60
Funding position ���������������������������������� 69
Appendix A �������������������������������������������79Additional background information ������� 79
Appendix B ������������������������������������������ 86Risk management �����������������������������������86
Appendix C �������������������������������������������93Claim volumes, types and costs ������������� 93
Appendix D ������������������������������������������122Valuation of the outstanding claims liability ����������������������������������������122
Appendix E ������������������������������������������ 131Financial results �������������������������������������131
Appendix F�������������������������������������������135How ACC manages its investments ������ 135

2 ACCIDENT COMPENSATION CORPORATION
Exec
utiv
e su
mm
ary
Executive summary
An independent and professional overview of ACC’s financial positionOur role as actuaries is to make sure that ACC’s financial position is transparent and clear� We focus on the ACC Scheme’s operations, financial condition, liabilities and risks�
We write this report independently every year and recommend changes and improvements where needed� This report relates to the financial year ended 30 June 2018�
We do this because legislation asks us to and also because we’re aware how important the ACC Scheme is for New Zealanders’ wellbeing� Around one-third of New Zealanders are injured every year and make claims to ACC� So it’s vital that the Scheme is financially healthy and treats clients and levy and tax payers fairly�
All insurance schemes produce a similar report� Like all actuaries, we comply with the New Zealand Society of Actuaries’ professional standards� However, technically ACC isn’t like other, private sector insurers; it’s a statutory monopoly with the right to raise levies� So we’ve aligned with professional standards to the extent that they make sense for ACC� In particular, for considering solvency, we’ve taken into account the Government’s funding policies for each ACC account�
The Scheme exists to prevent injuries and rehabilitate and compensate injured people, and ACC is working to improve customers’ experiences� To succeed in these areas, the Scheme must be financially viable and manage risks�
That’s what this report tells you�
Herwig Raubal BEC FNZSA FIAA Nina Herries BSc (Hons) FNZSA FIAChief Risk and Actuarial Officer Head of Actuarial ServicesAppointed Actuary
December 2018

FINANCIAL CONDITION REPORT 2018 3
Executive summary
ACC’s overall financial condition is satisfactory• The levied accounts (the Motor Vehicle, Work
and Earners’ Accounts) and the Earners’ portion of the Treatment Injury Account are currently overfunded, with surpluses being returned to levy payers through offsets to levies�
• The non-levied accounts (the Non-Earners’ Account and the Non-Earners’ portion of the Treatment Injury Account) are under funding pressure, but claims can continue to be paid for the foreseeable future�
• ACC is going through a significant transformation�
• A heightened awareness and management of risk is important during change�
• Investment in injury prevention has increased, and return targets were met for the year�
• Claim volumes and costs in the past four years have produced significant strain, so the levels we expected for 2017/18 were increased to reflect this�
• Claim volumes and costs have been closer to this higher expected level this year�
• Management responses are reducing upward pressure on claim costs in both the levied and the non-levied accounts� This has partly offset increases in recommended levies and appropriations, although these are projected to increase over time�
And that’s important for delivering the right customer services and outcomes.It’s important that ACC’s financial condition is sound and resilient� This provides the financial basis to allow the ACC Scheme to:
• invest in injury prevention, in partnership with other agencies
• provide the right rehabilitation and compensation services to injured people, working with providers and the wider health sector
• operate at a cost that’s reasonable and sustainable for the people who fund the Scheme – levy and tax payers�
ACC is transforming to build greater customer trust and improve performanceTo perform better, ACC is working to transform customer experiences� Change programmes within the Integrated Change Investment Portfolio (ICIP) strategy are designed to put the customer at the centre of everything ACC does� So far, financial results from the ICIP have been mixed� There was an improvement in claims processed per full-time equivalent employee� However, there was an increase in average weekly compensation days paid� If the programme is to deliver on its expected financial benefits, this needs to improve�
And requires heightened awareness of potential risks as this happens.In a high-change environment, ACC needs a heightened awareness of the risks of change itself, and the risks it poses to usual operations� Injured New Zealanders must continue to get the support they need to return to work and/or independence� Funding from levy and tax payers needs to be at a level that’s reasonable�
Executive support and commitment to owning risk management has improved during the year� This needs to continue� Also important are clarifying roles and responsibilities, implementing the risk management technology solution, implementing a strong risk appetite, developing an enterprise incident and issue framework and continuing with the compliance work plan� The Risk and Compliance Office needs to help the business to embed these maturity activities�
The costs and benefits of and other support structures for the next phase of the ICIP are under review� To succeed, the transformation programme needs to focus on where the main benefits will be realised� Benefits from the programme have been built in to levy and Government appropriation calculations� As noted above, average weekly compensation days are tracking behind projections at this time�
ACCIDENT COMPENSATION CORPORATION4
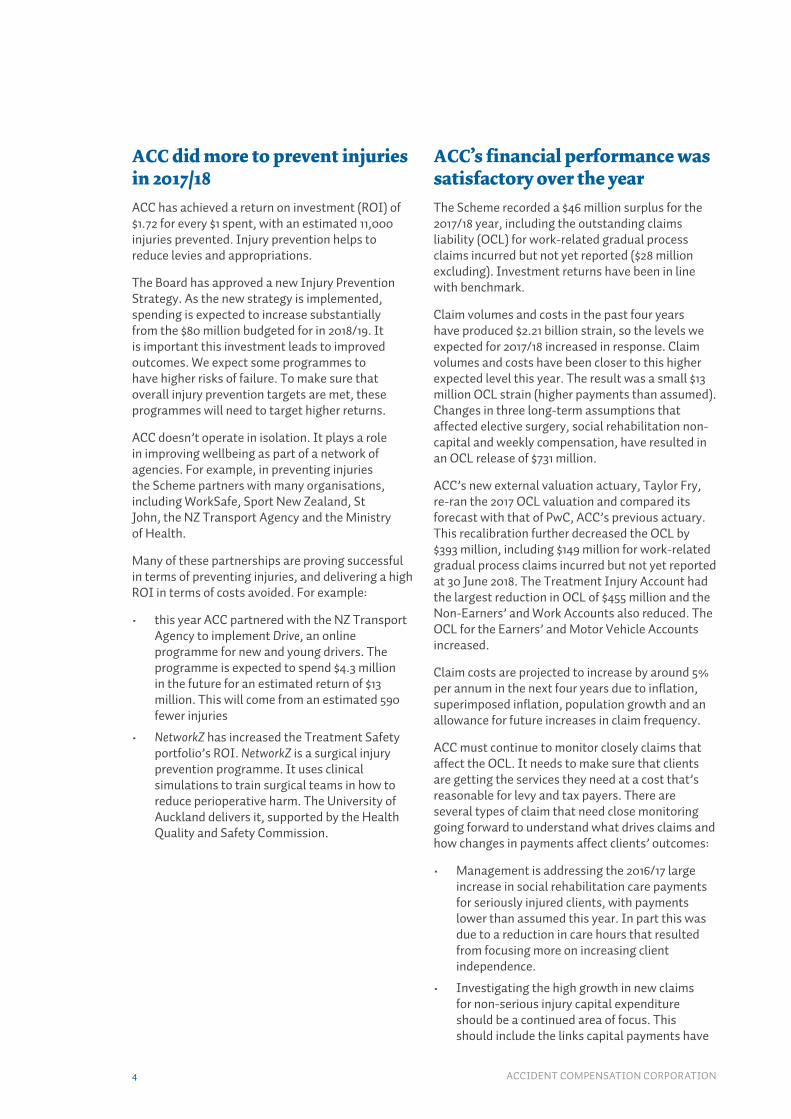
ACC did more to prevent injuries in 2017/18ACC has achieved a return on investment (ROI) of $1�72 for every $1 spent, with an estimated 11,000 injuries prevented� Injury prevention helps to reduce levies and appropriations�
The Board has approved a new Injury Prevention Strategy� As the new strategy is implemented, spending is expected to increase substantially from the $80 million budgeted for in 2018/19� It is important this investment leads to improved outcomes� We expect some programmes to have higher risks of failure� To make sure that overall injury prevention targets are met, these programmes will need to target higher returns�
ACC doesn’t operate in isolation� It plays a role in improving wellbeing as part of a network of agencies� For example, in preventing injuries the Scheme partners with many organisations, including WorkSafe, Sport New Zealand, St John, the NZ Transport Agency and the Ministry of Health�
Many of these partnerships are proving successful in terms of preventing injuries, and delivering a high ROI in terms of costs avoided� For example:
• this year ACC partnered with the NZ Transport Agency to implement Drive, an online programme for new and young drivers� The programme is expected to spend $4�3 million in the future for an estimated return of $13 million� This will come from an estimated 590 fewer injuries
• NetworkZ has increased the Treatment Safety portfolio’s ROI� NetworkZ is a surgical injury prevention programme� It uses clinical simulations to train surgical teams in how to reduce perioperative harm� The University of Auckland delivers it, supported by the Health Quality and Safety Commission�
ACC’s financial performance was satisfactory over the yearThe Scheme recorded a $46 million surplus for the 2017/18 year, including the outstanding claims liability (OCL) for work-related gradual process claims incurred but not yet reported ($28 million excluding)� Investment returns have been in line with benchmark�
Claim volumes and costs in the past four years have produced $2�21 billion strain, so the levels we expected for 2017/18 increased in response� Claim volumes and costs have been closer to this higher expected level this year� The result was a small $13 million OCL strain (higher payments than assumed)� Changes in three long-term assumptions that affected elective surgery, social rehabilitation non-capital and weekly compensation, have resulted in an OCL release of $731 million�
ACC’s new external valuation actuary, Taylor Fry, re-ran the 2017 OCL valuation and compared its forecast with that of PwC, ACC’s previous actuary� This recalibration further decreased the OCL by $393 million, including $149 million for work-related gradual process claims incurred but not yet reported at 30 June 2018� The Treatment Injury Account had the largest reduction in OCL of $455 million and the Non-Earners’ and Work Accounts also reduced� The OCL for the Earners’ and Motor Vehicle Accounts increased�
Claim costs are projected to increase by around 5% per annum in the next four years due to inflation, superimposed inflation, population growth and an allowance for future increases in claim frequency�
ACC must continue to monitor closely claims that affect the OCL� It needs to make sure that clients are getting the services they need at a cost that’s reasonable for levy and tax payers� There are several types of claim that need close monitoring going forward to understand what drives claims and how changes in payments affect clients’ outcomes:
• Management is addressing the 2016/17 large increase in social rehabilitation care payments for seriously injured clients, with payments lower than assumed this year� In part this was due to a reduction in care hours that resulted from focusing more on increasing client independence�
• Investigating the high growth in new claims for non-serious injury capital expenditure should be a continued area of focus� This should include the links capital payments have

FINANCIAL CONDITION REPORT 2018 5
Executive summary
with other payment types, including social rehabilitation non-capital�
• The drivers behind the long-term superimposed inflation for elective surgery require greater understanding�
• It is important there is a continued focus on improving weekly compensation continuance rates through increased independence and improved client outcomes to ensure growth in the long-term claims pool remains under control�
• Treatment injury claim increases are continuing, particularly from recent accident years� This growth has shown some signs of slowing, however the upward trend remains a concern� Continued monitoring of treatment injury claims is required due to the uncertainty of the long-term claims pattern�
• More clients are reporting sensitive claims due to the increased awareness of support provided by the Integrated Services for Sensitive Claims (ISSC)� Of these, more new clients are claiming weekly compensation, and the average amount paid to clients is increasing� The high number of sensitive claims has also affected medical payments due to clients receiving more counselling, and independence allowance� The Non-Earners’ and Earners’ Accounts are most affected by this� The total OCL for sensitive claims in both accounts is estimated to be around $3 billion� We’re investigating developing a specific model for sensitive claims to better reflect their unique claim patterns�
• A review has been commissioned to clarify how long someone will spend in the ISSC, the services they’re using and opportunities for further improving the service� It’s important that this review considers whether the service is delivering client outcomes that are in line with ACC’s expectation when it was set up� This report is due early in 2019�
• We made a recommendation in last year’s Financial Condition Report to understand why older accident-year claims have been leaving the Scheme more slowly than expected� Higher-than-expected claim payments for social rehabilitation capital, weekly compensation and elective surgery were found to be the main reasons� Actions are underway to address these�
ACC’s financial condition is positive for levied accountsThe ACC Board consulted on levy rates in September and October 2018, and recommended 2019/21 levy rates to the Minister for ACC in November 2018� The Board consulted on a decrease in the average Work Account levy and increases in the Earners’ and Motor Vehicle Account levies� These were below the underlying cost of new claims due to surplus assets in the levied accounts� This is an overall increase of $43 million (1%) each year for these combined levied accounts�
Levy rates are expected to increase in future years for three key reasons:
1� The number of weekly compensation and medical claims continues to increase�
2� Medical and care costs continue to rise faster than inflation�
3� The levied accounts are overfunded� These surplus funds mean levies collected are less than the underlying cost of claims� Over time, as these surplus funds are returned to levy payers, less will remain to offset the cost of claims, so levies will need to rise�
For the first time, the levy recommendations included the expected benefits of management actions� These included investments in injury prevention and the ICIP� They reduced the levy required by $106 million each year� If these savings aren’t made, larger increases will be included in future levy consultations�
The levied accounts and the Earners’ portion of the Treatment Injury Account are all above the 105% target funding position� It’s unlikely that the levied accounts’ funding positions will fall below 100% in the medium to long term� The Motor Vehicle Account has a higher risk of falling below this figure than the Earners’ and Work Accounts� This is because of its lower opening funding position and larger proportion of long-term claims�
Claim volumes and costs have driven increases in the OCL in the past four years� High investment returns have offset these to some extent� This has meant the funding positions haven’t moved back to the funding target as quickly as expected� The investment markets may see a correction, and it’s important to monitor claim growth and policy changes that could reduce the funding position� Management should continue to identify ways to control claim costs�

ACCIDENT COMPENSATION CORPORATION6
But the situation for non-levied accounts is less secure.For 2018/19 the appropriation requested for the Non-Earners’ Account and the Non-Earners’ portion of the Treatment Injury Account was in line with the funding policy� Management responses reduced this by $73 million� Management is on target to deliver these�
Claim costs and appropriations in the Non-Earners’ and Treatment Injury Accounts are not aligned� The fully-funded portion of the Non-Earners’ Account, and the Non-Earners’ portion of the Treatment Injury Account, are below the 88% target� The Government has contributed less than the cost of claims incurred in the past four years� This has contributed to funding pressures for the Non-Earners’ Account� We project that the funding positions of these accounts will fall further below target without action to align claim costs and appropriations�
The Government has approved lower levies and appropriationThe Government confirmed the levy rates for 2019/21 in mid-December 2018� The Work Account levy is to decrease in line with the Board recommendation� However, the Earners’ Account and the Motor Vehicle Account levies are to remain at the 2017/19 rate, lower than recommended by the Board�
Also, during Budget 2018 the Government approved the 2018/19 appropriation lower than asked for, and lower than the underlying cost of claims�
The levied and non-levied accounts both face similar future funding pressures arising from:
• increasing claim volumes and costs, in particular sensitive claims for the Non-Earners’ Account and the Earners’ Account�
• reduced investment return expectations
• the impact of the pay equity legislation�
Approving levies and appropriations lower than those recommended will utilise assets faster than expected and the funding position will deteriorate more quickly� In time, the levies and appropriation will have to return to the underlying cost of new claims� When increases requested in line with the funding policies are not approved, higher requests will be needed in the future to
compensate� Ultimately, the level of increases required in the future to achieve this may become unreasonably high�
It is important to note the levied accounts have surplus assets while the non-levied accounts are in deficit� So lower-than-requested levies will drive a faster return to the 105% solvency target than the funding policy would achieve� For the non-levied accounts, lower than requested appropriations will increase the existing deficits� Despite this, ACC is able to manage and pay claims across all accounts for the foreseeable future�

FINANCIAL CONDITION REPORT 2018 7
Executive summary
RecommendationsThere are no new recommendations in this year’s report� In our opinion, there are no new issues emerging this year that require urgent action beyond what’s already planned or in progress�
In particular, the organisation has a major programme of work in place in the ICIP� This has been designed to deliver significant benefits in terms of services to and outcomes for clients, as well as financial benefits to levy and tax payers� It’s important that these benefits are delivered�
We’ve made various recommendations in earlier Financial Condition Reports, and the open recommendations that require further action are detailed below� These relate to treatment injury, injury prevention and claims management� We consider that the Board and management should, to the extent possible, continue to take action to support their resolution� We’ve noted the roles responsible for each action� Owing to the Scheme’s long-term nature, we expect that many of these recommendations will require longer than a year to resolve� The recommendations are:
Treatment injury1� Develop a framework for aligning financial and
performance incentives, in partnership with the health sector, for reducing the incidence and severity of treatment injuries, with a plan for implementation� This should include contracting mechanisms and other forms of incentives, such as consideration of levies� [Responsibility: Chief Customer Officer]
This was recommendation 1 in the 2017 report.
Injury prevention2� Develop a medium- to long-term target for the
intended overall impact on injury reduction as a result of ACC’s injury prevention activities� Ensure measurement of impact appropriately allows for broader benefits of injury prevention activities� [Responsibility: Chief Customer Officer]
This was recommendation 4 in the 2017 report.
Claims management3� Implement a formal regime, including the
establishment of baselines, for monitoring and measuring the effectiveness of changes to claims management approaches, and the impact of changes to client supports provided, in improving client, operational and financial outcomes� [Responsibility: Chief Operating Officer/Chief Risk and Actuarial Officer/Chief Financial Officer]
This was recommendation 6 in the 2017 report.
Detail on the actions taken so far on these recommendations, and the reasons we’ve carried them forward to this report, is in the Progress against recommendations section�

8 ACCIDENT COMPENSATION CORPORATION
Pro
gres
s ag
ains
t rec
omm
enda
tion
sP
rogr
ess
agai
nst r
ecom
men
dati
ons
Progress against recommendations
Summary
The 2017 Financial Condition Report (FCR) included six open recommendations:
• Three were new�
• Three were carried forward or amended from the 2016 FCR�
Three of these recommendations are still open with actions in progress: one is expected to close in 2018/19, and two are closed�
Three other recommendations from the 2016 FCR were due to close during 2017/18� Of these:
• two are closed
• one is still open, and likely to close in 2018/19�

FINANCIAL CONDITION REPORT 2018 9
Progress against recommendations
We report on the recommendations in three categoriesMany recommendations need more than a year to resolve, so we present them in three categories:
• Remaining open�
• Expected to close during 2018/19�
• Closed�
Recommendations still open are included in this report’s executive summary�
INCLUDING MANAGEMENT ACTIONS AND OUR COMMENTS.
Management actions follow each recommendation� Some have been completed and some are underway� We then confirm the status of the recommendation�
Where a recommendation hasn’t closed, we give our view on additional actions needed�
Recommendations remaining open
RECOMMENDATION 1 IN 2017 FCR – TREATMENT INJURY
Develop a framework for aligning financial and performance incentives, in partnership with the health sector, for reducing the incidence and severity of treatment injuries, with a plan for implementation� This should include contracting mechanisms and other forms of incentives, such as consideration of levies� [Responsibility: Chief Customer Officer]
Management actions:
The goal here is to identify incentives that will:
• help reduce the number of people suffering treatment injuries
• lessen the impacts on people when those injuries do happen�
The financial effect of this will be a better management of the outstanding claims liability (OCL), and increases in funding needed, for treatment injuries� An options paper is being developed based on the results of an evidence
review� The review investigated the effectiveness of financial and reputational incentives and regulations for providers and health systems in reducing patient harm and treatment injuries� While evidence is mixed for effectiveness, it’s clear that financial incentives are more likely to be effective if they’re aligned with reputational incentives and regulations�
This recommendation is still in progress, and has been held open for the coming year.
Work is underway on the incentive framework� ACC will need to partner with the health sector to implement this framework and we will close this recommendation when a plan for this has been agreed�
RECOMMENDATION 4 IN 2017 FCR – INJURY PREVENTION
Develop a medium- to long-term target for the intended overall impact on injury reduction as a result of ACC’s injury prevention activities� Ensure measurement of impact appropriately allows for broader benefits of injury prevention activities� [Responsibility: Chief Customer Officer]
Management actions:
In May 2018, the Board approved the Injury Prevention Strategy 2�0, which introduces a broader range of measures to improve confidence that injury prevention will have a meaningful impact in reducing the number and seriousness of injuries in New Zealand�
The Service Agreement 2018/19 introduces new measures for injury prevention relating to the:
• number of claims avoided from injury prevention programmes
• impacts that programmes have on rates of catastrophic injury (fatal and serious injury combined)�
Targets are in place for the next five years�
This recommendation is still in progress, and has been held open for the coming year.
It’s important that ACC sets targets that make a meaningful difference to New Zealand’s injury landscape� We’re pleased to see some progress in developing medium-term targets� We expect to see meaningful measures and targets established for the new Injury Prevention Strategy described in the How ACC operates and how it’s changing section�

ACCIDENT COMPENSATION CORPORATION10
These will need to reflect the risk profile of each of the four types of investment�
RECOMMENDATION 6 IN 2017 FCR – CLAIMS MANAGEMENT
Implement a formal regime, including the establishment of baselines, for monitoring and measuring the effectiveness of changes to claims management approaches, and the impact of changes to client supports provided, in improving client, operational and financial outcomes� [Responsibility: Chief Operating Officer/Chief Risk and Actuarial Officer/Chief Financial Officer]
Management actions:
There are a variety of areas where changes in the overall claims management approach or changes in the way supports are provided to clients are implemented� Depending on the nature and extent of the changes, different methods are used for monitoring the impacts on client, operational and financial outcomes�
Every business case that goes to the Board for approval includes an assessment of the impacts on the OCL and levies and appropriations�
For initiatives and changes to business-as-usual operations, the organisation is developing a process to help the business manage and track progress� ACC tracks project benefits and outcomes through a central repository� Close-out and end project reports ensure that the business realises project benefits when they’re handed over to regular activity�
With health service contractual changes, a business case is approved by the Board before implementation� Two mechanisms monitor the impacts on claims management when the contract changes are in place� These are:
• a post-implementation review to ensure the service is operating as expected
• a comparison of service costs against budget to ensure that service costs are as expected�
Initiatives coming from the Integrated Change Investment Portfolio (ICIP), specifically for the Health Services Strategy (HSS) and Next Generation Case Management (NGCM), are working to include measures that will assess and monitor longer-term client outcomes and the impacts on the OCL and levies�
For HSS projects, an initial trial or proof of concept is used to evaluate expected improvements in client outcomes� The trial evaluates if a project has realised expected benefits before it’s implemented more widely�
Changes coming through NGCM will be compared to a starting baseline to continuously assess the impacts of changes against expectations� This rigour will apply throughout the service design process through the delivery streams�
This recommendation is still in progress, and has been held open for the coming year.
Management has taken on board our recommendation that business cases proposing change be assessed against their impacts on sustained client outcomes through the impacts on the OCL and levies� But we haven’t yet seen the same approach when moving these changes into ‘business as usual’�
We’ve seen examples where increases in, or contractual changes to, services provided to clients are not regularly assessed for their results in providing better outcomes for clients – for example, when providing vocational rehabilitation services and purchasing capital equipment (see the Claim volumes, types and costs section for more detail)� The tracking of the effects of these investments on increased return-to-work rates and independence is not yet robust�
How effective a service is should be assessed by measuring if clients are getting better service and better outcomes, and if financial results are as they should be, given the objectives and expectations when the service was set up�
We believe the organisational changes to support improved outcomes for customers coming from the ICIP will provide this approach, assuming these disciplines are rolled out across the board and become the new business as usual�
We will close this recommendation when proposals from the ICIP for measuring the effectiveness of ACC’s delivery of claims management services have been agreed, along with plans for implementation� These must include disciplines around monitoring the client and financial outcomes of investments, such as the support for sensitive claims through the ISSC, providing vocational rehabilitation services and capital purchases�
FINANCIAL CONDITION REPORT 2018 11
Progress against recommendations
Recommendations expected to close in 2018/19
RECOMMENDATION 5 IN 2017 FCR – REVIEW CASES AND DECISIONS
Undertake analysis to identify the appropriate level of reviews that ACC should receive, given the complexity of the decisions made� Once this is established, appropriate actions should be identified to ensure that the number of reviews lodged is, and remains at, this level� [Responsibility: Chief Operating Officer]
Management actions:
In February 2018, a working group began to apply a ‘systems thinking’ approach to reviews� This included:
• mapping out the broader system within which disputed decisions sit
• further understanding review drivers
• working out an appropriate review number�
ACC’s claims and review processes need to be fair to clients, and this work is important in making sure that clients get the right services when they lodge claims�
The Ministry of Business, Innovation and Employment’s Government Centre for Dispute Resolution (GCDR) informed the working group that no ‘like comparison’ for reviews was available� Instead, a new Service Agreement measure was introduced in 2018/19� This measures the link between review applications and declined cover and entitlement decisions� As shown in the How ACC operates and how it’s changing section, the number of reviews lodged has been stationary, at around 7% of decline decisions made, for the past five years�
Without an available comparison, the working group is completing a self-assessment against best practice guidelines, working with the GCDR� This is in line with the approach the GCDR recommended� A findings report will be produced by March 2019, once the self-assessment against best practice guidelines is ready�
The review team is working with frontline staff when reviews are common in a particular area, to identify ways to improve the consistency of decisions� A recent example of this was the development of a decision tool for staff assessing when a hernia is caused by a personal injury�
The number of elective surgery requests that ACC declines has remained fairly stable, but the proportion of reviews of these decisions found in favour of clients is increasing� This should be a focus of the work to understand the drivers of reviews and what ACC can do to improve the quality and transparency of decisions and clinical advice�
This recommendation is ongoing, with actions planned that will likely mean it’s closed in the coming year.
We expect to close this recommendation when the results of the self-assessment against best practice are available and actions are in place for any improvements that may be needed�
RECOMMENDATION 5 IN 2016 FCR
Adjust rehabilitation performance measures to take account of changes in case mix, such as the age of the client and complexity of injury [Responsibility: Chief Operating Officer/Chief Risk and Actuarial Officer]
Management actions:
NGCM is reshaping, and improving, how ACC services clients� Central to this approach is clients following one of four streams in their interactions with ACC, depending on their injuries and their needs� These streams mean clients receive more appropriate services to meet their needs� This framework provides the opportunity for ACC to design appropriate measures for each stream, recognising the case mix within each�
The functionality needed to drill into rehabilitation performance will be provided as part of the organisation’s project to provide an analytics platform and capability�
This recommendation is ongoing, with actions planned that will likely mean it’s closed in the coming year.
We expect that NGCM’s performance indicators will take changes in case mix into account� Once the framework and systems to do this have been confirmed, we’ll close the recommendation�
ACCIDENT COMPENSATION CORPORATION12
Recommendations closed
RECOMMENDATION 2 IN 2017 FCR – WORK-RELATED GRADUAL PROCESS REVIEW
Review, and adjust where needed, the modelling and approaches for management of incurred, but not yet reported, work-related gradual process hearing loss and asbestos-related claims� This includes, but is not limited to, contract management, provider incentives, and understanding the potential for further exposure in the present work environment� [Responsibility: Chief Operating Officer/Chief Risk and Actuarial Officer]
Management actions:
The external valuation actuary has revised the work-related gradual process claim models� They have reduced the 30 June 2017 estimated liability for claims incurred but not yet reported� This reduction was mainly because of changed assumptions to reflect what has been happening with hearing loss claims: longer exposure periods, and a lower frequency of clients needing new hearing aids� The increase in liability from 30 June 2017 to 30 June 2018 due to numbers and costs of claims was small at less than 2%�
After the models were revised, ACC considered if it needed to change the way it managed hearing loss and asbestos-related claims�
ACC considers no change is needed for asbestos-related claims as it’s seen few changes in the claims rate� Also, no new trends in terms of exposure periods or location are evident�
Hearing loss claims are high, but have also stabilised� Overall, these clients have legitimate entitlements to hearing loss cover and benefit from ACC services�
WorkSafe has confirmed that a workplace noise programme is second on its target intervention list as part of its 10-year work-related health strategy� The programme aims to change how businesses and workers view and manage noise, by raising awareness of its potential health risks�
This recommendation has been closed.
RECOMMENDATION 3 IN 2017 FCR – CLAIMS EXPERIENCE
In the context of generally rising claims experience over a number of years, management should determine what further actions should be taken to improve claims experience, in order to reduce the pressure on funding requirements� [Responsibility: Chief Operating Officer/Chief Risk and Actuarial Officer/Chief Customer Officer]
Management actions:
We made this broadly worded recommendation as a response to claim volumes increasing across the Scheme�
Management identified three focus areas for improving claims management: care hours, capital costs, and weekly compensation� During 2017/18 actions reduced funding pressure in these areas and they’re now being monitored�
Taylor Fry, ACC’s external actuary, completed an assurance review of ‘managing drivers of OCL strain’� The review assessed how well ACC met good practice in OCL management at various levels� The review didn’t identify any major gaps in ACC’s practice�
Initiatives in the ICIP are expected to result in levy and OCL reductions� Some of these reductions have been included in the 2019/21 levy consultation and the two most recent Non-Earners’ appropriation requests�
If ACC can keep OCL increases down and support standards high, everyone benefits: clients through faster rehabilitation and improved independence, and levy and tax payers who fund the Scheme�
It’s difficult to be sure what good performance looks like for the Scheme� ACC provides a large, complex system of entitlements and is subject to external as well as internal drivers of performance� Although this year saw an OCL release, this followed four years of significant strain� We believe management should form a clearer view as to what level of OCL, or movement in the OCL, would reflect good performance, and design appropriate targets around this�
Management should consider setting such targets�
We’re happy that the recommendation has been addressed sufficiently�
This recommendation has been closed.

FINANCIAL CONDITION REPORT 2018 13
Progress against recommendations
RECOMMENDATION 6 IN 2016 FCR
Align reporting and management regimes in relation to claims performance with both operational and financial risks, in particular those identified by movements and trends in the OCL� [Responsibility: Chief Operating Officer/Chief Risk and Actuarial Officer/Chief Financial Officer]
Management actions:
ACC’s performance reporting tool (balanced scorecard) aims to give users a way to explore a range of key performance and operational measures� There is a range of measures across a number of domains to help give lead indicators of changes that could affect the OCL�
Performance indicators from NGCM are now being rolled out as part of business as usual and included in the scorecard in each stage of the project� They include separate measures for different client cohorts that may affect longer-term outcomes and the OCL in different ways�
The scorecard will assist management to understand the drivers of OCL variance and decide on actions to respond� These actions may include adjusting the scorecard to better align with longer-term outcomes and the OCL�
We’re satisfied that this recommendation has been addressed�
This recommendation has been closed.
RECOMMENDATION 7 IN 2016 FCR
Investigate the increases in long-term claims experience to identify an appropriate management response� [Responsibility: Chief Operating Officer/Chief Risk and Actuarial Officer]
Management actions:
A cross-organisation OCL working group investigated increases in older-accident-year claim volumes and costs� This involved identifying claim types where payments were higher than expected, what the drivers of this were, and what actions could be taken to improve the outcomes for these clients�
Five main claim types were identified where payments were higher than expected� These make up most of the increases seen� Some of these claim types are already being addressed through regular operational refinements� Management will oversee further identified actions, and improvements will be made to modelling for some claim types to better forecast the payments�
Further detail is included in the Claim volumes, types and costs section�
This recommendation has been closed.

14 ACCIDENT COMPENSATION CORPORATION
How
ACC
ope
rate
s an
d ho
w it
’s ch
angi
ngH
ow A
CC o
pera
tes
and
how
it’s
chan
ging
How ACC operates and how it’s changing
Summary• ACC is a unique scheme� Its purpose is to reduce injuries and to
rehabilitate and compensate injured people, while remaining affordable�
• As a Crown entity, ACC must operate openly, fairly and transparently� ACC management and leadership are accountable to a Board, and the Board’s accountable to the Minister for ACC�
• To perform better, ACC is transforming customer experiences� Change programmes within the Integrated Change Investment Portfolio (ICIP) strategy are designed to put the customer at the centre of everything ACC does� So far, financial results from the ICIP have been mixed� There was an improvement in claims processed per full-time equivalent employee� However, there was an increase in average weekly compensation days paid� If the programme is to deliver on its expected financial benefits, this needs to improve�
• Costs, benefits and other support structures for the next phase of the ICIP are under review� To fully succeed, the transformation needs to focus on where the main benefits will be realised� Levy and appropriation requests include the expected benefits of the ICIP, but these are tracking behind projections at this time� If these savings aren’t made, larger increases will be included in future recommendations� The organisation needs to pay close attention to results and make sure the programme delivers for customers�
• ACC did more to prevent injuries in 2017/18� It achieved a return on investment of $1�72 for every $1 spent� Injury prevention helps to reduce levies and appropriations�
• The Board has approved a new Injury Prevention Strategy� This is expected to increase spending substantially and lead to improved outcomes� We expect some programmes to have higher risks of failure� To make sure that overall injury prevention targets are met, these programmes will need to target higher returns�
• New Zealand’s return-to-work rates continue to compare favourably with Australia’s based on the survey conducted by Safe Work Australia�

FINANCIAL CONDITION REPORT 2018 15
How ACC operates and how it’s changing
• There has been progress on our previous recommendation to identify how to improve decision-making and clinical advice to reduce the number of reviews of ACC decline decisions� This recommendation is expected to be closed this year�
• The number of elective surgery requests that ACC declines has remained fairly stable, but the proportion of reviews of these decisions found in favour of clients is increasing� This should be a focus of the work to understand the drivers of reviews and what ACC can do to improve the quality and transparency of decisions and clinical advice�

ACCIDENT COMPENSATION CORPORATION16
How ACC operates and is accountable
ACC has three core functionsACC is the Crown entity set up by the Accident Compensation Act 2001� The Scheme provides no-fault personal injury cover to all New Zealanders, and overseas visitors to New Zealand�
The Scheme has three core functions:
1� Help people to stay safe and not injure themselves, or lessen the impacts on people when injuries do happen�
2� Rehabilitate and compensate people after they’ve been injured and help them to become independent again�
3� Make sure the Scheme is affordable and sustainable�
And a clear governance, management and monitoring structure.As a Crown entity ACC has a governance board, appointed by the Minister for ACC� The Board delegates day-to-day management and leadership to the Chief Executive� Each year the Minister and the Board agree on performance targets�
The Ministry of Business, Innovation and Employment (MBIE) and the New Zealand Treasury monitor ACC� MBIE oversees policy and the Treasury monitors performance and Board appointments for the Minister�
ACC is accountable through the Board to the Minister� More details are in ACC’s:
• Statement of Intent 2018-2022
• Service Agreement 2018/19
• Annual Report 2018�
ACC covers a wide range of injuriesEvery year around one-third of New Zealanders are injured and lodge claims with ACC� About 90% of injuries are minor; people only need medical treatment, and recover quickly� At the other extreme, a few hundred people every year are badly injured� Their injuries leave them permanently
impaired� These seriously injured people usually require social rehabilitation support, such as home or nursing care, to various levels throughout their lives�
ACC financially supports medical treatment and rehabilitation for clients covered by the Scheme� It also compensates earners for loss of income as they recover, or their dependants if they die� The Scheme also covers mental injuries in certain situations� Injured children receive compensation for loss of potential earnings if they remain incapacitated from when they turn 18, and in other specific circumstances�
ACC operates five accounts� Each is designed to align how it is funded with where injury risks lie� Those funding each account bear its risks and rewards�
And sometimes it’s difficult to determine if a claim should be covered.If a person has an accident, they could be entitled to more under ACC than would be available if they suffered an illness� Sometimes it’s difficult to assess if a person’s incapacity resulted solely from an accident� For example, when someone injures their shoulder, is the damage caused by the accident or was the damage already there because of ageing or another health condition?
In previous Financial Condition Reports (FCRs) we’ve made recommendations about the consistency and objectivity of decision-making on whether a condition should be covered by ACC, the wider health sector, or both�
In response, ACC has identified policy options� Proposals in the ICIP will develop and implement these options further� It is important that a target date is set for implementing these options�

FINANCIAL CONDITION REPORT 2018 17
How ACC operates and how it’s changing
ACC’s risk conversation is maturingThe enterprise risk conversations at executive and Board levels matured during 2017/18 with a focus on enterprise risks relating to strategic intentions and management’s response to the risks�
Overall, ACC made acceptable progress in risk maturity during the year� The ‘Five Lines of Assurance’ model was implemented� The Board developed risk appetite statements� Operational and change management risk functions strengthened�
And now embedding the changes needs to be the focus.It’s important that ACC continues to embed and own its risk management practice� While going through a change process, it needs a heightened awareness of risk�
In the coming year, continued executive support and commitment to owning risk management is needed� Also important are clarifying roles and responsibilities, implementing the risk management technology solution, implementing a strong risk appetite, developing an enterprise incident and issue framework and continuing with the compliance work plan� The Risk and Compliance Office needs to help the business to embed the maturity activities�

ACCIDENT COMPENSATION CORPORATION18
Changes ACC is facing
Government priorities and the SchemeThe Government has priorities for ACC for the next three years� It wants more effective support, fairer compensation and better rehabilitation�
Specifically, the Government has:
• progressed regulatory changes to increase ACC funding contributions for treatment� These changes include a general increase in contribution rates, and targeted increases for Community Service Card holders and children aged 13 years and under�
• introduced an Accident Compensation Amendment Bill, which proposes targeted changes to cover and entitlement eligibility (for example, removing requirements for clients to elect between ACC weekly compensation and New Zealand Superannuation)�
The ICIP is transforming ACCACC launched the Shaping Our Future strategy in 2014� This is the strategy to improve customer outcomes and improve New Zealanders’ overall trust and confidence in ACC� The strategy aims to put customers at the centre of everything ACC does by creating a more transparent, modern and efficient organisation�
In April 2018, the Board agreed to a new approach to delivering the strategy� The approach, known as the ICIP, still has the customer at the centre but its scope is broader� ACC has added more organisational changes to the ICIP to support improved return-to-work and return-to-independence outcomes for clients and greater operational resilience and efficiency� The expected cost of the transformation is $669 million over the years 2015 to 2022�
And it’s showing some improvements in customer experience.The ICIP is delivering, although generally more around customer experience than in improved claim outcomes and financial performance� ACC is seeing results through the implementation of enhancements such as:
• a simplified weekly compensation process
• a national rollout of a text alert system to let clients know when their medical certificates are due to expire
• the launch of the MyACC product, which enables clients to interact with ACC through a digital service
• an upgrade of ACC’s website, acc.co.nz, to improve clients’ access to information online
• simplified levy invoices and a new levy management system, which will allow more digital interactions by customers�
Measuring the performance of the ICIPThe ICIP performance targets and results for 2017/18 are shown in Table 1 below, and can be found in the Annual Report 2018� While not all targets were met this year, results improved in four of the six key measures� However, there was an increase in average weekly compensation days paid where a decrease was expected� If the programme is to deliver on its expected financial benefits, this needs to improve�

FINANCIAL CONDITION REPORT 2018 19
How ACC operates and how it’s changing
Table 1 – Transformation performance measures
Performance measureActual
2016/17Target
2017/18Actual
2017/18
Claims processed per full-time equivalent employee 572 582 593
Reduction in average weekly compensation days paid −0.9 days 0.3 days −1.5 days
Client net trust score 23 26.5 25
Business customer net trust score −35 −31 −19
Provider net trust score −11 −7.1 −8
Employee net promoter score −3 1.5 −6
The early stages have focused on improving the client experience and administration efficiency� Two major pieces of work, the Next Generation Case Management (NGCM) initiative and the Health Services Strategy (HSS), are at the start of a longer-term development process, where client initiatives are expected to deliver large financial benefits as a result of improved outcomes� Even though these projects are in the early stages, ACC has included some levy and appropriation reductions from the ICIP in the latest calculations, as discussed in the How ACC services are funded section� As the projects start focusing on more complex claims, there may be further reductions in levies and Government appropriations� On the other hand, if the ICIP doesn’t deliver planned benefits, levies and appropriations will need to increase more in the future than we are forecasting�
Initial results from NGCM are becoming clearNGCM aims to fundamentally redesign ACC’s case management model� The new service model has been trialled with clients and providers for the past year in Hamilton and, more recently, Hawke’s Bay, with more than 18,000 claims processed� Client experience scores are strong, with pleasing commentary around understanding client needs, the availability of claims staff, and the transparency of claim processes�
The introduction of more efficient and automated processes will mean that case owners are able to spend less time on administrative tasks� Clients benefit by having the opportunity to interact with ACC via self-serve digital options at times and locations that suit them�
Indications from the trial are that the proposed model will deliver faster and easier services, with better recovery times because clients access the right type of support sooner� Results show greater consistency, greater accuracy and evidence-based decision-making�
Improvements in the efficiency of processes and systems are measured by average weekly compensation days paid, rehabilitation spend and claims per full-time equivalent employee� While not all measures have improved, they all compare favourably to similar cohorts of claims being managed within ACC’s standard case management processes�
The HSS’s goal is to transform relationships with providersThe HSS aims to move ACC on from just reimbursing providers and having transactional relationships with them� Instead, ACC intends to collaborate with providers and incentivise them to get the best possible client outcomes�
The HSS works with providers (primary care providers, specialists, district health boards [DHBs] and home care services) to support clients to recover more quickly and effectively from their injuries� Work with DHBs aims to improve patient flow by changing discharge processes and ensuring that clients are well supported in the right settings of care�
ACCIDENT COMPENSATION CORPORATION20
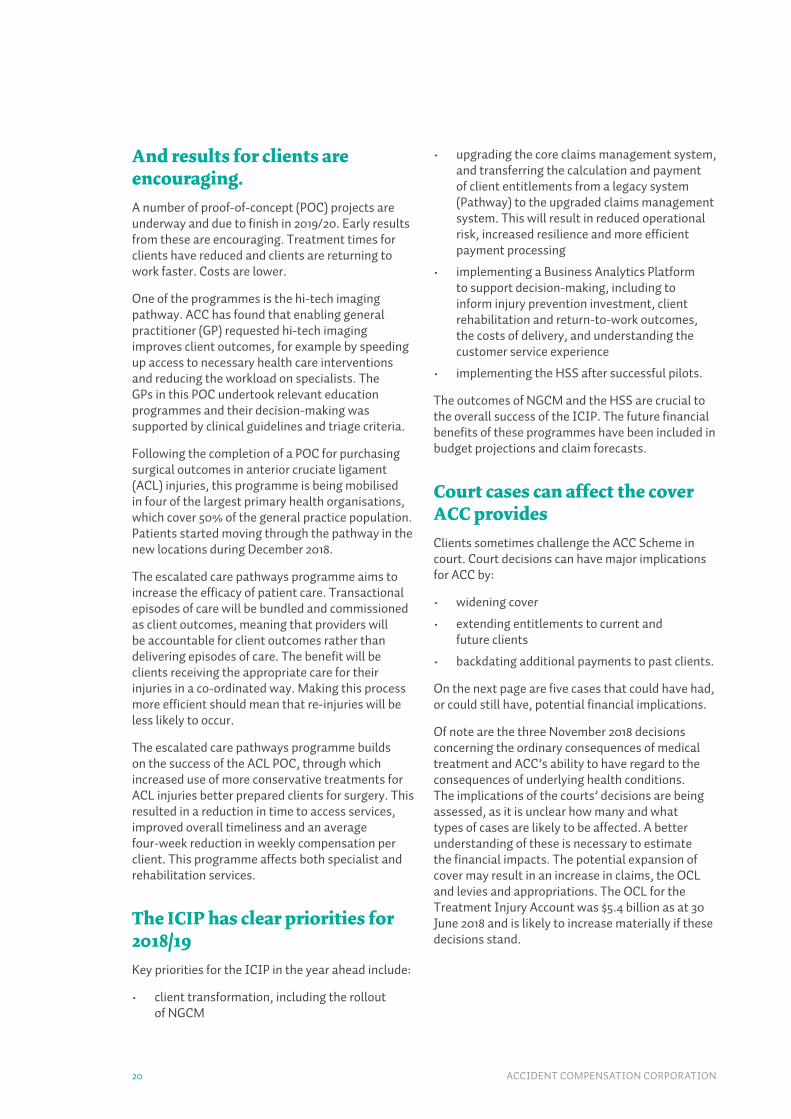
And results for clients are encouraging.A number of proof-of-concept (POC) projects are underway and due to finish in 2019/20� Early results from these are encouraging� Treatment times for clients have reduced and clients are returning to work faster� Costs are lower�
One of the programmes is the hi-tech imaging pathway� ACC has found that enabling general practitioner (GP) requested hi-tech imaging improves client outcomes, for example by speeding up access to necessary health care interventions and reducing the workload on specialists� The GPs in this POC undertook relevant education programmes and their decision-making was supported by clinical guidelines and triage criteria�
Following the completion of a POC for purchasing surgical outcomes in anterior cruciate ligament (ACL) injuries, this programme is being mobilised in four of the largest primary health organisations, which cover 50% of the general practice population� Patients started moving through the pathway in the new locations during December 2018�
The escalated care pathways programme aims to increase the efficacy of patient care� Transactional episodes of care will be bundled and commissioned as client outcomes, meaning that providers will be accountable for client outcomes rather than delivering episodes of care� The benefit will be clients receiving the appropriate care for their injuries in a co-ordinated way� Making this process more efficient should mean that re-injuries will be less likely to occur�
The escalated care pathways programme builds on the success of the ACL POC, through which increased use of more conservative treatments for ACL injuries better prepared clients for surgery� This resulted in a reduction in time to access services, improved overall timeliness and an average four-week reduction in weekly compensation per client� This programme affects both specialist and rehabilitation services�
The ICIP has clear priorities for 2018/19Key priorities for the ICIP in the year ahead include:
• client transformation, including the rollout of NGCM
• upgrading the core claims management system, and transferring the calculation and payment of client entitlements from a legacy system (Pathway) to the upgraded claims management system� This will result in reduced operational risk, increased resilience and more efficient payment processing
• implementing a Business Analytics Platform to support decision-making, including to inform injury prevention investment, client rehabilitation and return-to-work outcomes, the costs of delivery, and understanding the customer service experience
• implementing the HSS after successful pilots�
The outcomes of NGCM and the HSS are crucial to the overall success of the ICIP� The future financial benefits of these programmes have been included in budget projections and claim forecasts�
Court cases can affect the cover ACC providesClients sometimes challenge the ACC Scheme in court� Court decisions can have major implications for ACC by:
• widening cover
• extending entitlements to current and future clients
• backdating additional payments to past clients�
On the next page are five cases that could have had, or could still have, potential financial implications�
Of note are the three November 2018 decisions concerning the ordinary consequences of medical treatment and ACC’s ability to have regard to the consequences of underlying health conditions� The implications of the courts’ decisions are being assessed, as it is unclear how many and what types of cases are likely to be affected� A better understanding of these is necessary to estimate the financial impacts� The potential expansion of cover may result in an increase in claims, the OCL and levies and appropriations� The OCL for the Treatment Injury Account was $5�4 billion as at 30 June 2018 and is likely to increase materially if these decisions stand�

FINANCIAL CONDITION REPORT 2018 21
How ACC operates and how it’s changing
LONG-TERM WEEKLY COMPENSATION FOR INCAPACITY
Case Issue before the courts Why this is important
What the courts decided What this means
Crothers v ACC
Mr Crothers is a self-employed farmer who injured his hand in 2010. This affected his hand grip.
Can a client’s incapacity be reduced by adapting their workplace, so they’re more able to work?
If a client is incapacitated, they receive ACC weekly compensation.
ACC stopped Mr Crother’s weekly compensation in late 2011. This was because ACC believed he could return to farming with the help of a new all-terrain vehicle.
When ACC can provide support that helps a client return to work sooner, it will lead to better client and financial outcomes.
The District Court, High Court and Court of Appeal upheld ACC’s decision.
ACC can still apply its ‘reasonable adaptation’ test.
So ACC can stop a client’s weekly compensation if adapting their workplace has improved their capacity to work.
BACKDATING COMPENSATION AND REHABILITATION PLANS
Case Issue before the courts Why this is important
What the courts decided What this means
ACC v Terry Is a rehabilitation plan needed when ACC backdates weekly compensation for a specific period when the client may have already returned to work?
Would the court’s ruling mean that ACC needs to prepare a rehabilitation plan for a backdated period even if the client is back at work? Does this also mean weekly compensation should be paid until the plan has been completed? This could mean levy payers have to fund compensation paid to a client for a period when they were back at work.
The High Court decided a rehabilitation plan was needed. This was even though the period to which the compensation related had long passed.
ACC appealed this to the Court of Appeal. In December 2018 the Court found in ACC’s favour. It determined that ACC is not required to assess a client’s vocational rehabilitation needs when assessing claims for backdated weekly compensation.
Following a decision from the Court, ACC has clarification on exactly when a rehabilitation plan is required.
ACCIDENT COMPENSATION CORPORATION22
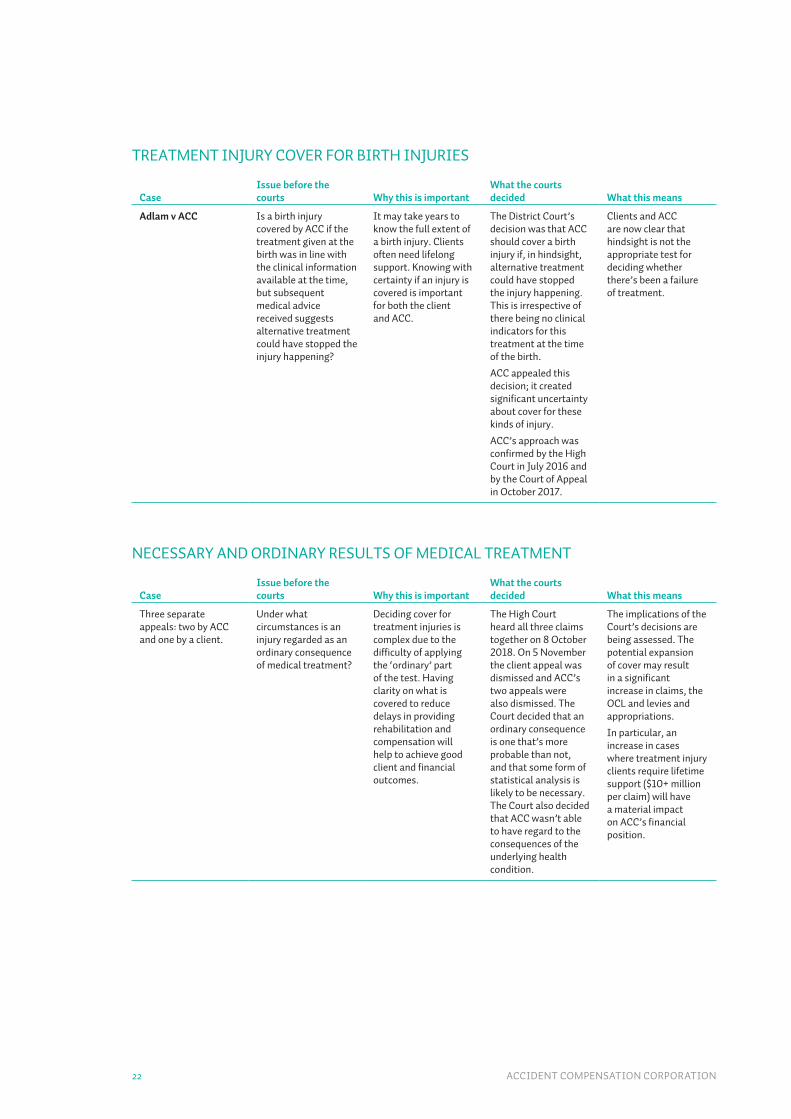
TREATMENT INJURY COVER FOR BIRTH INJURIES
Case Issue before the courts Why this is important
What the courts decided What this means
Adlam v ACC Is a birth injury covered by ACC if the treatment given at the birth was in line with the clinical information available at the time, but subsequent medical advice received suggests alternative treatment could have stopped the injury happening?
It may take years to know the full extent of a birth injury. Clients often need lifelong support. Knowing with certainty if an injury is covered is important for both the client and ACC.
The District Court’s decision was that ACC should cover a birth injury if, in hindsight, alternative treatment could have stopped the injury happening. This is irrespective of there being no clinical indicators for this treatment at the time of the birth.
ACC appealed this decision; it created significant uncertainty about cover for these kinds of injury.
ACC’s approach was confirmed by the High Court in July 2016 and by the Court of Appeal in October 2017.
Clients and ACC are now clear that hindsight is not the appropriate test for deciding whether there’s been a failure of treatment.
NECESSARY AND ORDINARY RESULTS OF MEDICAL TREATMENT
Case Issue before the courts Why this is important
What the courts decided What this means
Three separate appeals: two by ACC and one by a client.
Under what circumstances is an injury regarded as an ordinary consequence of medical treatment?
Deciding cover for treatment injuries is complex due to the difficulty of applying the ‘ordinary’ part of the test. Having clarity on what is covered to reduce delays in providing rehabilitation and compensation will help to achieve good client and financial outcomes.
The High Court heard all three claims together on 8 October 2018. On 5 November the client appeal was dismissed and ACC’s two appeals were also dismissed. The Court decided that an ordinary consequence is one that’s more probable than not, and that some form of statistical analysis is likely to be necessary. The Court also decided that ACC wasn’t able to have regard to the consequences of the underlying health condition.
The implications of the Court’s decisions are being assessed. The potential expansion of cover may result in a significant increase in claims, the OCL and levies and appropriations.
In particular, an increase in cases where treatment injury clients require lifetime support ($10+ million per claim) will have a material impact on ACC’s financial position.
FINANCIAL CONDITION REPORT 2018 23
How ACC operates and how it’s changing
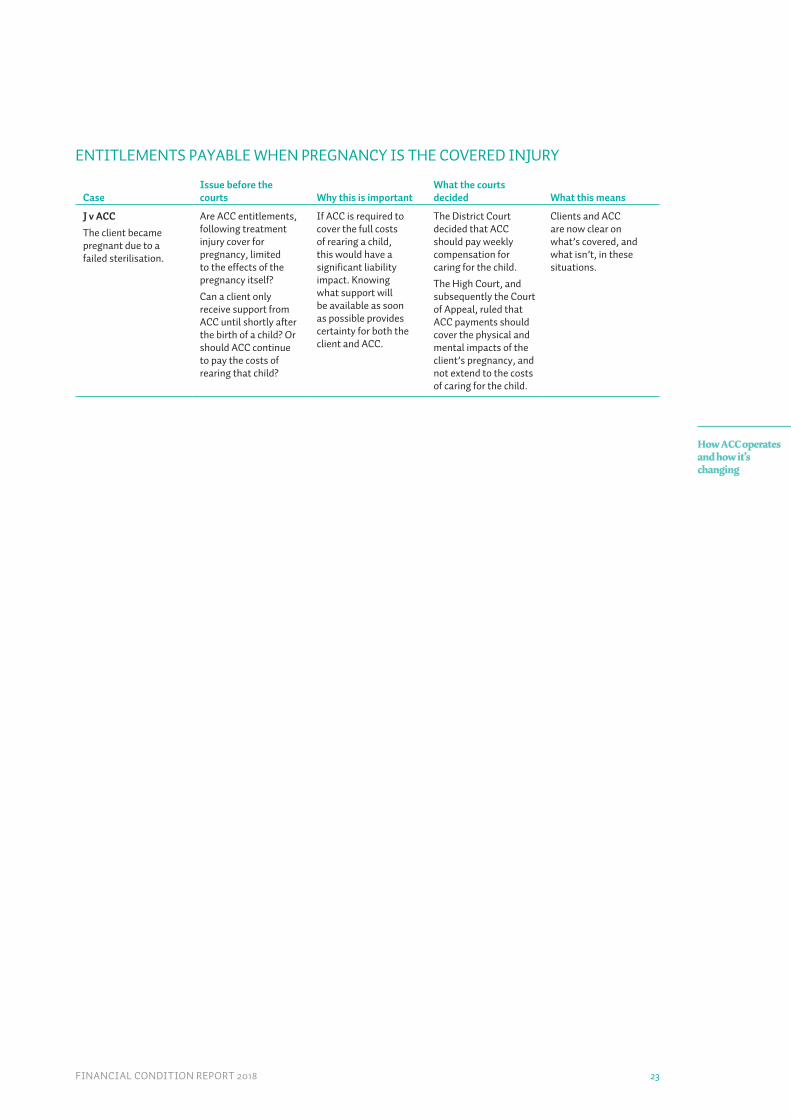
ENTITLEMENTS PAYABLE WHEN PREGNANCY IS THE COVERED INJURY
Case Issue before the courts Why this is important
What the courts decided What this means
J v ACC
The client became pregnant due to a failed sterilisation.
Are ACC entitlements, following treatment injury cover for pregnancy, limited to the effects of the pregnancy itself?
Can a client only receive support from ACC until shortly after the birth of a child? Or should ACC continue to pay the costs of rearing that child?
If ACC is required to cover the full costs of rearing a child, this would have a significant liability impact. Knowing what support will be available as soon as possible provides certainty for both the client and ACC.
The District Court decided that ACC should pay weekly compensation for caring for the child.
The High Court, and subsequently the Court of Appeal, ruled that ACC payments should cover the physical and mental impacts of the client’s pregnancy, and not extend to the costs of caring for the child.
Clients and ACC are now clear on what’s covered, and what isn’t, in these situations.
ACCIDENT COMPENSATION CORPORATION24
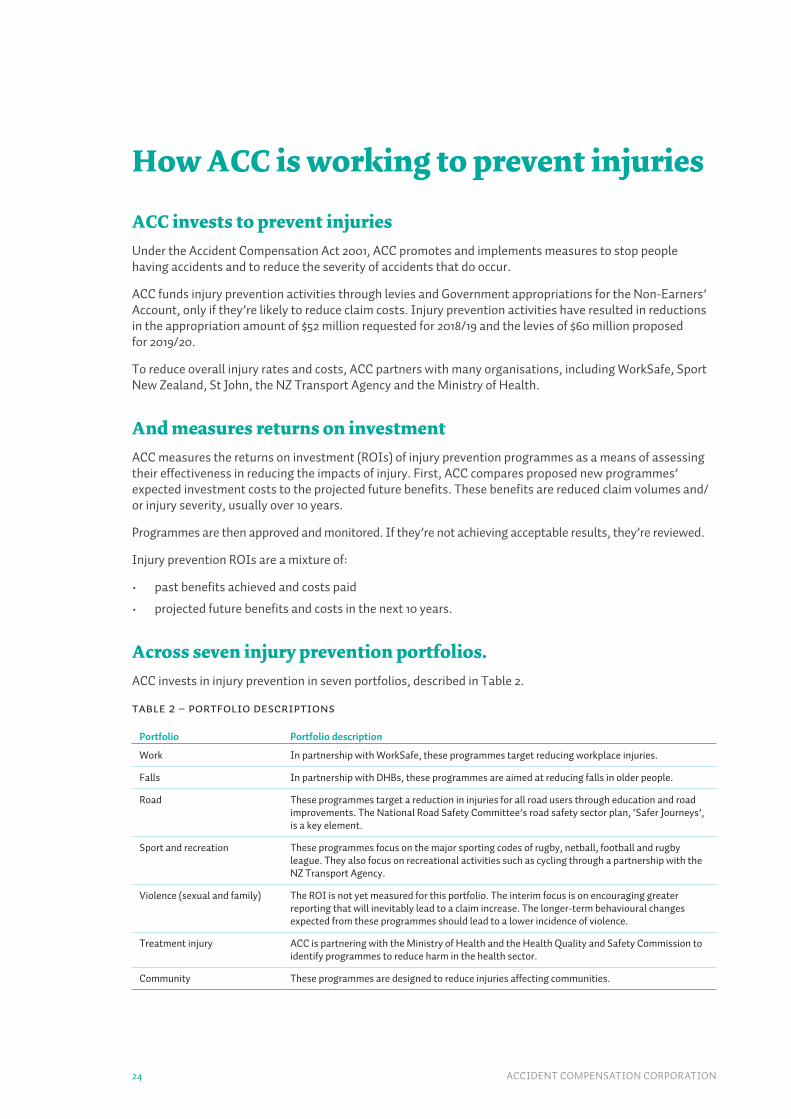
How ACC is working to prevent injuries
ACC invests to prevent injuriesUnder the Accident Compensation Act 2001, ACC promotes and implements measures to stop people having accidents and to reduce the severity of accidents that do occur�
ACC funds injury prevention activities through levies and Government appropriations for the Non-Earners’ Account, only if they’re likely to reduce claim costs� Injury prevention activities have resulted in reductions in the appropriation amount of $52 million requested for 2018/19 and the levies of $60 million proposed for 2019/20�
To reduce overall injury rates and costs, ACC partners with many organisations, including WorkSafe, Sport New Zealand, St John, the NZ Transport Agency and the Ministry of Health�
And measures returns on investmentACC measures the returns on investment (ROIs) of injury prevention programmes as a means of assessing their effectiveness in reducing the impacts of injury� First, ACC compares proposed new programmes’ expected investment costs to the projected future benefits� These benefits are reduced claim volumes and/or injury severity, usually over 10 years�
Programmes are then approved and monitored� If they’re not achieving acceptable results, they’re reviewed�
Injury prevention ROIs are a mixture of:
• past benefits achieved and costs paid
• projected future benefits and costs in the next 10 years�
Across seven injury prevention portfolios.ACC invests in injury prevention in seven portfolios, described in Table 2�
Table 2 – Portfolio descriptions
Portfolio Portfolio description
Work In partnership with WorkSafe, these programmes target reducing workplace injuries.
Falls In partnership with DHBs, these programmes are aimed at reducing falls in older people.
Road These programmes target a reduction in injuries for all road users through education and road improvements. The National Road Safety Committee’s road safety sector plan, ‘Safer Journeys’, is a key element.
Sport and recreation These programmes focus on the major sporting codes of rugby, netball, football and rugby league. They also focus on recreational activities such as cycling through a partnership with the NZ Transport Agency.
Violence (sexual and family) The ROI is not yet measured for this portfolio. The interim focus is on encouraging greater reporting that will inevitably lead to a claim increase. The longer-term behavioural changes expected from these programmes should lead to a lower incidence of violence.
Treatment injury ACC is partnering with the Ministry of Health and the Health Quality and Safety Commission to identify programmes to reduce harm in the health sector.
Community These programmes are designed to reduce injuries affecting communities.

FINANCIAL CONDITION REPORT 2018 25
How ACC operates and how it’s changing
Table 3 compares 2016/17 and 2017/18 ROIs by portfolio� Investments and benefits are broken down into past and future projected periods� All costs for programmes that stop before they’ve reached their planned end are included in the respective portfolios’ and overall ROIs� They include any that are stopped in development before reaching delivery� The changes from 2016/17 to 2017/18 in amounts identified as ‘past’ reflect the additional year of investment costs paid and benefits achieved�
Table 3 – Injury prevention portfolio return on investment for all programmes in delivery as at 30 June 2018
Year ending 30 June 2017 Year ending 30 June 2018$M Past Projected Total
ROIPast Projected Total
ROIPortfolio Investment Benefit Investment Benefit Investment Benefit Investment Benefit
Work 12.8 5.3 1.8 12.2 $1.20 20.1 8.8 2.6 17.8 $1.17
Falls 10.3 3.3 30.8 78.7 $1.99 30.4 6.1 13.2 75.9 $1.88
Road 35.2 48.3 0.7 10.1 $1.63 48.1 60.7 11.7 56.2 $1.96
Sport and Recreation 25.3 46.5 6.2 28.7 $2.39 35.9 87.8 7.6 30.9 $2.72
Violence (sexual and family)
12.3 N/A 4.9 N/A N/A 24.2 N/A 0.0 N/A N/A
Treatment Injury 4.2 0.0 6.6 18.5 $1.71 11.6 0.0 6.2 43.3 $2.43
Community 4.0 0.0 4.6 9.1 $1.07 16.7 0.0 2.3 9.2 $0.48
Total 104.0 103.4 55.6 157.3 $1.63 187.1 163.4 43.6 233.2 $1.72
The injury prevention ROI was above target for 2017/18The projected overall ROI for 2017/18 was $1�72 for every $1 spent� This was slightly above the $1�70 target, and higher than the 2016/17 ROI of $1�63� For 2018/19 the target increased to $1�80� During 2017/18 an estimated 11,000 injuries were prevented�
In general, investment in injury prevention occurs at the beginning of a programme’s lifespan, while benefits are realised over a longer period� This explains the lower returns for amounts identified as ‘past’ in Table 3�
Some programmes are expected to earn less than the target ROIs� For example, ACC collaborates with WorkSafe on workplace injury prevention and invests in programmes that are intended to meet WorkSafe’s lower target ROI of $1�10� WorkSafe is expected to increase its target ROI to ACC’s target within 10 years� ACC intends to increase its investment in WorkSafe to $15 million per year, up to two-thirds of the total Work portfolio� This is likely to decrease ACC’s overall ROI� As a result, other initiatives will need ROIs higher than $1�80 in 2018/19 to make sure the overall portfolio meets this target�
The Community portfolio ROI decreasedThe ROI for Community portfolio programmes decreased significantly, from $1�07 to $0�48� This portfolio includes more complex areas requiring innovative solutions, with limited success to date� Development costs for several programmes moved into the ROI this year, as they’re unlikely to be implemented� These largely drove the ROI reduction� This portfolio has several programmes aimed at children, with an estimated benefit of $10 million for $8 million of investment, which is below the overall target of $1�80� Under the new strategy described below, this portfolio will need to target higher returns given that it will likely fall under the innovation investment area�

ACCIDENT COMPENSATION CORPORATION26
But the Road portfolio ROI increased significantly.The ROI for the Road portfolio increased significantly, from $1�63 to $1�96� Two programmes contributed to this ROI increase:
1� The motorcyclist training programme, Ride Forever, had an estimated benefit of $4 million this year and proved to be effective� That’s why ACC approved an additional investment of $7 million for future years� This will achieve estimated benefits of $38 million from an estimated 1,090 fewer injuries� At 30 June 2018, just over 18,000 people had been through the course� An estimated 200 injuries were prevented during 2017/18�
2� This year ACC partnered with the NZ Transport Agency to implement Drive, an online programme for new and young drivers� The programme expects to spend $4�3 million in the future for an estimated return of $13 million� This will come from an estimated 590 fewer injuries� This support is essential for young drivers� Their crash risk is highest in their first year of driving, particularly in the first six months of driving solo or unsupervised�
Several sport injury prevention programmes performed better than expectedThe ROI for sport injury prevention programmes increased substantially, from $2�39 to $2�72� Several existing programmes performed above expectations this year� Netball, football and rugby union returned $16 million in claim savings against a cost of $5 million�
ACC approved new netball, rugby league and touch programmes with an estimated return of $7�4 million on $3�6 million invested�
ACC isn’t measuring the Violence portfolio’s ROI yetThe Violence portfolio introduced programmes targeting family violence and abuse� ACC hasn’t measured this portfolio’s ROI yet� Two examples of programmes in this portfolio are:
• Mates and Dates, an initiative in secondary schools to promote respectful relationships between young people and an understanding of the behaviours that underpin violence
• a national Pasifika injury prevention action plan and Pasifika Spearhead service to achieve meaningful and relevant change for young Pasifika people in New Zealand� This focuses on the primary prevention of family violence, sexual violence and suicidal behaviour among young Pasifika people and in Pasifika communities�
The Violence programmes are focusing in the short term on encouraging more people to report violence� This will inevitably lead to more people making claims before any results from prevention activities are seen�
A surgical injury prevention programme is being extendedNetworkZ has increased the Treatment Safety portfolio’s ROI� NetworkZ, previously known as MORSim, is a surgical injury prevention programme� It uses clinical simulations to train surgical teams in how to reduce perioperative harm� The University of Auckland delivers it, supported by the Health Quality and Safety Commission�
ACC originally approved NetworkZ in 2016 to be rolled out to 10 DHBs with an estimated ROI of $0�81� 2017/18 funding extended the programme to the remaining 10 DHBs� After its initial phase, the programme shifted focus to the types of surgery more likely to lead to severe treatment injury, so ACC expects the ROI to increase from $0�81 to $2�97� Additionally, by reaching all DHBs, NetworkZ can have a greater influence on reducing the number of New Zealanders with serious treatment injuries�

FINANCIAL CONDITION REPORT 2018 27
How ACC operates and how it’s changing
ACC has a new Injury Prevention StrategyThis year the Board endorsed a new Injury Prevention Strategy� The aim is to create a long-term and sustainable reduction in harm, and improve the wellbeing of New Zealanders� This will be done by:
• broadening the scope
• accelerating the speed at which programmes become effective and can be scaled up to increase their impacts
• investing in innovative initiatives delivering greater benefits�
In the past ACC designed programmes to prevent particular types of injury� The new strategy aims to focus on people and how their injury risks change over their lifetimes� ACC will be accessing new data sources, such as the Integrated Data Infrastructure and National Minimum Dataset, to focus on people at the highest risk of injury�
As the new strategy is implemented, spending is expected to increase substantially from the $80 million budgeted annually for 2018/19 to 2021/22 as shown in Table 11 in the Financial results section�
That will consider four ways of investing in injury prevention.There will be a greater focus on innovation in injury prevention, with four areas of investment: Innovation, Strategic, Infrastructure and Core�
INNOVATION
Innovation explores new approaches to reducing injuries� These often have a reasonable chance of high returns, offset by higher-than-usual risks of failing� The new strategy will have clear rules to dictate what can, and can’t, get Innovation funding to reduce risk� These rules need to ensure that programmes are either implemented or exited in a reasonable amount of time�
STRATEGIC
Strategic funds programmes with long-term effects� For example, a long time is needed to bring about change to alcohol-related injuries resulting from a New Zealand culture of alcohol abuse� Because benefits won’t be seen for some time, ACC needs to have some interim, short-term measures of success for these programmes� Each programme needs these specific measures in place before it’s introduced�
INFRASTRUCTURE
Infrastructure invests in people and system tools to ensure that staff are capable and tools work effectively to prevent injuries�
CORE
The Core fund will continue to invest in effective short- to medium-term injury prevention interventions�
Some new injury prevention targets are in placeWe recommended in the 2015 FCR that ACC develop medium- to long-term targets for the overall impacts of injury prevention� The Service Agreement 2018/19 introduced new impact measures with targets for the next four years� These are in addition to the increased target for the overall ROI�
The entire injury prevention portfolio aims to reduce claim volumes by 11,000 to 15,000 each year for the next four years� ACC also expects serious injury rates to drop from 74�3 to 72�5 per 100,000 claims�
As part of developing measures aligned to the new strategy, it will be important that consideration is given to the risk profile of each investment area� For example, we would expect programmes coming through the innovation area to have higher risks of failure� To make sure that overall injury prevention targets are met, these types of programme will need to target higher returns� Our 2015 recommendation is still open�

ACCIDENT COMPENSATION CORPORATION28
Rehabilitation is an important role
ACC aims for client independenceThe claims management process aims to deliver high-quality outcomes for injured people by rehabilitating them back to work and/or independent living where possible� When people can’t be fully rehabilitated, ACC aims to provide ongoing support to allow them to be as independent as possible�
And achieves favourable return-to-work rates.ACC benchmarks its return-to-work performance against Australian workers’ compensation schemes� It compares results from the Safe Work Australia Return to Work Survey with a comparable survey of ACC clients�
Graph 1 shows the New Zealand return-to-work rate compared to the Australian schemes’ national trends since 2002� Safe Work Australia and ACC calculate this by surveying clients who had been injured at work seven to nine months prior to the interview, and who had had 10 or more days off work� The return-to-work rate is the proportion of clients who were back at work at the time of the survey�
Graph 1 – Return-to-work rates
Retu
rn-t
o-w
ork
rate
(%)
200
8
200
7
200
6
200
5
200
4
200
3
200
2
200
9
2010
2011
2012
2013
2014
2015
2016
2017
2018
50
60
70
80
90
100
Year of survey New Zealand Australia
Over time, New Zealand’s return-to-work rate has been generally higher than Australia’s� The 2018 result of 80% was 3% higher than the Australian average of 77%� It was also above the 2018 target of 78%�

FINANCIAL CONDITION REPORT 2018 29
How ACC operates and how it’s changing
Seriously injured clients achieve their independence goalsSeriously injured clients generally require support for the rest of their lives� ACC measures success by how independent they can become� These clients set self-directed independence goals every six months� They assess their progress using a four-point scale: not achieved, partially achieved, achieved, and achieved beyond expectations�
Graph 2 shows that more clients have achieved goals at or beyond expectations� These have trended steadily upwards, from 69% in 2012/13 to 79% in 2015/16, and have remained relatively stable for the past two years�
Graph 2 – Trends in client goal achievement since 2011/12
2012
2013
2014
2015
2016
2017
2018
0
10
20
30
40
50
60
70
80
90
100
Year ending 30 June
Achieved beyond expectations Achieved Partially achieved Not achieved
% o
f ser
ious
inju
ry c
lient
s
Serious injury staff have been upskilled to better help clientsSerious injury staff attended training workshops in the first half of 2016/17� Their focus was on achieving better outcomes for clients� Improvements made after the training continued into 2017/18� Three improvements were:
• completed support needs assessment referrals for the year were above target� These are vital for serious injury staff to identify client needs� Staff also now use a new competency framework for assessing clients for their support needs
• serious injury staff were trained to link capital purchases to expected client outcomes� Purchasing guidelines for capital spending are also under review to ensure that all clients are being treated consistently and fairly
• attendant care hours reduced by 3% in 2017/18 with no material change to client goal achievement results� This contributed to a reduction in the OCL of around $100 million (0�7% of the OCL for serious injury attendant care)� This is a good example of good outcomes for clients delivering improved financial (and therefore levy and tax payer) outcomes�

ACCIDENT COMPENSATION CORPORATION30
Supporting people with sensitive claims is a vital serviceACC provides a critical service for thousands of sexual violence survivors every year�
Graph 3 shows that new claim growth continues to be high since the introduction of the Integrated Services for Sensitive Claims (ISSC), with a rolling 12-month growth rate of 17�4%�
Graph 3 – Number of new sensitive claims lodged
0
500
1,000
1,500
2,000
2,500
Sep
12
Dec
12
Sep
13
Sep
14
Sep
15
Sep
16
Dec
14
Dec
15
Dec
16
Mar
13
Mar
14
Mar
15
Mar
16
Mar
17
Jun
17
Sep
17
Dec
17
Mar
18
Jun
13
Jun
14
Jun
15
Jun
16
Jun
18
Lodgement quarter
Dec
13
Introduction of ISSC
Num
ber o
f sen
sitiv
e cl
aim
s lo
dged
ACC measures the success of the ISSC by how much it’s used and by client outcomes� The internationally used Personal Wellbeing Index is a self-administered quality-of-life measure� It shows that 73% of clients who completed ISSC services noted that their wellbeing had improved� This was 2% up on the percentage reported in 2016/17�
A review has been commissioned to clarify:
• how long someone will spend in the ISSC
• the services they’re using
• opportunities for further improvement in the service�
It’s important that this review considers whether the service is delivering client outcomes that are in line with what ACC expected when it was set up� The Board will receive advice in early 2019�

FINANCIAL CONDITION REPORT 2018 31
How ACC operates and how it’s changing
The Enabling Independence service is reducing costs and delivering client outcomesACC set up the Enabling Independence (EI) service in 2015� Its role is to deliver a better experience for non-earner clients� To do this, these clients are managed from centralised regional hubs that work together with community groups and DHBs� This helps clients to receive co-ordinated services and access to the support they need�
Key performance indicators (KPIs) measure two non-earner client outcomes from the EI service:
1� Social rehabilitation spending provides support to help clients be independent safely� In 2017/18 the average annual social rehabilitation cost for each EI claim was $4,183� This is well below the $4,745 target, and below last year’s average cost of $4,549�
2� The return to independence KPI measures the percentage of clients who have been through the EI service and achieved independence within 12 months� The year to 30 June 2018 result was 86�7%, above the 86% target� In recent years this result has generally been at or above the target�
Return-to-independence rates above target at a lower average cost indicate that the service is meeting its objectives� EI client satisfaction was 76% for the year ended 30 June 2018� This result is slightly below the target of 77%�

ACCIDENT COMPENSATION CORPORATION32
Reviews of decisions
Reviews of decisions are a critical part of a fair and transparent SchemeClients who are dissatisfied with an ACC cover decision can ask for a review� ACC funds FairWay Resolution Limited, an independent body, to review decisions if they can’t be sorted out between ACC and the clients�
A new Service Agreement measure has been introduced for 2018/19� This measures the link between review applications and all declined cover and entitlement decisions� In 2014 ACC put in place initiatives to support dispute management� Table 4 shows that the number of reviews lodged as a percent of decline decisions reduced in 2014, indicating that the initiatives had a positive effect, and it has remained stable since then�
Table 4 also shows review outcomes in the past seven years� Figures for previous years may differ slightly from those reported previously, as some reviews continue for several years�
Table 4 – Review Outcomes
Year ending 30 June 2012 2013 2014 2015 2016 2017 2018
Number of reviews lodged 9,251 8,538 6,970 6,515 6,533 7,227 7,616
% of decline decisions 9.3% 8.4% 7.3% 6.7% 6.9% 7.1% 7.0%
Number of reviews completed 9,144 9,167 6,853 6,747 6,289 6,303 7,571
Number withdrawn or settled 2,992 3,170 2,774 2,808 2,810 2,690 3,303
% withdrawn or settled 33% 35% 40% 42% 45% 43% 44%
Number found in favour of clients 1,777 1,567 1,062 1,070 989 1,149 1,406
% found in favour of clients 19% 17% 15% 16% 16% 18% 19%
And it’s important that ACC understands what drives these.As the Scheme is compulsory, it’s particularly important that ACC decides cover correctly� Clients need the review process; it’s critical to a fair and transparent Scheme�
We recommended in the 2016 FCR that ACC identify the appropriate number of reviews it should receive, given the volume and nature of decisions made� This is an essential step in improving the quality and transparency of the relevant decisions and clinical advice�
In February 2018 a working group was formed to address some of these concerns� The group is working with the MBIE Government Centre for Dispute Resolution to complete a self-assessment against best practice guidelines, with results expected by March 2019� We expect to close this recommendation when these results are available and actions are in place�
One-third of review cases are about elective surgeryOne in three reviews is about an elective surgery decision� In the past four years 22% of these have been found in the clients’ favour� But this is trending up�
Graph 4 shows decisions about elective surgery applications since 2012�

FINANCIAL CONDITION REPORT 2018 33
How ACC operates and how it’s changing
Graph 4 – Elective surgery applications20
13
2014
2015
2016
2017
2018
0
10
20
30
40
50
60
70
Year ending 30 June
Approved Declined Cancelled Awaiting decision
Num
ber o
f ele
ctiv
e su
rger
y ap
plic
atio
ns (0
00
s)
From 2013 to 2015 ACC received slightly fewer than 60,000 elective surgery requests each year� The number has decreased since 2016 to just over 53,500 in 2018� The main area where numbers have reduced is in applications that are subsequently cancelled by the clients or health providers before cover decisions were made�
A new system should make surgery decisions quickerSince February 2018 all elective surgery decisions have been made by the Treatment Assessment Centre� By centralising, decisions for branch-managed surgery requests are now faster and more consistent, with improved transparency of decisions and clinical advice�
So far in the past year, surgery approval times have reduced from 6�9 days to 4�5 days and surgery decline decision times have reduced from 33�9 days to 32 days�
But it’s important to also improve the quality of surgery decisions.The number of elective surgery requests that ACC declines has remained fairly stable, but the proportion of reviews of these decisions found in favour of clients is increasing� This should be a focus of the work to understand the drivers of reviews and what ACC can do to improve the quality and transparency of decisions and clinical advice� This may involve providing additional training in surgery reviews for resolution specialists�
Decisions on work-related gradual process injuries will be part of the ICIPIn previous reports we highlighted that there appeared to be a low number of people claiming for work-related gradual process injuries� These claims also had high decline rates�
In response to a recommendation in the 2015 FCR, ACC worked through how to help people lodge claims and to understand why these claims are declined� While not part of the initial stages, a consideration of how these claims are lodged and assessed will be included in NGCM post implementation�
Improvements will include working with providers and stakeholders to improve clients’ and providers’ understanding, clarifying what they can expect from ACC cover and making sure they know what support is available�

34 ACCIDENT COMPENSATION CORPORATION
Clai
m v
olum
es, t
ypes
and
cost
sCl
aim
vol
umes
, typ
es a
nd co
sts
Claim volumes, types and costs
Summary• Claim volumes, types and costs were as expected this year�
• The result was a small $13 million outstanding claims liability (OCL) strain (higher payments than assumed) after four years of significant OCL strain�
• ACC must continue to monitor claims that affect the OCL closely� This year management focused on capital expenditure, elective surgery and weekly compensation� In 2018/19 the focus needs to move to understanding what drives claims and how changes in payments affect clients’ outcomes� Investigating the high growth in non-serious injury capital expenditure should be a particular area of focus�
• Changes in three long-term assumptions resulted in an OCL release of $731 million� Elective surgery, social rehabilitation non-capital and weekly compensation were affected by these changes� In elective surgery, the reduction in the long-term superimposed inflation requires greater understanding� In weekly compensation, it is important to maintain a focus on improving continuance rates in the long-term claims pool�
• Management is addressing the 2016/17 large increase in social rehabilitation care payments for seriously injured clients, with payments lower than assumptions this year� In part this is due to a reduction in care hours that resulted from focusing more on increasing client independence�
• ACC needs to continue monitoring treatment injury claims closely� Claim increases are continuing but are showing some signs of slowing� A lower-than-expected number of new claims, and faster-than-expected recovery rates for older accidents, resulted in a revision to long-term assumptions and a $480 million decrease in the OCL this year�
• More clients are reporting sensitive claims due to increased use of the Integrated Services for Sensitive Claims� Of these, more new clients are claiming weekly compensation and the average amount paid to clients is increasing� A high number of sensitive claims has also affected independence allowance and medical payments due to clients receiving more counselling� The Non-Earners’ and Earners’ Accounts are most affected by this�

FINANCIAL CONDITION REPORT 2018 35
Claim volumes, types and costs
• We made a recommendation in last year’s FCR to understand why older accident-year claims have been leaving the Scheme more slowly than expected� Higher-than-expected claim payments for social rehabilitation capital, weekly compensation and elective surgery were found to be the main reasons� Actions are underway to address these�

ACCIDENT COMPENSATION CORPORATION36
Changes in the outstanding claims liability are an important indicator of financial sustainabilityThe outstanding claims liability (OCL) estimates how much ACC needs to pay to support injured clients, today and for as long as they need support� This estimate changes when claim volumes, types and costs differ from forecasts, and helps us to understand potential future cost increases� ACC can use it to find ways to manage costs and support its drive to improve services and better target injury prevention�
When we talk about OCL changes in this section, we’re only referring to the effects of claim volumes, types and costs� We haven’t included changes due to economic factors because these are beyond ACC’s control� Appendix D – Valuation of the outstanding claims liability shows the impact of economic changes on the OCL�
And as long as client outcomes are continuing to improve, the Scheme will remain sustainable.If ACC can keep support standards high and OCL increases down, everyone benefits: clients through faster rehabilitation and improved independence, and levy and tax payers who fund the Scheme�
Each year we expect the OCL to grow� The cost of new claims is greater than reductions from clients leaving the Scheme� This is because:
• the Scheme is still maturing, meaning it’s still receiving more claims than it’s losing
• inflation has an impact
• claims are being made more often
• New Zealand’s population size and make-up are changing�
The OCL is affected most by long-term claimsThe biggest contributors to OCL changes are claims of a long-term nature and for which clients need significant support� Claims fully paid soon after the injuries don’t affect the OCL as much� The major risks requiring monitoring are:
• social rehabilitation, such as aids and appliances, child care and home help
• weekly compensation, which covers lost income while a client’s off work due to injury
• elective (non-emergency) surgery
• medical services, such as those provided by general practitioners (GPs)
• continued growth in long-term treatment injury claim volumes
• growth in sensitive claim volumes and costs�

FINANCIAL CONDITION REPORT 2018 37
Claim volumes, types and costs
While levy rates and Government appropriations are affected more by high-volume, short-term claims.Claim volumes, types and costs also affect levy rates and Government appropriations�
Graph 5 shows that the contribution of claim types to this year’s OCL at 30 June 2018 is different from the lifetime costs of new claims in 2018/19�
Graph 5 – Comparison of payment types’ contribution to OCL and funding for new-year claims
Social rehabilitation Weekly compensation Elective surgery Medical Other Public health acute services
OCL Funding for new-year claims
The four largest claim payment types (social rehabilitation, weekly compensation, elective surgery and medical payments) made up 93% of the 30 June 2018 OCL and 80% of the funding for new-year claims�
Social rehabilitation makes up nearly half of the OCL, because this kind of support is long term� However, it makes up a smaller proportion of the funding for new-year claims� On the other hand, the medical payment type, which includes payments to GPs and other medical specialists, makes up a small proportion of the OCL but a larger component of the new-year claim cost� This is because volumes are high but in most cases the costs of the injuries are covered immediately, so there’s no need to hold additional funds�
This year claims were as expectedThis year claim volumes, types and costs were in line with expectations� The OCL increased by $13 million (0�01%) more than expected� This is known as an OCL strain� In the past four years the combined OCL strain has been $2�21 billion excluding changes due to pay equity� This year’s $13 million OCL strain included $17 million for work-related gradual process claims incurred but not yet reported� This liability is not included in the OCL reported in the Annual Report due to accounting requirements� But it’s included here because the Work Account levy funds this amount�
This year’s result, being more in line with expectations, suggests that claim trends may have stabilised� But it also confirms that the successive increases in the OCL projection in the past four years were required� Continuing to monitor our claims experience closely to ensure the right client outcomes is therefore important�
And the new external valuation actuary also reviewed key assumptions.ACC’s new external valuation actuary, Taylor Fry, changed some key long-term assumptions� This resulted in a decrease in the OCL of $731 million� These changes were:
• revisions to pay equity rates for care workers, introduced in 2016/17: $494 million OCL reduction

ACCIDENT COMPENSATION CORPORATION38
• a reduction from 4% to 3% in the elective surgery superimposed inflation assumption: $723 million OCL reduction
• an increase in the long-term continuance rate assumption for the Work Account: OCL increase of $486 million�
The external valuation actuary also re-ran the 2017 OCL valuation and compared its forecast with that of PwC, ACC’s previous actuary� This recalibration further decreased the OCL by $393 million, including $149 million for work-related gradual process claims incurred but not yet reported at 30 June 2018�
In this section we provide a high-level description of how claim volumes, types and costs moved this year and how these changes led to increases or decreases in the OCL� More details of these changes can be seen in Appendix C – Claim volumes, types and costs and Appendix D – Valuation of the outstanding claims liability�
The OCL is based on estimates of how claims will behave in the futureIn calculating the OCL, the external valuation actuary has taken account of the key factors that affect how claims will develop over time�
The main drivers that affect the estimates of future claim volumes and costs that form the OCL are:
1� changes in the number of new claims, and how long clients require assistance (active claims)
2� the average amount paid per claim compared to inflation�
The OCL models of future claim behaviour are changed each year to better reflect recent experience in these areas�
In addition, assumptions about long-term claim behaviour can be changed� This will tend to be in response to emerging trends over many years, not just due to experience in the most recent year�
The OCL for payment types shows us part of the client storyChanges in the OCL vary depending on claim type� Graph 6 shows how each claim type contributed to the $718 million OCL release owing to claims experience and changes in long-term assumptions�
Graph 6 – Composition of 2018 OCL release by payment type
Social rehabilitation non-capital
Social rehabilitation capital
Medical
Elective surgery
Weekly compensation
Other
−$1,000m −$500m 0 $500m $1,000m
Active claims Long-term assumptions
Average amount paid Other

FINANCIAL CONDITION REPORT 2018 39
Claim volumes, types and costs
‘Social rehabilitation non-capital’ payments were lower than expectedThe total OCL release for social rehabilitation non-capital was $739 million, with two main drivers:
1� Revisions to the long-term assumptions for pay equity, introduced in 2016/17, resulted in a $494 million OCL release�
2� For the past three years, attendant care payments have been higher than expected� The OCL strain in 2016/17 was $541 million� In the 2017 FCR this was highlighted as an area of concern and we emphasised the importance of implementing actions to increase the independence of seriously injured clients� In 2017/18 the average hourly rate paid to carers, and the average number of care hours that seriously injured clients needed, were both below expectations� Some of the reduction in average care hours is due to increasing and improving the use of support needs assessments for seriously injured clients� Support needs assessments help staff to assess the appropriate level of care needed for clients based on their independence outcomes� This led to a reduction in the number of care hours required, which was the primary driver of the $216 million OCL release relating to the average amount paid� Given the sensitivity of the OCL to changes in attendant care costs, it’s important that this momentum continues into 2018/19�
With ‘social rehabilitation capital’ payments higher than expected.Capital payments for clients with serious, and non-serious, injuries were higher than expected� This was despite increases in projected costs in the past three years� The total OCL strain was $139 million�
The increase in serious injury capital payments is due to higher-than-expected average spending for existing clients on:
• large items (equipment, housing modifications and motor vehicle modifications)
• recurring items (consumables and hearing aids)�
A steep increase in the average cost per claim for low-level paraplegic clients is a key driver of the growth� This growth has been seen in the past
five years and now the average cost of large items for paraplegic and tetraplegic clients is similar� It partly reflects an older cohort of clients requiring more expensive wheelchairs, housing and vehicle modifications� For example, paraplegic clients with accidents that occurred prior to 1999 were a key driver of the year-on-year growth in the average cost of vehicle modifications of 27%� With the right vehicle modifications, independent travel without the assistance of carers may be a realistic goal for many of these clients� But care hours for paraplegic clients over the past year have remained relatively stable� As part of addressing recommendation 6 from 2017, linking high capital expenditure with improvements in the independence outcomes achieved for these clients should be an area of focus�
The increasing number of new claims is the primary driver for non-serious injury capital spending� These payments are short term, so the impact on the OCL is minimal; however, growth has more than doubled over the past six years so this needs further investigation� Linking higher-than-expected capital expenditure and lower-than-expected attendant care costs should also be a priority� Greater client independence is often only possible through the acquisition of specialised capital equipment, but there needs to be a better quantification of the net financial and social benefits�
Weekly compensation overall produced an OCL strainSome clients receive weekly compensation for a long time� This means that small changes in assumptions of future payments can have significant effects on the OCL� This year a one-off upward adjustment to realign the valuation and pricing models was a big contributor to the total OCL strain for weekly compensation of $598 million� A continued focus on improving continuance rates through increased independence and improved client outcomes is necessary to ensure that the growth in the long-term claims pool remains under control�
In the Work Account, the long-term (over five years) continuance rates were raised by less than 1%� This led to an OCL increase of $486 million�
In addition to this, there was a further strain of $198 million due to a higher-than-expected number of new claims� Much of this related to sensitive claims in the Non-Earners’ Account for older accident periods� We discuss sensitive claims later�

ACCIDENT COMPENSATION CORPORATION40
Changes were also made to how average costs are modelled for these weekly compensation claims� These resulted in a $379 million strain� For the Earners’ and Motor Vehicle Accounts, medium-term (two to five years) average claim costs were increased� For the Motor Vehicle and Non-Earners’ Accounts, long-term (over five years) claim costs were increased�
This strain was offset by an OCL release for active claims of $487 million� Clients in the Earners’, Motor Vehicle and Treatment Injury Accounts are getting back to work more quickly, so the external valuation actuary made reductions to the medium-term continuance rate assumptions� In the Non-Earners’ Account they made changes to the model to better fit the continuance rate patterns for these claims�
Elective surgery superimposed inflation was lower than expectedThe total OCL release for elective surgery was $769 million�
Historically, superimposed inflation for elective surgery has been high, generally above 5% per year� But it has decreased to below 4% in recent years� The long-term assumption for superimposed inflation was reduced from 5% to 4% last year, and further reduced from 4% to 3% this year to reflect the experience in the past six years� The result was a $723 million reduction in the OCL� Superimposed inflation is generally driven by increases in underlying surgery costs and shifts in the number and types of surgical procedures being performed� Gaining a clearer understanding of the drivers of the reductions in elective surgery superimposed inflation should be a priority in the coming year�
The number of active elective surgery claims has been steady, or reduced slightly, in the past few years� It reduced again in 2017/18 with some evidence that fewer invasive procedures were being performed and there was a shift towards rehabilitation rather than surgery� This resulted in slightly fewer claims but an increase in the average cost of the surgeries that were being performed� The net effect was a $46 million reduction in the OCL� ACC is reviewing the changes in case mix to see if there have been changes in surgical practice�
Medical claim payments were slightly lower than expectedOverall, medical payments in 2017/18 were lower than expected, resulting in an OCL release of $62 million� Almost all accounts contributed to this release, but it was partially offset by an increase in the number of ‘Other Medical’ active claims in the Non-Earners’ Account (see Appendix A – Additional background information for a description of the services included in the Other Medical payment type)�
Sensitive claims in the Non-Earners’ Account have increased in the past three years, since the introduction of the Integrated Services for Sensitive Claims (ISSC), leading to an increase in counselling support (part of Other Medical)� There is considerable uncertainty around where and when claim volumes will stabilise� The sensitive claims data review underway is due to deliver results in early 2019� This needs to assist in providing us with a more in-depth view of typical client pathways, the average time and cost of services and the sustainability of client outcomes� Sensitive claims tend to have long delays before the injuries are reported� We’re investigating developing a specific model for sensitive claims to better reflect their unique claim patterns� The total OCL for sensitive claims across the Earners’ and Non-Earners’ Accounts is estimated to be $3 billion� This estimate may change as the new model is refined�
It’s important to look beyond the numbersLooking at claims by individual payment type only gives part of the picture� It’s important to consider the whole picture of performance, and how ACC can improve it�

FINANCIAL CONDITION REPORT 2018 41
Claim volumes, types and costs
At how to increase clients’ independence.We need to consider the higher-than-expected capital costs alongside lower-than-expected attendant care costs� It may only be possible to increase clients’ independence through buying specialised capital equipment�
Technological advances have changed elective surgery� ACC needs to look at how these have improved client outcomes� It also needs to understand what they might mean for other payment types, such as weekly compensation and attendant care� This might include investigating how these advances have:
• lifted client independence
• reduced attendant care
• helped clients to return to their pre-injury lives more quickly
• changed timeframes for weekly compensation�
More work is needed to help us quantify how changes in different payment types affect client outcomes� If costs for one payment type go up, that may help clients if they get better outcomes� On the other hand, management should be concerned if costs are going up but clients’ lives don’t improve� The projects in the Integrated Change Investment Portfolio (ICIP) need to help us to make these connections� Improved return-to-work and return-to-independence outcomes for clients are expected to lead to improved financial outcomes in terms of OCL and levy reductions� In line with recommendation 6 in the 2017 FCR, work is underway to ensure the projects in the ICIP include processes for measuring the benefits they will deliver�
Looking at claim volumes, types and costs by account gives a different viewGraph 7 shows the $718 million total OCL release (resulting from changes to the long-term assumptions and claims experience) by account and main payment type�
Graph 7 – Composition of 2018 OCL release by aCCOUNT
Treatment Injury
Non-Earners’
Earners’
Work
Motor Vehicle
−$200m−$400m−$600m $0m $200m $400m $600m $800m
Medical Weekly compensation
Elective surgery Social rehabilitation Other

ACCIDENT COMPENSATION CORPORATION42
Claim volumes and costs were less than expected in the Treatment Injury AccountTreatment injury claims grew significantly after 2006, when cover was extended� The extension made it unnecessary to prove an injury was caused by medical error� There was further growth in claim volumes from 2012, coinciding with a campaign to increase awareness of treatment injury cover� Our concerns about the upward trend have been highlighted in previous FCRs�
In 2017/18 the external valuation actuary re-evaluated the treatment injury claims pool and underlying assumptions� For accident years 2006-2012 they observed a slowing in the growth of new claim volumes for Other Medical and non-serious injury care, and faster recovery rates for clients receiving weekly compensation This analysis indicated that the previous assumptions had been too conservative� During 2017/18 there was a further reduction in claims for these payment types, which led to a substantial OCL release of $311 million�
But growth in new treatment injury claims continues.While new claim growth for accident years 2006-2012 slowed, new claim growth in recent accident years has continued� Graph 8 shows the growth in active claims since the change from medical misadventure to treatment injury� It also shows the reduction in claim growth during 2017/18�
Graph 8 – Actual and projected treatment injury active claims
Payment quarter Actual Projection from 2018 valuation Projection from 2017 valuation recalibration
Num
ber o
f act
ive
clai
ms
(00
0s)
0
5
10
15
20
25
Jun
05
Dec
05
Jun
06
Dec
06
Jun
07
Dec
07
Jun
08
Dec
08
Jun
09
Dec
09
Jun
10D
ec 1
0Ju
n 11
Dec
11
Jun
12D
ec 1
2Ju
n 13
Dec
13
Jun
14D
ec 1
4Ju
n 15
Dec
15
Jun
16D
ec 1
6Ju
n 17
Dec
17
Jun
18D
ec 1
8Ju
n 19
Dec
19
Jun
20D
ec 2
0Ju
n 21
Dec
21
Jun
22
The continued upward trend, while not as steep, remains a concern to us� Due to limited numbers of long-term treatment injury claims it’s uncertain how they will behave in the future� Continued monitoring is needed because there may be further changes to the OCL as patterns for claims of longer durations become clearer�

FINANCIAL CONDITION REPORT 2018 43
Claim volumes, types and costs
The Non-Earners’ Account was affected by sensitive claim reportingThe Non-Earners’ Account has been particularly affected by the number and cost of sensitive claims� These claims particularly affect weekly compensation in the form of loss of potential earnings, counselling costs and independence allowance payments� See Appendix A – Additional background information for descriptions of these services�
In 2017/18 increases in the number of new sensitive claims receiving loss-of-potential-earnings compensation and the average amount paid per claim led to an increase in the weekly compensation payment type� The external valuation actuary also increased their assumption about the number of clients who’ll claim for counselling and the independence allowance (included in medical and other in Graph 7 respectively)�
The result of these increases due to sensitive claims was a $241 million OCL strain� But this was more than offset by the reduced long-term assumptions for elective surgery superimposed inflation and social rehabilitation care rates�
The Work Account was affected by assumption changesThe Work Account’s performance was affected by:
• the increase in long-term continuance rates for weekly compensation (discussed earlier)
• small increases in the assumed number and costs of hearing loss claims, included in the other category in Graph 7� For more detail see the hearing loss commentary in Appendix C – Claim volumes, types and costs�
This was partially offset by the reduced long-term assumptions for elective surgery and social rehabilitation non-capital�
The Earners’ Account was most affected by the long-term elective surgery superimposed inflation assumption changeThe Earners’ Account was heavily affected by the elective surgery assumption change, as over half of all elective surgery claims are from earner clients�
The Motor Vehicle Account was affected by a couple of factorsThe Motor Vehicle Account was affected by the social rehabilitation non-capital release� This account has a higher number of seriously injured clients than the others, due to serious road accident victims needing long-term support� The reduction in the long-term assumption for elective surgery superimposed inflation also led to a release in the Motor Vehicle Account�

ACCIDENT COMPENSATION CORPORATION44
Claims from older accident years leave the Scheme more slowlyGraph 9 shows the projected total cost of all claims by accident year� It compares the incurred cost from the 2018 OCL valuation with projections from the previous two valuations� These costs are expressed in 2018 dollar values and exclude:
• bulk-billed medical costs (a consolidated payment ACC makes to the Crown to cover the treatment in a public hospital of an injury during the acute phase)
• claims-handling expenses (the costs, other than the actual cost of claims, involved in paying claims)
• risk margins (amounts added to the OCL to ensure it is sufficient to meet claim payments 75% of the time)�
Graph 9 – incurred cost by accident year
0
1
2
3
4
5
6
Paym
ents
($b)
Accident year ending 30 June
Outstanding Payments to date
Projection from 2017 valuation Projection from 2016 valuation
1996
1997
1998
1999
200
0
200
1
200
2
200
3
200
4
200
5
200
6
200
7
200
8
200
9
2010
2011
2012
2013
2014
2015
2016
2017
2018
2019
2020
2021
2022
The expected outstanding claim payments in 2018 for claims before 2013 are higher than previously expected based on 2017 and 2016 valuations� Claim payments from older accident years generally have larger differences�
Some of this growth in older accident-year payments is due to:
• an increase in the assumed number of new sensitive claims
• an increase in average payments for the Motor Vehicle and Earners’ Accounts�
In response to recommendation 7 in the 2016 FCR, a working group was formed to investigate the increases in long-term claim volumes to identify an appropriate management response� This involved identifying claim types where payments were higher than expected� Five main areas were found:
1� Weekly compensation: Backdated payments due to a backlog of legal cases explained a high proportion of the higher-than-expected level of payments� The remaining cause was mainly the volume and durations of sensitive claims in the Non-Earners’ and Earners’ Accounts�
2� Sensitive claims: The implementation of the ISSC explained higher-than-expected payments for the independence allowance, Other Medical and weekly compensation in the Non-Earners’ Account and Other Medical in the Earners’ Account� There remains uncertainty around when sensitive claim volumes and costs will stabilise�
3� Capital: Increases in capital claims and costs were across the board� Key factors were the costs of equipment replacements and artificial limbs, and orthotic volumes�
4� Care: Higher-than-expected payments were attributed to known factors including pay equity, care hours and travel� Actions on care hours are being worked on, with recent improvements seen�

FINANCIAL CONDITION REPORT 2018 45
Claim volumes, types and costs
5� Elective surgery: An increased number of existing clients needing repeat surgery for older injuries was found to be the leading cause of higher-than-expected payments�
Management will oversee further actions covering capital, sensitive claims and elective surgery payments� For capital, this will include investigating provider behaviour, case manager behaviour and policy changes� The development of a sensitive claim model is being investigated and an analysis of repeat elective surgery cycles is also required� We’re satisfied with the findings of the working group and the subsequent actions that are underway� As a result, the recommendation is now closed�
And the economic cycle also affects claims.The cyclical claims pattern seen in Graph 9 is partly linked to New Zealand’s economic cycle� Claim volumes increased between 2000 and 2007, then declined with the economic downturn� They’ve increased since 2012, in part due to economic growth�
The graph shows a dip in total incurred costs from 2016 to 2017� The number of claims, and how serious the injuries are, fluctuate from year to year� This year the future costs of caring for seriously injured clients increased for 2016 accidents and reduced for 2017 accidents� This reflects a higher-than-expected number of traumatic brain injury claims for young people in 2016, and fewer-than-expected new claims in 2017�

46 ACCIDENT COMPENSATION CORPORATION
How
ACC
ser
vice
s ar
e fu
nded
How
ACC
ser
vice
s ar
e fu
nded
How ACC services are funded
Summary• Levies and appropriations are expected to increase in future years for
four key reasons:
1� The number of weekly compensation and medical claims continues to increase�
2� Medical and care costs continue to rise faster than inflation�
3� The levied accounts are overfunded� These surplus funds mean the levies collected are less than the underlying cost of claims� Over time, as these surplus funds are returned to levy payers, less will remain to offset the cost of claims� So levies will need to rise�
4� Claim costs and appropriations in the Non-Earners’ and Treatment Injury Accounts are not aligned�
• Sensitivity analysis shows many factors can affect future levies and appropriations� These are likely to increase levies and appropriations compared to current forecasts�
Levied accounts• The Board consulted on levies in September and October 2018,
and recommended 2019/21 levies to the Minister for ACC in November 2018�
• The Board recommended a decrease in the average Work Account levy and an increase in the Earners’ and Motor Vehicle Account levies� This is an overall combined increase of $43 million (1%) each year for the levied accounts�
• For the first time the levy recommendations included the expected benefits from management actions� These include investments in injury prevention and the Integrated Change Investment Portfolio (ICIP)� This reduces the levy required by $106 million (3%) each year� If these savings aren’t made, larger increases will be included in future levy consultations�
• The Board has proposed simplifying the experience rating programme in the Work Account� The changes would emphasise individual employers’ claim numbers, types and severity� They would result in an ability for employers to receive greater discounts or loadings than they do with the existing programme�

FINANCIAL CONDITION REPORT 2018 47
How ACC services are funded
• The Government confirmed the levy rates for 2019/21 in mid-December 2018� The Work Account levy is to decrease in line with the Board recommendation� However, the Earners’ Account and the Motor Vehicle Account levies are to remain at the 2017/19 rate, lower than the Board-recommended levies�
Non-Earners’ Account and the Non-Earners’ portion of the Treatment Injury Account• For the past four years, Cabinet has approved an appropriation lower
than asked for, and lower than the underlying cost of claims� This is expected to increase future funding requests, and if the appropriation is not increased the burden will shift to future generations� Despite this, ACC is able to manage and pay claims�
• The appropriation requested for 2018/19 was in line with the funding policy, and reduced for expected management responses of $73 million (4%)� Management is on target to deliver these�
ACCIDENT COMPENSATION CORPORATION48
ACC has five accounts, funded in different waysHere’s how the accounts are funded:
• The Motor Vehicle, Earners’ and Work Accounts are funded by levies�
• The Non-Earners’ Account is funded through Government appropriations�
• The Treatment Injury Account is funded through appropriations and a portion of the Earners’ Account levy�
And if costs rise, levies and appropriations need to rise as well.ACC recommends levies and appropriations in line with the Government funding policy� The funding policy requires that new-year costs, discounted using expected investment returns, be collected in advance� For the levied accounts, any under- or overfunding is spread over a 10-year horizon� For the Non-Earners’ Account, any underfunding is spread over 10 years and any overfunding is returned over three years�
The recommendations start with estimates to fund new claims based on recent claim volumes, types and costs� After that, adjustments allow for the difference between assets and the future costs of existing claims�
Management has some influence on claiming behaviour, including through injury prevention programmes and ICIP� But if claim costs increase, higher levies and appropriations will be needed if ACC is to continue providing services that injured people need in the future�
Some factors are beyond management influence, such as economic factors and Government policy changes� Examples are the pay equity legislation in 2017 and free medical care for under-14s�
Overall, for every $1 of levy collected ACC expects to return $0�89 to clients via claim payments� Likewise, for every $1 of appropriation collected ACC expects to return $0�90 to clients via claim payments�
In November 2018 the Board recommended levies for 2019/21 to the Minister for ACC, after consulting the public� Also in November 2018, the 2019/20 Non-Earners’ Account appropriation was recommended to the Government�

FINANCIAL CONDITION REPORT 2018 49
How ACC services are funded
Levied accounts
ACC recommends levies in line with legislationIn line with the Accident Compensation (Financial Responsibility and Transparency) Amendment Act 2015, ACC follows Government policy on fully funding the levied accounts when recommending levies every two years�
And consults widely.ACC asks businesses, communities and individuals for feedback on these recommended levies for a minimum of 28 days� After consultation, the Board reviews the feedback and makes final recommendations to the Minister for ACC�
Cabinet decides the final rateThe Minister may ask for advice from the Ministry of Business, Innovation and Employment (MBIE), the Treasury and other agencies before recommending levy rates to Cabinet� Cabinet decides the final rates� The levies for the Work Account and Earners’ Account come into effect from 1 April in the year following consultation, and the Motor Vehicle Account from 1 July�
And the levy-setting process is transparent.Section 331 of the Accident Compensation Act 2001 requires ACC to publish a report outlining the final levy rates for each account� The report is published at the same time as the levies are put into regulation� The report increases transparency in the levy-setting process� Levy payers can see the full implications of levy decisions� The report must include the:
• long-term projections of funding positions, levy rates, account balances and new-year claim costs
• key assumptions used for these projections�
The levied accounts’ funding policy was set by the Government in 2016The Government’s funding policy for the levied accounts is in a statement gazetted in May 2016 – Funding Policy Statement in Relation to the Funding of ACC’s Levied Accounts� Under this policy:
• the average levy rate must be based on the estimated lifetime costs of claims expected to occur during the levy period (new-year claim costs)
• accounts aim to hold assets between 100% and 110% of the outstanding claims liability (OCL), with a target midpoint of 105%
• a funding adjustment must be included in the average levy rate that takes each account’s funding position to the 105% target midpoint smoothly over 10 years
• any increase in the average levy rate for each account must not exceed 15%; this is on top of inflation adjustments for the Motor Vehicle Account�
The 105% target midpoint funding level is set with reference to the OCL reported in the financial accounts, so includes a risk margin (see Appendix D – Valuation of the outstanding claims liability)�
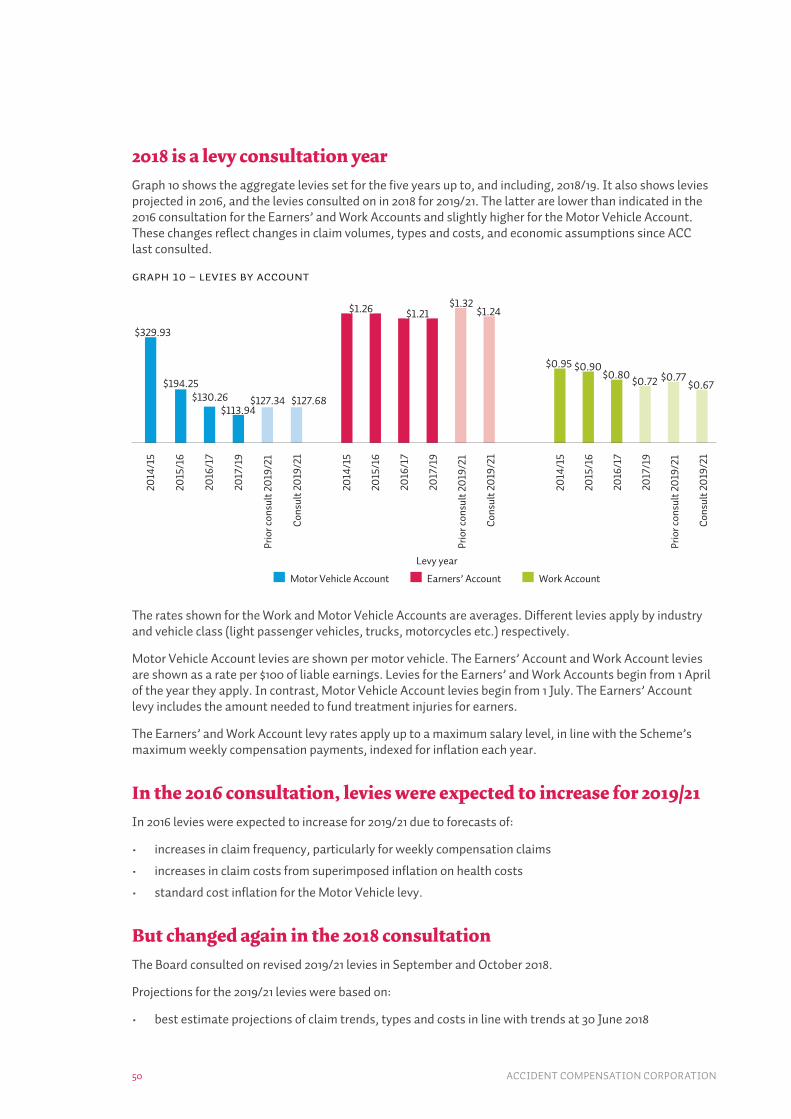
ACCIDENT COMPENSATION CORPORATION50
2018 is a levy consultation yearGraph 10 shows the aggregate levies set for the five years up to, and including, 2018/19� It also shows levies projected in 2016, and the levies consulted on in 2018 for 2019/21� The latter are lower than indicated in the 2016 consultation for the Earners’ and Work Accounts and slightly higher for the Motor Vehicle Account� These changes reflect changes in claim volumes, types and costs, and economic assumptions since ACC last consulted�
Graph 10 – Levies by account
2014
/15
2014
/15
2014
/15
2015
/16
2015
/16
2015
/16
2016
/17
2016
/17
2016
/17
2017
/19
2017
/19
2017
/19
Prio
r con
sult
20
19/2
1
Prio
r con
sult
20
19/2
1
Prio
r con
sult
20
19/2
1
Cons
ult 2
019
/21
Cons
ult 2
019
/21
Cons
ult 2
019
/21
$1.26
$130.26$113.94
$127.34 $127.68
$194.25
$329.93
$1.21$1.32
$1.24
$0.95 $0.90$0.80
$0.72 $0.77$0.67
Levy year
Motor Vehicle Account Earners’ Account Work Account
The rates shown for the Work and Motor Vehicle Accounts are averages� Different levies apply by industry and vehicle class (light passenger vehicles, trucks, motorcycles etc�) respectively�
Motor Vehicle Account levies are shown per motor vehicle� The Earners’ Account and Work Account levies are shown as a rate per $100 of liable earnings� Levies for the Earners’ and Work Accounts begin from 1 April of the year they apply� In contrast, Motor Vehicle Account levies begin from 1 July� The Earners’ Account levy includes the amount needed to fund treatment injuries for earners�
The Earners’ and Work Account levy rates apply up to a maximum salary level, in line with the Scheme’s maximum weekly compensation payments, indexed for inflation each year�
In the 2016 consultation, levies were expected to increase for 2019/21In 2016 levies were expected to increase for 2019/21 due to forecasts of:
• increases in claim frequency, particularly for weekly compensation claims
• increases in claim costs from superimposed inflation on health costs
• standard cost inflation for the Motor Vehicle levy�
But changed again in the 2018 consultationThe Board consulted on revised 2019/21 levies in September and October 2018�
Projections for the 2019/21 levies were based on:
• best estimate projections of claim trends, types and costs in line with trends at 30 June 2018

FINANCIAL CONDITION REPORT 2018 51
How ACC services are funded
• estimates of future investment returns at 30 June 2018
• risk-free interest rates implied by the New Zealand Government bond yield curve at 30 June 2018
• the expected benefits from management responses�
These projections have changed since the 2017/19 levies were set� The main change drivers are:
• updated claim volumes, types and costs to 30 June 2018
• reductions in projected superimposed inflation for elective surgery in line with the recent claims experience� In particular, this reduced the Earners’ levy by $0�04 (3�3%)
• clients receiving weekly compensation from the Work Account having returned to work/independence faster than previously projected
• updated economic assumptions (discount rates, inflation forecasts, expected investment returns and asset positions) to 30 June 2018 (this increased levies by 3-6%)
• the impact of the pay equity legislation (see Appendix C – Claim volumes, types and costs)
• expected benefits from management responses for injury prevention and the ICIP (see the How ACC operates and how it’s changing section)� These reduce the total annual levy by $106 million� The levy impact for each account is shown in Table 5�
But overall levy income is expected to increase by 1%.The resulting estimated changes in annual levy income by account are:
• $56 million (12%) for the Motor Vehicle Account
• $43 million (2%) for the Earners’ Account
• −$55 million (-7%) for the Work Account�
This is a total of $43 million (1%) each year for the combined levied accounts�
Increased costs will push up future leviesLevies are likely to increase over time due to:
• medical costs increasing faster than standard inflation
• care rates increasing faster than standard inflation
• standard inflation for the Motor Vehicle Account
• increases in claims receiving weekly compensation in excess of increases in the working population�
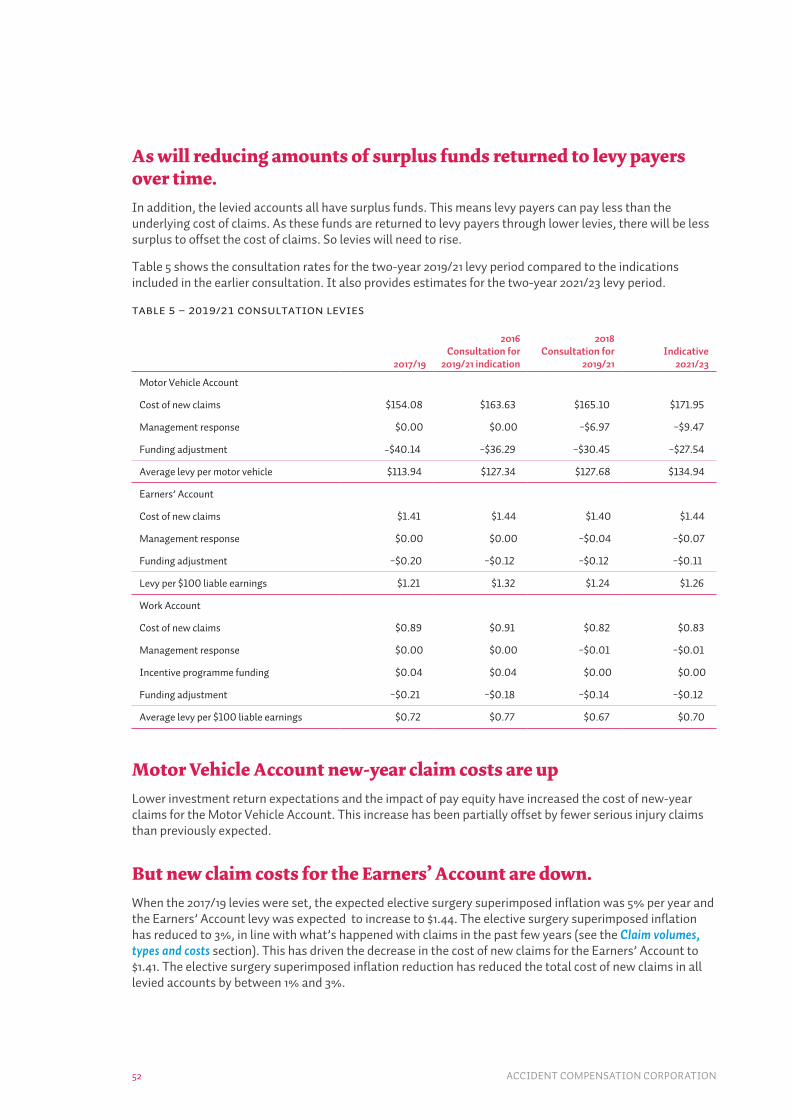
ACCIDENT COMPENSATION CORPORATION52
As will reducing amounts of surplus funds returned to levy payers over time.In addition, the levied accounts all have surplus funds� This means levy payers can pay less than the underlying cost of claims� As these funds are returned to levy payers through lower levies, there will be less surplus to offset the cost of claims� So levies will need to rise�
Table 5 shows the consultation rates for the two-year 2019/21 levy period compared to the indications included in the earlier consultation� It also provides estimates for the two-year 2021/23 levy period�
Table 5 – 2019/21 CONSULTATION LEVIES
2017/19
2016 Consultation for
2019/21 indication
2018 Consultation for
2019/21Indicative
2021/23
Motor Vehicle Account
Cost of new claims $154.08 $163.63 $165.10 $171.95
Management response $0.00 $0.00 −$6.97 −$9.47
Funding adjustment −$40.14 −$36.29 −$30.45 −$27.54
Average levy per motor vehicle $113.94 $127.34 $127.68 $134.94
Earners’ Account
Cost of new claims $1.41 $1.44 $1.40 $1.44
Management response $0.00 $0.00 −$0.04 −$0.07
Funding adjustment −$0.20 −$0.12 −$0.12 −$0.11
Levy per $100 liable earnings $1.21 $1.32 $1.24 $1.26
Work Account
Cost of new claims $0.89 $0.91 $0.82 $0.83
Management response $0.00 $0.00 −$0.01 −$0.01
Incentive programme funding $0.04 $0.04 $0.00 $0.00
Funding adjustment −$0.21 −$0.18 −$0.14 −$0.12
Average levy per $100 liable earnings $0.72 $0.77 $0.67 $0.70
Motor Vehicle Account new-year claim costs are upLower investment return expectations and the impact of pay equity have increased the cost of new-year claims for the Motor Vehicle Account� This increase has been partially offset by fewer serious injury claims than previously expected�
But new claim costs for the Earners’ Account are down.When the 2017/19 levies were set, the expected elective surgery superimposed inflation was 5% per year and the Earners’ Account levy was expected to increase to $1�44� The elective surgery superimposed inflation has reduced to 3%, in line with what’s happened with claims in the past few years (see the Claim volumes, types and costs section)� This has driven the decrease in the cost of new claims for the Earners’ Account to $1�41� The elective surgery superimposed inflation reduction has reduced the total cost of new claims in all levied accounts by between 1% and 3%�

FINANCIAL CONDITION REPORT 2018 53
How ACC services are funded
Work Account new claim costs are downFor the Work Account, clients receiving weekly compensation have returned to work/independence more quickly than previously projected� Allowing for this has reduced the cost of new claims for the Work Account�
And some discount programmes are no longer available.The 2017/19 average Work Account levy included a loading of $0�04� This funded the levy discounts in the Workplace Safety Management Practices and Workplace Safety Discount programmes (see Appendix A – Additional background information)� Now businesses can’t enrol or renew in either discount programme, so the loading won’t be there for 2019/21�
Each account has more assets than requiredEach account has more assets than required by the funding policy� These surpluses are returned to levy payers through a negative funding adjustment� This means that levies are lower than the underlying cost of claims�
And for the first time management actions are included, reducing levies.The levies consulted on for 2019/21 include the impact of management actions to reduce the upward trend in levies� These anticipated savings reduce the levy required by $106 million (3%) for each of 2019/20 and 2020/21� This is the first time the impact of management actions has been included in levy recommendations� These actions target a broad range of injury prevention initiatives, reducing the levy required by $62 million, and service delivery changes to improve customer experiences and outcomes through the ICIP, reducing the levy by a further $44 million (see the How ACC operates and how it’s changing section)� The ICIP programmes that are expected to benefit the levied accounts from 2019/20 include the Health Services Strategy (HSS) and the Next Generation Case Management initiative (NGCM)�
The Government has confirmed the 2019/21 levy ratesThe Government confirmed the levy rates for 2019/21 in mid-December 2018� The Work Account levy is to decrease in line with the Board recommendation� However, the Earners’ Account and the Motor Vehicle Account levies are to remain at the 2017/19 rate, lower than recommended by the Board�
The levy rates were recommended considering changes in the main cost drivers since the 2017/19 levies were set, which were discussed earlier�
Approving levies lower than those recommended will increase the funding required to come from assets already held within each account� In time, the funding ACC requests will have to return to the underlying cost of new claims� When increases requested in line with the funding policies are not approved, higher requests will be needed in the future to compensate� Ultimately, the level of increases required in the future to achieve this may become unreasonably high�
Economic conditions remain volatile, and this affects levy rates through investment returns and discount rates� The funding policy was designed to respond to pressures by spreading the impacts over time� Approving lower levies than recommended decreases the ability to absorb these external pressures�
For example, the 2019/21 Motor Vehicle levy was confirmed to remain unchanged at $113�94, 31% below the expected cost of new claims of $165�08� The 2021/23 levy is now expected to increase from $134�94, as shown in Table 5, to $136�06 as the future funding adjustment will be smaller� This would result in a 19�4% increase in the Motor Vehicle levy, which is the maximum allowed under the funding policy� The impacts of increases in claim costs or a deterioration in economic conditions would not be able to be included in the 2021/23 levy and would shift the financial burden to future generations�
Work Account experience rating programmes are having a limited positive impactThe public was consulted on the design of the workplace incentive programmes in September and October 2018� Employers asked that more weight be placed on their own claims experience, especially

ACCIDENT COMPENSATION CORPORATION54
recent experience� This is reflected in the recent levy consultation proposing adjustments to the experience rating programme for large employers�
Experience rating results in more employers receiving discounts than loadings� If these adjustments are made to experience rating, even more employers are expected to receive discounts� To collect the same levy amount overall, the average levy needs to increase by one cent�
The No Claims Discount experience rating programme was originally introduced for small to medium employers to encourage better health and safety practices� However, a 2015 MBIE review found little evidence that it had achieved this�
The No Claims Discount doesn’t differentiate between normal and good performance� For most small businesses, the number of claims requiring staff to take time off work is inconsequential: 0�07 claims on average per annum� This results in 92% of eligible small to medium employers receiving discounts simply because most don’t have claims each year� Discounts of $18 million are funded by all employers, including those who are not eligible for the No Claims Discount�
And a replacement for the No Claims Discount programme is planned.The No Claims Discount programme may be removed in the future� An alternative incentive programme for smaller businesses will be investigated and consulted on before it’s removed�
The Vehicle Risk Rating may changeThe Minister for ACC recently consulted the public on whether Vehicle Risk Rating should be kept�
Vehicle Risk Rating applies to most passenger cars by charging a levy based on how much a car protects people, inside and outside the vehicle, if it crashes� Four levies are charged depending on which ‘band’ a car is placed in� The 2017/19 levies range from $86�50 to $149�14�
Other vehicles, such as vans and utes (15% of the light vehicle fleet) and heavy vehicles aren’t part of Vehicle Risk Rating and pay different fixed rates�
The Government confirmed in mid-December 2018 it will remove the Vehicle Risk Rating from 1 July 2019�
And that would increase some, and decrease other, levies.Removing Vehicle Risk Rating would result in a single rate for passenger cars, with some paying a levy increase and others a decrease� The average levy would not change�

FINANCIAL CONDITION REPORT 2018 55
How ACC services are funded
Non-Earners’ appropriation
The Government has approved less-than-requested Non-Earners’ appropriations for four yearsEach year Cabinet sets appropriations for the next five years as part of the Budget process� Cabinet considers advice from the Board, MBIE and the Treasury�
The Government has not approved the majority of additional funding asked for in the past four years� But it gave more to fund pay equity settlements and policy changes, including free medical care for under-14s and air ambulances�
And the Board’s advice follows the Government’s funding policy.The Government has set a funding policy for the Non-Earners’ Account and the Non-Earners’ portion of the Treatment Injury Account� The Board follows the Government funding policy when estimating the appropriation required�
On 15 May 2017 Cabinet changed the funding policy for the Non-Earners’ Account� The revised funding policy is shown in Appendix A – Additional background information� ACC applied it for the first time when calculating the Non-Earners’ Account appropriation request for 2018/19�
The funding policy specifies when funds are collected� Ultimately though, the cost of claims paid by ACC doesn’t change, regardless of when they are funded�
Graph 11 shows the Non-Earners’ appropriation estimated by ACC and the amounts approved by Cabinet, for the four years up to and including 2018/19� These amounts include the contribution to the Treatment Injury Account for treatment injuries suffered by non-earners�
Graph 11 – RECENT APPROPRIATION AMOUNTS
2015/16 2016/17 2017/18 2018/19
Requested Approved
App
ropr
iatio
n am
ount
($b)
1.6
0.0
0.2
0.4
0.6
0.8
1.0
1.2
1.4
1.8
2.0
2.2
$1,271m
$1,091m
$1,363m
$1,898m
$1,354m
$1,624m
$1,465m
$1,231m

ACCIDENT COMPENSATION CORPORATION56
Historical increases have been driven by decreases in discount ratesThe large increase in the requested amount for 2017/18 was mainly to fund historical unfunded decreases in the discount rates� This amount was estimated based on the three-year funding horizon in place at that time�
Resulting in the Government extending the funding horizon to 10 years for post-2001 claimsThe new-year costs of post-2001 claims are collected in advance, and any under- or overfunding is spread over the funding horizon� Cabinet extended the horizon to 10 years when post-2001 claims were underfunded in 2017� This differs from the three-year horizon when they are overfunded� The funding horizon is no longer symmetrical, and this could result in large changes in the requested appropriation should the account move from being overfunded to underfunded� In addition, expected investment returns are now used to calculate the new-year cost, rather than risk-free rates� These two changes have resulted in similar impacts and, overall, a large decrease in the 2018/19 request�
And pre-2001 claims are still a big part of the Non-Earners’ Account.Pre-2001 claims are funded on a pay-as-you-go (PAYG) basis, as costs arise� Claims made before 1 July 2001 were 43% ($3�7 billion) of the $8�7 billion total Non-Earners’ Account OCL at 30 June 2018� These claims will take many decades to run off� Until then the Non-Earners’ Account will record a deficit for these claims�
Similarly, at 30 June 2018 the OCL for pre-1 July 2001 treatment injury claims for non-earners was $1�2 billion, or 28% of the total $4�1 billion OCL for the Treatment Injury Account�
The 2018/19 appropriation request was based on• best estimate projections of claim trends, types and costs in line with trends at 30 June 2017
• estimates of future investment returns given the latest and expected future market conditions at 30 September 2017
• risk-free interest rates implied by the New Zealand Government bond yield curve at 30 September 2017
• expected benefits from management responses�
The projections in the Financial results and Funding position sections differ from these� They are projected from claims and economic conditions at 30 June 2018�
Table 6 shows the elements of the Non-Earners’ appropriation for 2018/19 compared with those in the previous three years� Also shown is the amount requested for 2018/19, calculated in line with the Government’s agreed funding policy�
Table 6 – Non-Earners’ Appropriation
2018/19Appropriation ($M) 2015/16 2016/17 2017/18 Requested Approved
Cost of new claims 1,242 1,349 1,454 1,378 1,378
PAYG 117 125 137 157 157
Funding adjustment −267 −242 −236 90 −69
Total 1,091 1,231 1,354 1,624 1,465

FINANCIAL CONDITION REPORT 2018 57
How ACC services are funded
And the request was $167 million higher than previously approved for that year.The amount requested for 2018/19 was $270 million higher than Cabinet approved for 2017/18, and $167 million higher than previously approved for 2018/19� This increase of $167 million was for four reasons:
1� A $146 million decrease in estimated new-year costs in 2018/19� This was due to the change in funding policy from using risk-free discount rates to using expected investment returns�
2� An increase in the forecast population of non-earners, reflecting higher migration, which increased the forecast by $47 million�
3� Unfunded increases from earlier years� These were mostly driven by changes in economic assumptions, policy changes and changes in claim numbers, types and volumes� This required an additional $339 million compared with the approved appropriation�
4� A reduction in the request of $73 million (4%)� This amount was due to expected management actions not included in the previously approved appropriation�
Management actions have been included to reduce costsIn the past two years’ appropriation calculations, ACC has reduced the amount to take into account anticipated savings from targeted management actions (see the How ACC operates and how it’s changing section)�
These management actions include:
• benefits of $52�5 million from injury prevention, particularly the Falls and Fractures programme targeting non-earners
• reductions in elective surgery and radiology costs of $14�9 million through collaborating better with health sector partners to improve client outcomes through the HSS
• higher levels of client independence by investing more in social rehabilitation capital and reducing $5�6 million in other forms of care and support
• implementing NGCM, with benefits delivered from 2019/20 onwards, so no impact was allowed for in 2018/19�
And ACC is on target to achieve the agreed management response for 2018/19.Overall, management is on target to achieve the agreed management response of $73 million (4%) in 2018/19�
Last year the injury prevention return on investment was above the target of $1�70 for 2017/18, at $1�72 for every $1 invested� As a result, an estimated 5,500 injuries were prevented during 2017/18 in the Non-Earners’ Account�
Average elective surgery costs have continued to increase, but at a lower rate than previously assumed� As a result, the assumption for elective surgery superimposed inflation was reduced from 4% per annum to 3% per annum in the June 2018 valuation�
NGCM and Health Sector and Provider Strategies (now the HSS) have now been rolled into the ICIP (see the How ACC operates and how it’s changing section)�
Cabinet’s 2018/19 appropriation decision was lower than requestedCabinet didn’t approve the full appropriation requested for 2018/19� Instead it set the appropriation $159 million lower, and included an approved increase of $9�6 million to fund the following policy changes:
• Sexual abuse assessment and treatment services: $5 million to expand the service and consolidate its ACC funding (previously co-funded with the Ministry of Health and New Zealand Police)�
• Extending zero-fees GP visits from under-13s to under-14s, costing $0�9 million�
• Increased air ambulance service costs of $3�7 million�
And won’t cover new-year claims and ongoing costs.The amount approved by Cabinet isn’t enough to cover new-year claim costs and PAYG costs for 2018/19� In total, Cabinet approved $1,465 million to fund the estimated $1,634 million needed under the
ACCIDENT COMPENSATION CORPORATION58
funding policy (including the new policy initiatives above)� If nothing changes, higher appropriations will be needed in future years to meet claim costs for 2019/20� If the appropriation isn’t increased in the future, the financial burden will shift to future generations of tax payers�
ACC is able to continue to pay claimsACC can still pay claims to non-earners for some time using its existing assets and any future appropriation amounts� So there is no immediate threat to the services ACC can provide to clients�
But its funding position will deteriorate at existing appropriation levels.The funding position is likely to deteriorate further if present approved funding levels continue� For the Non-Earners’ and Treatment Injury Accounts, the deficits arising during the next four years are projected to increase without action to align claim costs and appropriations�

FINANCIAL CONDITION REPORT 2018 59
How ACC services are funded
How levies and appropriations move with changes in assumptionsSensitivity analysis shows that economic scenarios have the biggest impacts on levies and appropriations
Sensitivity analysis shows how levies and appropriations change if key assumptions vary� These variations include any impacts on the funding adjustment� The movements don’t indicate the upper or lower levels of all possible outcomes� These sensitivities assume no changes in any other assumptions� For example, the impact of a 1% reduction in inflation assumes a long-term CPI decrease from 2% per annum to 1% per annum with no corresponding decrease in expected investment returns or discount rates�
Table 7 – Average Levy Sensitivity Analysis by account
Motor Vehicle Earners’ WorkSensitivity of levy rates +1% −1% +1% −1% +1% −1%
Discount rates and investment returns −$69.25 $86.97 −$0.15 $0.18 −$0.15 $0.17
Base inflation $93.91 −$73.88 $0.22 −$0.17 $0.17 −$0.16
Weekly compensation new claims volume growth rate $0.79 −$0.90 $0.00 $0.00 $0.00 $0.00
Weekly compensation long-term continuance rate N/A −$29.37 $0.08 −$0.06 $0.14 −$0.09
Serious injury care rate $47.62 −$34.96 $0.04 −$0.03 $0.02 −$0.01
Elective surgery superimposed inflation $7.50 −$5.26 $0.05 −$0.03 $0.02 −$0.01
The sensitivity for a 1% increase in Motor Vehicle weekly compensation rates continuing has not been shown, as the rate is already very close to 100%� An increase of 1% would result in claims never running off�
Table 8 – Non-Earners’ Appropriation Sensitivity Analysis
Non-Earners’Non-Earners’ portion of
Treatment Injury TotalSensitivity of Non-Earners’ appropriation ($M) +1% −1% +1% −1% +1% −1%
Discount rates and investment returns −199 191 −189 140 −388 331
Base inflation 225 −164 150 −166 375 −330
Social rehabilitation new claims volume growth rate 2 −2 1 −1 4 −4
Serious injury superimposed inflation 108 −73 118 −142 226 −215
Elective surgery superimposed inflation 17 −12 8 −6 25 −18
Population growth 15 −15 3 −3 17 −17
For the Non-Earners’ Account the funding horizon is not symmetrical� It’s three years if overfunded and 10 years if underfunded� This can have unusual impacts on sensitivities� In particular, a 1% reduction in superimposed inflation for social rehabilitation results in the Non-Earners’ Account post-2001 portion of the Treatment Injury Account switching from being underfunded to overfunded� So, this leads to a disproportionately larger decrease in the appropriation than the Non-Earners’ Account, which remains underfunded� Likewise, a 1% reduction in base inflation results in both the Non-Earners’ Account and the Non-Earners’ portion of the Treatment Injury Account being overfunded�
60 ACCIDENT COMPENSATION CORPORATION
Fina
ncia
l res
ults
Fina
ncia
l res
ults
Financial results
Summary• The Scheme recorded a $46 million surplus for the 2017/18 year,
including the outstanding claims liability (OCL) for work-related gradual process claims incurred but not yet reported ($28 million when this is excluded)�
• Changes in economic assumptions drove an increase in the OCL of $2,725 million during the year�
• Total claim costs were as expected, as discussed in the Claim volumes, types and costs section� Claim costs are projected to increase by around 5% per annum in the next four years due to inflation, superimposed inflation, population growth and an allowance for future increases in claim frequency�
• Expenses in 2017/18 increased from 2016/17 and were below budget overall� The net operating costs were above budget, while claims handling expenses were below� This also reflected activity in the Integrated Change Investment Portfolio (ICIP) programme�
• Deficits are projected in the next four years for the levied accounts because they’re overfunded� These deficits are expected to reduce over time as the funding positions of these accounts get closer to target, and the levy rates are set closer to the costs of claims occurring during the year in line with the funding policy�
• For the Non-Earners’ and Treatment Injury Accounts, the deficits arising during the next four years are projected to increase without action to align claim costs and appropriations� This is discussed further in the How ACC services are funded section�

FINANCIAL CONDITION REPORT 2018 61
Financial results
ACC is a unique scheme for all New ZealandersACC is not a profit-making body� It collects levies and receives Government appropriations� ACC invests to meet claims and expenses� Over time all levy and investment income must:
• pay claims, or
• administer the Scheme, or
• be spent on preventing injuries�
Movements upwards or downwards in net assets are not the same as profit or loss� That’s why we use ‘surplus’ and ‘deficit’ instead�
The statement of comprehensive income shows a complete picture of incomeThe statement of comprehensive income is shown in Table 9 for the year ended 30 June 2018, and compares results with the previous two years� These results include the OCL for work-related gradual process claims incurred but not yet reported� So it’s different from the figures in the Annual Report 2018 financial statements because they exclude claims incurred but not yet reported after recommendations from external auditors� It’s included here as the Work Account levy funds this amount�
We’ve shown the statement of comprehensive income by account for the year ended 30 June 2018 in Appendix E – Financial results�
The results for 2016/17 and 2017/18 are separated into performance related to cash flow (as in the Annual Report 2018) and the OCL movement during the year� The latter allows us to examine overall financial performance taking into account incurred costs� This is consistent with the full-funding requirements for the majority of the Scheme�

ACCIDENT COMPENSATION CORPORATION62
Table 9 – Statement of Comprehensive Income for the past three years
2017/18 Restated 2016/17
($M)Cash flow OCL Total Budget Difference
Cash flow OCL Total
2015/16Total
Income
Levies and appropriations 4,120 0 4,120 4,103 17 4,102 0 4,102 3,927
Total income 4,120 0 4,120 4,103 17 4,102 0 4,102 3,927
Expenditure
Claims incurred
Medical costs 1,404 (71) 1,333 1,494 (161) 1,327 51 1,379 1,574
Elective surgery 346 (723) (376) 450 (827) 332 25 357 473
Social rehabilitation 740 (418) 322 900 (578) 647 2,056 2,703 541
Compensation related 1,303 703 2,006 1,441 564 1,205 438 1,643 1,326
Other 217 (103) 114 209 (95) 205 213 418 106
Claims handling expenses 426 1 427 459 (32) 409 2 410 391
Total claims incurred 4,436 (611) 3,826 4,954 (1,128) 4,125 2,784 6,910 4,410
Expenses
Net operating costs 143 0 143 119 24 138 0 138 99
Injury prevention costs 69 0 69 72 (2) 55 0 55 50
Total expenses 212 0 212 190 22 194 0 194 150
Total expenditure 4,649 (611) 4,038 5,144 (1,106) 4,319 2,784 7,103 4,560
Surplus/(deficit) from underwriting activities
(529) 611 82 (1,042) 1,124 (217) (2,784) (3,001) (633)
Decrease/(increase) in unexpired risk liability
0 (92) (92) (53) (39) 0 (110) (110) (103)
Economic
Change in discount and inflation rate assumptions
0 (2,725) (2,725) 0 (2,725) 0 2,368 2,368 (5,103)
Investment management costs (53) 0 (53) (52) (1) (48) 0 (48) (43)
Unwind of risk-free interest rate 0 (734) (734) (793) 59 0 (774) (774) (896)
Investment income 3,568 0 3,568 1,442 2,126 2,052 0 2,052 3,253
Total economic 3,515 (3,459) 57 598 (541) 2,004 1,595 3,599 (2,789)
Total surplus/(deficit) 2,987 (2,940) 46 (497) 544 1,788 (1,299) 488 (3,525)

FINANCIAL CONDITION REPORT 2018 63
Financial results
The Scheme had a surplus in 2017/18ACC’s financial result for 2017/18 was a surplus of $46 million, compared to a budgeted deficit of $497 million� The surplus in the previous year was $488 million�
This was higher than budgeted primarily due to a decrease in the OCL.As part of the OCL valuation every year the estimate of future payments is revised, which results in a change in the OCL� The OCL decreased by $611 million in 2017/18 compared to a budget increase of $417 million� ACC’s new external valuation actuary undertook a recalibration of the 2017 OCL� This resulted in a one-off reduction in the OCL of $243 million� Assumptions about elective surgery superimposed inflation and lower-than-expected attendant care payments were also major drivers in the OCL decrease (see Appendix D – Valuation of the outstanding claims liability for more detail)� In contrast, the OCL increased by $2,784 million in 2016/17� $1,063 million of the increase was from changes to the pay of care workers (also known as ‘pay equity’)�
Economic factors combined to reduce the contribution to the surplusThe total economic contribution to the surplus was $57 million, compared to the budget contribution of $598 million� In 2016/17 the total economic contribution was $3,599 million�
1� The investment income was $3,568 million� ACC achieved a gross annual return of 9�89% before costs, slightly above benchmark by 0�09% and higher than the risk-free rate� The OCL tells us how much money is needed now, if invested at risk-free rates, to meet ACC’s payment obligations for existing accidents� The discount unwind can be thought of as the investment income from the OCL if invested at risk-free rates� In 2017/18 investment income after costs and the discount unwind was $2,781 million�
2� Changes in market conditions from what was assumed about discount and inflation rates increased the OCL and reduced the economic contribution by $2,725 million� Lower discount
rates, due to movements in New Zealand Government bond yields, accounted for most of this�
Other cash flow factors affected the size of the surplusLevy income in 2017/18 was $13 million higher than in 2016/17, and $11 million above budget� This was mainly due to more people in employment, increases in salaries and wages and more registered motor vehicles�
The cash flow for claims paid during the year increased by $311 million to $4,436 million while remaining under the budget of $4,537 million� The main increases were in weekly compensation, social rehabilitation and medical payments�
2017/18 expenses increased by 6% and were below budgetExpenses are related to handling claims, preventing injuries, investing funds and operating costs�
Total expenses increased by 6%, from $652 million in 2016/17 to $693 million in 2017/18� But they were below the $702 million budget�
Net operating expenses increased by $18 million during the year to $212 million� This was mainly due to increases in operating costs from the ICIP projects and is discussed below�
Graph 12 shows the percentages for the past three years alongside the 2017/18 budget and 2018/19 projections:
• claims handling expenses paid during the year compared to claim payments
• net operating costs compared to income (from levies and appropriations)
• injury prevention costs compared to income (from levies and appropriations)
• ICIP project costs compared to claim payments
• investment management costs compared to funds under management�

ACCIDENT COMPENSATION CORPORATION64
Graph 12 – Expenses as percentages of underlying service%
2015/16 2016/17 2017/18 2017/18budget
2018/19projected
0
1
2
3
11
10
9
12
Claims handling expenses/claim payments Injury prevention costs/income Investment management costs/average costs
Net operating costs/income ICIP costs/claim payments
� 9.43%� 9.82%
� 2.35%� 2.06%� 2.16%
� 1.74% � 1.80%
� 0.14% � 0.13%
11.10%
2.26%
2.55%2.51%2.27%
2.07%1.28%1.06%
1.35%
1.68%
0.14%0.13%0.14%
9.84% 9.35%
� 1.99%
Injury prevention costs increased during the yearInjury prevention costs as a percentage of income from levies and appropriations increased from 1�35% ($55 million) to 1�68% ($69 million)� This was slightly below the $72 million budget� The injury prevention programmes are designed to reduce the number or severity of injuries and should lead to lower claim costs in the future� This was accounted for in the consultation levy rates� For more detail about injury prevention, see the How ACC operates and how it’s changing section�
As did spend on ICIP projects.ICIP projects as a percentage of claim payments increased from 2�07% ($77 million) to 2�27% ($91 million)� This was slightly above the budget of 2�16% ($88 million)� Implementing ACC’s new policy and levy management system was the main driver of the excess, with an overspend of close to $20 million�
Remaining operating costs decreased during the yearNet operating costs, excluding the ICIP project spend, as a percentage of income from levies and appropriations decreased from 2�55% ($105 million) to 2�51% ($103 million)� These were slightly above the budget of 2�35% ($97 million)� Personnel costs were one of the drivers� The use of contractors for business-as-usual work, restructure costs and less annual leave taken were the main contributors to personnel costs being over budget�
Along with claims handling expenses.Claims handling expenses in 2017/18, excluding the ICIP project spend, as a percentage of claim payments decreased from 9�84% ($366 million) to 9�35% ($375 million)� This was below the budget of 9�43% ($385 million)� The number of claims processed per full-time equivalent employee increased during the year from 572 to 593�

FINANCIAL CONDITION REPORT 2018 65
Financial results
Investment management costs were on budgetInvestment management costs of $53 million were in line with the budget� As a percentage of funds under management they increased slightly from 0�13% to 0�14%, in line with a budget of 0�14%�
The unexpired risk liability (URL)The balance sheet includes a provision for unearned levy revenue� This is revenue received or accrued before 30 June 2018, the end of the fiscal year� This will be used to fund claims ACC can expect to incur after 30 June 2018 that are funded by levies already received� If the revenue is not enough to cover these claims, including a risk margin, an unexpired risk liability (URL) is required to be held� Movements in the URL are recorded in the statement of comprehensive income�
The treatment of the URL is an accounting requirement and doesn’t reflect the Scheme’s funding position� The stronger the balance sheet, the more likely that ACC will need a URL� This is due to ACC having a strong funding position in the levied accounts (see the Funding position section)� This means levies are set lower than required to cover new claims, resulting in the accounting requirement to hold a URL� The URL increased by $92 million in 2017/18 due to the Work and Motor Vehicle Accounts (see Table 26 in Appendix E – Financial results)�
ACC’s funding policy utilises some of the balance sheet strength to reduce levies and appropriations� This is somewhat counter-intuitive, but should be borne in mind when considering the Scheme’s financial accounts�
New-year claims usually produce an underwriting deficitThe underwriting result is the difference between levies and appropriations and expenditure, excluding all economic items� Expenditure includes expenses and the incurred cost of claims (claims incurred)� Claims incurred is made up of changes to the OCL and the cash costs of claims� It is shown as ‘Surplus/(deficit) from underwriting activities’ in Table 9� The new-year underwriting result compares claims incurred with the levy and appropriation income received for new-year claims only�
Underwriting deficits are usually expected for new-year claims because the assumptions used to calculate the year-end OCL are different from those used to calculated levies/appropriations�
Levy rates for new-year claims assume investment returns above risk-free rates� Levy rates and appropriation amounts are set without a risk margin on the cost of new claims� The OCL uses risk-free rates and includes risk margins, so it’s expected that new claims will increase the OCL by more than is projected under the levy consultation/appropriation assumptions�
This means the year-end OCL is higher than the OCL assumed when levies were set� The resulting new-year deficit is expected to reduce gradually in future years as claim payments are made�
Table 10 – actual less expected Underwriting Result as a Percentage of income by account
Account 2015/16 2016/17 2017/18
Motor Vehicle −2.43% 0.25% 4.35%
Non−Earners’ 1.07% 0.10% 8.00%
Earners’ 2.35% −3.31% −0.48%
Work 11.33% 16.37% 13.65%
Treatment Injury −13.25% −25.19% 18.40%
Total 2.49% 0.48% 6.30%

ACCIDENT COMPENSATION CORPORATION66
Table 10 compares the expected underwriting result for new-year claims with the actual result to determine whether levies and appropriations were set appropriately� A positive percentage in Table 10 indicates that underwriting results were better than expected� An account can have an actual underwriting deficit for the year but be closer to a surplus than expected� Hence positive percentages don’t imply a surplus�
Long-term treatment injury claim assumptions have reducedTable 10 shows the underwriting result for the Treatment Injury Account being better than expected� This includes the recalibration undertaken by the new external valuation actuary� Both the recalibration and the 2017/18 final valuation reduced the Treatment Injury Account OCL by modifying long-term assumptions that appeared to be too conservative (see Appendix D – Valuation of the outstanding claims liability for more detail)� So the Treatment Injury Account ended the year with a better underwriting result than expected� But claim volumes and costs are still increasing, just at a slower rate than was assumed�
The Work Account collected more levies than expectedAll three years show large positive percentages in the Work Account� In 2016/17 and 2017/18 above-expected levy income improved the underwriting result by around 13%� The total amount that employers paid to their employees (liable earnings) was higher than expected� A higher proportion of those earnings came from high-risk industries, which increased the average levy rate� Normally an increase in liable earnings would increase claims, but this is not evident in these two years�
Weekly compensation costs were less than expected� In 2015/16 and 2016/17 this improved the underwriting result by around 6% and 3% respectively� This is primarily due to historic differences in continuance rate assumptions used to set levy rates compared to those used for the OCL (refer to Appendix C – Claim volumes, types and costs for more detail)�
The Non-Earners’ Account is underfundedThe positive Non-Earners’ Account percentage shown in Table 10 reflects lower-than-expected claims incurred in 2017/18, not a surplus of funding� In fact the income for 2017/18 claims was lower than the claims incurred� The change to the OCL from new-year claims was not as high as expected in almost all claim types� The biggest OCL differences were driven by reduced assumptions for elective surgery and social rehabilitation – care (discussed further in Appendix C – Claim volumes, types and costs)� On the cash cost of claims side, medical payments in 2017/18 for new-year claims were less than expected�
ACC projects four years aheadACC’s four-year projections are based on:
• the levy rates set by the Government for 2016/17 to 2017/18
• consulted levies for future years (see the How ACC services are funded section for further detail)
• assumptions updated to June 2018
• approved appropriations from the 2017/18 Non-Earners’ Account�

FINANCIAL CONDITION REPORT 2018 67
Financial results
Table 11 – Projected Statement of Comprehensive Income
($M) 2018/19 2019/20 2020/21 2021/22
Income
Levies and appropriations 4,302 4,453 4,583 4,771
Total income 4,302 4,453 4,583 4,771
Expenditure
Claims incurred
Medical costs 1,598 1,680 1,767 1,859
Elective surgery 549 586 628 674
Social rehabilitation 1,269 1,323 1,397 1,494
Compensation related 1,678 1,762 1,859 1,962
Other 244 252 266 285
Claims handling expenses 445 454 465 479
Total claims incurred 5,783 6,057 6,381 6,752
Expenses
Net operating costs 125 125 121 120
Injury prevention costs 78 77 77 77
Total expenses 202 203 198 197
Total expenditure 5,985 6,260 6,579 6,950
Surplus/(deficit) from underwriting activities (1,683) (1,807) (1,996) (2,179)
Decrease/(increase) in URL 98 24 82 52
Economic
Investment management costs (53) (56) (59) (63)
Unwind of risk-free interest rate (643) (707) (821) (983)
Investment income 1,503 1,591 1,694 1,803
Total economic 808 829 814 757
Total surplus/(deficit) (777) (954) (1,100) (1,369)
We expect deficits for the next four yearsThe Scheme is forecast to produce deficits for the next four years� The levied accounts are overfunded� ACC is required to return excess funding in the form of levy and appropriation reductions� Some of the projected deficit is a result of reducing levies in response to the levied account overfunding� This is why projected income increases gradually but at a slower rate than total costs�
The total cost of claims will increase by around 5% per year because of inflation, superimposed inflation, population growth and future increases in claims�
The non-earner claims are underfunded� It’s assumed that the approved non-earner appropriations from the Government for 2018/19 to 2021/22 will not increase� The approved appropriation is below the expected new-year claim costs for each year (discussed more in the How ACC services are funded section)� This increases the deficits and adds to the underfunding of the non-earner claims�
ACCIDENT COMPENSATION CORPORATION68
And the effect of economic condition changes is forecast to decrease.Gross investment income is forecast to increase� However, the discount unwind on the OCL will increase more quickly� This is due to short-term increases in the risk-free interest rates that are higher than the assumed increases in investment returns� Both rates are assumed to level off in the long term, so the difference between investment income and the unwind will level off too�
We’ve shown the projected statement of comprehensive income by account for the year ended 30 June 2019 in Appendix E – Financial results�
Fund
ing
posi
tion
69
Fund
ing
posi
tion
Funding position
Summary• The levied accounts, and the Earners’ portion of the Treatment Injury
Account, are all above the 105% target funding position�
• The increases in the outstanding claims liability (OCL) over the past four years have, to some extent, been offset by high investment returns since 2010� This has meant the funding positions haven’t moved back to the funding target as expected� The investment markets may see a correction� It’s important to monitor claim growth and policy changes that could reduce the funding position� Management should continue to identify ways to control claim costs�
• It’s unlikely that the levied accounts’ funding position will fall below 100% in the medium term� The Motor Vehicle Account has a higher risk of falling below this figure than the Earners’ or Work Account� This is because of its lower opening funding position and larger proportion of long-term claims�
• The fully-funded portion of the Non-Earners’ Account, and the Non-Earners’ portion of the Treatment Injury Account, are below the 88% target�
• The Government has contributed less than requested in appropriations for the past four years� This has contributed to funding pressures for the Non-Earners’ and Treatment Injury Accounts� We project that the funding positions of these accounts will fall further below target�
ACCIDENT COMPENSATION CORPORATION70
ACC’s solvency is different from that of private insurersPrivate insurers are legally required to have enough funds to meet minimum solvency requirements set by the Reserve Bank of New Zealand� They also often have their own insurance (reinsurance) to protect them against the risks of high-cost claims, extreme events and multiple events that lead to a large number of claims�
ACC is different� It’s a statutory monopoly with the right to raise levies� So instead of discussing regulatory solvency in this section, as a private insurer would, we consider the present and possible future funding positions of each of the accounts� In simple terms, a funding position is the ratio of assets to liabilities�
We also consider if ACC should consider reinsurance as a way to reduce risk to the funding positions�
Funding targets make sure the Scheme is fair and sustainableEach of ACC’s five accounts has a target funding position set through its funding policy (see the How ACC services are funded section)� The target funding position is not subject to the minimum solvency requirement set by the Reserve Bank of New Zealand and is lower than what would be required if it were�
The actual funding positions indicate how many ‘assets’ (mainly investments) each account has available to cover its OCL� If an account is either above or below its target, the funding policies say how the difference is to be adjusted for through recommended levies or appropriations�
Meeting funding targets ensures that the Scheme is fair and sustainable; people claiming now are generally paying for the claims they’re making�
The funding position is affected by movements in assets and liabilitiesWe’ve discussed elsewhere in the report how claim liabilities are valued and managed�
In terms of assets, Appendix F – How ACC manages its investments discusses in detail how ACC manages and governs its investments� There are a couple of points worth making here:
1� We use risk-free discount rates to work out the OCL� If actual investment returns are higher than these rates, this can lead to an improved funding position� This can then lead to reductions in levies or appropriations through the funding adjustment� The investment team has consistently achieved investment returns over benchmark and the risk-free rate� This year the gross investment return was 9�89%, in line with the benchmark and above the risk-free rate�
2� Some injuries require ACC to support clients throughout their lives� It’s difficult to find appropriate investment assets with future cash flows that match these lifetime needs� This means ACC’s claim payments are not exactly matched with investment assets and the funding position is sensitive to interest rate changes� When interest rates change the OCL impact is about twice that of the investment assets�
We’re satisfied that the investment policy and governance are appropriate, but it’s still worth noting that the funding position is sensitive to market movements that affect investment assets and the OCL differently�
Target and actual funding positions vary by accountThe target funding position for the Motor Vehicle, Earners’ and Work Accounts (the levied accounts) and the Earners’ portion of the Treatment Injury Account is 105%�
The target is 88% for the fully-funded portion of the Non-Earners’ Account and the Non-Earners’ portion of the Treatment Injury Account� This is lower than 100% because the funding policy excludes the risk margin
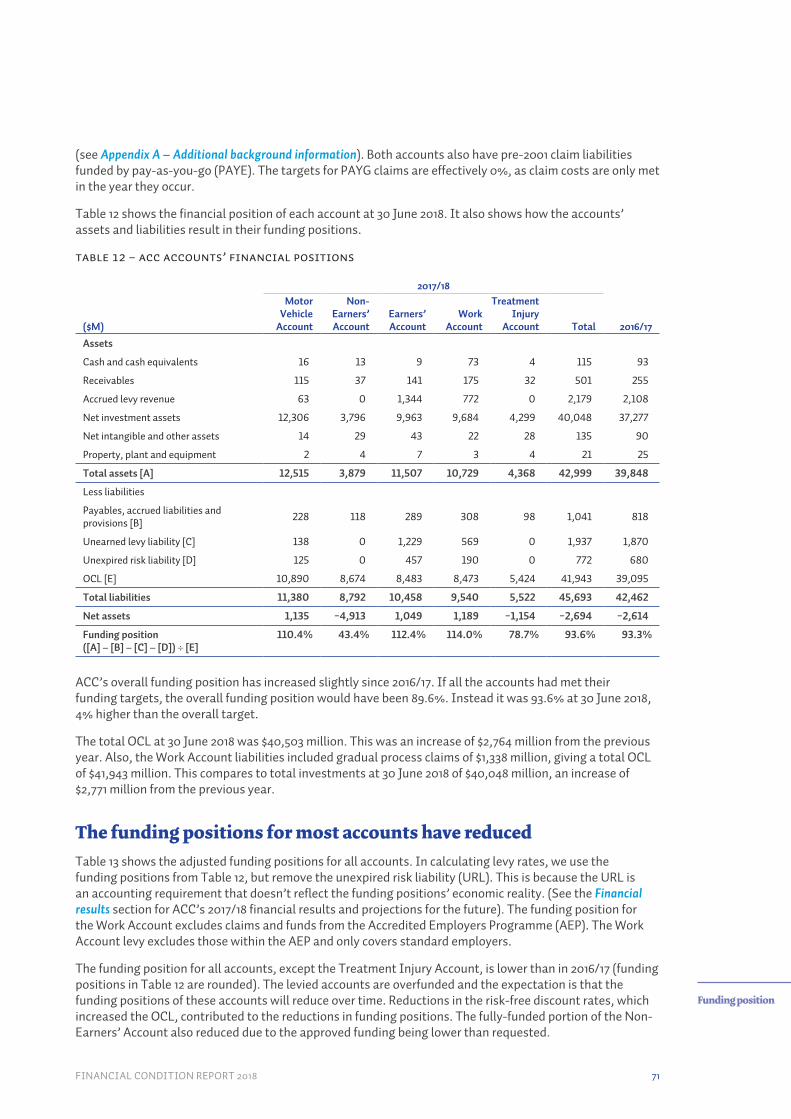
FINANCIAL CONDITION REPORT 2018 71
Funding position
(see Appendix A – Additional background information)� Both accounts also have pre-2001 claim liabilities funded by pay-as-you-go (PAYE)� The targets for PAYG claims are effectively 0%, as claim costs are only met in the year they occur�
Table 12 shows the financial position of each account at 30 June 2018� It also shows how the accounts’ assets and liabilities result in their funding positions�
Table 12 – ACC accounts’ Financial Positions
2017/18
($M)
Motor Vehicle
Account
Non-Earners’ Account
Earners’ Account
Work Account
Treatment Injury
Account Total 2016/17
Assets
Cash and cash equivalents 16 13 9 73 4 115 93
Receivables 115 37 141 175 32 501 255
Accrued levy revenue 63 0 1,344 772 0 2,179 2,108
Net investment assets 12,306 3,796 9,963 9,684 4,299 40,048 37,277
Net intangible and other assets 14 29 43 22 28 135 90
Property, plant and equipment 2 4 7 3 4 21 25
Total assets [A] 12,515 3,879 11,507 10,729 4,368 42,999 39,848
Less liabilities
Payables, accrued liabilities and provisions [B] 228 118 289 308 98 1,041 818
Unearned levy liability [C] 138 0 1,229 569 0 1,937 1,870
Unexpired risk liability [D] 125 0 457 190 0 772 680
OCL [E] 10,890 8,674 8,483 8,473 5,424 41,943 39,095
Total liabilities 11,380 8,792 10,458 9,540 5,522 45,693 42,462
Net assets 1,135 −4,913 1,049 1,189 −1,154 −2,694 −2,614
Funding position([A] – [B] – [C] – [D]) ÷ [E]
110.4% 43.4% 112.4% 114.0% 78.7% 93.6% 93.3%
ACC’s overall funding position has increased slightly since 2016/17� If all the accounts had met their funding targets, the overall funding position would have been 89�6%� Instead it was 93�6% at 30 June 2018, 4% higher than the overall target�
The total OCL at 30 June 2018 was $40,503 million� This was an increase of $2,764 million from the previous year� Also, the Work Account liabilities included gradual process claims of $1,338 million, giving a total OCL of $41,943 million� This compares to total investments at 30 June 2018 of $40,048 million, an increase of $2,771 million from the previous year�
The funding positions for most accounts have reducedTable 13 shows the adjusted funding positions for all accounts� In calculating levy rates, we use the funding positions from Table 12, but remove the unexpired risk liability (URL)� This is because the URL is an accounting requirement that doesn’t reflect the funding positions’ economic reality� (See the Financial results section for ACC’s 2017/18 financial results and projections for the future)� The funding position for the Work Account excludes claims and funds from the Accredited Employers Programme (AEP)� The Work Account levy excludes those within the AEP and only covers standard employers�
The funding position for all accounts, except the Treatment Injury Account, is lower than in 2016/17 (funding positions in Table 12 are rounded)� The levied accounts are overfunded and the expectation is that the funding positions of these accounts will reduce over time� Reductions in the risk-free discount rates, which increased the OCL, contributed to the reductions in funding positions� The fully-funded portion of the Non-Earners’ Account also reduced due to the approved funding being lower than requested�

ACCIDENT COMPENSATION CORPORATION72
Except the Treatment Injury Account.The Treatment Injury Account’s funding position for the Earners’ and Non-Earners’ portions is higher than in 2016/17� The recalibration completed by the new external valuation actuary reduced the OCL for the Treatment Injury Account due to revised assumptions of the expected number of new claims and continuance rates for older accident-year payments� The Treatment Injury Account OCL reduced further during 2017/18 as the growth in new claims continued to slow, along with further improvements in the recovery rates for older accident-year claims� The OCL reduction combined with good investment returns meant the funding ratio for the Treatment Injury Account improved during the year�
Table 13 – Funding Positions in Past Three Years, excluding URL
As at 30 June 2016 2017 2018 Target
Motor Vehicle Account 108% 112% 112% 105%
Non-Earners’ Account 42% 43% 43%
Fully-funded portion 80% 80% 76% 88%
Earners’ Account 119% 120% 118% 105%
Work Account 117% 124% 116% 105%
Treatment Injury Account 68% 67% 79%
Earners’ portion 111% 111% 146% 105%
Non-Earners’ fully-funded portion 80% 74% 81% 88%
Total 93% 95% 95%
Some accounts are above target, and some are belowThe levied accounts, and the Earners’ portion of the Treatment Injury Account, are still above their 105% targets�
The fully-funded portion of the Non-Earners’ Account is below the 88% target at 76%� The Non-Earners’ portion of the Treatment Injury Account continues to be below its 88% target, but it has improved by 7% to 81%�
But continued monitoring of the funding position is needed.In the previous four years claim volumes and costs have been higher than expected, causing OCL increases� This year there was some improvement in expected claim payments along with the recalibration, which had the largest impact on the Treatment Injury Account� The increases in the OCL have, to some extent, been offset by high investment returns since 2010� This has meant the funding positions haven’t moved back to the funding target as quickly as expected� The investment markets may see a correction, so it’s important that we:
• continue to monitor the increase in claims over and above other factors such as inflation and the growth in population� This includes monitoring policy changes that enhance entitlements that reduce the funding position, and lead to levy and appropriation increases
• identify ways to control claim costs while maintaining services to injured people� See the How ACC services are funded section for more detail on actions that management has taken to reduce how much levy payers pay in levies, and how much the Government contributes in appropriations�

FINANCIAL CONDITION REPORT 2018 73
Funding position
We’ve projected funding positions and levy rates for the levied accountsThe levied accounts’ funding positions affect levy rates significantly� Here we give a projection of the funding positions and levy rates�
Our projections use the rates the Board consulted on in September and October 2018� These were based on claim and economic assumptions at 30 June 2018� See the How ACC services are funded section for the consultation levy rates�
ACC recommends, and the Government then sets, levies well in advance of when they apply� This means that actual funding positions when new levies apply can differ from those used when consulting on the rates� The funding policies for these accounts aim to reduce the impacts on levy rates of these differences�
Graph 13 shows:
• approved levy rates up to 2018/19
• consultation levy rates from 2019/20
• funding positions that result for 2019/20 to 2023/24�
The Non-Earners’ Account levy rates include funding earners’ treatment injury claims� See the shaded region at the top of each bar�
Graph 13 – Levied accounts’ apProved and indicative Levy Rates and corresponding projected funding positions
2017
/18
2017
/18
2017
/18
2018
/19
2018
/19
2018
/19
2019
/20
2019
/20
2019
/20
2020
/21
2020
/21
2020
/21
2021
/22
2021
/22
2021
/22
2022
/23
2022
/23
2022
/23
2023
/24
2023
/24
2023
/24
Levy year
Motor Vehicle Account Earners’ Account Work Account
Projected funding position at end of levy year Target funding position at end of levy year
$114 $128 $135 $144$0.72 $0.73$0.70$0.67
$1.21 $1.24 $1.26 $1.29
112%111%111% 111% 111%110%110% 118% 117% 116% 115%114% 113% 112% 116% 118% 118% 117% 116% 115%115%
The consultation levy rates are set below the costs of new-year claims to move the funding positions gradually towards their 105% funding target over 10 years� In each successive year, any remaining surplus or deficit is recovered in the subsequent 10 years, so the target is reached through reducing increments�
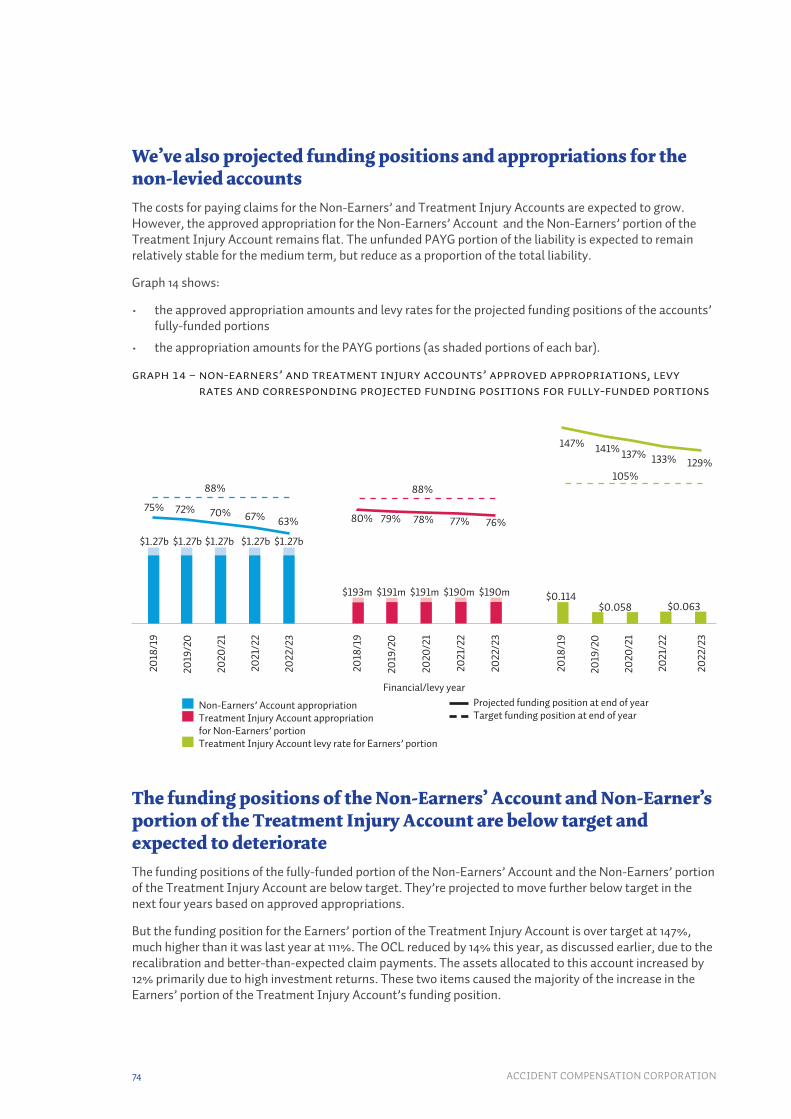
ACCIDENT COMPENSATION CORPORATION74
We’ve also projected funding positions and appropriations for the non-levied accountsThe costs for paying claims for the Non-Earners’ and Treatment Injury Accounts are expected to grow� However, the approved appropriation for the Non-Earners’ Account and the Non-Earners’ portion of the Treatment Injury Account remains flat� The unfunded PAYG portion of the liability is expected to remain relatively stable for the medium term, but reduce as a proportion of the total liability�
Graph 14 shows:
• the approved appropriation amounts and levy rates for the projected funding positions of the accounts’ fully-funded portions
• the appropriation amounts for the PAYG portions (as shaded portions of each bar)�
Graph 14 – Non-Earners’ and Treatment Injury Accounts’ approved appropriations, levy rates and corresponding projected funding Positions FOR FULLY-FUNDED PORTIONS
2018
/19
2018
/19
2018
/19
2019
/20
2019
/20
2019
/20
2020
/21
2020
/21
2020
/21
2021
/22
2021
/22
2021
/22
2022
/23
2022
/23
2022
/23
Financial/levy year
Non-Earners’ Account appropriation Treatment Injury Account appropriation
for Non-Earners’ portion Treatment Injury Account levy rate for Earners’ portion
Projected funding position at end of year Target funding position at end of year
$0.058$0.114$190m $190m
88%88%
$191m $191m$193m
$1.27b $1.27b$1.27b $1.27b$1.27b
105%
147% 141% 137% 133% 129%
$0.063
80% 79% 78% 77% 76%75% 72% 70% 67% 63%
The funding positions of the Non-Earners’ Account and Non-Earner’s portion of the Treatment Injury Account are below target and expected to deteriorateThe funding positions of the fully-funded portion of the Non-Earners’ Account and the Non-Earners’ portion of the Treatment Injury Account are below target� They’re projected to move further below target in the next four years based on approved appropriations�
But the funding position for the Earners’ portion of the Treatment Injury Account is over target at 147%, much higher than it was last year at 111%� The OCL reduced by 14% this year, as discussed earlier, due to the recalibration and better-than-expected claim payments� The assets allocated to this account increased by 12% primarily due to high investment returns� These two items caused the majority of the increase in the Earners’ portion of the Treatment Injury Account’s funding position�

FINANCIAL CONDITION REPORT 2018 75
Funding position
Funding positions are sensitive to several key driversThere are a number of key factors that drive changes in the funding position, by changing asset values, liability values, or both�
While ACC can influence some of these factors, others are beyond ACC’s control, such as:
• what’s happening in the economy
• how this affects interest rates�
Table 14 shows how a 1% move in interest rates could change the OCL, the investment portfolio and the funding position� It also shows how changes in major claim risks could change the OCL and the resulting change in the funding position�
Table 14 – SENSITIVITY OF FUNDING POSITION
Sensitivity of funding position Change in OCL ($M)
Change in assets ($M)
Change in funding position
1% rise in interest rates −5,791 −3,144 +6.3%
1% fall in interest rates 7,624 3,521 −7.3%
1% increase in superimposed inflation – social rehabilitation for serious injury 3,272 0 −6.8%
1% increase in superimposed inflation – elective surgery 766 0 −1.7%
1% increase in superimposed inflation – medical and social rehabilitation non-serious injury 728 0 −1.6%
1% increase in long-term continuance rates for weekly compensation 852 0 −1.9%
1% increase in long-term continuance rates for elective surgery 1,114 0 −2.4%
When the cash flows from claim payments and investment assets are matched as closely as possible, the variability in the funding position due to interest rate changes reduces� Stable funding positions can lead to more consistent levy rates and appropriations� A 1% rise in interest rates would decrease the value of the OCL and the investment assets, resulting in a $2,647 million increase in net assets� The overall funding position would increase by 6% to 100%� On the other hand, a 1% fall in interest rates would reduce net assets by $4,103 million, and the overall funding position would fall to 86%�
A 1% increase in superimposed inflation for medical and social rehabilitation would create the largest OCL increase� If this happened, investment assets wouldn’t change and the overall funding position would fall to 87%�
Changes don’t always happen independently� Interest rates can move along with changes in superimposed inflation and continuance rates� Under these scenarios, the overall change to the OCL and investment assets can be much greater than the individual change�
And the OCL affects levy rates and appropriations.Changes in the OCL can also affect levy rates and appropriations� For example, a $1 billion increase in the OCL, spread over 10 years, would increase total annual levies and appropriations (about $4�1 billion in 2017/18) by 2�5%�

ACCIDENT COMPENSATION CORPORATION76
We’ve looked at possible future funding positions for the different accountsChanges in economic and claim trends can vary funding positions, with implications for levies and appropriations�
To understand more, we simulate future examples of these variations for the three levied accounts and the fully-funded portion of the Non-Earners’ Account� The simulations allow for:
• the funding position now
• variations in economic factors, including the earned rates of investment returns, inflation rates and discount rates
• changes in the number of claims, continuance rates, average payments and superimposed inflation�
For each simulation, the assumptions are allowed to change each year� For the levied accounts, levies are then recalculated by applying the funding policy� The Non-Earners’ Account uses the approved appropriation amounts from Budget 2018�
We’ve generated funding positions for each simulation and associated six simulations of the revised levy paths� Using all simulations, Graph 15 to Graph 17 show the probability in each levy account of the funding position being: below 100%; between 100% and 110% (the target funding band); and above 110% in the next six years� Alongside these are six simulations showing potential variability in the levy path compared to the consultation rates�
Graph 18 shows the projected funding position for the Non-Earners’ Account, and the probability of the funding position being above the 88% target�
Graph 15 – EARNERS’ Account: Projected funding position and Levy path
%
0 0.8
1.20
1.60
2.00
20
40
60
80
100
Below 100% Between 100% and 110% Above 110%
2019/20 2020/21 2021/22 2021/22 2023/24 2024/25
200
5
200
6
200
7
200
8
200
9
2010
2011
2012
2013
2014
2015
2016
2017
2018
2019
2020
2021
2022
2023
2024
2025
2026
2027
2028
Levy year ending 31 March Historical rates Consultation rates Simulation 1
Simulation 2 Simulation 3 Simulation 4
Levy
rate
15
Graph 16 – Work Account: Projected funding position and levy path
%
0 0.20
0.40
0.60
0.80
1.00
1.20
1.40
1.60
20
40
60
80
100
Below 100% Between 100% and 110% Above 110%
2019/20 2020/21 2021/22 2021/22 2023/24 2024/25
200
7
200
8
200
9
2010
2011
2012
2013
2014
2015
2016
2017
2018
2019
2020
2021
2022
2023
2024
2025
2026
2027
2028
Levy year ending 31 March Historical rates Consultation rates Simulation 1
Simulation 2 Simulation 3 Simulation 4
Levy
rate
16

FINANCIAL CONDITION REPORT 2018 77
Funding position
Graph 17 – MOTOR VEHICLE Account: Projected funding position and levy path
%
0 0
50
100
150
200
250
300
350
400
20
40
60
80
100
Below 100% Between 100% and 110% Above 110%
2019/20 2020/21 2021/22 2021/22 2023/24 2024/25
200
6
200
7
200
8
200
9
2010
2011
2012
2013
2014
2015
2016
2017
2018
2019
2020
2021
2022
2023
2024
2025
2026
2027
Levy year ending 30 June Historical rates Consultation rates Simulation 1
Simulation 2 Simulation 3 Simulation 4
Levy
rate
17
Graph 18 – Projection of funding position Probabilities for Non-Earners’ Account (Fully-Funded Portion)
%
0
20
40
60
80
100
Below 88% Above 88%
2020/21 2021/22 2021/22 2023/24 2024/25 2025/26
18
The levied accounts show strong resilience
EARNERS’ ACCOUNT
The Earners’ Account has the strongest opening funding position� There is a relatively low risk of its funding position falling below 100% in the medium term� The levy is about 17% of the 30 June 2018 OCL, the highest of the levied accounts�
The Earners’ Account’s resilience is reflected in the four simulated levy paths, which contain a small amount of variability in the future� About 10% of all the simulated levy paths produce an increase over that allowed for in the funding policy (15% levy increase) in the first year� This increases to over 25% in all simulated levy paths in the medium term� Overall, the Earners’ Account is relatively well placed to withstand future changes in interest rates and claim patterns�
WORK ACCOUNT
The Work Account’s funding position has a higher risk of falling below 100% than the Earners’ Account in the medium term� This is partly due to the opening funding position being slightly below that of the Earners’ Account� The levy is about 9% of the OCL� The Work Account is more exposed to future variability in investment income than the Earners’ Account�
The four simulated levy paths indicate a slightly lower variability in the future compared with the Earners’ Account� About 10% of all the simulated levy paths produce increases over those allowed for in the funding policy in the first year� This increases to over 30% in the medium term� The Work Account is relatively well placed to withstand future changes in interest rates and claim patterns�

ACCIDENT COMPENSATION CORPORATION78
MOTOR VEHICLE ACCOUNT
The Motor Vehicle Account’s funding position has the highest risk of falling below 100% of the levied accounts� This is because it has the lowest opening funding position and has the greatest uncertainty from long-duration client claims� The levy income is about 4% of the OCL and has highest exposure to future variability in investment income�
The Motor Vehicle Account’s simulated levy path also shows the most variability of the levied accounts, with some simulations around 80% higher than the consulted levy path in the medium term� Over 40% of the simulated levy paths produce increases over those allowed for in the funding policy (approximately 19% for Motor Vehicle) both in the first year and in the medium term� The Motor Vehicle Account funding position can withstand some future changes to interest rates and claim patterns because the account is in surplus� But it is sensitive to these drivers, and they are likely to have a much larger impact on its future levy than on other accounts�
But the Non-Earners’ Account’s funding position is less secure.Graph 18 shows that it’s unlikely that the fully-funded portion of the Non-Earners’ Account will rise above its 88% funding target with the approved appropriations� This is because:
• the present funding position is below target
• the approved appropriation remains less than the projected new-year claim costs
• projected increases in future claim costs are greater than the increases in the approved appropriation path�
We’ve discussed the funding pressures on the accounts in other sections of this report – see the How ACC services are funded section�
The Board decided against reinsuranceReinsurance is used in the insurance industry to protect insurers from financial risks� These risks can include high-cost claims, extreme catastrophic events and multiple events leading to many claims in one cover period� A premium is paid for the reinsurance and this should be evaluated against the potential risks it will cover�
The Board periodically reviews the need for reinsurance, and in 2017 agreed it wasn’t required� This is because:
• very long-term individual claims aren’t large enough to materially affect the Scheme’s net assets
• the most extreme catastrophes and resulting claims wouldn’t threaten ACC’s ability to pay claims in the short term� The Scheme can also post-fund these claims for these events�
Unless there is a significant change in Scheme circumstances, the next reinsurance review will not be needed for another three or four years�

79
Add
itio
nal b
ackg
roun
d in
form
atio
n
Appendix A
Additional background information

ACCIDENT COMPENSATION CORPORATION80
Services ACC providesTable 15 summarises the main services that the Scheme provides for covered personal injuries�
Table 15 – Schedule of Services
Medical
Public health acute services
Accidental injury costs from acute inpatient care, emergency department, outpatient, complex burns, pharmaceuticals and laboratories.
General practitioners (GPs)
Payments to GPs and accident and medical clinics.
Radiology Payments for radiology services – low-tech (for example X-ray) and high-tech (for example magnetic resonance imaging [MRI]).
Physiotherapy Payments to physiotherapists.
Ambulance Emergency transport to a medical facility, by road and/or air.
Elective surgery Mainly orthopaedic-related surgery.
Other Medical All medical costs except those listed above. These include counselling for claims that need support beyond physical injuries.
Compensation
Weekly compensation – non-fatal
Loss of earnings and loss of potential earnings for minors.
Death benefits Funeral grants and support for spouses and/or dependants.
Rehabilitation
Lump sum and independence allowance
Additional support to compensate for permanent impairment due to injury. This includes work-related gradual process claims that result from ongoing exposure to an element, for example asbestos. For injuries that occurred on or after 1 April 2002, this is paid in the form of a lump sum. Eligible claims for injuries occurring prior to that receive quarterly independence allowance payments. Independence allowance payments may also be paid to clients with gradual process, sensitive or treatment injury claims, if the exposure occurred on or before 31 March 2002.
Vocational Programmes to support clients’ return to independence.
Social rehabilitation Serious injury Capital Mainly housing and motor vehicle modifications for people with serious injuries.
Non-capital Care costs (such as attendant care and assessments) and other costs related to serious injury.
Non-serious injury
Capital Mainly equipment, orthotics for splints, medical consumables and residential modification costs for people with non-serious injuries. Includes ongoing aids and appliances for hearing loss suffered through traumatic events or prolonged work exposure to loud noise.
Non-capital Providing care, assessments and other social rehabilitation support for people with non-serious injuries.

FINANCIAL CONDITION REPORT 2018 81
Appendix A Additional background information
ACC’s five accountsACC manages five accounts� Each matches where its funding comes from with where injury risks happen� Table 16 summarises the coverage and levy/funding of each account�
Table 16 – Account Description
Account Environment where injury occurs Funded through
Motor Vehicle Involves a motor vehicle on a public road Vehicle licensing charge plus levy on petrol (not diesel).
Work At work or work related Levy charged to employers as a percentage of payroll and the self-employed as a percentage of taxable earnings.
Treatment Injury When receiving medical treatment in the health care system
Paid from the Non-Earners’ and Earners’ Accounts.
Non-Earners’All other locations and activities
Government taxation.
Earners’ Levy is percentage of salary collected as part of PAYE tax.
The accounts aren’t as neatly defined as this because of changes over time� In particular, the Work Account includes all injuries to earners, whether at work or not, that happened before 1 July 1992�
Non-Earners’ Account funding policyOn 15 May 2017 Cabinet changed the funding policy for the Non-Earners’ Account� The funding policy is shown in Table 17�
Table 17 – Non-Earners’ Account funding policy from 2018/19
Pre-1 July 2001 claims Post-1 July 2001 claims
• Pay-as-you-go basis�• One-year funding horizon�• Funding position target of 0%�
• Fully-funded basis�• Costs are discounted using investment forecasts� • Funding position target of 100% of actual liabilities, excluding risk margin, or 88%
including risk margin�• Three-year funding horizon when the account is above its funding target�• 10-year funding horizon when the account is below its funding target�

ACCIDENT COMPENSATION CORPORATION82
ProductsWORK ACCOUNT
The Work Account provides a small range of products that allow varying degrees of risk-sharing by employers�
EMPLOYERS
Most employers are insured through WorkPlace Cover, which provides full insurance cover for accidents in the workplace�
Large employers may choose the Accredited Employers Programme (AEP)� This allows them to self-insure some of their risks in return for significantly lower levies� In effect, ACC subcontracts the management of employees’ work-related claims to these employers� In return, they pay lower levy amounts�
The AEP’s goal is to improve workplace safety and rehabilitation by providing employers with financial incentives� Employers must show:
• satisfactory workplace safety standards
• effective claim management
• that they have the financial backing to carry the self-insurance risk�
Employees of participating employers who self-insure make up about 20% of the workforce�
The AEP imposes a level of credit risk on the Work Account� If a company fails, the claim costs revert to the Work Account� ACC mitigates this risk through annual credit risk assessments and imposing ‘stop loss’ and ‘high-cost claims cover’ requirements� To date, only two organisations have left the AEP without being able to pay the outstanding liability, due to company failures:
1� Feltex in 2006/07�
2� Mainzeal in 2013/14�
Both cost the account approximately $2�1 million� The Work Account’s total annual levies in 2017/18 were around $740 million so these failures cost less than 0�3% of one year’s levies�
SELF-EMPLOYED
Most self-employed people are insured under CoverPlus� This covers work and non-work injuries and includes risks that would otherwise arise in the Earners’ Account�
CoverPlus Extra provides agreed-value weekly compensation cover for the self-employed and non-PAYE shareholder employees� This gives people who have volatile incomes some certainty in their cover�
INCENTIVE PROGRAMMES
Until 31 March 2017 ACC offered two incentive programmes to encourage safety in the workplace: Workplace Safety Management Practices and Workplace Safety Discounts� Both programmes offered levy discounts in return for businesses meeting certain health and safety standards�
For customers in either programme before 31 March 2017, ACC will continue support until these agreements end� All contracts finish by 30 June 2019�
EXPERIENCE RATING
Experience rating modifies an employer’s Work Account levy based on its claim history� ACC considers injury and return-to-work rates in assessing how much to modify� ACC can increase levies for large employers by up to 75% and decrease them by up to 50%�
A No-Claims Discount scheme applies to small employers who pay levies less than $10,000 every year, and the self-employed� ACC can modify levies by plus or minus 10%�
Experience rating is mandatory, but not all businesses have the three years’ experience needed to be eligible�
ACC is reviewing the experience rating programme as the incentive programmes come to an end�

FINANCIAL CONDITION REPORT 2018 83
Appendix A Additional background information
MOTOR VEHICLE ACCOUNT
ACC launched Fleet Saver, a fleet safety incentive programme for the Motor Vehicle Account, in December 2013� It was modelled on the Workplace Safety Management Practices programme, and designed to improve the safety performance of commercial vehicle fleets� In July 2014 Fleet Saver was extended to businesses renting out heavy goods service vehicles�
ACC changed Fleet Saver’s audit requirements in July 2017 to bring it in line with the Health and Safety at Work Act 2015� Because of this change and the removal of the associated Workplace Safety Management Practices programme, a smaller number of businesses signed up for Fleet Saver in 2017/18� The programme had 85 member businesses at 30 June 2018, about 6% of the heavy vehicle fleet� This was a reduction from the 118 businesses that were in the programme in 2016/17�
During the 2019/21 levy period, ACC will be reviewing the programme and its audit system� The review will check that Fleet Saver is still fit for purpose and showing value through safer fleet work practices leading to fewer and less serious accidents�

ACCIDENT COMPENSATION CORPORATION84
Claims management process
Front-end claims managementGPs and other treatment providers, such as physiotherapists and chiropractors, lodge claims directly with ACC� Only specified health practitioners can certify clients as unfit for work�
The Accident Compensation Act 2001 (AC Act) has a low threshold for cover but the vast majority of claims require only one or two treatments� ACC pays for medical services provided�
ACC manages these high-volume claims by easy entry and quick recovery, a highly efficient system� But the Scheme risks paying for claims that aren’t injuries or for more services than are required� The Scheme mitigates these risks by claim escalation processes and trigger points� These identify complex or potentially long-term claims, or when treatments go beyond identified benchmarks for particular injuries�
Claim screeningACC screens all claims for long-term risk and/or complexity� ACC has established standard screening processes to determine the:
• likelihood that a client will require weekly compensation or support beyond provider-led treatment
• risks of extended periods of cover (for example, psychosocial screening helps to identify other factors in clients’ lives that may lessen their recovery and slow down their rehabilitation and return to independence)
• potential for clients to recover at work if their workplaces are adjusted for them�
Low-complexity claimsShort-Term Claims Centres manage claims if clients are expected to recover fully in 10 weeks, and their claims aren’t complex� The primary aim is a rapid return to work or independence� Claim management focuses on medical treatment, early intervention, vocational support, rehabilitation progress against injury benchmarks, and monitoring any developing psychosocial issues�
High-complexity claimsCase mangers manage claims if it’s likely that the clients will need support for 10 weeks or more, or will need a range of support services�
They focus on clients recovering within an ideal time for their specific injuries� Case managers:
• prepare rehabilitation plans based on medical advice and best practice
• ask employers to support clients’ return to full or partial duties when they’re ready
• organise vocational rehabilitation�
Where needed, case managers arrange for clients to get advice on alternative employment opportunities�
The AC Act sets certain legislative parameters as follows:
• Rehabilitation – needs assessments must only consider the consequences of original covered injuries�
• Incapacity – expert medical opinion decides if a client continues to be incapacitated and if this is because of the covered injury�
• Vocational independence assessment – once a client has received rehabilitation support, as agreed in a formal rehabilitation plan, they’re assessed for vocational independence� The assessment considers if the client is capable of full-time work they’re suited to and trained for� If they’re capable, their entitlement to weekly compensation can end three months after this decision�
A centralised Long-Term Service Claims Unit manages long-term clients who’ve been rehabilitated as far as possible and have stable needs� Five staff manage about 1,500 claims� This service frees up other case managers from day-to-day administration and makes sure that long-term clients get the support they need�

FINANCIAL CONDITION REPORT 2018 85
Appendix A Additional background information
Seriously injured clients – lifelong disabilityACC has just over 6,000 clients with serious injuries� In many cases they need lifelong support� Specialised case owners manage these claims�
The case owners support clients to achieve independence goals, bearing in mind their injuries� In some cases clients maintain a level of employment� The case owners make sure that clients receive appropriate support�
Some clients, while their injuries aren’t quite severe enough to be classed as serious injury claims, are also supported using the serious injury case management approach� Case managers manage about 1,000 claims like this, attached to the local serious injury team� Clients include those with: traumatic brain injuries; back and neck injuries with neurological and deteriorating impairment; single-limb amputation; and pre-existing disabilities that will affect injury recovery� Long-term support is provided to some of these clients�

86 ACCIDENT COMPENSATION CORPORATION
Ris
k m
anag
emen
t
Appendix B
Risk management

FINANCIAL CONDITION REPORT 2018 87
Appendic B Risk management
ACC has worked on improving its risk management framework and processesThis year ACC focused on getting the right risk management framework in place� We provide detail in this section on that framework and the processes in place to monitor and manage risks�
But now needs to embed and own the risk management practice.Going forward, the organisation will need to put more focus on embedding risk management practices in all areas� This is especially important in a change environment to ensure that ACC delivers the right outcomes for clients, levy payers and tax payers� The Risk and Compliance Office needs to help the business pay particular attention to risk and embed risk management practices while going through the change programme�
ACC’s risk maturity increased last yearThe enterprise risk conversations at executive and Board levels matured during 2017/18� Both focused on ACC’s strategic enterprise risks and management’s response to risks�
The Board refreshed the Enterprise Risk Management Framework, aligned to AS/NZS ISO31000:2009 Risk Management Principles and guidelines and the COSO Enterprise Risk Management – Integrated Framework�
Overall, ACC made acceptable progress during the year� The organisation delivered key risk management initiatives, including:
• implementing the ‘Five Lines of Assurance’ model
• the Board establishing a risk appetite framework and a set of risk appetite statements
• strengthening risk support
• establishing sound processes and change risk management practices�
In addition, following a review by Assurance Services, the Risk and Compliance Office began to develop a roadmap to ensure corporate policies were fit for purpose and regularly reviewed� The roadmap was completed in December 2018�
ACC also strengthened compliance maturity, introducing risk-based compliance attestation, testing and reporting�
KPMG reported the framework was appropriateThe Board Risk and Audit Committee asked KPMG to review ACC’s risk management framework� KPMG concluded that the framework was adequately designed and appropriate in its intent� It also noted that the framework implementation was starting to take hold within the organisation� More communication and support are needed in the coming year to further embed the framework across the organisation�
And the risk operating model is fit for purposeKPMG noted a ‘consistent implementation’ of risk management practices at Board and executive levels� In other areas of the framework there was variable implementation� It also noted that technology support and quantitative methods and modelling were at their early stages�
With recommendations for improvements.KPMG recommended that ACC:
• clarify roles and accountabilities across the Five Lines of Assurance
• further develop risk capabilities
• improve the existing risk operating model to fully realise the value of enterprise risk management in day-to-day business�
The organisation is working, or planning to work, on these key deliverables in 2018/19� Specifically, attention is needed on the operating model along with a stronger executive commitment to owning risk management and clarifying roles and responsibilities�
When ACC implements a risk management technology solution, it will help enable the organisation to increase its risk maturity significantly� The organisation put this on hold during 2016/17 to meet other organisational investment priorities�

ACCIDENT COMPENSATION CORPORATION88
Developing an enterprise incident and issue framework, and continuing with the compliance work plan, will also increase risk maturity�
ACC needs an effective risk cultureThe risk culture of an organisation is about how willing it is to take the right risks to improve the customer experience, meet stakeholder expectations and protect its assets� ACC has begun discussions across the organisation to define and embed an effective risk culture and the right behaviours to support it� The risk culture the organisation needs is more than compliance and managing regulatory risk� It also includes mitigating financial, operational and conduct risks, and taking risks to improve operational performance�
Particularly as it transforms.ACC’s Integrated Change Investment Portfolio (ICIP) and increased customer expectations mean it needs to be even more vigilant about how the organisation behaves� It must make sure that behaviour continues to meet New Zealanders’ high expectations� ACC needs to avoid: public failures; investment strategies that put market returns over social outcomes; poor decisions; and organisational complacency�
The executive and the Board monitor risk continuouslyThe executive and the Board’s Risk Assurance and Audit Committee monitor and evaluate ACC’s risk management framework, maturity and internal control system� Assurance Services and external auditors independently advise on the:
• risk and controls environment
• effectiveness of risk management�
The executive decides and prioritises ACC’s enterprise-level risks, and reports them to the Board�
ACC implemented the Five Lines of Assurance risk modelACC implemented the Five Lines of Assurance risk model this year and will continue to refine it in the coming year�
The Five Lines of Assurance:
• focuses attention on strategic objectives to better support the enterprise
• identifies value creation treatments (upside/performance aspect) and value protection treatments (downside/minimising harm)
• improves links between strategy/planning and risk management
• defines specific accountabilities for the Board,the Chief Executive and the executive to identify, challenge and monitor residual risk
• defines an active role for the Board to assess the effectiveness of risk management processes
• elevates the role and importance of internal assurance over risk management�

FINANCIAL CONDITION REPORT 2018 89
Appendic B Risk management
Here are the Five Lines of Assurance in more detail
Assurance line Activities
First Line of Assurance – The people
People need to be in control of their day-to-day business activities to recognise and respond proactively to manage risks.
Managers are responsible for managing risks that relate to objectives for their business groups.
Day to day, people:
• understand their business risks and controls• manage risks by operating within ACC’s legislation, policies
and procedures• ensure decision-makers consider risk and operate within
their risk appetites• identify, report and escalate any incidents and near misses�
Second Line of Assurance – Enabling (specialist) functions
These functions oversee and provide specialist subject matter expertise across ACC. Examples are risk and compliance, health and safety, privacy, cyber security, integrity, communications and legal services.
These functions:
• oversee, challenge and advise• keep policies up to date and fit for purpose• educate, inform and design risk management processes• check if the control framework is working effectively• report on risk insights to the executive and Board�
Third Line of Assurance – Assurance Services and external assurance providers
Assurance Services and its assurance providers independently review the reliability of ACC’s risk management processes and performance.
Services include:
• reviews and audits of the control environment, policy adherence, performance effectiveness, governance and accountability
• independent quality assurance of the significant change programme�
Fourth Line of Assurance – Chief Executive and executive
The Chief Executive and executive are responsible for building and maintaining a robust risk management process.
They need to:
• identify and manage risks to achieve ACC’s strategic intentions and business objectives
• manage risk within ACC’s risk appetite and report to the Board on risk treatment status
• operationalise policies, processes and compliance within their business areas�
Fifth Line of Assurance – ACC Board The Board:
• has overall responsibility for ensuring robust risk management
• ensures the governance of effective risk management policies and processes
• sets risk parameters and the risk appetite • assesses risk status and targets�

ACCIDENT COMPENSATION CORPORATION90
Table 18 shows a summary of the activity completed in the 2017/18 financial year�
Table 18 – Components of the Risk Maturity Growth Plan delivered in 2017/18
Strategy component Deliverables for 2017/18 and 2018/19 What ACC delivered in 2017/18
Enterprise risk management Define roles and responsibilities under Five Lines of Assurance.
Risk and Compliance Office support to transformation programme.
Complete revision of the Enterprise Risk Management Framework. Develop risk guidelines and supporting learning.
Develop risk reporting and interconnectedness, including present and emerging risk trends.
Embedded the Five Lines of Assurance model and refined the ‘enhanced partnership’ model.
Implemented a new Enterprise Risk Management Framework.
Strengthened risk management in the annual strategic and business planning process.
Strengthened risk management within project methodologies and processes.
Realigned Board enterprise risk and treatment discussions with ACC’s strategic intentions.
Established new enterprise risk review process for internal, external and emerging risks.
Risk appetite Finalise risk appetite framework and statements with executive and Board.
Develop risk tolerance metrics.
The executive and Board agreed on ACC’s risk appetite. This helps to strengthen the strategy planning processes, and guides investment and day-to-day decision-making.
Compliance Compliance maturity programme.
Roll out the compliance attestation process.
Review corporate policy framework.
Established and maintained the corporate policy framework.
Established and rolled out a new compliance attestation process.
Delivered to the annual compliance plan and undertook compliance maturity activities to strengthen ACC’s compliance environment.
Stakeholder management Re-launch to emphasise the positive nature of risk management.
Draft the stakeholder strategy.
Introduce a risk awareness programme.

FINANCIAL CONDITION REPORT 2018 91
Appendic B Risk management
Key deliverables not achieved were:
• risk appetite tolerance metrics and reporting
• risk competency guidelines with a learning and development programme
• implementing the Integrated Risk Management System (IRMS)
• parts of the compliance maturity programme, and risk awareness programme�
Table 19 includes the 2018/19 and 2019/20 programmes�
Table 19 – Work programme for Risk Maturity Growth Plan for 2018/19 and 2019/20
Strategy component What ACC will deliver
Risk appetite Embed risk appetite in day-to-day decision-making and prioritisation across ACC. Develop risk tolerance metrics and reporting.
Risk culture Conversations with lead teams to help refine the key behaviours that would best help to continuously improve organisational culture using a risk lens. Integrating this work with the wider organisational culture strategy activities.
Include risk culture analysis in all relevant internal audit activities commenced from January 2019.
Reconciliation of this activity with the 35 recommendations from the Royal Commission into Misconduct in the Banking, Superannuation and Financial Services Industry’s interim report and the full Commission report when it’s publicly available (the interim report is not focused on insurance).
Risk operating model Embed the ‘enhanced partnership’ risk operating model.
Implement the risk competency framework.
Provide ongoing risk management support to the change programme.
Continue to develop enterprise risk management standards and tools.
Deliver the business continuity programme.
Develop an enterprise incident management approach.
Revise the Enterprise Risk Management Framework.
IRMS Develop interim tools to consistently collect risk information.
Start implementing the IRMS.
Compliance Deliver the annual compliance plan.
Deliver the corporate policy governance roadmap.
Enterprise risk information Increase data analytics’ use to strengthen risk insights.
Develop risk interconnectedness, including present and emerging risk trends.
Stakeholder management Lead the cultural shift in risk management across the organisation.
Draft a stakeholder strategy and value proposition.
Implement a risk awareness programme.

ACCIDENT COMPENSATION CORPORATION92
Table 20 shows the Board’s and executive’s seven highest-priority enterprise risks during 2017/18� It also includes the actions that management are taking in response�
Table 20 – Priorities in the organisation’s risk profile
Risk Management actions
Delivering the enterprise change
We fail to deliver the integrated enterprise change and/or the change is not successfully embedded, reliable and sustainable.
Embed the integrated change governance model.
Implement the change delivery model and embed the Delivery Integration function.
Assess the maturing change impact, achievement and benefits.
Customer expectations and outcomes
We haven’t balanced customer expectations, experiences and outcomes.
Develop the Customer Centric Strategy and embed the Customer Centred Design Approach.
Learn from, and respond better to, customers from feedback, surveys and advanced analytics.
Successfully deliver on the Client & Business Customer change programme.
Trust and confidence
New Zealanders don’t trust or have confidence in ACC.
Improve the claims experience.
Build stronger relationships and proactively engage with external stakeholders.
Improve services to Māori.
Scheme delivery
We fail to financially sustain the Scheme while delivering customer outcomes and expectations.
Maintain focus on, and manage, key controllable drivers of the outstanding claims liability (OCL).
Deliver the integrated change portfolio successfully, on time and on budget.
Deliver successfully on the Health Services Strategy.
External environment
We’re subject to an unexpected external policy, legislative change or economic change. These may significantly affect ACC’s OCL and investment performance. These may then affect trust and confidence.
Proactively engage with, and respond to, any government enquiries and reviews about the broader health and social sector.
Monitor and manage regulatory changes ACC needs to respond to.
Strengthen relationships with all central agencies and other government departments.
Cyber security
Our systems and information are vulnerable to attack.
Use threat modelling to prioritise cyber risk activities.
Increase cyber risk awareness and people risk.
Injury prevention
We fail to reduce the severity and incidence of injuries.
Implement the Injury Prevention Strategy to increase its impact, reach and effectiveness.
Update the Reducing Harm in New Zealand Workplaces Action Plan with the partner.
Deliver the Workplace Safety Incentive strategy.

93
Clai
m v
olum
es, t
ypes
and
cost
s
Appendix C
Claim volumes, types and costs

ACCIDENT COMPENSATION CORPORATION94
Social rehabilitation non-capitalThe social rehabilitation non-capital liability was $16,029 million as at 30 June 2018� In 2017/18 there was a total actuarial release for this payment type of $739 million�
Social rehabilitation non-capital payments are categorised as care (attendant care, home help, child care and residential care) or non-care (active rehabilitation, training for independence, supported activities, assessments and travel)� Of these, attendant care support is the largest contributor, at around 60%�
The bulk of the social rehabilitation non-capital liability (93%) relates to seriously injured clients because of the lifelong nature of the support provided� The remaining 7% relates to non-seriously injured clients� For this reason, serious injury non-capital payments have the greatest bearing on the outstanding claims liability (OCL)�
Payment experienceGraph 19 shows payments for seriously injured clients� In 2017/18 non-capital payments for serious injury were below expected� While payments are still trending up, future payment expectations have been revised down, primarily due to changes in long-term pay-rate assumptions but also due to a reduction in attendant care payments�
Graph 19 – Social Rehabilitation – Serious Injury Non-Capital Payments
Payment quarter Actual Projection from 2017 valuation
Projection from 2018 valuation Projection from 2016 valuation
Paym
ents
($m
)
40
60
80
100
120
140
Jun
09
Dec
09
Jun
10
Dec
10
Jun
11
Dec
11
Jun
12
Dec
12
Jun
13
Dec
13
Jun
14
Dec
14
Jun
15
Dec
15
Jun
16
Dec
16
Jun
17
Dec
17
Jun
18
Dec
18
Jun
19
Dec
19
Jun
20
Dec
20
Jun
21
Dec
21
Jun
22
Changes to long-term care rate assumptionsIn 2016/17 long-term care rate assumptions were increased due to the pay equity legislation that came into effect on 1 July 2017� This increased the OCL by $1,056 million due to projected increases in future payments�
Pay equity assumptions were revised at 30 June 2018 due to the following reasons:
• Allowances for in-between travel had been double-counted in the rates ACC paid carers�
• Holiday pay rates were changed to time and a half instead of double time, and sleepover rates were changed from pay equity rates to minimum wage�
• Previous increases in provider margins to fund minimum wage changes were reversed due to the changes not being passed on to employees as expected� Revisions were made to hourly care rates based on the qualification and experience mix of carers� This resulted in a reduction in long-term care rate assumptions and a $494 million actuarial release in serious and non-serious injury�

FINANCIAL CONDITION REPORT 2018 95
Appendix C Claim volumes, types and costs
Serious injury care paymentsIn 2017/18 attendant care payments for seriously injured clients were 8% lower than expected� Average hourly care rates in 2017/18 were 3% lower than expected due to the revisions to carer rates already discussed� The total hours of care were 5% lower than expected� These lower-than-expected hours of care are mainly due to two contributing factors:
1� The first factor relates to a data error that saw hours being double counted when holiday payments were made� This error was corrected and resulted in a 2% reduction in hours� The impact was around $67 million in OCL release�
2� The second factor is an increased focus on client independence leading to a 3% reduction in attendant care hours and a $100 million OCL release� A series of training workshops was held for serious injury staff during the first half of 2016/17, with the aim of providing better independence outcomes for clients� The improvements observed after this training continued into 2017/18, including:
• the number of completed support needs assessment referrals for the year was above target� These assessments are a vital tool for serious injury staff to identify a client’s need for aid or assistance
• a competency framework for the end-to-end support needs assessment process was developed� The framework requires staff to demonstrate a consistent and appropriate approach in assessing clients’ care needs based on independence outcomes achieved
• serious injury staff undertook further training, where the focus was on the importance of linking capital expenditure purchases to expected client outcomes�
Graph 20 shows that attendant care hours for seriously injured clients were 5% lower than the 2017 projection, resulting in a reduction in expectation for 2018�
Graph 20 – Social Rehabilitation – Serious Injury CARE HOURS
2010
2011
2012
2013
2014
2015
2016
2017
2018
2019
2020
2021
2022
2023
Att
enda
nt c
are
hour
s (m
)
0
2
4
6
8
10
12
Year ending 31 March Observed 2018 expected 2017 expected

ACCIDENT COMPENSATION CORPORATION96
Social rehabilitation capitalThe social rehabilitation capital liability was $2,564 million as at 30 June 2018� Of this the majority (80%) related to seriously injured clients, with the remaining 20% attributable to non-seriously injured clients�
Social rehabilitation capital payments for seriously injured clients include payments for consumables, equipment, artificial limbs, housing modifications and motor vehicle purchases and modifications�
Capital payments for non-serious injuries are primarily for equipment, orthotics, medical consumables and residential modification costs� Also included is the provision of ongoing aids and appliances for hearing loss claims suffered through traumatic events�
In 2017/18 there was a total actuarial strain for this payment type of $139 million�
Payment experienceGraph 21 and Graph 22 show that actual capital payments for clients with serious and non-serious injuries were higher than expected again, despite successive increases in the valuation projections in the previous three years� This year’s actuarial strain for capital was $139 million�
Graph 21 – serious injury capital payments
Payment quarter Actual Projection from 2017 valuation
Projection from 2018 valuation Projection from 2016 valuation
Paym
ents
($m
)
0
5
10
15
20
25
Jun
09
Dec
09
Jun
10
Dec
10
Jun
11
Dec
11
Jun
12
Dec
12
Jun
13
Dec
13
Jun
14
Dec
14
Jun
15
Dec
15
Jun
16
Dec
16
Jun
17
Dec
17
Jun
18
Dec
18
Jun
19
Dec
19
Jun
20
Dec
20
Jun
21
Dec
21
Jun
22

FINANCIAL CONDITION REPORT 2018 97
Appendix C Claim volumes, types and costs
Graph 22 – Non-serious injury capital payments
Jun
09
Dec
09
Jun
10
Dec
10
Jun
11
Dec
11
Jun
12
Dec
12
Jun
13
Dec
13
Jun
14
Dec
14
Jun
15
Dec
15
Jun
16
Dec
16
Jun
17
Dec
17
Jun
18
Dec
18
Jun
19
Dec
19
Jun
20
Dec
20
Jun
21
Dec
21
Jun
22
Payment quarter Actual Projection from 2017 valuation
Projection from 2018 valuation Projection from 2016 valuation
Paym
ents
($m
)
0
2
4
6
8
10
12
14
16
Average payments per seriously injured client increasedThe average cost per claim for large capital expenditure, such as for high-cost equipment, housing modifications and motor vehicle purchases, increased by 6% in the year to 30 June 2018� This increase excluded inflation� This increase was driven by increasing average capital costs for spinal injury clients� Clients with spinal injuries often have a greater need for equipment that will assist in improving their mobility� Therefore, the average capital cost of their claims is, in general, significantly higher than the average cost for other serious injuries�
Graph 23 displays the observed and projected average large capital payments by serious injury profile for spinal injuries�
Graph 23 – AVERAGE LARGE serious injury CAPITAL PAYMENTS by injury profile, 1974-2004 Accident years
Paym
ents
($0
00
)
35
30
25
20
15
10
5
0
200
5
200
6
200
7
200
8
200
9
2010
2011
2012
2013
2014
2015
2016
2017
2018
2019
2020
2021
2022
2023
2024
2025
2026
2027
Year ending 31 March High-level tetraplegic Low-level paraplegic
Incomplete spinal cord injury Low-level tetraplegic and
high-level paraplegic

ACCIDENT COMPENSATION CORPORATION98
As the chart shows, there has been steep growth in the average cost per claim for low-level paraplegic clients� This means the average cost for low-level paraplegic claims is now similar to that for more severe spinal injuries� It partly reflects an older cohort of clients requiring more expensive wheelchairs and housing and vehicle modifications�
For serious injury recurring capital payments, which include medical consumables and hearing aids, growth in the average payment per client has also increased for all spinal injuries� In comparison, the average recurring capital cost for other serious injuries is fairly flat and significantly lower� For this reason, Graph 24 shows the observed and projected average payments for recurring capital expenditure for spinal injuries only�
Graph 24 – AVERAGE recurring serious injury CAPITAL PAYMENTS by injury profile
Paym
ents
($0
00
)
12
10
8
6
10
4
2
200
5
200
6
200
7
200
8
200
9
2010
2011
2012
2013
2014
2015
2016
2017
2018
2019
2020
2021
2022
2023
2024
2025
2026
2027
Year ending 31 March High-level tetraplegic Low-level paraplegic
Incomplete spinal cord injury Low-level tetraplegic and
high-level paraplegic
As part of addressing recommendation 6 from 2017, linking higher-than-expected capital expenditure and lower-than-expected attendant care costs should be a priority for management in the coming year� Greater client independence is often only possible through specialised capital equipment, but there needs to be a better quantification of the net financial and social benefits�
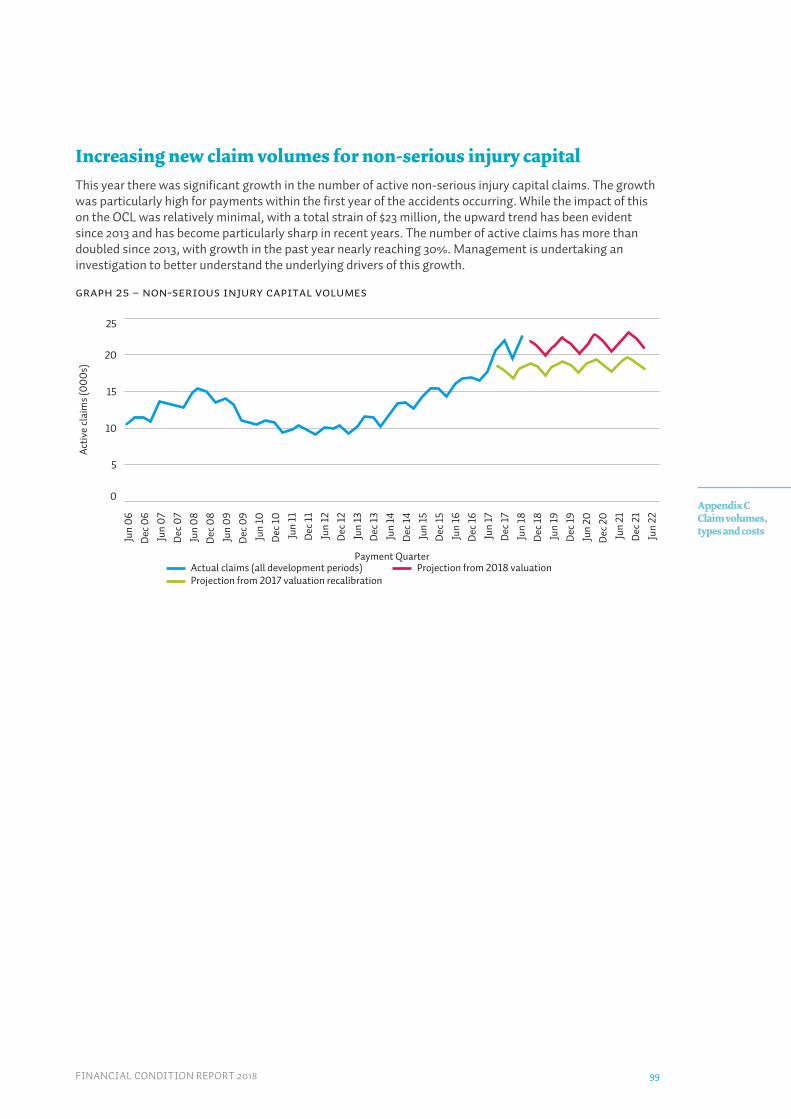
FINANCIAL CONDITION REPORT 2018 99
Appendix C Claim volumes, types and costs
Increasing new claim volumes for non-serious injury capitalThis year there was significant growth in the number of active non-serious injury capital claims� The growth was particularly high for payments within the first year of the accidents occurring� While the impact of this on the OCL was relatively minimal, with a total strain of $23 million, the upward trend has been evident since 2013 and has become particularly sharp in recent years� The number of active claims has more than doubled since 2013, with growth in the past year nearly reaching 30%� Management is undertaking an investigation to better understand the underlying drivers of this growth�
Graph 25 – non-serious injury capital volumes
Jun
06
Dec
06
Jun
07
Dec
07
Jun
08
Dec
08
Jun
09
Dec
09
Jun
10
Dec
10
Jun
11
Dec
11
Jun
12
Dec
12
Jun
13
Dec
13
Jun
14
Dec
14
Jun
15
Dec
15
Jun
16
Dec
16
Jun
17
Dec
17
Jun
18
Dec
18
Jun
19
Dec
19
Jun
20
Dec
20
Jun
21
Dec
21
Jun
22
Act
ive
clai
ms
(00
0s)
25
20
15
10
5
0
Payment Quarter Actual claims (all development periods) Projection from 2017 valuation recalibration
Projection from 2018 valuation
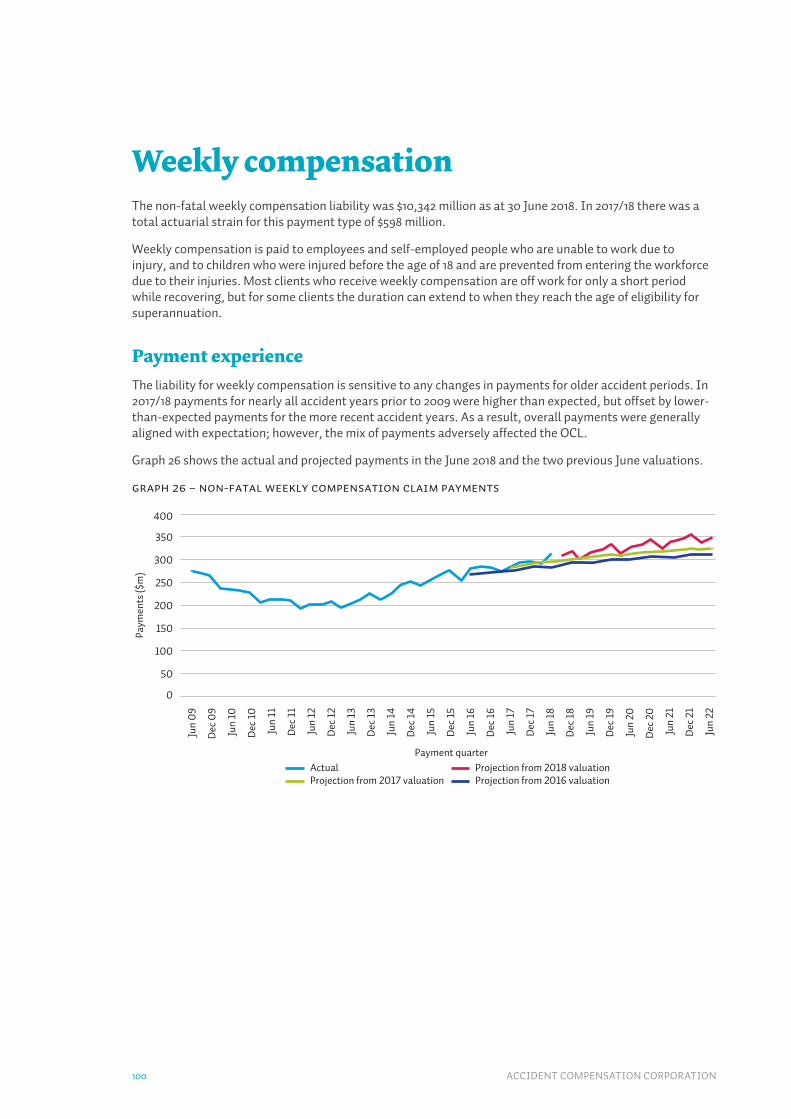
ACCIDENT COMPENSATION CORPORATION100
Weekly compensationThe non-fatal weekly compensation liability was $10,342 million as at 30 June 2018� In 2017/18 there was a total actuarial strain for this payment type of $598 million�
Weekly compensation is paid to employees and self-employed people who are unable to work due to injury, and to children who were injured before the age of 18 and are prevented from entering the workforce due to their injuries� Most clients who receive weekly compensation are off work for only a short period while recovering, but for some clients the duration can extend to when they reach the age of eligibility for superannuation�
Payment experienceThe liability for weekly compensation is sensitive to any changes in payments for older accident periods� In 2017/18 payments for nearly all accident years prior to 2009 were higher than expected, but offset by lower-than-expected payments for the more recent accident years� As a result, overall payments were generally aligned with expectation; however, the mix of payments adversely affected the OCL�
Graph 26 shows the actual and projected payments in the June 2018 and the two previous June valuations�
Graph 26 – Non-fatal weekly compensation claim payments
Paym
ents
($m
)
400
350
300
250
200
150
100
50
0
Payment quarter Actual Projection from 2017 valuation
Projection from 2018 valuation Projection from 2016 valuation
Jun
09
Dec
09
Jun
10
Dec
10
Jun
11
Dec
11
Jun
12
Dec
12
Jun
13
Dec
13
Jun
14
Dec
14
Jun
15
Dec
15
Jun
16
Dec
16
Jun
17
Dec
17
Jun
18
Dec
18
Jun
19
Dec
19
Jun
20
Dec
20
Jun
21
Dec
21
Jun
22

FINANCIAL CONDITION REPORT 2018 101
Appendix C Claim volumes, types and costs
Number of claimsMost new weekly compensation claims receive payments in the same quarter that the accidents occurred (this is delay quarter zero)� These claims have been steadily increasing in the past four years by, on average, more than 1,000 claims per year� New claims were not as high as expected last year� In response, the assumed new claim volumes were reduced but still expected to grow faster than the population, in line with forecasts for economic growth�
For other delay quarters, there is less evidence of growth in new claims, so any increases are largely a reflection of population growth� The exception is new claims that are reported more than 25 years after the accidents occurred� The majority of these claims are the result of increased reporting of sensitive claims in the Non-Earners’ Account� Many of these clients were injured at a young age and upon reaching normal working age are unable to work, so become eligible for compensation� These claims tend to have fairly high levels of continuance� Given the uncertainty around where and when sensitive claim volumes will stabilise, we’re investigating developing a specific model for sensitive claims to better reflect their unique claim patterns�
Graph 27 shows the number of new weekly compensation claims reported in delay quarter zero and projections from the June 2018 and previous two valuations�
Graph 27 – number of new weekly compensation claims by accident quarter
Num
ber o
f new
cla
ims
repo
rted
(00
0s)
16
14
12
10
8
6
4
2
0
Jun
09
Dec
09
Jun
10
Dec
10
Jun
11
Dec
11
Jun
12
Dec
12
Jun
13
Dec
13
Jun
14
Dec
14
Jun
15
Dec
15
Jun
16
Dec
16
Jun
17
Dec
17
Jun
18
Dec
18
Jun
19
Dec
19
Jun
20
Dec
20
Jun
21
Accident quarter Actual Projection from 2017 valuation
Projection from 2018 valuation Projection from 2016 valuation

ACCIDENT COMPENSATION CORPORATION102
Continuance rates for weekly compensationContinuance rates measure how many claims are still receiving payments at given times after the accidents� When rates are high, the number of claims receiving payments is higher� This leads to a higher OCL�
Graph 28 shows annual continuance rates for all weekly compensation claims� It compares actual rates to the assumptions used in the June 2018 valuation projection� The rates are volatile for injuries with longer durations because claim volumes are smaller� Actual continuance rates for claims with durations greater than 25 years are decreasing, but this trend is dominated by a very small number of earner clients reaching age 65 and moving from weekly compensation to superannuation payments� Small claim numbers mean the trend is not strong enough for the model to adjust, so the projected continuance rates for these claims remain fairly stable�
Graph 28 – Continuance rates for weekly compensation claims
2 3 4 5 6 7 8 9 10 11 12 13 14 15 16 17 18 19 20 21 22 23 24 25 26 27 28 29 30 31 32
Years since accident Actual 2016/17 Actual 2017/18 2018 valuation assumption
Cont
inua
nce
rate
(%)
100
90
80
70
60
The continuance rate in 2017/18 was on average 0�8% below the projection, but slightly higher than it was in 2016/17� As shown in Table 14, an increase of 1% in the long-term continuance rate for weekly compensation would lead to an $852 million increase in the OCL� A continued focus on improving the continuance rates through increased independence and improved client outcomes is necessary to ensure that the growth in the long-term claims pool remains under control�

FINANCIAL CONDITION REPORT 2018 103
Appendix C Claim volumes, types and costs
Change to the long-term continuance rate assumption in the Work AccountLong-term continuance rates are the rates at which claims will continue to receive weekly compensation payments for periods more than five years after the date of the accidents� The OCL is highly sensitive to long-term continuance rates as they generally relate to more serious injuries, which tend to remain on the Scheme for longer durations�
As Graph 29 shows, there is large variability in the observed continuance rates�
The 2016 consultation selected future continuance rates slightly higher than were ultimately set in the June 2017 valuation� While hard to see in the graph, rates since 2016 have improved and slightly lower continuance rates were selected for the 2018 levy consultation than for the previous consultation, reducing the Work Account levy by $0�05� The June 2018 valuation assumptions were aligned with those in levy setting, resulting in an increase in the continuance rate of less than 1% and a corresponding increase in the OCL of $486 million�
Graph 29 – weekly compensation long-term continuance rates for work account
20 26 32 38 44 50 25 62 68 74 80 86 92 98 104
110
116
122
128
134
140
146
152
158
164
170
Number of quarters after accident date Actual 2017/18 Actual 2016/17 Actual 2015/16
2018 valuation assumption 2017 valuation assumption
Cont
inua
nce
rate
(%
)
120
110
100
90
80
70
60
50

ACCIDENT COMPENSATION CORPORATION104
Long-term weekly compensation poolThe long-term weekly compensation pool refers to claims that have received more than 365 days of cumulative weekly compensation� These claims tend to be more complex than those with shorter durations and therefore require more comprehensive management� Claims receiving weekly compensation more than a year since the accidents account for approximately 89% of the weekly compensation OCL�
Graph 30 shows historical and projected numbers of long-term weekly compensation claims� It also shows the number of claims entering and exiting the pool�
Graph 30 – Long-term weekly compensation claims
Year Ending 30 June
Actual Target
Entries Exits
Projected entries Projected exits
200
8
200
9
2010
2011
2012
2013
2014
2015
2016
2017
2018
2019
2020
2021
2022
2023
Num
ber o
f cla
ims
(00
0s)
30
25
20
15
10
5
0
The number of long-term claims is expected to grow gradually as the Scheme matures and the number of serious injury claims in the pool increases� This is allowed for in the OCL and levy assumptions�
In the past four years, the number of entries to the pool has been greater than the number of exits� However, the gap between entries and exits has reduced� This means that the growth in long-term weekly compensation claims is slowing� This is encouraging� Higher-than-expected volumes of sensitive claims in the Non-Earners’ and Earners’ Accounts were found to be the primary driver of growth in the pool�
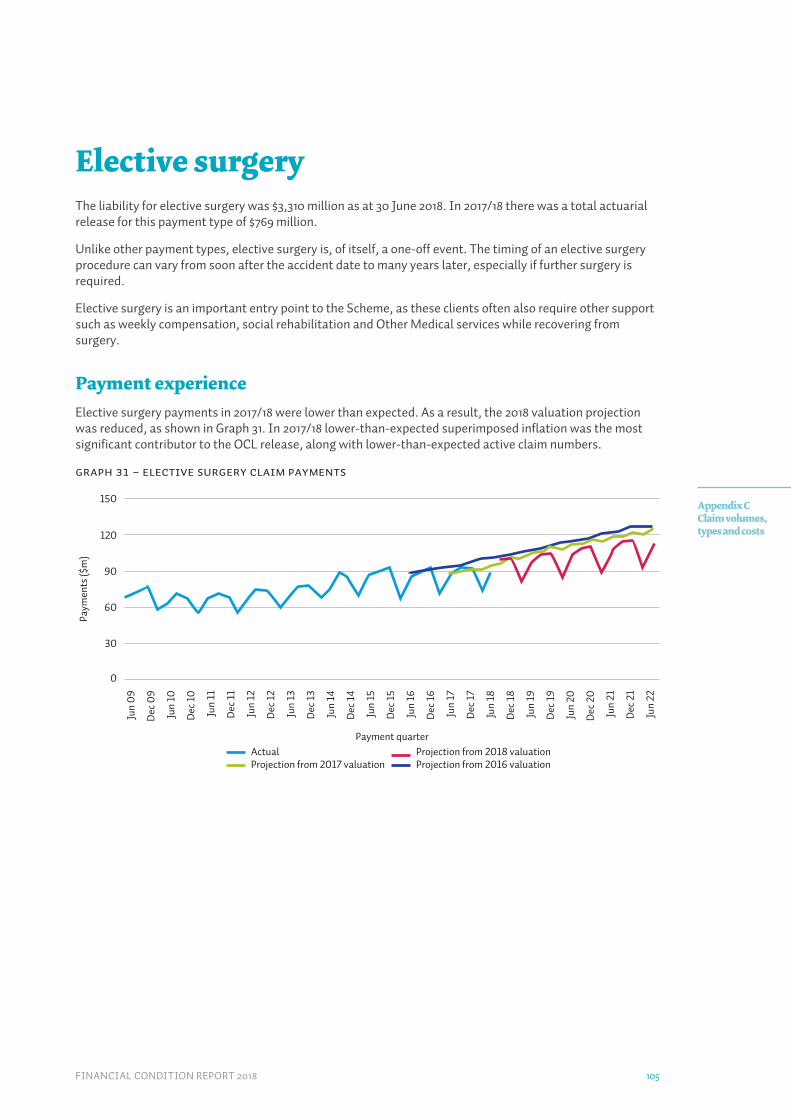
FINANCIAL CONDITION REPORT 2018 105
Appendix C Claim volumes, types and costs
Elective surgeryThe liability for elective surgery was $3,310 million as at 30 June 2018� In 2017/18 there was a total actuarial release for this payment type of $769 million�
Unlike other payment types, elective surgery is, of itself, a one-off event� The timing of an elective surgery procedure can vary from soon after the accident date to many years later, especially if further surgery is required�
Elective surgery is an important entry point to the Scheme, as these clients often also require other support such as weekly compensation, social rehabilitation and Other Medical services while recovering from surgery�
Payment experienceElective surgery payments in 2017/18 were lower than expected� As a result, the 2018 valuation projection was reduced, as shown in Graph 31� In 2017/18 lower-than-expected superimposed inflation was the most significant contributor to the OCL release, along with lower-than-expected active claim numbers�
Graph 31 – Elective surgery claim payments
Paym
ents
($m
)
150
120
90
60
30
0
Payment quarter Actual Projection from 2017 valuation
Projection from 2018 valuation Projection from 2016 valuation
Jun
09
Dec
09
Jun
10
Dec
10
Jun
11
Dec
11
Jun
12
Dec
12
Jun
13
Dec
13
Jun
14
Dec
14
Jun
15
Dec
15
Jun
16
Dec
16
Jun
17
Dec
17
Jun
18
Dec
18
Jun
19
Dec
19
Jun
20
Dec
20
Jun
21
Dec
21
Jun
22
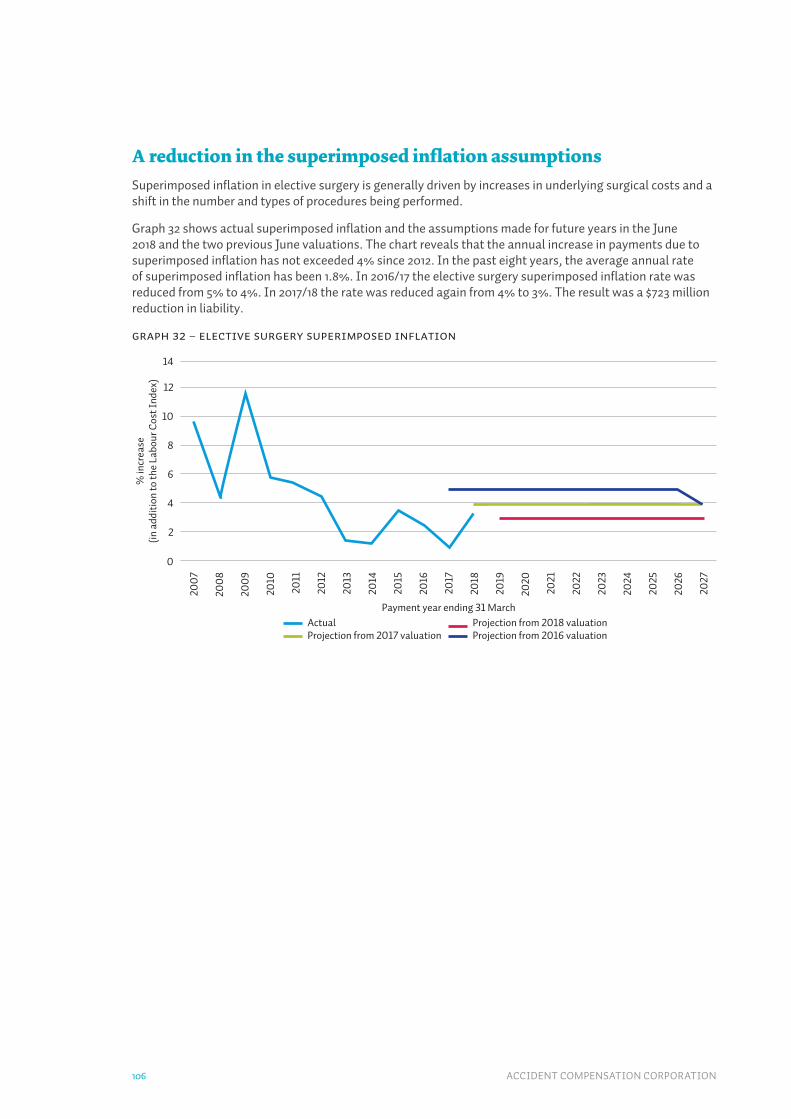
ACCIDENT COMPENSATION CORPORATION106
A reduction in the superimposed inflation assumptionsSuperimposed inflation in elective surgery is generally driven by increases in underlying surgical costs and a shift in the number and types of procedures being performed�
Graph 32 shows actual superimposed inflation and the assumptions made for future years in the June 2018 and the two previous June valuations� The chart reveals that the annual increase in payments due to superimposed inflation has not exceeded 4% since 2012� In the past eight years, the average annual rate of superimposed inflation has been 1�8%� In 2016/17 the elective surgery superimposed inflation rate was reduced from 5% to 4%� In 2017/18 the rate was reduced again from 4% to 3%� The result was a $723 million reduction in liability�
Graph 32 – Elective Surgery Superimposed Inflation
200
7
200
8
200
9
2010
2011
2012
2013
2014
2015
2016
2017
2018
2019
2020
2021
2022
2023
2024
2025
2026
2027
Payment year ending 31 March Actual Projection from 2017 valuation
Projection from 2018 valuation Projection from 2016 valuation
% in
crea
se(in
add
ition
to th
e La
bour
Cos
t Ind
ex)
14
12
10
8
6
4
2
0

FINANCIAL CONDITION REPORT 2018 107
Appendix C Claim volumes, types and costs
Actual number of claims lower than expectedThe number of active elective surgery claims has been steady, or slightly reducing, in the past few years�
Graph 33 shows the number of claims receiving elective surgery, along with the projections from the 2018, 2017 and 2016 valuations�
Graph 33 – Claims receiving elective surgery
Jun
13
Dec
13
Jun
14
Dec
14
Jun
15
Dec
15
Jun
16
Dec
16
Jun
17
Dec
17
Jun
18
Dec
18
Jun
19
Dec
19
Jun
20
Dec
20
Jun
21
Payment quarter Actual Projection from 2017 valuation
Projection from 2018 valuation Projection from 2016 valuation
Num
ber o
f cla
ims
(00
0s)
1514
13
12
11
10
9
8
7
6
5
4
3
2
10
There is some evidence to suggest that the reduction in elective surgery claim numbers is due to a shift in case mix� Knee and shoulder arthroscopy claims together make up around one-third of all elective surgery claims� Graph 34 shows these claims have been reducing in the past few years, supporting the assertion that there is a shift towards rehabilitation in place of surgery� Fewer elective surgery claims than expected resulted in a $67 million reduction in the OCL�
Graph 34 – arthroscopy claim volumes
2009 2010 2011 2012 2013 2014 2015 2016 2017 2018Year ending 30 June
Knee arthroscopy Shoulder arthroscopy
Num
ber o
f cla
ims
(00
0s)
10
9
8
7
6
5
4
3
2
1
0

ACCIDENT COMPENSATION CORPORATION108
Long-term elective surgery active claimsGraph 35 shows the number of claims receiving elective surgery for accidents from 2012 and earlier, along with projections from the 2018 and 2017 valuations�
Graph 35 – claims receiving elective surgery from 2012 and earlier accident periods
Jun
13
Dec
13
Jun
14
Dec
14
Jun
15
Dec
15
Jun
16
Dec
16
Jun
17
Dec
17
Jun
18
Dec
18
Jun
19
Dec
19
Jun
20
Dec
20
Jun
21
Dec
21
Jun
22
Num
ber o
f cla
ims
3,000
2,500
2,000
1,500
1,000
500
0
Payment quarter Actual Projection from 2017 valuation
Projection from 2018 valuation Projection from 2016 valuation
Claims with long durations tend to be more expensive than those with short durations, as delays can make surgery more complicated� A high proportion of surgeries performed more than five years after the accidents are repeats to replace deteriorating implants in, for example, knees and hips�
The lower-than-expected volume of claims has been consistent for most accident periods, so the valuation assumptions for elective surgery claims prior to 2012 were adjusted down� This contributed a $40 million decrease to the $67 million reduction in the OCL due to elective surgery claim volumes�
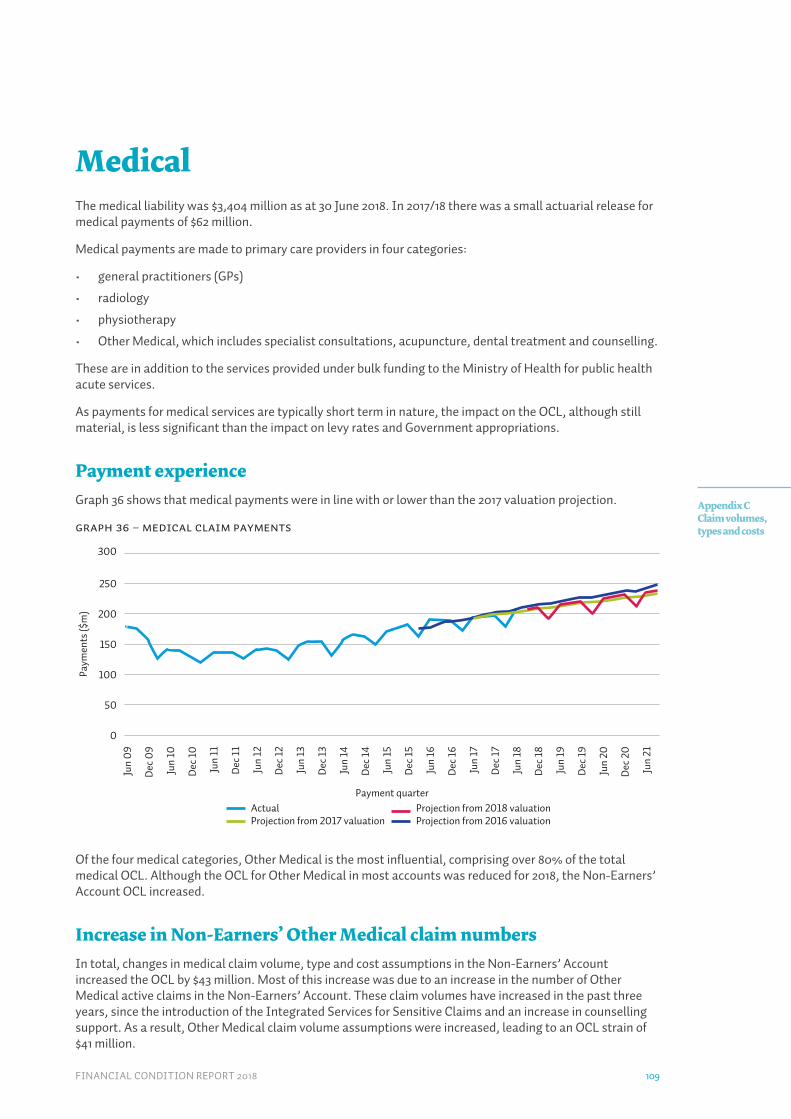
FINANCIAL CONDITION REPORT 2018 109
Appendix C Claim volumes, types and costs
MedicalThe medical liability was $3,404 million as at 30 June 2018� In 2017/18 there was a small actuarial release for medical payments of $62 million�
Medical payments are made to primary care providers in four categories:
• general practitioners (GPs)
• radiology
• physiotherapy
• Other Medical, which includes specialist consultations, acupuncture, dental treatment and counselling�
These are in addition to the services provided under bulk funding to the Ministry of Health for public health acute services�
As payments for medical services are typically short term in nature, the impact on the OCL, although still material, is less significant than the impact on levy rates and Government appropriations�
Payment experienceGraph 36 shows that medical payments were in line with or lower than the 2017 valuation projection�
Graph 36 – Medical claim payments
Jun
09
Dec
09
Jun
10
Dec
10
Jun
11
Dec
11
Jun
12
Dec
12
Jun
13
Dec
13
Jun
14
Dec
14
Jun
15
Dec
15
Jun
16
Dec
16
Jun
17
Dec
17
Jun
18
Dec
18
Jun
19
Dec
19
Jun
20
Dec
20
Jun
21
Payment quarter Actual Projection from 2017 valuation
Projection from 2018 valuation Projection from 2016 valuation
Paym
ents
($m
)
300
250
200
150`
100
50
0
Of the four medical categories, Other Medical is the most influential, comprising over 80% of the total medical OCL� Although the OCL for Other Medical in most accounts was reduced for 2018, the Non-Earners’ Account OCL increased�
Increase in Non-Earners’ Other Medical claim numbersIn total, changes in medical claim volume, type and cost assumptions in the Non-Earners’ Account increased the OCL by $43 million� Most of this increase was due to an increase in the number of Other Medical active claims in the Non-Earners’ Account� These claim volumes have increased in the past three years, since the introduction of the Integrated Services for Sensitive Claims and an increase in counselling support� As a result, Other Medical claim volume assumptions were increased, leading to an OCL strain of $41 million�

ACCIDENT COMPENSATION CORPORATION110
Decrease in Other Medical claim numbers (excluding the Non-Earners’ Account)The strain due to the Non-Earners’ Account was offset by a $105 million decrease in the OCL due to changes to medical claim models in all other accounts� This was primarily a result of Other Medical claim volumes in older accident periods in the Work, Treatment Injury and Motor Vehicle Accounts�
Medical payments’ superimposed inflation assumptions remain unchangedThe OCL for medical payments is sensitive to changes in superimposed inflation� Graph 37 shows that the superimposed inflation rate for Other Medical began to increase in 2011� It rose to be higher than the other types of medical payment, largely due to increases in sensitive claims counselling costs� But in the past two years the level has fallen and it’s now more in line with the other three payment categories� The future medical superimposed inflation assumptions did not change in 2017/18�
Graph 37 – Medical payments’ superimposed inflation
200
7
200
8
200
9
2010
2011
2012
2013
2014
2015
2016
2017
2018
2019
2020
2021
2022
2023
2024
2025
2026
2027
Payment year ending 31 March GP Physiotherapy
Radiology Other Medical
% in
crea
se(in
add
ition
to L
abou
r Cos
t Ind
ex)
15
10
5
0
−5
−10
−15
−20
−25
−30

FINANCIAL CONDITION REPORT 2018 111
Appendix C Claim volumes, types and costs
Treatment injury
Treatment injury active claimsThere has been growth in active treatment injury claim numbers since 2006, and significant growth since 2012� The growth has started to slow in recent years, particularly for non-serious injury, Other Medical and weekly compensation claims� This has meant that a lower-than-expected number of claims have been paid in the past year� The new external valuation actuary reviewed the assumptions set by the previous valuation actuary and found that they were too conservative� In response, they reduced the projected number of new non-serious injury and Other Medical claims and weekly compensation continuance rates to reflect the recent experience� In total this resulted in an OCL release of $211 million�
While new claim growth for accident years 2006-2012 has slowed, new claim growth in recent accident years has continued� A limited number of long-term treatment injury claims means there is uncertainty around how these claims will behave in the future� Continued monitoring is needed� There may be further changes to the OCL as patterns for claims of longer durations become clearer�
Lower-than-expected number of new non-serious injury claims receiving careThe expected run-off pattern for the number of active non-serious injury claims receiving care with accident dates between 2006 and 2012 is shown in Graph 38� These claims are now projected to run off faster than previously thought� A lower-than-expected number of new non-serious treatment injury claims in the past year led to a change in the assumptions� The OCL impact was a release of $55 million�
Graph 38 – treatment injury non-serious injury care active claims (2006-2012 accident years)
Jun
05
Dec
05
Jun
06
Dec
06
Jun
07
Dec
07
Jun
08
Dec
08
Jun
09
Dec
09
Jun
10D
ec 1
0Ju
n 11
Dec
11
Jun
12D
ec 1
2Ju
n 13
Dec
13
Jun
14D
ec 1
4Ju
n 15
Dec
15
Jun
16D
ec 1
6Ju
n 17
Dec
17
Jun
18D
ec 1
8Ju
n 19
Dec
19
Jun
20D
ec 2
0Ju
n 21
Dec
21
Jun
22
Payment quarter Actual Projection from 2017 valuation recalibration
Projection from 2018 valuation
Act
ive
clai
ms
500
450
400
350
300
250
200
150
100
50
0

ACCIDENT COMPENSATION CORPORATION112
A lower-than-expected number of new Other Medical treatment injury claimsGraph 39 shows that the projected number of active Other Medical treatment injury claims with accident dates between 2006 and 2012 are projected to run off faster than previously thought� The OCL impact was a release of $37 million�
Graph 39 – treatment injury other medical active claims (2006-2012 accident years)
Jun
05
Dec
05
Jun
06
Dec
06
Jun
07
Dec
07
Jun
08
Dec
08
Jun
09
Dec
09
Jun
10D
ec 1
0Ju
n 11
Dec
11
Jun
12D
ec 1
2Ju
n 13
Dec
13
Jun
14D
ec 1
4Ju
n 15
Dec
15
Jun
16D
ec 1
6Ju
n 17
Dec
17
Jun
18D
ec 1
8Ju
n 19
Dec
19
Jun
20D
ec 2
0Ju
n 21
Dec
21
Jun
22
Payment quarter Actual Projection from 2017 valuation recalibration
Projection from 2018 valuation
Act
ive
clai
ms
4,000
3,500
3,000
2,500
2,000
1,500
1,000
500
0

FINANCIAL CONDITION REPORT 2018 113
Appendix C Claim volumes, types and costs
Weekly compensation treatment injury claims have been discontinuing more quicklyGraph 40 shows that weekly compensation treatment injury claims with accident dates between 2006 and 2012 have been discontinuing at a faster rate than previously assumed� The projected continuance rates have been reduced to reflect this experience� Consequently, the projected number of active claims has decreased, reducing the OCL by $118 million�
Graph 40 – treatment injury weekly compensation active claims (2006-2012 accident years)
Jun
05
Dec
05
Jun
06
Dec
06
Jun
07
Dec
07
Jun
08
Dec
08
Jun
09
Dec
09
Jun
10D
ec 1
0Ju
n 11
Dec
11
Jun
12D
ec 1
2Ju
n 13
Dec
13
Jun
14D
ec 1
4Ju
n 15
Dec
15
Jun
16D
ec 1
6Ju
n 17
Dec
17
Jun
18D
ec 1
8Ju
n 19
Dec
19
Jun
20D
ec 2
0Ju
n 21
Dec
21
Jun
22
Payment quarter Actual Projection from 2017 valuation recalibration
Projection from 2018 valuation
Act
ive
clai
ms
500
450
400
350
300
250
200
150
100
50
0
ACCIDENT COMPENSATION CORPORATION114
Gradual process hearing loss claimsIn 2017/18 there was a total actuarial strain of $41 million in claims for hearing loss from gradual exposure to noise in the workplace�
The volume of hearing loss claims has increasedA legislative change in July 2014 increased benefits for work-related gradual process hearing loss claims� This resulted in an increase in both claims newly reported and the average claim cost�
During 2017/18 there were higher claim costs from accidents reported before 2009, resulting in a $22 million increase in the OCL� The average cost per claim was also higher than expected for all accidents reported after 1994, causing a $19 million increase in the OCL�

FINANCIAL CONDITION REPORT 2018 115
Appendix C Claim volumes, types and costs
Changes to claim frequencies in the five accounts
What we include in our calculationsWe measure how frequently people make ACC claims by the number of claims received as a proportion of the people covered� We also estimate the number of claims for accidents that have happened in the year in question but that ACC hasn’t yet received� Entitlement claims are a subset of claims that receive funding for elective surgery, rehabilitation and weekly compensation support, in addition to medical treatment�
As we’ve seen during past economic cycles, claim volumes tend to increase faster than growth in the population when the economy is doing well� This is especially so for claims that are minor and only need short-term medical treatment� This year we incorporated expected increases in claims implied by the Treasury’s forecast for continued growth in the economy� This is consistent with the approach taken for determining the ACC budget�
And what we don’t.Some claims are handled through bulk-funded public health acute services� We don’t count these claims initially for our calculations, as the vast majority require no further support from ACC� Those that do go on to receive further support are counted when that support is provided�
We also exclude work-related claims from employers in the Accredited Employers Programme, as these are not covered by the levies set for the Work Account, but rather are paid for directly by the employers�
Total Scheme: claim frequency rates gradually risingGraph 41 shows the historical and projected claim frequency in the whole of ACC’s five accounts�
Graph 41 – Total Scheme: estimated claim frequency rates per 1,000 people
200
8
200
9
2010
2011
2012
2013
2014
2015
2016
2017
2018
2019
2020
2021
2022
Tota
l cla
im fr
eque
ncy
1,000 100
Entit
lem
ent c
laim
freq
uenc
y800 80
600 60
400 40
200 20
0 0
Accident year ending 30 June Total claims Entitlement claims
Projection Projection
Previous projection Previous projection
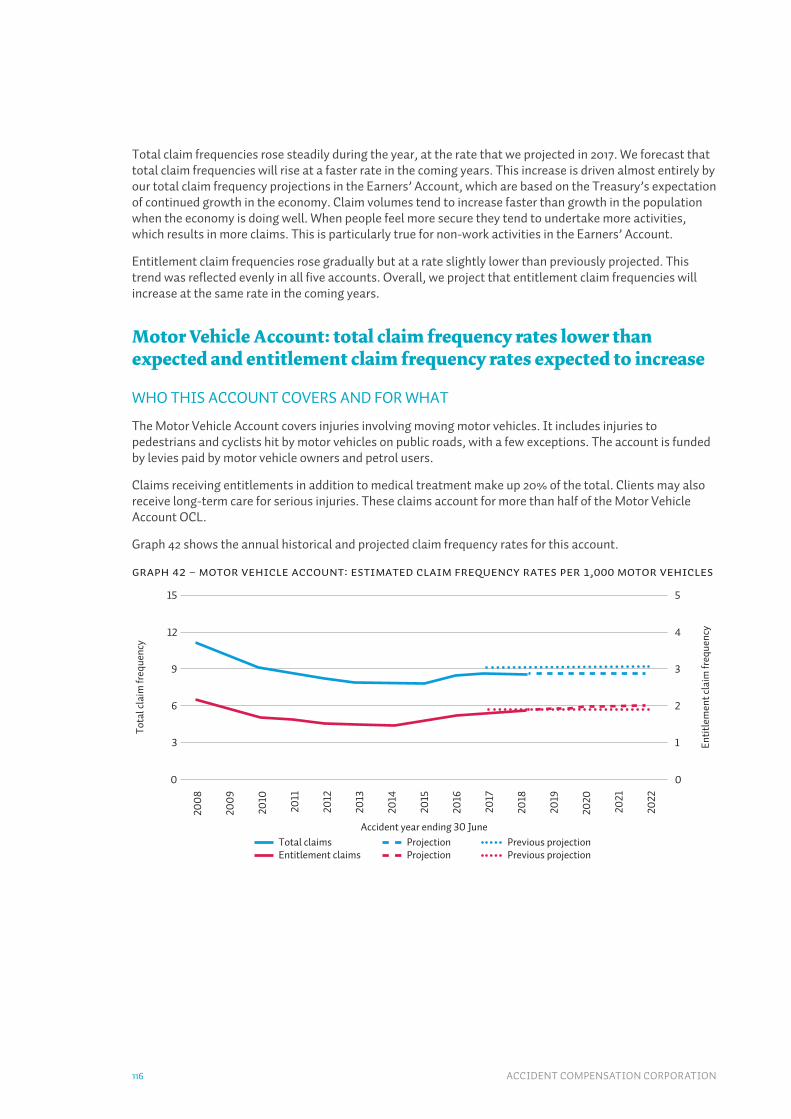
ACCIDENT COMPENSATION CORPORATION116
Total claim frequencies rose steadily during the year, at the rate that we projected in 2017� We forecast that total claim frequencies will rise at a faster rate in the coming years� This increase is driven almost entirely by our total claim frequency projections in the Earners’ Account, which are based on the Treasury’s expectation of continued growth in the economy� Claim volumes tend to increase faster than growth in the population when the economy is doing well� When people feel more secure they tend to undertake more activities, which results in more claims� This is particularly true for non-work activities in the Earners’ Account�
Entitlement claim frequencies rose gradually but at a rate slightly lower than previously projected� This trend was reflected evenly in all five accounts� Overall, we project that entitlement claim frequencies will increase at the same rate in the coming years�
Motor Vehicle Account: total claim frequency rates lower than expected and entitlement claim frequency rates expected to increase
WHO THIS ACCOUNT COVERS AND FOR WHAT
The Motor Vehicle Account covers injuries involving moving motor vehicles� It includes injuries to pedestrians and cyclists hit by motor vehicles on public roads, with a few exceptions� The account is funded by levies paid by motor vehicle owners and petrol users�
Claims receiving entitlements in addition to medical treatment make up 20% of the total� Clients may also receive long-term care for serious injuries� These claims account for more than half of the Motor Vehicle Account OCL�
Graph 42 shows the annual historical and projected claim frequency rates for this account�
Graph 42 – Motor Vehicle Account: Estimated Claim Frequency Rates per 1,000 Motor Vehicles
Accident year ending 30 June Total claims Entitlement claims
Projection Projection
Previous projection Previous projection
200
8
200
9
2010
2011
2012
2013
2014
2015
2016
2017
2018
2019
2020
2021
2022
Tota
l cla
im fr
eque
ncy
15 5
Entit
lem
ent c
laim
freq
uenc
y12 4
9 3
6 2
3 1
0 0

FINANCIAL CONDITION REPORT 2018 117
Appendix C Claim volumes, types and costs
WHY TOTAL CLAIM FREQUENCY RATES WERE LOWER THAN EXPECTED
The 2018 total claim frequency was lower than expected� The number of claims accessing GP, radiology and physiotherapy services increased significantly in 2016, and again in 2017� Last year we expected these increases to continue� However, claim frequencies have subsequently stabilised and projected total claim frequencies have been flattened to better reflect this�
Entitlement claims, particularly new weekly compensation claims, have continued to increase� When the economy is doing well, people tend to travel more� This explains part of the increase but it’s not yet clear what is driving all the increase�
Non-Earners’ Account: claim frequency rate is flattening out
WHO THIS ACCOUNT COVERS AND FOR WHAT
The Non-Earners’ Account is funded by the Government from general taxation� It covers personal injuries to people who aren’t employed� Many are children or superannuitants� The account covers a wide range of injuries, including those at home, during sport, in and on the water, and in public and commercial places� It excludes injuries to non-earners that are covered by the Motor Vehicle and Treatment Injury Accounts�
Less than 4% of claims receive additional entitlement support, mostly for home care and assistance� The remaining 96% receive short-term medical treatment only� Bulk-funded public health acute services are a large portion of the new-year costs in this account�
Graph 43 shows the annual historical and projected claim frequency rates for this account�
Graph 43 – Non-Earners’ Account: Estimated Claim Frequency Rates per 1,000 Non-Earners
Accident year ending 30 June Total claims Entitlement claims
Projection Projection
Previous projection Previous projection
200
8
200
9
2010
2011
2012
2013
2014
2015
2016
2017
2018
2019
2020
2021
2022
Tota
l cla
im fr
eque
ncy
500 25
Entit
lem
ent c
laim
freq
uenc
y400 20
300 15
200 10
100 5
0 0
WHY CLAIM FREQUENCY RATES WERE LOWER THAN EXPECTED
Total claims rose steadily between 2010 and 2016, but flattened out from 2017� This lower-than-expected claim frequency was driven by fewer medical claims, particularly claims first seen by a GP� In response, we have reduced the starting frequency but still expect claims to grow faster than the population, in line with forecasts for economic growth�
Entitlement claim frequencies in 2018 were also lower than expected, and we have consequently projected frequencies to be lower than last time’s forecasts�

ACCIDENT COMPENSATION CORPORATION118
Earners’ Account: claim frequency rates continue to increase
WHO THIS ACCOUNT COVERS AND FOR WHAT
The Earners’ Account is funded by levies paid by earners to cover injuries that aren’t related to their employment happening on, or after, 1 July 1992, when the account was set up� The account covers a wide range of injuries, including those in the home, during sport, in and on the water, and in public and commercial environments� It excludes injuries to earners that are covered by the Motor Vehicle and Treatment Injury Accounts�
Graph 44 – Earners’ Account: Estimated Claim Frequency Rates per 1,000 Earners
Accident year ending 30 June Total claims Entitlement claims
Projection Projection
Previous projection Previous projection
200
8
200
9
2010
2011
2012
2013
2014
2015
2016
2017
2018
2019
2020
2021
2022
Tota
l cla
im fr
eque
ncy
400 60
Entit
lem
ent c
laim
freq
uenc
y300 45
200 30
100 15
0 0
WHY CLAIM FREQUENCY RATES HAVE INCREASED
This account has driven ACC’s overall claim increase� Claim frequency has increased since 2011 and we project that increase to continue based on the Treasury’s expectation of continued growth in the economy� As mentioned above, a strong economy leads to people undertaking more activities, resulting in more claims� This is particularly true for non-work activities in the Earners’ Account, with most claims requiring only short-term support�
However, the increase in entitlement claim frequencies in 2017 was not as fast as projected, so there is a decrease in the projected starting position� Future entitlement claim frequencies are expected to increase more quickly, in line with forecasts for growth in the economy�

FINANCIAL CONDITION REPORT 2018 119
Appendix C Claim volumes, types and costs
Work Account: entitlement claim frequency rates increased since 2012
WHO THIS ACCOUNT COVERS AND FOR WHAT
The Work Account is funded by levies paid by employers and the self-employed to cover people who have had work-related personal injuries on or after 1 July 1974, or had non-work injuries between 1 July 1974 and 30 June 1992�
Almost 85% of work claims require medical treatment only� About 60% of the costs of new-year claims are for weekly compensation� The Work Account OCL is most sensitive to changes in the long-term rehabilitation rates for weekly compensation claims�
Total claim frequencies in this account have broadly fallen since 2008, but are now reasonably flat� Frequencies in the past year have been lower than previously projected� Consequently, we have reduced the projected total claim frequencies� However, entitlement claim frequencies have been increasing since 2012� Graph 45 shows the annual historical and projected claim frequency rates for the account�
Graph 45 – Work Account: Estimated Claim Frequency Rates per 1,000 Employed People
Accident year ending 30 June Total claims Entitlement claims
Projection Projection
Previous projection Previous projection
200
8
200
9
2010
2011
2012
2013
2014
2015
2016
2017
2018
2019
2020
2021
2022
Tota
l cla
im fr
eque
ncy
120 30
Entit
lem
ent c
laim
freq
uenc
y100 25
80 20
60 15
40 10
20 5
0 0
WHY TOTAL CLAIM FREQUENCY RATES HAVE INCREASED
Most entitlement claims in the Work Account receive weekly compensation� People working in labour-intensive industries, such as construction and manufacturing, are more likely than others to have injuries requiring time off work� They’re also more likely to need to be fully recovered before returning to work after injury� An increase in the proportion of workers in these industries has contributed to the higher growth in work-related weekly compensation claim frequencies�
Allowing for this growth and the Treasury’s forecast of economic growth, entitlement claim frequencies are projected to increase in the Work Account�

ACCIDENT COMPENSATION CORPORATION120
Treatment Injury Account: major increases since 2005, and lower claim frequency growth since 2016
WHO THIS ACCOUNT COVERS AND FOR WHAT
The Treatment Injury Account covers injuries that:
• happen to people when they’re receiving medical treatment, and
• are not normal complications or risks arising from treatment�
Treatment injuries to earners are funded by levies paid by earners� Treatment injuries to non-earners are funded by the Government� Health care providers don’t pay levies for treatment injury cover� Entitlement claims make up around 90% of the account’s total payments�
Approximately 75% of the Treatment Injury Account’s OCL relates to non-earners� Most earners’ treatment injuries only result in follow-up medical treatment� These claims are very short, and clients have usually recovered by the time the OCL is valued�
Serious injury claims drive most of the cost for the Non-Earners’ portion of the account� Each year new serious injury claims are added to the OCL� The claims needing support for the longest periods are for birth-related treatment injuries� These make up 40-50% of the serious injuries covered and may need attendant care for decades into the future�
HOW CHANGES TO ACCEPTANCE CRITERIA LED TO CLAIM INCREASES
Before 2005 the account was called the Medical Misadventure Account and mostly covered serious injuries� On 1 July 2005 the account was renamed the Treatment Injury Account� From then on clients didn’t have to prove that an injury was both rare and severe, or caused by medical error, for ACC to accept their claims�
The number of claims increased considerably following this change and it has continued to grow, especially from 2012� Between 65% and 70% of claims need medical treatment only� Graph 46 shows the annual historical and projected claim frequency rates for this account�
Graph 46 – Treatment Injury Account: Estimated Claim Frequency Rates per 1,000 People
200
8
200
9
2010
2011
2012
2013
2014
2015
2016
2017
2018
2019
2020
2021
2022
Accident year ending 30 June Total claims Entitlement claims
Projection Projection
Previous projection Previous projection
Clai
m fr
eque
ncy
5
4
3
2
1
0

FINANCIAL CONDITION REPORT 2018 121
Appendix C Claim volumes, types and costs
CLAIM FREQUENCY RATES SLOWED FROM 2017
Total claim frequencies grew at a slower rate from 2017 than in previous years� We need to wait to see if this is a one-off change or a continuing trend� The same growth rates for future years has been retained� If frequencies continue to grow at a slower rate, these growth rates will be revised downwards�
The growth in frequency in the past year also flattened off for entitlement claims, leading us to reduce the projected growth�
122 ACCIDENT COMPENSATION CORPORATION
Valu
atio
n of
the
outs
tand
ing
clai
ms
liab
ilit
y Appendix D
Valuation of the outstanding claims liability

FINANCIAL CONDITION REPORT 2018 123
Apprndix D Valuation of the outstanding claims liability
The outstanding claims liability (OCL) increased from June 2017 to June 2018ACC’s OCL at 30 June 2018 was $41,943 million, an increase of $2,848 million from 30 June 2017� The forecast was an increase of $1,234 million� The liability includes work-related gradual process claims incurred but not yet reported� Note that the liability for these claims is not included in the OCL reported in the Annual Report due to accounting requirements� But it’s included here because the Work Account levy funds this amount�
The OCL is important as it feeds into recommendations for levy rates and appropriations� It also points to areas where changes in claim volumes or severity may be a risk to the Scheme’s efficiency and outcomes for clients�
The increase is partly because the Scheme has yet to mature� We expect the rate of new claims to exceed claims leaving the Scheme� The OCL will also grow with inflation and as the population grows�
Table 21 shows the breakdown of the OCL and how it changed between June 2017 and June 2018�
Table 21 – Changes in OCL from June 2017 to June 2018
($M)Liability at
30 June 2017Model
recalibrationExpected increase
Changes due to economic
assumptions
Changes due to experience
and modelling
changes
Changes due to model
assumptionsLiability at
30 June 2018
Medical costs 3,198 (115) 165 217 (62) 0 3,404
Elective surgery 3,718 (123) 239 245 (46) (723) 3,310
Social rehabilitation 17,260 15 507 1,392 (106) (494) 18,573
Compensation related 9,241 23 276 536 99 486 10,660
Other 3,492 (194) 6 209 125 0 3,637
Claims handling expenses 2,188 0 42 127 3 0 2,359
Total liability 39,095 (393) 1,234 2,725 13 (731) 41,943
As calculated by an independent actuary.Taylor Fry, ACC’s independent actuary, calculated the OCL by forecasting future cash flows for each payment type for accidents that happened before 30 June 2018� They then discounted back cash flows to 30 June 2018 using a ‘risk-free’ interest rate� They also included allowances for claims handling expenses and risk margins�
Assumptions used in the OCL calculation are economic or claim relatedThe key assumptions used to calculate the OCL can be broken into two groups: economic related and claim related�
Economic assumptions apply to all payment types� These are discount rates and underlying inflation rates�
Claim assumptions relate to claim volumes and severity, by type of claim� These assumptions drive future cash flow estimates� They include rehabilitation rates, average payments per claim, superimposed inflation and claims handling expenses� They’re set separately for each account�

ACCIDENT COMPENSATION CORPORATION124
Excluding changes due to economic assumptions, OCL decreases were significant, including a recalibrationThis is Taylor Fry’s first year as ACC’s independent actuary� They recalibrated the OCL at 30 June 2017 to see how different their estimates were from those of the previous actuary� The movement due to the model recalibration represents changes in their modelling approach compared to the modelling approach used by the previous actuary� This is a one-off movement that decreased the OCL by $393 million�
Our new external valuation actuary re-ran the 2017 OCL valuation to see how different their OCL estimates were compared to those of previous valuation actuary�
Table 22 – Change in OCL as at 30 June 2017 due to recalibration ($m)
($M) Earners’Motor
VehicleNon-
Earners’
Treatment Injury
Earners’ portion
Treatment Injury
Non-Earners’ portion Work Total
Serious injury – care 99 159 −135 29 −177 51 26
Serious injury – capital 25 16 13 14 6 −7 67
Non-fatal weekly compensation 125 31 −12 −68 −3 −54 19
Elective surgery −17 −4 2 −62 −51 10 −122
Medical – short-term −14 1 −8 −5 −4 −1 −31
Medical – other −6 −7 4 −23 −15 −35 −82
Non-serious care −13 2 −9 −9 −20 17 −32
Non-serious capital 3 19 2 −19 −37 −16 −48
Vocational rehabilitation 6 0 0 −0 0 −3 3
Fatal weekly compensation 11 −4 −0 −2 −2 −2 1
Independence allowance −20 −0 −23 −1 −9 −3 −56
Lump sums 4 5 10 −0 3 74 96
Hearing loss − − − − − −234 −234
Total liability 203 218 −156 −146 −309 −203 −393
In 2017/18 the external valuation actuary re-evaluated the underlying assumptions for treatment injury claims� Previously the continuance rates had been set higher to reflect uncertainty due to the change in definition from medical misadventure to treatment injury in July 2005� For accident years 2006-2012 they observed a slowing in the growth of new claim volumes for Other Medical and non-serious injury care, and faster recovery rates for clients receiving weekly compensation� This analysis led to new, less conservative assumptions than previously used and a large OCL release of $455 million for the Treatment Injury Account�
Uncertainty within these assumptions is an area of risk that we will continue to monitor�
In serious injury care, growth rates for the level of care that a client is projected to receive were changed to depend on the amount of care a client is presently receiving� Clients with low levels of care are more likely to have higher growth in care needs than clients already on high levels of care� This change resulted in some movements in the OCL for serious injury care between accounts, but little change overall�
The weekly compensation continuance rates for the medium term (years three to eight) were increased for the Earners’ and Motor Vehicle Accounts to better reflect recent actual experience� This resulted in an increase in the OCL�
For the independence allowance, there were liability decreases across all accounts� The external valuation actuary changed the approach to valuing the future payments, which provides additional detail in assumption-setting for continuance rates� This approach resulted in lower long-term continuance rates than the previous assumptions and reduced the liability�

FINANCIAL CONDITION REPORT 2018 125
Apprndix D Valuation of the outstanding claims liability
And lower-than-expected long-term claim performance during 2017/18.In addition, the external valuation actuary changed the following long-term assumptions:
• Social rehabilitation – a $494 million liability decrease� Expected pay rates for aged-care and disability workers reduced arising from an amendment to the pay equity legislation assumption introduced last year�
• Elective surgery superimposed inflation – a $723 million liability decrease� The long-term assumption for superimposed inflation was reduced from 4% to 3% this year to reflect the experience in the past six years�
• Weekly compensation long-term continuance rates – a review of the weekly compensation models resulted in changes to the assumptions� This helped to improve the fit of the models to the underlying experience and resulted in a $486 million liability increase�
The overall impact of changes to long-term assumptions was an OCL reduction of $731 million�
These decreases were more than offset, mainly due to economic changesChanges due to economic assumptions increased the OCL by $2,725 million including work-related gradual process claims incurred but not yet reported� Changes in the economic environment will cause the OCL to go up or down� The investment team helps to manage these risks through its asset allocation strategy as described in Appendix F – How ACC manages its investments� The $2,725 million change this year reflects:
• a decrease in discount rates, resulting in an increase of $2,833 million
• a decrease in inflation rates, resulting in a reduction of $113 million
• higher-than-expected inflation during 2017/18, resulting in an increase of $5 million�
There was also an increase of $13 million due to higher-than-expected claim volumes and severity, and the forecast changes that resulted�

ACCIDENT COMPENSATION CORPORATION126
Each payment type has projected cash flowsTable 23 shows the main payment types and how each is valued for the OCL�
Table 23 – Payment types
Payment type Description Valuation methodology
Non-fatal weekly compensation Income replacement Full payment per active claim
Vocational rehabilitation Rehabilitation services provided to help clients return to work
Simplified payment per active claim
Social rehabilitation – serious injury Non-vocational rehabilitation provided to clients with serious injuries
Individual projection
Social rehabilitation – non-serious injury Non-vocational rehabilitation services provided to clients whose injuries are not serious
Full payment per active claim
Medical Medical services, including general practitioners, physiotherapy, imaging services and other medical services
Simplified payment per active claim
Elective surgery Surgical procedures Simplified payment per active claim
Fatal weekly compensation Income support provided to surviving dependants of fatally injured clients
Simplified payment per active claim
Independence allowance Compensation for long-term impairment Full payment per active claim
FULL PAYMENT PER ACTIVE CLAIM
The number of future active claims is projected based on three elements:
1� The number of new claims being reported�
2� The number of continuing claims�
3� An assumed rate of claims finishing�
The future average claim size by duration is forecast based on the starting average size and assumed inflation� The average size and the average number of active claims are multiplied at each future point to calculate the projected cash flow�
SIMPLIFIED PAYMENT PER ACTIVE CLAIM
The number of future active claims is projected based on the claim durations� The future average claim size by duration is determined based on the starting average size and assumed inflation� The average size and number of claims are multiplied at each future point to calculate the projected cash flow�
INDIVIDUAL PROJECTION
Future cash flows are projected based on the individual characteristics of each claim, such as the client’s age and how severe the injury is�
Along with a range of assumptions for calculating the OCL.A large number of assumptions are needed to project future cash flows and calculate the OCL� The actuary must use ‘best estimates’ when making assumptions� These aren’t deliberately conservative or optimistic� The liability produced using the best estimate assumptions is a ‘central estimate’�

FINANCIAL CONDITION REPORT 2018 127
Apprndix D Valuation of the outstanding claims liability
Economic assumptions meet strict requirementsThe New Zealand equivalent to International Financial Reporting Standard No� 4 – Insurance Contracts for public benefit entities (NZ IFRS 4 [PBE]) requires discount rates to be ‘risk free’� The Treasury prescribes the risk-free rates used in financial accounting for all Crown entities� Short-term discount rates reflect the yields of New Zealand Government bonds� Long-term discount rates are based on long-term historical norms� These can’t be seen from New Zealand Government bond yields�
The Treasury approach applies a smoothing methodology to transition between the last observed short-term rate and the assumed long-term rate�
Graph 47 shows the discount rates used in the calculation of the 30 June 2018 OCL and the rates used in the two previous years�
Graph 47 – Discount rates – application of the yield curve to liabilities
2019
2021
2023
2025
2027
2029
2031
2033
2035
2037
2039
2041
2043
2045
2047
2049
2051
2053
2055
2057
2059
Year ending 30 June
2018 valuation 2017 valuation 2016 valuation
Dis
coun
t rat
e (%
)
5.0
4.5
4.0
3.5
3.0
2.5
2.0
1.5
This year short- and medium-term rates decreased significantly, in line with market yields available on Government bonds� The assumed long-term rate of 4�75% per year prescribed by the Treasury stayed the same�
The Treasury specifies assumptions for short-term consumer price index (CPI) rates, based equally on inflation-indexed bonds and market forecasts of inflation� Assumptions for future average weekly earnings rates and the labour cost index (LCI) are based on CPI assumptions� These are based on historical differences between the relevant indices� Graph 48 shows the CPI assumptions used in the calculation of the 30 June 2018 OCL and the rates used in the two previous years�

ACCIDENT COMPENSATION CORPORATION128
Graph 48 – Inflation rate assumptions
2019
2021
2023
2025
2027
2029
2031
2033
2035
2037
2039
2041
2043
2045
2047
2049
2051
2053
2055
2057
2059
Year ending 30 June 2018 valuation 2017 valuation 2016 valuation
Infla
tion
rate
(%)
2.5
2.0
1.5
1.0
0.5
0.0
Short-term inflation rates increased slightly from the previous year, but projected inflation assumptions for later periods decreased�
The inflation indices are applied to payment types according to economic drivers of cost� Table 24 shows the inflation type that’s used for each payment type�
Table 24 – pplication of inflation assumptions
Inflation type Payment type used
Average weekly earnings 1.0% above CPI The starting level of non-fatal weekly compensation for new claims, as the payment is based on income at the date of the accident.
LCI 0.2% above CPI Non-fatal weekly compensation for growth in payments for continuing claims, as the legislation indexes payments to the LCI.
Fatal weekly compensation, medical, elective surgery, vocational rehabilitation and social rehabilitation.
CPI Independence allowance, lump sum and funeral grants/benefits.
Short and long-term assumptions about claim volumes are soundThe external valuation actuary reviews the number and severity of claims, by type of claim, every year considering actual claims made� Short-term assumptions follow recent claims quite closely� Long-term assumptions are also set to follow the actual experience, but these tend to be volatile and the selected rates will generally reflect historical averages�
We’re satisfied that the methods and assumptions used are appropriate�
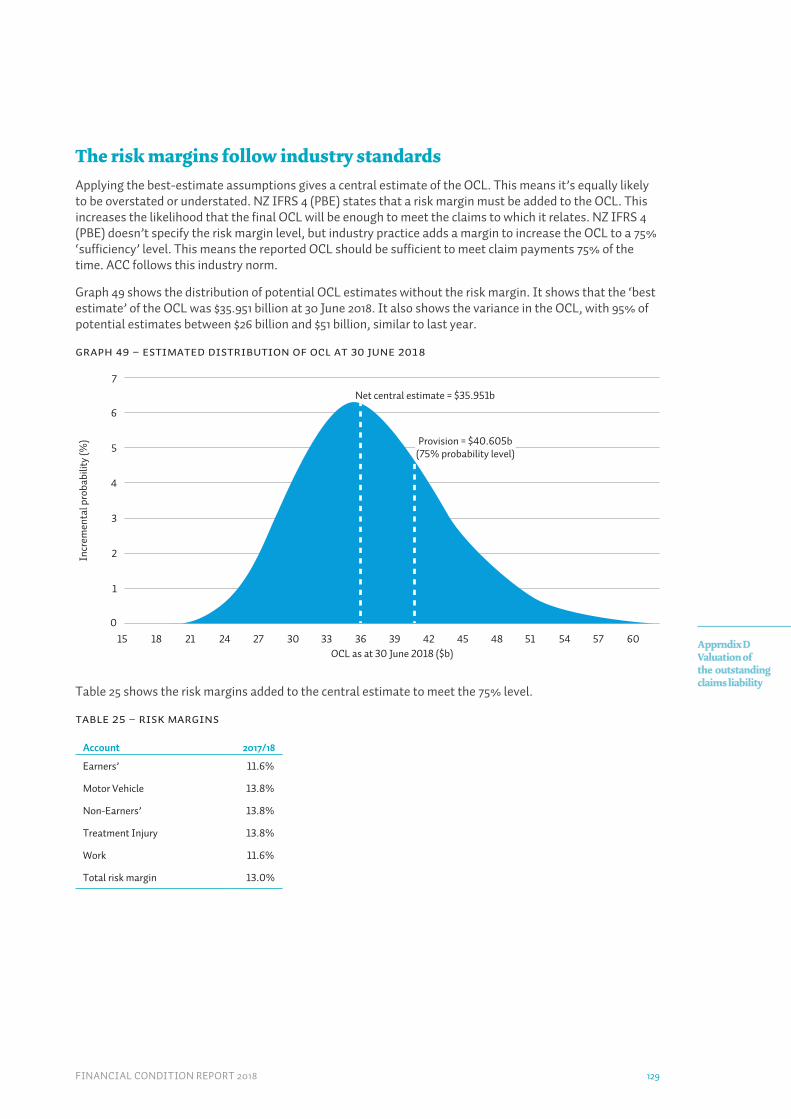
FINANCIAL CONDITION REPORT 2018 129
Apprndix D Valuation of the outstanding claims liability
The risk margins follow industry standardsApplying the best-estimate assumptions gives a central estimate of the OCL� This means it’s equally likely to be overstated or understated� NZ IFRS 4 (PBE) states that a risk margin must be added to the OCL� This increases the likelihood that the final OCL will be enough to meet the claims to which it relates� NZ IFRS 4 (PBE) doesn’t specify the risk margin level, but industry practice adds a margin to increase the OCL to a 75% ‘sufficiency’ level� This means the reported OCL should be sufficient to meet claim payments 75% of the time� ACC follows this industry norm�
Graph 49 shows the distribution of potential OCL estimates without the risk margin� It shows that the ‘best estimate’ of the OCL was $35�951 billion at 30 June 2018� It also shows the variance in the OCL, with 95% of potential estimates between $26 billion and $51 billion, similar to last year�
Graph 49 – Estimated distribution of OCL at 30 June 2018
15 18 21 24 27 30 33 36 39 42 45 48 51 54 57 60OCL as at 30 June 2018 ($b)
Incr
emen
tal p
roba
bilit
y (%
)
7
6
5
4
3
2
1
0
Net central estimate = $35.951b
Provision = $40.605b(75% probability level)
Table 25 shows the risk margins added to the central estimate to meet the 75% level�
Table 25 – Risk margins
Account 2017/18
Earners’ 11.6%
Motor Vehicle 13.8%
Non-Earners’ 13.8%
Treatment Injury 13.8%
Work 11.6%
Total risk margin 13.0%
ACCIDENT COMPENSATION CORPORATION130
The OCL includes claims handling expensesThe OCL must allow for future claims handling expenses� These are based on the assumed costs per expense driver for each expense type, drawn from budgeted expenses� The expenses are split into rehabilitation, entitlement, medical treatment, serious injury and hearing loss� They’re also split by account using an activity-based apportionment model�
The liability excludes significant one-off costs for Integrated Change Investment Portfolio projects included in the 2018/19 budget� Costs for the projects are assumed to be offset by future savings�
The independent actuary complied with all professional reporting standardsThese are:
• NZ IFRS 4 (PBE), issued by the New Zealand Accounting Standards Board of the External Reporting Board
• Professional Standard No� 30 – Valuations of General Insurance Claims, issued by the New Zealand Society of Actuaries�
Alan Greenfield FIAA and Ross Simmonds FNZSA FIA, from independent actuary Taylor Fry, valued ACC’s OCL� They gave us their report Accident Compensation Corporation – Valuation of Outstanding Claims Liabilities as at 30 June 2018 in August 2018�
131
Fina
ncia
l res
ults
Appendix E
Financial results
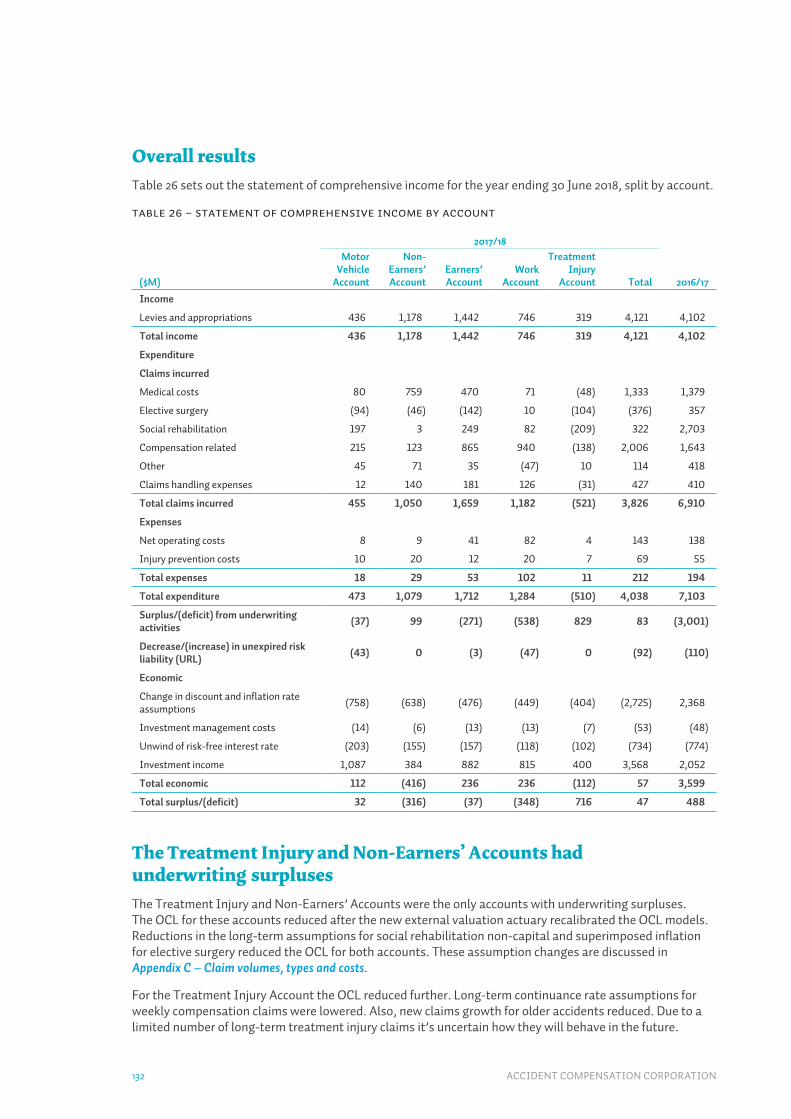
ACCIDENT COMPENSATION CORPORATION132
Overall resultsTable 26 sets out the statement of comprehensive income for the year ending 30 June 2018, split by account�
Table 26 – Statement of Comprehensive Income by account
2017/18
($M)
Motor Vehicle
Account
Non- Earners’ Account
Earners’ Account
Work Account
Treatment Injury
Account Total 2016/17
Income
Levies and appropriations 436 1,178 1,442 746 319 4,121 4,102
Total income 436 1,178 1,442 746 319 4,121 4,102
Expenditure
Claims incurred
Medical costs 80 759 470 71 (48) 1,333 1,379
Elective surgery (94) (46) (142) 10 (104) (376) 357
Social rehabilitation 197 3 249 82 (209) 322 2,703
Compensation related 215 123 865 940 (138) 2,006 1,643
Other 45 71 35 (47) 10 114 418
Claims handling expenses 12 140 181 126 (31) 427 410
Total claims incurred 455 1,050 1,659 1,182 (521) 3,826 6,910
Expenses
Net operating costs 8 9 41 82 4 143 138
Injury prevention costs 10 20 12 20 7 69 55
Total expenses 18 29 53 102 11 212 194
Total expenditure 473 1,079 1,712 1,284 (510) 4,038 7,103
Surplus/(deficit) from underwriting activities (37) 99 (271) (538) 829 83 (3,001)
Decrease/(increase) in unexpired risk liability (URL) (43) 0 (3) (47) 0 (92) (110)
Economic
Change in discount and inflation rate assumptions (758) (638) (476) (449) (404) (2,725) 2,368
Investment management costs (14) (6) (13) (13) (7) (53) (48)
Unwind of risk-free interest rate (203) (155) (157) (118) (102) (734) (774)
Investment income 1,087 384 882 815 400 3,568 2,052
Total economic 112 (416) 236 236 (112) 57 3,599
Total surplus/(deficit) 32 (316) (37) (348) 716 47 488
The Treatment Injury and Non-Earners’ Accounts had underwriting surplusesThe Treatment Injury and Non-Earners’ Accounts were the only accounts with underwriting surpluses� The OCL for these accounts reduced after the new external valuation actuary recalibrated the OCL models� Reductions in the long-term assumptions for social rehabilitation non-capital and superimposed inflation for elective surgery reduced the OCL for both accounts� These assumption changes are discussed in Appendix C – Claim volumes, types and costs�
For the Treatment Injury Account the OCL reduced further� Long-term continuance rate assumptions for weekly compensation claims were lowered� Also, new claims growth for older accidents reduced� Due to a limited number of long-term treatment injury claims it’s uncertain how they will behave in the future�

FINANCIAL CONDITION REPORT 2018 133
Appendix E Financial results
The levied accounts are overfunded and based on the funding policy are expected to produce underwriting deficits� These deficits partially offset the surpluses of the Treatment Injury and Non-Earners’ Accounts, and ACC ended the year with a small underwriting surplus�
With the biggest underwriting deficit in the Work Account.The largest underwriting deficit ($538 million) was in the Work Account� Here a change in the long-term continuance rate assumption (the length of time claims will be active) led to a large OCL increase� Net of this assumption change the underwriting deficit reduces to $52 million�
Table 27 gives the projected statement of comprehensive income by account for 2018/19 compared with the total result for 2017/18�
Table 27 – Projected 2018/19 Statement of Comprehensive Income
2018/19 projected
($M)
Motor Vehicle
Account
Non-Earners’ Account
Earners’ Account
Work Account
Treatment Injury
Account Total 2017/18
Income
Levies and appropriations 444 1,273 1,532 724 329 4,302 4,121
Total income 444 1,273 1,532 724 329 4,302 4,121
Expenditure
Claims incurred
Medical costs 111 785 519 144 40 1,598 1,333
Elective surgery 50 104 252 76 66 549 (376)
Social rehabilitation 371 368 196 70 264 1,269 322
Compensation related 236 36 812 509 85 1,678 2,006
Other 47 34 44 100 19 244 114
Claims handling expenses 53 112 163 89 29 445 427
Total claims incurred 869 1,439 1,985 987 503 5,783 3,826
Expenses
Net operating costs 9 12 37 61 6 125 143
Injury prevention costs 11 25 14 16 11 78 69
Total expenses 20 37 51 77 17 202 212
Total expenditure 889 1,476 2,036 1,064 520 5,985 4,038
Surplus/(deficit) from underwriting activities (445) (203) (505) (340) (191) (1,683) 83
Decrease/(increase) in URL 16 0 89 (6) 0 98 (92)
Economic
Changes to discount and inflation assumptions 0 0 0 0 0 0 (2,725)
Investment management costs (16) (5) (13) (13) (6) (53) (53)
Unwind of risk-free interest rate (166) (141) (125) (122) (89) (643) (734)
Investment income 430 171 397 328 177 1,503 3,568
Total economic 247 25 260 193 83 808 57
Total surplus/(deficit) (181) (179) (156) (153) (108) (777) 47

ACCIDENT COMPENSATION CORPORATION134
Levied accounts will produce deficits in 2018/19The levied accounts are all projected to produce deficits during 2018/19� The 2017/19 Earners’, Work and Motor Vehicle Account levy rates were set lower than the expected new-year costs� This was to reduce the forecast funding positions towards target�
As will the Non-Earners’ and Treatment Injury Accounts.The Non-Earners’ and Treatment Injury Accounts are also projected to produce deficits� This is because appropriations were set below the amount needed under the funding policy, and below the expected new-year costs of claims� This is further discussed in the How ACC services are funded section�
135
How
ACC
man
ages
its
inve
stm
ents
Appendix F
How ACC manages its investments

ACCIDENT COMPENSATION CORPORATION136
ACC’s investment performance
The investment return was above benchmarkIn 2017/18 the Scheme’s gross investment return was 9�89% compared to the market-based benchmark of 9�88%� After adjusting for investment expenses and tax, the return rate was 9�78%, slightly below the after-expenses benchmark� Investment returns varied by account, but each one had satisfactory returns�
The benchmark is set in advance by the Board’s Investment Committee�
But only marginally.For the past 26 years, returns have been above benchmark� This was true for 2018, although the margin was small this year� See Graph 50�
Graph 50 – Comparison of investment returns with Benchmark
1993
1994
1995
1996
1997
1998
1999
200
0
200
1
200
2
200
3
200
4
200
5
200
6
200
7
200
8
200
9
2010
2011
2012
2013
2014
2015
2016
2017
2018
Act
ual r
etur
ns (%
)
25
20
15
10
5
0
−5
Actual Benchmark
ACC’s investment is long termACC mainly invests for the long term and considers long-term trade-offs between risks and rewards� Management considers:
• the stability of ACC’s assets in relation to liabilities
• the effect on levies
• the impact on Government appropriations�

FINANCIAL CONDITION REPORT 2018 137
Appendix F How ACC manages its investments
How investments are governed
The investment team reports through the Investment CommitteeACC’s investment team manages investments and reports through the Investment Committee, a sub-committee of the Board� Investment managers have discretion to act within the Committee’s delegations�
For example, the team can vary asset allocations from the benchmark weights within tolerances set by the Committee� The investment team documents its approach and the Investment Committee provides a governance focus�
The Investment Committee sets guidelinesThe Committee:
• sets risk tolerances
• approves asset allocation benchmarks and major transactions in unlisted markets
• reviews investment performance and compliance
• provides investment delegations, restrictions and limits to the investment team�
And regularly reviews benchmarks.The Committee reviews asset allocation benchmarks every 12 months, with six-monthly interim adjustments� Interim adjustments reduce the average size of the transactions required to implement the changes made over a year�
Investments are mainly managed internally, but also externallyThe investment portfolios are all actively managed� Almost all New Zealand and Australian investments are managed internally� 11 external fund management companies manage most investments outside Australasia, but since April 2011 some global equity investments have been managed internally�

ACCIDENT COMPENSATION CORPORATION138
How investment assets are allocated
Investment returns and risks relate to ACC’s outstanding claims liabilityThe asset allocation strategy’s high-level objective is to manage ACC’s investment returns and risks� This is related to ACC’s outstanding claims liability (OCL)� Levy payers and tax payers ultimately bear the risks if investment returns are inadequate to meet future claim payments� In broad terms, the trade-off is between:
• higher, but more stable, levy rates and appropriations, from lower-risk and lower-return investments
• lower and more variable levy rates and appropriations from investments in higher-risk assets with potentially higher returns�
In managing this trade-off, ACC needs to consider assets and liabilities� For example, changes in an asset’s value offset by changes in the OCL would likely reduce the Scheme’s risk overall� This asset would be considered low risk, even though its return in isolation might be volatile�
In practice, Scheme assets don’t match claims liabilitiesIn a closely matched portfolio, asset and liability values would respond to economic stresses and mostly offset each other� Net assets would then be relatively immune to external pressures� In practice, it’s not possible to invest Scheme assets to match claims liabilities completely, or even closely, due to the lack of availability of suitably long-dated and index-linked investment assets within New Zealand�
But have notional minimum risk portfolios.To decide the level of incremental net asset risk, ACC:
• identifies which assets most closely match the OCL to establish the minimum risk portfolio
• decides the discretionary risk that ACC is prepared to accept over and above the notional minimum risk portfolio in pursuit of higher returns�
When deciding this, ACC uses its updated long-term return forecasts and takes more incremental risks when the expected rewards for these are higher�
The notional minimum risk portfolio is typically dominated by Government bonds, including a weighting for index-linked bonds� These are a good match to the OCL, much of which is long-dated and moves with inflation� It also contains relatively small allocations of equity and other asset classes�
The actual portfolio, which includes discretionary risk, substitutes some equities and other higher-returning assets in lieu of bonds�
Graph 51 shows the estimated risk and return across all accounts� Risk is shown as the sum of net annual asset/liability volatility (standard deviation) across all accounts�

FINANCIAL CONDITION REPORT 2018 139
Appendix F How ACC manages its investments
Graph 51 – Total reserve Account – Risk Vs Return
Expe
cted
inve
stm
ent i
ncom
e ($
m)
500
1,000
1,500
2,000
2,500
Standard deviation of net asset/liability risk ($m)
� Cash
� Benchmark
Minimum risk portfolio �
2,200 2,700 3,200 3,700 4,200
ACC estimates an expected return of $1�43 billion for the notional minimum-risk portfolio, with a net asset/liability risk of $3�39 billion� The portfolio benchmarks adopted in 2017/18 increase the expected annual investment income to $1�92 billion, but also raise the total risk to $3�75 billion�
Table 28 shows the strategic asset allocations for each of the five accounts� It also shows the total actual asset allocation at 30 June 2018 compared with the total strategic asset allocation at 30 June 2017�
Table 28 – Strategic Asset Allocation by account and Total actual
Strategic asset allocation as at 30 June 2018 Actual asset
allocation 2018
Strategic asset
allocation 2017Asset class
Motor Vehicle
Account
Non-Earners’ Account
Earners’ Account
Work Account
Treatment Injury
Account Total
New Zealand cash 2.0% 2.0% 2.0% 4.0% 2.0% 2.4% 7.8% 2.4%
New Zealand long bonds 39.0% 22.5% 34.5% 45.0% 28.5% 36.7% 32.4% 36.9%
New Zealand index-linked bonds 28.5% 27.0% 20.0% 15.5% 28.5% 23.1% 23.6% 21.8%
Global bonds 2.0% 3.0% 7.0% 8.0% 3.0% 4.9% 5.2% 4.8%
New Zealand property and infrastructure 3.50% 3.5% 3.5% 3.5% 3.5% 3.5% 1.9% 3.5%
Direct markets 0.0% 0.0% 0.0% 0.0% 0.0% 0.0% 3.8% 0.0%
New Zealand equities 8.0% 11.0% 8.5% 7.5% 10.5% 8.6% 7.8% 8.6%
Australian equities 4.5% 4.5% 4.5% 4.5% 4.5% 4.5% 4.2% 4.6%
Global equities 12.5% 26.5% 20.0% 12.0% 19.5% 16.3% 13.3% 17.4%
Total 100.0% 100.0% 100.0% 100.0% 100.0% 100.0% 100.0% 100.0%
Interest rate derivative asset allocation overlay 9.5% 13.5% 5.0% 1.0% 12.5% 7.0% 4.7% 7.1%
Total equity weight (treating New Zealand property and infrastructure as ‘half equities’)
26.8% 43.8% 34.8% 25.8% 36.3% 31.1% 27.4% 32.4%

ACCIDENT COMPENSATION CORPORATION140
Different accounts have different asset allocationsAsset allocation is shaped by account� The size and nature of claims liabilities are considered together with the assets available�
Generally, accounts with lower funding positions, and that are liable for lengthy claims, tend to have asset allocations more highly weighted towards equities�
For the Motor Vehicle Account, this is less extreme� This is because of the low annual cash flow from levy income and claim payments in relation to the size of the assets and liabilities� This reduces the account’s ability to absorb fluctuations in equity prices without a significant impact on levy rates�
ACC reviewed and updated the strategic asset allocation percentages for the individual accounts at the end of October 2017 and April 2018�
The changes varied by account due to specific account differences, such as changes in funding ratios� Overall, changes were modest, reflecting offsetting influences� These were:
• a slight increase in the inflation-indexed bond weight, as more were available in the market
• a slight reduction in the total global equity weight
• a slight reduction in the total unhedged foreign currency exposure�
As each manages different types of claims.Most claims are short term and don’t pose significant investment issues� A small number of claims are for very long-term injuries� Most of the claims for very long-term injuries are in the Motor Vehicle, Non-Earners’ and Treatment Injury Accounts� The liability profile for these serious injuries is lengthy, with payments subject to general price inflation and superimposed inflation�
Weekly compensation claims tend to last for intermediate lengths of time� They end when a client is able to go back to work or reaches the age of eligibility for superannuation� These claims are subject to wage-related inflation� Most weekly compensation claims are in the Work and Earners’ Accounts; they dominate the Work Account liability�
People claiming elective surgery often have injuries that deteriorate as they get older� This can lead to the need for repeat procedures� These claims tend to be medium to long term, so are subject to high superimposed inflation� The Earners’ Account has the highest elective surgery liability, making the average length of claims in this account slightly longer than those in the Work Account�
Actual asset allocations are different from the strategic allocationsThe strategic asset allocations represent the benchmark holdings� Actual allocations may differ at any time within limits prescribed by the Investment Committee� Direct markets is a new asset class that includes unlisted property, infrastructure and private equity holdings� These were previously included within other asset classes (New Zealand property and infrastructure and New Zealand equities)� The strategic asset allocation is restricted to listed assets and has no allocation to this asset class�

FINANCIAL CONDITION REPORT 2018 141
Appendix F How ACC manages its investments
Factors that influence investment risk
ACC investments face economic and financial uncertaintiesMany economic and financial situations could affect net assets minus liabilities� Levy rates and Government appropriations would be significantly affected if:
• real interest rates declined
• inflation increased
• equity markets declined
• influences such as credit defaults or a stronger New Zealand dollar against foreign currencies led to poorer returns�
Several could happen at once� For example, a severe financial crisis could result in real interest rates and equity markets declining� This could then prompt potentially widespread credit defaults�
Declines in long-term interest rates can have an effectThe OCL’s value is calculated using risk-free interest rates for many years into the future, so falls in long-term interest rates raise the value of the OCL� When this happens, assets also tend to rise in value� But they don’t tend to rise by enough to fully offset the rise in the OCL� This is because no bonds with long-enough maturities to match the payment profile of the liabilities are available� Also, part of the portfolio is invested in assets such as shares that may, or may not, go up in value when long-term real interest rates decline�
So ACC tries to mitigate these declines.That’s why ACC uses an ‘interest rate derivative asset allocation overlay’ to mitigate declines in long-term real interest rates� This overlay, which utilises fixed-for-floating interest rate swaps, generates revaluation gains when long-term interest rates decline� Despite this, ACC is still exposed to interest rate declines�
Future inflation rates affect returnsMost long-term claim payments are inflationary� But many investment assets, including the interest rate derivative asset allocation overlay and most bonds, are not protected from inflation�
The market values of these nominal assets tend to fall if inflation expectations rise� So-called ‘real assets’, such as equities and property, may protect long term� However, history suggests that their returns may be adversely affected by rising inflation in the short term�
The Scheme continues to mature, so it takes on a greater number of serious-injury claims� These extend average claim lengths� This tends to increase exposure to the risk that bond yields will decline or the inflation outlook will deteriorate� Holding index-linked bonds where possible and where they can be obtained at a reasonable price mitigates some of this risk�
As do movements in share markets.ACC invests a portion of its portfolio in shares even though their returns tend to have little correlation with the valuation of the liabilities� This lack of liability matching is accepted because shares are expected to generate higher returns than bonds in the long term� If equity markets decline sharply, this places upward pressure on levy rates and Government appropriations�

ACCIDENT COMPENSATION CORPORATION142
The investment team operates within approved credit criteriaThe Investment Committee has approved a set of credit criteria, including credit and portfolio limits for internally managed portfolios� These credit limits are designed to limit exposure to counterparties with a risk of defaulting, when ACC seeks higher investment returns�
And manages currency movements and asset/liability risk.Movements in exchange rates alter investments’ market values� The investment team considers the relationships between currency movements and other market movements when it assesses the overall asset/liability risk� For example, the New Zealand dollar tends to fall when equity markets decline� The portfolio has some foreign currency exposure� This helps to offset the risk of a decline in equity markets�
ACC has no liquidity concernsACC has no significant issues with meeting liquidity needs� This is because ACC’s investments have a high proportion of liquid cash and bonds, and a fairly steady payment profile�
And takes a broad view of investment risks.ACC has considered other, more extreme, investment risks that:
• are generally unlikely to arise
• would have a material impact if they happened
• would happen with little warning�
Such risks include a natural disaster in New Zealand, insolvency by ACC’s financial custodian, or an Australasian banking crisis�
By focusing more broadly on investment risk, ACC has decided where further action is needed� For example, during 2016/17 ACC introduced more formal methods to monitor and evaluate the ongoing creditworthiness of the Australasian banking system and custodians�


www�acc�co�nz0800 101 996
ACC7979 March 2019 Print ISSN 2230–2042 Online ISSN 2230–2050
Printed in New Zealand on paper sourced from well-managed sustainable forests

![Credit line contract AG Date Section 1. SPECIAL TERMS ......Lender’s bank account numbers ACBA-CREDIT AGRICOLE BANK [ACC NUM] ARMEKONOMBANK [ACC. NUM] ARMBUSINESSBANK [ACCC. NUM]](https://img.pdfslide.net/doc/110x75/5ea9078345731a5ac4059e71/credit-line-contract-ag-date-section-1-special-terms-lenderas-bank-account.jpg)