Embed Size (px)
Citation preview

Partners HealthCare System: Improving Transitions of Care
The One Trick Pony Rides Again!
Partners Clinical Performance/ Department of Quality, Safety, & ValueAlison Holliday, MPH, Project Manager, Patient Safety PHSTerrence O’Malley, MD, Medical Director, Non Acute Care Services PHS
MA Coalition for the Prevention of Medical ErrorsMay 20, 2013
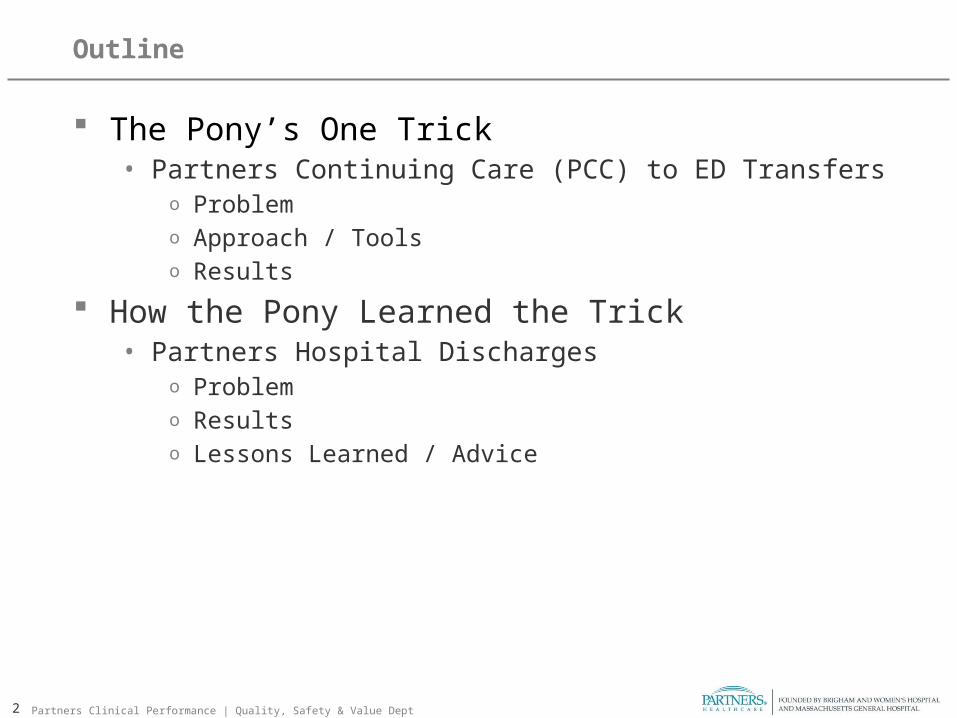
Outline
The Pony’s One Trick• Partners Continuing Care (PCC) to ED Transfers
o Problemo Approach / Toolso Results
How the Pony Learned the Trick• Partners Hospital Discharges
o Problemo Resultso Lessons Learned / Advice
2 Partners Clinical Performance | Quality, Safety & Value Dept
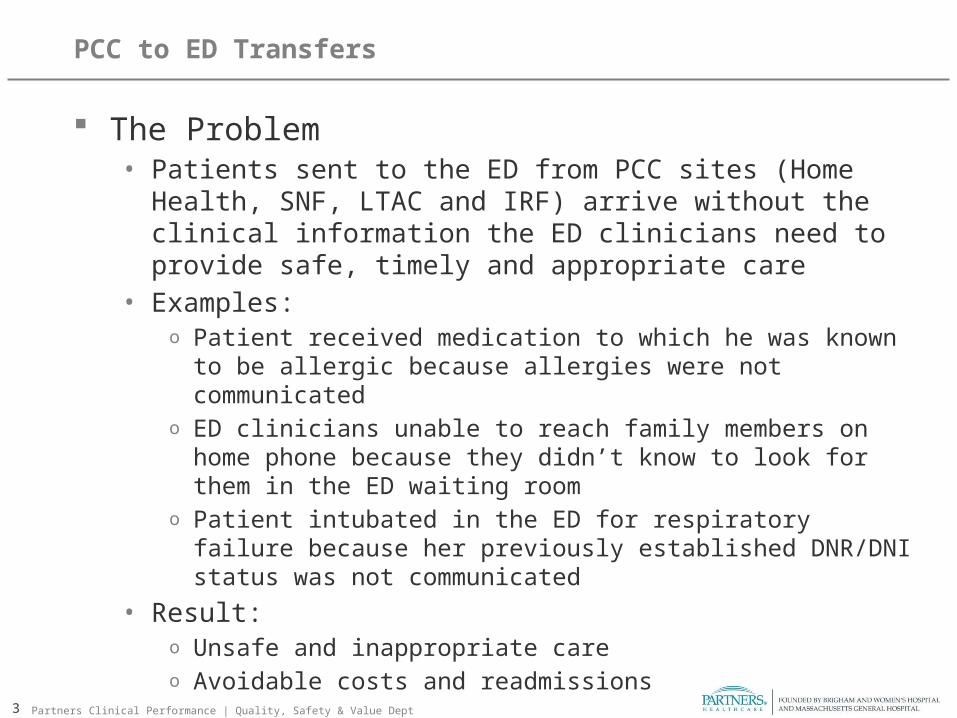
PCC to ED Transfers
The Problem• Patients sent to the ED from PCC sites (Home Health, SNF,
LTAC and IRF) arrive without the clinical information the ED clinicians need to provide safe, timely and appropriate care
• Examples:o Patient received medication to which he was known to be allergic
because allergies were not communicatedo ED clinicians unable to reach family members on home phone
because they didn’t know to look for them in the ED waiting roomo Patient intubated in the ED for respiratory failure because her
previously established DNR/DNI status was not communicated
• Result:o Unsafe and inappropriate careo Avoidable costs and readmissions
3 Partners Clinical Performance | Quality, Safety & Value Dept
The Trick: Approach and Tools
Identify what the ED clinicians want to receive• Focus groups• Prioritized by Network ED Chiefs
Scope down• 200 elements reduced to 44• Start with 16
Measure• Review all ED transfer packets for presence of essential data
Report• “Complete” transfer packets: all 16 elements present• Share performance with sending sites to trigger interventions• Share best practices• Feedback from the ED re: completeness, timeliness, and format
4 Partners Clinical Performance | Quality, Safety & Value Dept
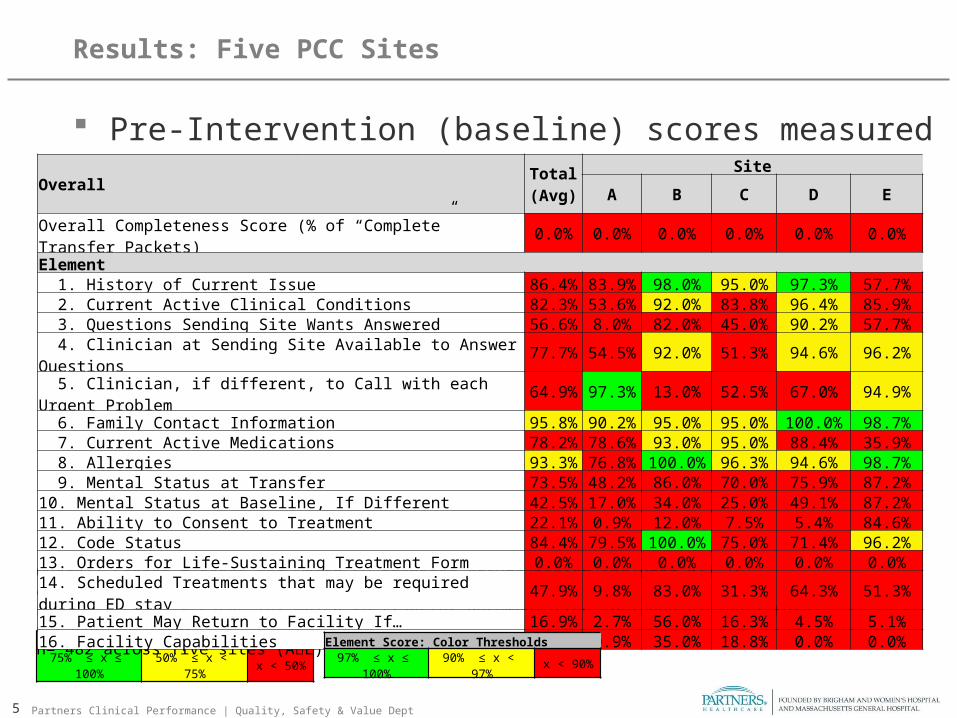
Results: Five PCC Sites
Pre-Intervention (baseline) scores measured & reported
5
Overall Score: Color Thresholds
75% ≤ x ≤ 100% 50% ≤ x < 75% x < 50%
Overall Score= # cases for which ED transfer documentation included all 16 elements/ total # cases reviewedElement Score= # cases for which ED transfer documentation included element/ total # cases reviewedn= 482 across five sites (AE)
Partners Clinical Performance | Quality, Safety & Value Dept
OverallTotal (Avg)
Site
A B C D E
Overall Completeness Score (% of “Complete” Transfer Packets) 0.0% 0.0% 0.0% 0.0% 0.0% 0.0%Element 1. History of Current Issue 86.4% 83.9% 98.0% 95.0% 97.3% 57.7% 2. Current Active Clinical Conditions 82.3% 53.6% 92.0% 83.8% 96.4% 85.9% 3. Questions Sending Site Wants Answered 56.6% 8.0% 82.0% 45.0% 90.2% 57.7% 4. Clinician at Sending Site Available to Answer Questions 77.7% 54.5% 92.0% 51.3% 94.6% 96.2% 5. Clinician, if different, to Call with each Urgent Problem 64.9% 97.3% 13.0% 52.5% 67.0% 94.9%
6. Family Contact Information 95.8% 90.2% 95.0% 95.0% 100.0% 98.7%
7. Current Active Medications 78.2% 78.6% 93.0% 95.0% 88.4% 35.9% 8. Allergies 93.3% 76.8% 100.0% 96.3% 94.6% 98.7% 9. Mental Status at Transfer 73.5% 48.2% 86.0% 70.0% 75.9% 87.2%10. Mental Status at Baseline, If Different 42.5% 17.0% 34.0% 25.0% 49.1% 87.2%11. Ability to Consent to Treatment 22.1% 0.9% 12.0% 7.5% 5.4% 84.6%12. Code Status 84.4% 79.5% 100.0% 75.0% 71.4% 96.2%13. Orders for Life-Sustaining Treatment Form 0.0% 0.0% 0.0% 0.0% 0.0% 0.0%14. Scheduled Treatments that may be required during ED stay 47.9% 9.8% 83.0% 31.3% 64.3% 51.3%15. Patient May Return to Facility If… 16.9% 2.7% 56.0% 16.3% 4.5% 5.1%16. Facility Capabilities 10.9% 0.9% 35.0% 18.8% 0.0% 0.0%
Element Score: Color Thresholds
97% ≤ x ≤ 100% 90% ≤ x < 97% x < 90%
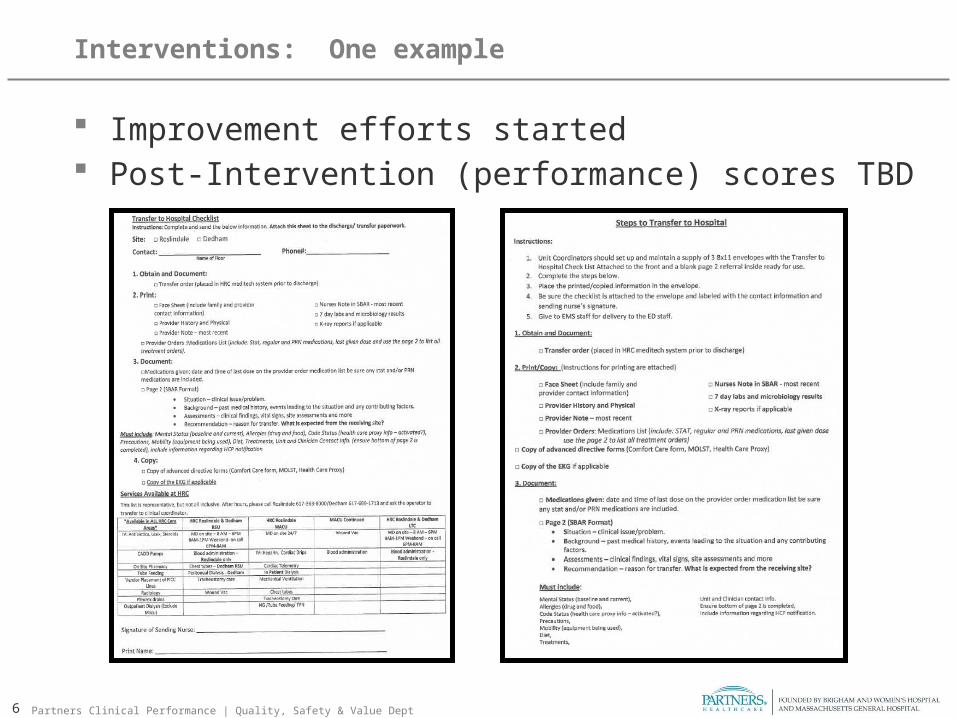
Interventions: One example
Improvement efforts started Post-Intervention (performance) scores TBD
6 Partners Clinical Performance | Quality, Safety & Value Dept
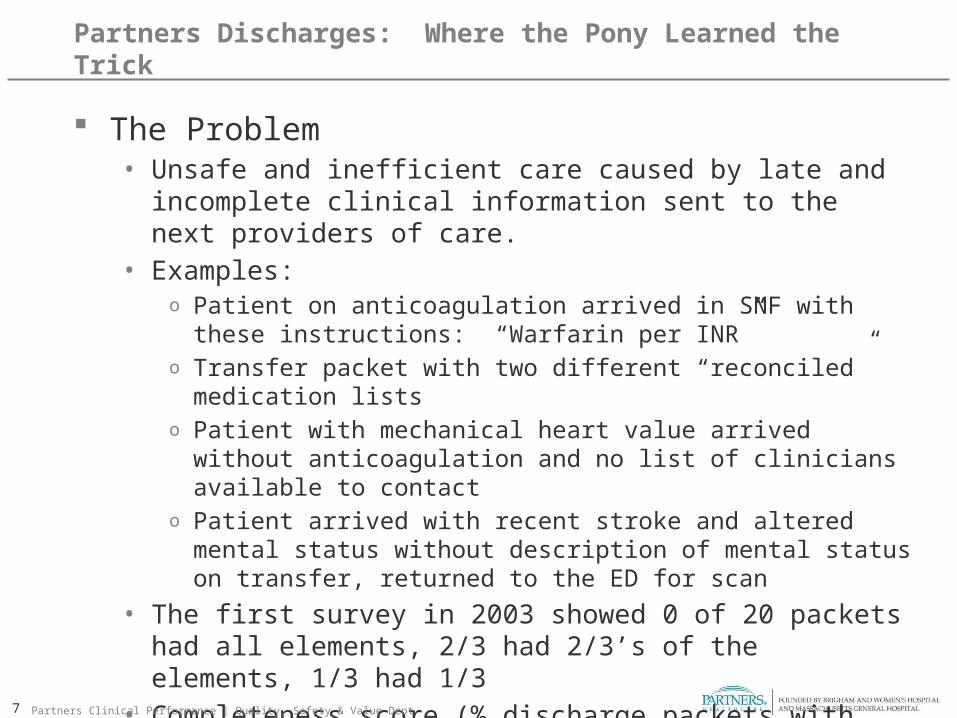
Partners Discharges: Where the Pony Learned the Trick
The Problem• Unsafe and inefficient care caused by late and incomplete
clinical information sent to the next providers of care. • Examples:
o Patient on anticoagulation arrived in SNF with these instructions: “Warfarin per INR”
o Transfer packet with two different “reconciled” medication listso Patient with mechanical heart value arrived without anticoagulation
and no list of clinicians available to contacto Patient arrived with recent stroke and altered mental status without
description of mental status on transfer, returned to the ED for scan
• The first survey in 2003 showed 0 of 20 packets had all elements, 2/3 had 2/3’s of the elements, 1/3 had 1/3
• Completeness score (% discharge packets with all elements) = Zero
7 Partners Clinical Performance | Quality, Safety & Value Dept
Overall Total (Avg)
Site
A B C D E F G
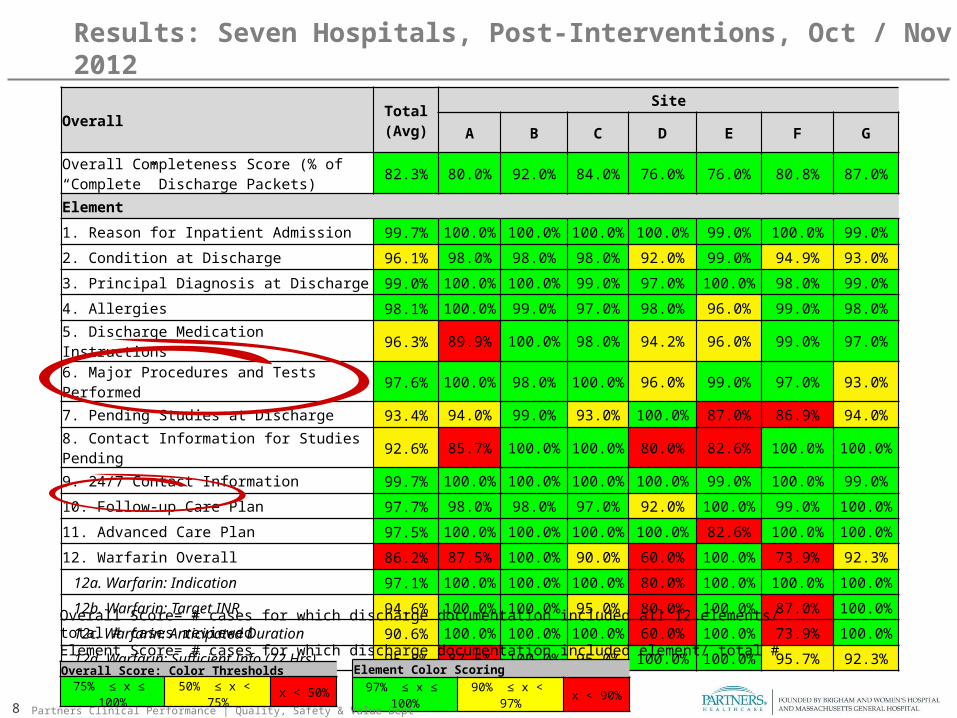
Overall Completeness Score (% of “Complete” Discharge Packets) 82.3% 80.0% 92.0% 84.0% 76.0% 76.0% 80.8% 87.0%
Element
1. Reason for Inpatient Admission 99.7% 100.0% 100.0% 100.0% 100.0% 99.0% 100.0% 99.0%
2. Condition at Discharge 96.1% 98.0% 98.0% 98.0% 92.0% 99.0% 94.9% 93.0%
3. Principal Diagnosis at Discharge 99.0% 100.0% 100.0% 99.0% 97.0% 100.0% 98.0% 99.0%
4. Allergies 98.1% 100.0% 99.0% 97.0% 98.0% 96.0% 99.0% 98.0%
5. Discharge Medication Instructions 96.3% 89.9% 100.0% 98.0% 94.2% 96.0% 99.0% 97.0%
6. Major Procedures and Tests Performed 97.6% 100.0% 98.0% 100.0% 96.0% 99.0% 97.0% 93.0%
7. Pending Studies at Discharge 93.4% 94.0% 99.0% 93.0% 100.0% 87.0% 86.9% 94.0%
8. Contact Information for Studies Pending 92.6% 85.7% 100.0% 100.0% 80.0% 82.6% 100.0% 100.0%
9. 24/7 Contact Information 99.7% 100.0% 100.0% 100.0% 100.0% 99.0% 100.0% 99.0%
10. Follow-up Care Plan 97.7% 98.0% 98.0% 97.0% 92.0% 100.0% 99.0% 100.0%
11. Advanced Care Plan 97.5% 100.0% 100.0% 100.0% 100.0% 82.6% 100.0% 100.0%
12. Warfarin Overall 86.2% 87.5% 100.0% 90.0% 60.0% 100.0% 73.9% 92.3%
12a. Warfarin: Indication 97.1% 100.0% 100.0% 100.0% 80.0% 100.0% 100.0% 100.0%
12b. Warfarin: Target INR 94.6% 100.0% 100.0% 95.0% 80.0% 100.0% 87.0% 100.0%
12c. Warfarin: Anticipated Duration 90.6% 100.0% 100.0% 100.0% 60.0% 100.0% 73.9% 100.0%
12d. Warfarin: Sufficient Info (72 Hrs) 95.8% 87.5% 100.0% 95.0% 100.0% 100.0% 95.7% 92.3%
Results: Seven Hospitals, Post-Interventions, Oct / Nov 2012
8
Element Color Scoring
97% ≤ x ≤ 100% 90% ≤ x < 97% x < 90%
Overall Score= # cases for which discharge documentation included all 12 elements/ total # cases reviewedElement Score= # cases for which discharge documentation included element/ total # cases reviewedn= 699 across seven sites (AG)
Partners Clinical Performance | Quality, Safety & Value Dept
Overall Score: Color Thresholds
75% ≤ x ≤ 100% 50% ≤ x < 75% x < 50%
Q4'05 Q1'06 Q4'06 Q1'07 Q4'07 Q1'08 Q4'08 Q1'09 Q4'09 Q1'10 Q4'10 Q1'11 Q4'11 Q1'12 Q4 '120
10
20
30
40
50
60
70
80
90
100
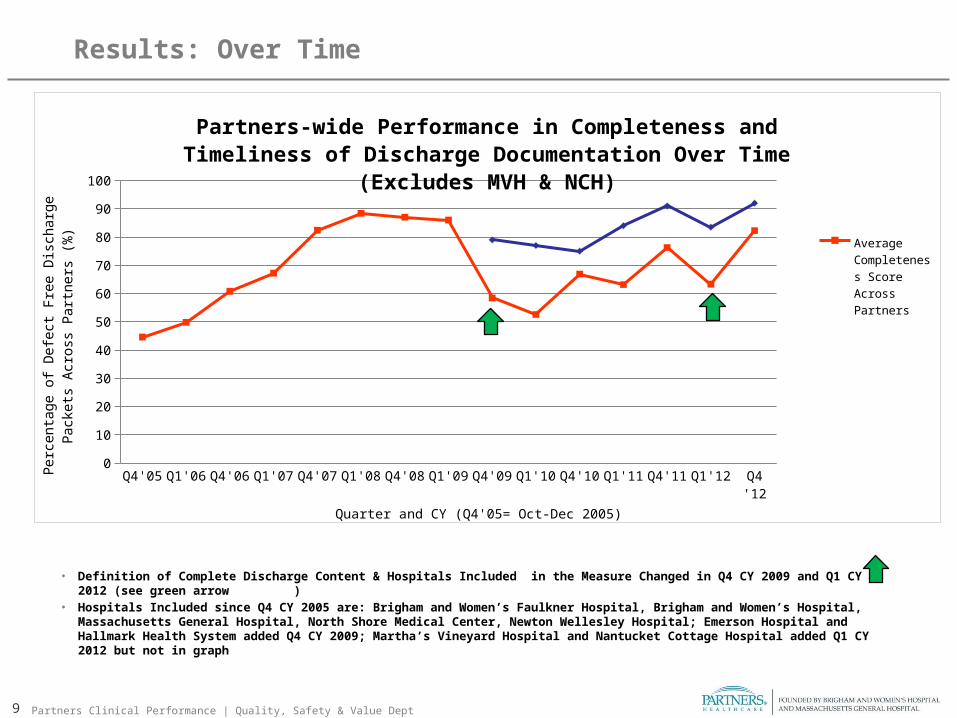
Partners-wide Performance in Completeness and Timeliness of Discharge Documentation Over Time (Excludes MVH & NCH)
Average Completeness Score Across Partners
Average Time-liness Score Across Part-ners
Quarter and CY (Q4'05= Oct-Dec 2005)
Pe
rce
nta
ge
of
De
fect
Fre
e D
isch
arg
e P
ack
ets
Acr
oss
P
art
ne
rs (
%)
Results: Over Time
• Definition of Complete Discharge Content & Hospitals Included in the Measure Changed in Q4 CY 2009 and Q1 CY 2012 (see green arrow )
• Hospitals Included since Q4 CY 2005 are: Brigham and Women’s Faulkner Hospital, Brigham and Women’s Hospital, Massachusetts General Hospital, North Shore Medical Center, Newton Wellesley Hospital; Emerson Hospital and Hallmark Health System added Q4 CY 2009; Martha’s Vineyard Hospital and Nantucket Cottage Hospital added Q1 CY 2012 but not in graph
Partners Clinical Performance | Quality, Safety & Value Dept9
BWFH BWH EH HHS MGH NSMC NWH 0%
20%
40%
60%
80%
100%
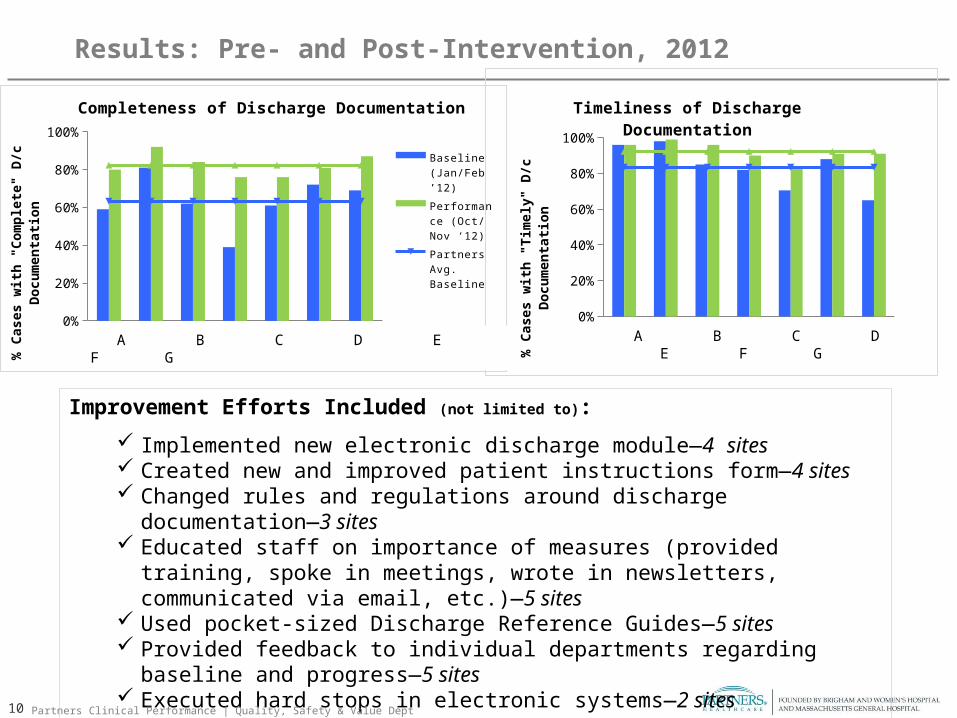
Completeness of Discharge Documentation
Baseline (Jan/Feb ’12)
Performance (Oct/Nov ‘12)
Partners Avg. Baseline
Partners Avg. Per-formance
Site
% C
ases
wit
h "
Co
mp
lete
" D
/c
Do
cum
enta
tio
n
Results: Pre- and Post-Intervention, 2012
BWFH BWH EH HHS MGH NSMC NWH 0%
20%
40%
60%
80%
100%
Timeliness of Discharge Documentation
Site
% C
ases
wit
h "
Tim
ely"
D/c
Do
cum
en-ta
tio
n
Improvement Efforts Included (not limited to):
Implemented new electronic discharge module—4 sites Created new and improved patient instructions form—4 sites Changed rules and regulations around discharge documentation—3 sites Educated staff on importance of measures (provided training, spoke in
meetings, wrote in newsletters, communicated via email, etc.)—5 sites Used pocket-sized Discharge Reference Guides—5 sites Provided feedback to individual departments regarding baseline and progress
—5 sites Executed hard stops in electronic systems—2 sites
A B C D E F G A B C D E F G
10 Partners Clinical Performance | Quality, Safety & Value Dept
Lessons Learned, Barriers and Advice
Lessons:• Measure, measure, measure. • Start small (not 2500 data elements for all patient transfers)• Leadership from the top (the Mongan 7) • Publicly share data• Be in it for the long haul
Barriers• The initial sell to Leadership
Do overs• Would be more strategic than opportunistic
Advice• Start wherever, but start. “N of One”
11 Partners Clinical Performance | Quality, Safety & Value Dept
Appendix
12 Partners Clinical Performance | Quality, Safety & Value Dept
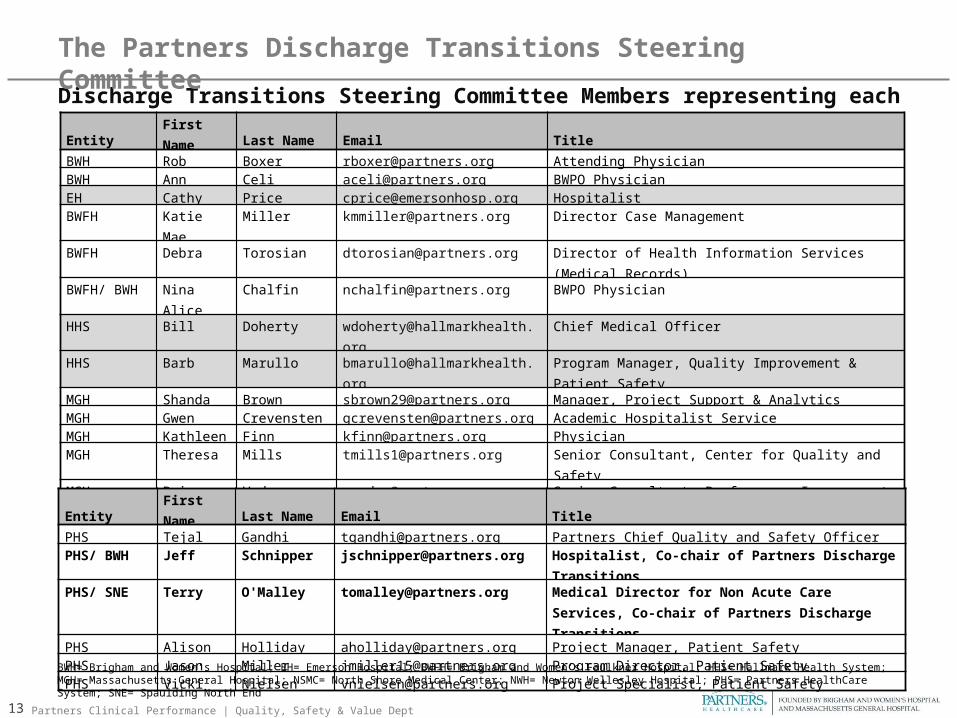
Discharge Transitions Steering Committee Members representing each site include:
Partners Patient Safety Team for Discharge Transitions includes:
EntityFirst Name Last Name Email Title
BWH Rob Boxer [email protected] Attending PhysicianBWH Ann Celi [email protected] BWPO PhysicianEH Cathy Price [email protected] HospitalistBWFH Katie Mae Miller [email protected] Director Case ManagementBWFH Debra Torosian [email protected] Director of Health Information Services (Medical Records)BWFH/ BWH Nina Alice Chalfin [email protected] BWPO PhysicianHHS Bill Doherty [email protected] Chief Medical OfficerHHS Barb Marullo [email protected] Program Manager, Quality Improvement & Patient SafetyMGH Shanda Brown [email protected] Manager, Project Support & AnalyticsMGH Gwen Crevensten [email protected] Academic Hospitalist ServiceMGH Kathleen Finn [email protected] PhysicianMGH Theresa Mills [email protected] Senior Consultant, Center for Quality and SafetyMGH Priya Vader [email protected] Senior Consultant, Performance ImprovementNSMC Ginny Dolan-Horgan [email protected] Director, Performance ImprovementNWH Cheryl Bardetti [email protected] Interim Manager of Quality and Infection ControlNWH Eleanor Paglia [email protected] HospitalistNWH Bert Thurlo-Walsh [email protected] Director of Health Care Quality
The Partners Discharge Transitions Steering Committee
EntityFirst Name Last Name Email Title
PHS Tejal Gandhi [email protected] Partners Chief Quality and Safety OfficerPHS/ BWH Jeff Schnipper [email protected] Hospitalist, Co-chair of Partners Discharge TransitionsPHS/ SNE Terry O'Malley [email protected] Medical Director for Non Acute Care Services, Co-chair
of Partners Discharge Transitions
PHS Alison Holliday [email protected] Project Manager, Patient SafetyPHS Jason Miller [email protected] Program Director, Patient SafetyPHS Vicki Nielsen [email protected] Project Specialist, Patient Safety
Partners Clinical Performance | Quality, Safety & Value Dept13
BWH= Brigham and Women’s Hospital; EH= Emerson Hospital; BWFH= Brigham and Women’s Faulkner Hospital; HHS= Hallmark Health System; MGH= Massachusetts General Hospital; NSMC= North Shore Medical Center; NWH= Newton Wellesley Hospital; PHS= Partners HealthCare System; SNE= Spaulding North End
What do these metrics mean?
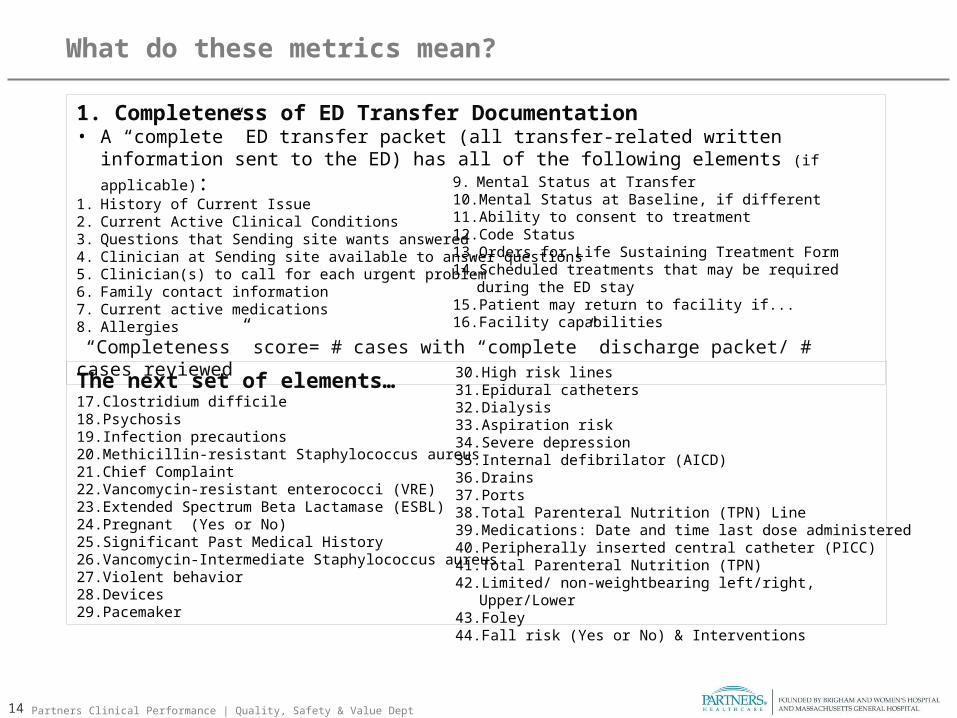
1. Completeness of ED Transfer Documentation• A “complete” ED transfer packet (all transfer-related written information sent to the ED) has all
of the following elements (if applicable):1. History of Current Issue 2. Current Active Clinical Conditions3. Questions that Sending site wants answered4. Clinician at Sending site available to answer questions5. Clinician(s) to call for each urgent problem6. Family contact information7. Current active medications8. Allergies
“Completeness” score= # cases with “complete” discharge packet/ # cases reviewed
The next set of elements…17. Clostridium difficile 18. Psychosis19. Infection precautions20. Methicillin-resistant Staphylococcus aureus 21. Chief Complaint22. Vancomycin-resistant enterococci (VRE)23. Extended Spectrum Beta Lactamase (ESBL)24. Pregnant (Yes or No)25. Significant Past Medical History26. Vancomycin-Intermediate Staphylococcus aureus27. Violent behavior28. Devices29. Pacemaker
30. High risk lines31. Epidural catheters32. Dialysis33. Aspiration risk34. Severe depression35. Internal defibrilator (AICD)36. Drains37. Ports38. Total Parenteral Nutrition (TPN) Line39. Medications: Date and time last dose administered40. Peripherally inserted central catheter (PICC)41. Total Parenteral Nutrition (TPN)42. Limited/ non-weightbearing left/right, Upper/Lower43. Foley44. Fall risk (Yes or No) & Interventions
9. Mental Status at Transfer10. Mental Status at Baseline, if different 11. Ability to consent to treatment 12. Code Status13. Orders for Life Sustaining Treatment Form14. Scheduled treatments that may be required during the ED stay15. Patient may return to facility if...16. Facility capabilities
14 Partners Clinical Performance | Quality, Safety & Value Dept
What do these metrics mean? (cont.)
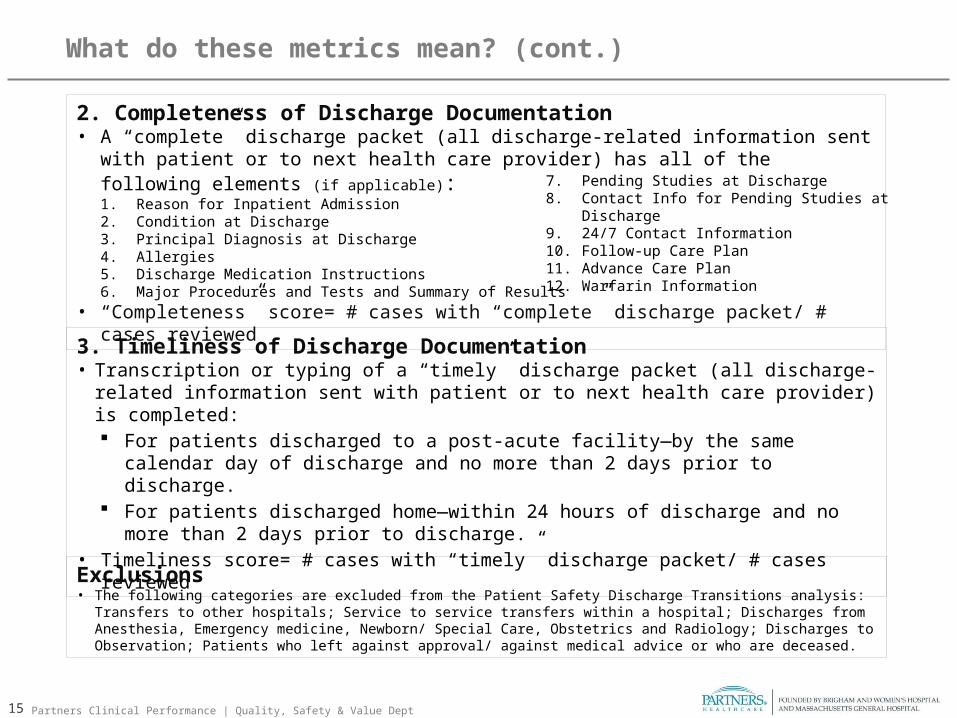
2. Completeness of Discharge Documentation• A “complete” discharge packet (all discharge-related information sent with patient or to next
health care provider) has all of the following elements (if applicable):1. Reason for Inpatient Admission2. Condition at Discharge3. Principal Diagnosis at Discharge4. Allergies5. Discharge Medication Instructions6. Major Procedures and Tests and Summary of Results
• “Completeness” score= # cases with “complete” discharge packet/ # cases reviewed
3. Timeliness of Discharge Documentation• Transcription or typing of a “timely” discharge packet (all discharge-related information sent
with patient or to next health care provider) is completed: For patients discharged to a post-acute facility—by the same calendar day of discharge
and no more than 2 days prior to discharge. For patients discharged home—within 24 hours of discharge and no more than 2 days
prior to discharge.• Timeliness score= # cases with “timely” discharge packet/ # cases reviewed
Exclusions• The following categories are excluded from the Patient Safety Discharge Transitions analysis: Transfers to other hospitals;
Service to service transfers within a hospital; Discharges from Anesthesia, Emergency medicine, Newborn/ Special Care, Obstetrics and Radiology; Discharges to Observation; Patients who left against approval/ against medical advice or who are deceased.
7. Pending Studies at Discharge8. Contact Info for Pending Studies at Discharge9. 24/7 Contact Information10. Follow-up Care Plan11. Advance Care Plan12. Warfarin Information
Partners Clinical Performance | Quality, Safety & Value Dept15
0%
20%
40%
60%
80%
100%
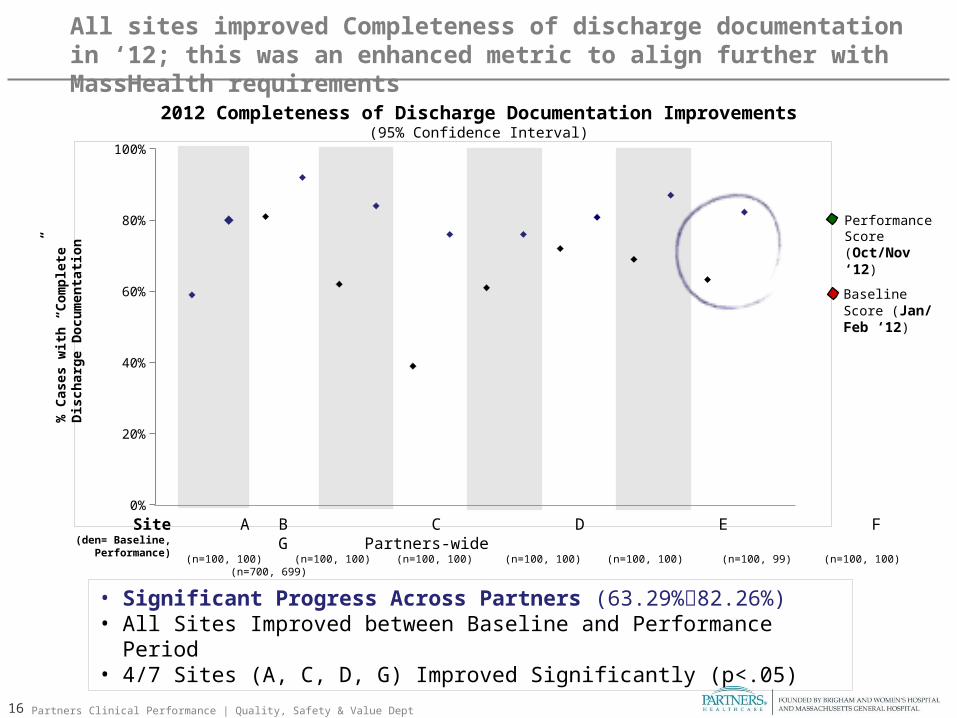
A B C D E F G Partners-wide (n=100, 100) (n=100, 100) (n=100, 100) (n=100, 100) (n=100, 100) (n=100, 99) (n=100, 100) (n=700, 699)
• Significant Progress Across Partners (63.29%82.26%)• All Sites Improved between Baseline and Performance Period• 4/7 Sites (A, C, D, G) Improved Significantly (p<.05)
Baseline Score (Jan/ Feb ‘12)
Performance Score (Oct/Nov ‘12)
% C
ases
wit
h “
Co
mp
lete
” D
isch
arg
e D
ocu
men
tati
on
Site(den= Baseline,
Performance)
2012 Completeness of Discharge Documentation Improvements(95% Confidence Interval)
All sites improved Completeness of discharge documentation in ‘12; this was an enhanced metric to align further with MassHealth requirements
16 Partners Clinical Performance | Quality, Safety & Value Dept
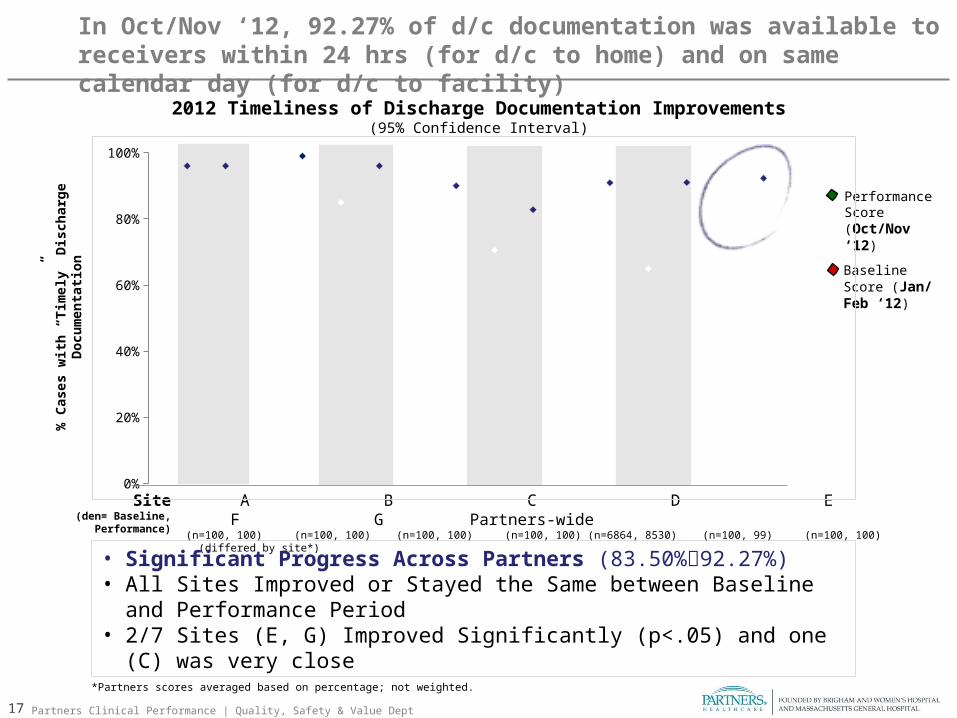
A B C D E F G Partners-wide (n=100, 100) (n=100, 100) (n=100, 100) (n=100, 100) (n=6864, 8530) (n=100, 99) (n=100, 100) (differed by site*)
• Significant Progress Across Partners (83.50%92.27%)• All Sites Improved or Stayed the Same between Baseline and Performance
Period• 2/7 Sites (E, G) Improved Significantly (p<.05) and one (C) was very close
Baseline Score (Jan/ Feb ‘12)
Performance Score (Oct/Nov ‘12)
% C
ases
wit
h “
Tim
ely”
Dis
char
ge
Do
cum
enta
tio
n
Site(den= Baseline,
Performance)
*Partners scores averaged based on percentage; not weighted.
0%
20%
40%
60%
80%
100%
2012 Timeliness of Discharge Documentation Improvements(95% Confidence Interval)
In Oct/Nov ‘12, 92.27% of d/c documentation was available to receivers within 24 hrs (for d/c to home) and on same calendar day (for d/c to facility)
Partners Clinical Performance | Quality, Safety & Value Dept17