Embed Size (px)
Citation preview
Parts Inventory Reconciliation Part II - The Advanced Course An in-depth and practical look at specific steps to
take to reconcile your General Ledger to your Actual Parts Inventory figures
With
Rob Campbell, Analyst Mironov, Sloan & Parziale, LLC
Moderated By
Mike Bowers, Executive Editor DealersEdge
Thursday, April 7, 2011 1 – 2:30 pm ET
Mironov, Sloan & Parziale, LLC ‐ 1 ‐ 732‐572‐3900
Dealership Management Education
DealersEdge Webinar Series
Parts Inventory Reconciliation Part II – The Advanced Course
Rob Campbell, Analyst Mironov, Sloan & Parziale, LLC 2025 Lincoln Highway, Suite 330 Edison, NJ 08816
[email protected] p (732) 572‐3900
Mironov, Sloan & Parziale, LLC ‐ 2 ‐ 732‐572‐3900
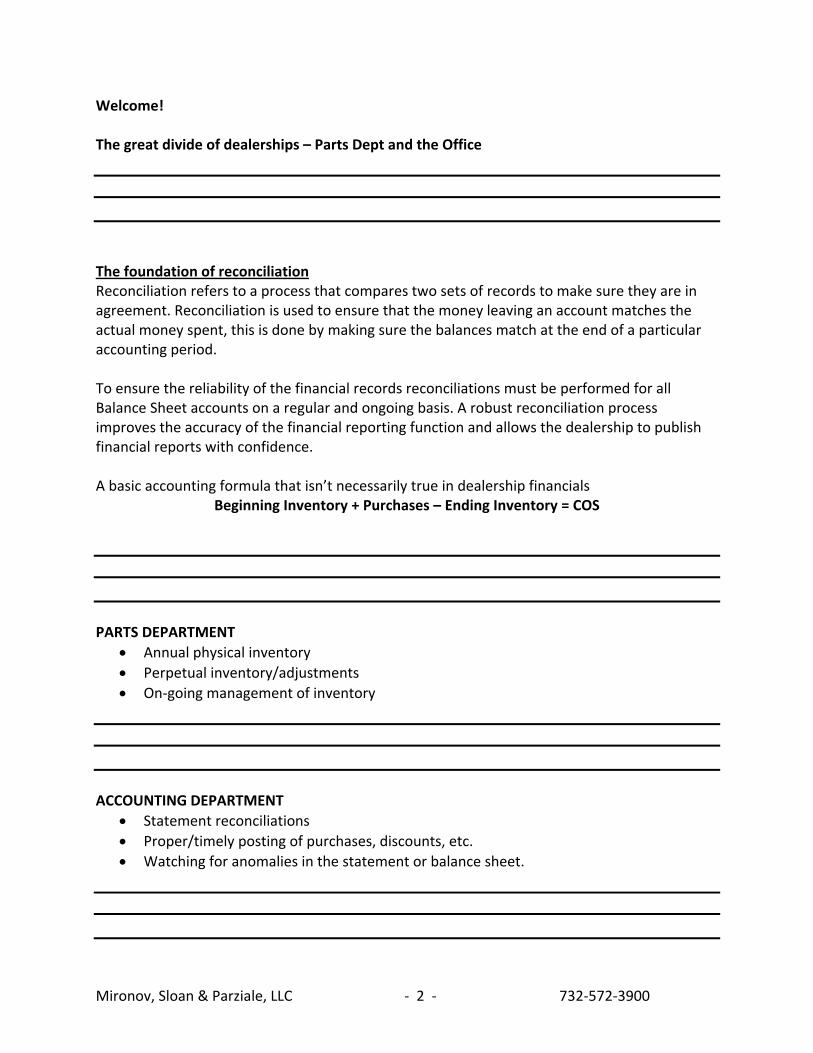
Welcome! The great divide of dealerships – Parts Dept and the Office The foundation of reconciliation Reconciliation refers to a process that compares two sets of records to make sure they are in agreement. Reconciliation is used to ensure that the money leaving an account matches the actual money spent, this is done by making sure the balances match at the end of a particular accounting period. To ensure the reliability of the financial records reconciliations must be performed for all Balance Sheet accounts on a regular and ongoing basis. A robust reconciliation process improves the accuracy of the financial reporting function and allows the dealership to publish financial reports with confidence. A basic accounting formula that isn’t necessarily true in dealership financials
Beginning Inventory + Purchases – Ending Inventory = COS PARTS DEPARTMENT
• Annual physical inventory • Perpetual inventory/adjustments • On‐going management of inventory
ACCOUNTING DEPARTMENT
• Statement reconciliations • Proper/timely posting of purchases, discounts, etc. • Watching for anomalies in the statement or balance sheet.
Mironov, Sloan & Parziale, LLC ‐ 3 ‐ 732‐572‐3900
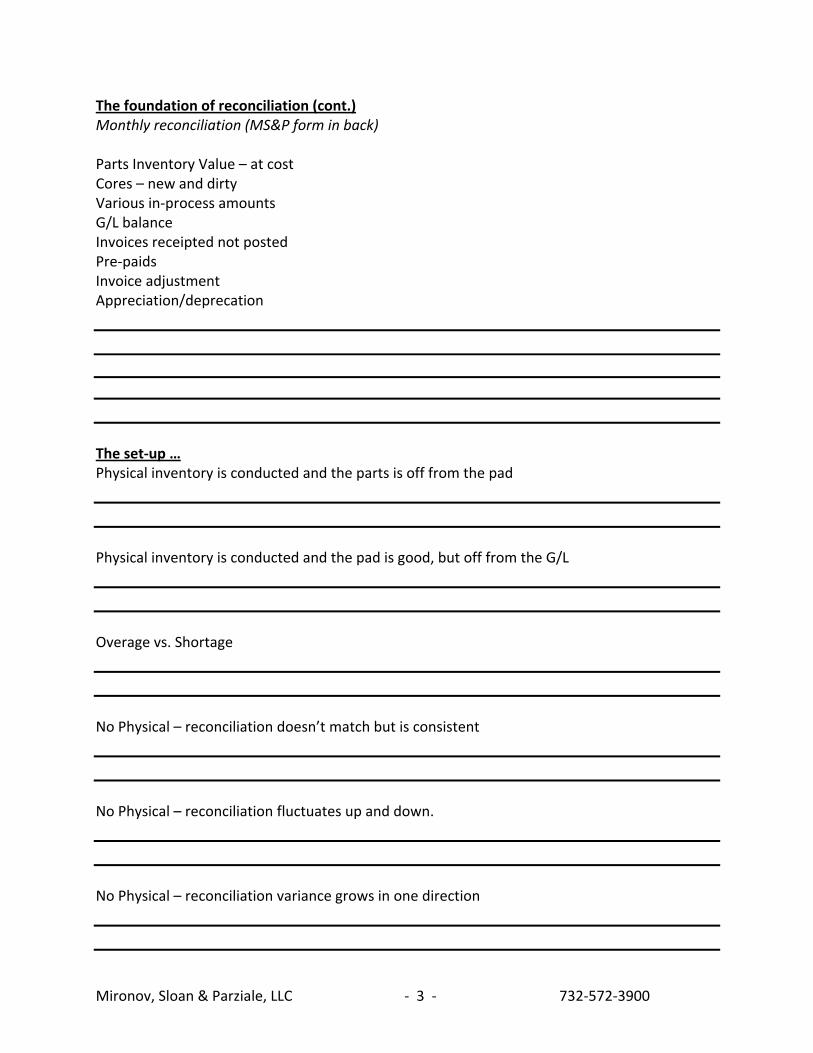
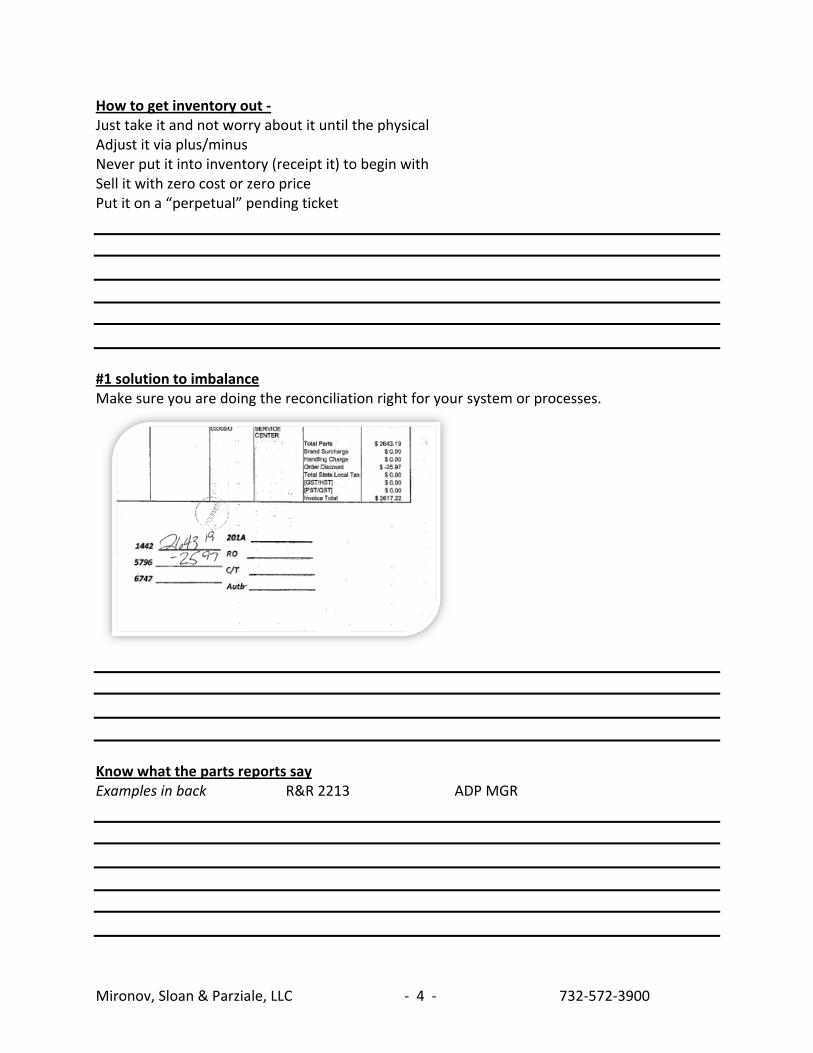
The foundation of reconciliation (cont.) Monthly reconciliation (MS&P form in back) Parts Inventory Value – at cost Cores – new and dirty Various in‐process amounts G/L balance Invoices receipted not posted Pre‐paids Invoice adjustment Appreciation/deprecation The set‐up … Physical inventory is conducted and the parts is off from the pad Physical inventory is conducted and the pad is good, but off from the G/L Overage vs. Shortage No Physical – reconciliation doesn’t match but is consistent No Physical – reconciliation fluctuates up and down. No Physical – reconciliation variance grows in one direction
Mironov, Sloan & Parziale, LLC ‐ 4 ‐ 732‐572‐3900
How to get inventory out ‐ Just take it and not worry about it until the physical Adjust it via plus/minus Never put it into inventory (receipt it) to begin with Sell it with zero cost or zero price Put it on a “perpetual” pending ticket #1 solution to imbalance Make sure you are doing the reconciliation right for your system or processes.
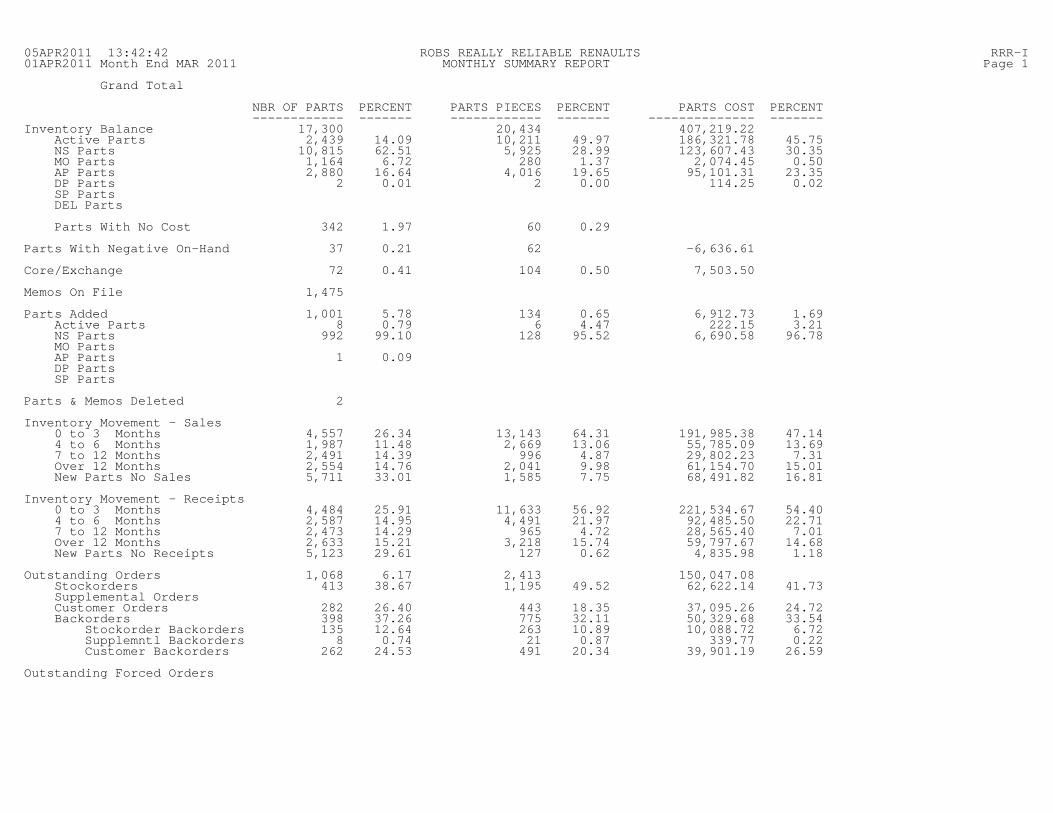
Know what the parts reports say Examples in back R&R 2213 ADP MGR
Mironov, Sloan & Parziale, LLC ‐ 5 ‐ 732‐572‐3900
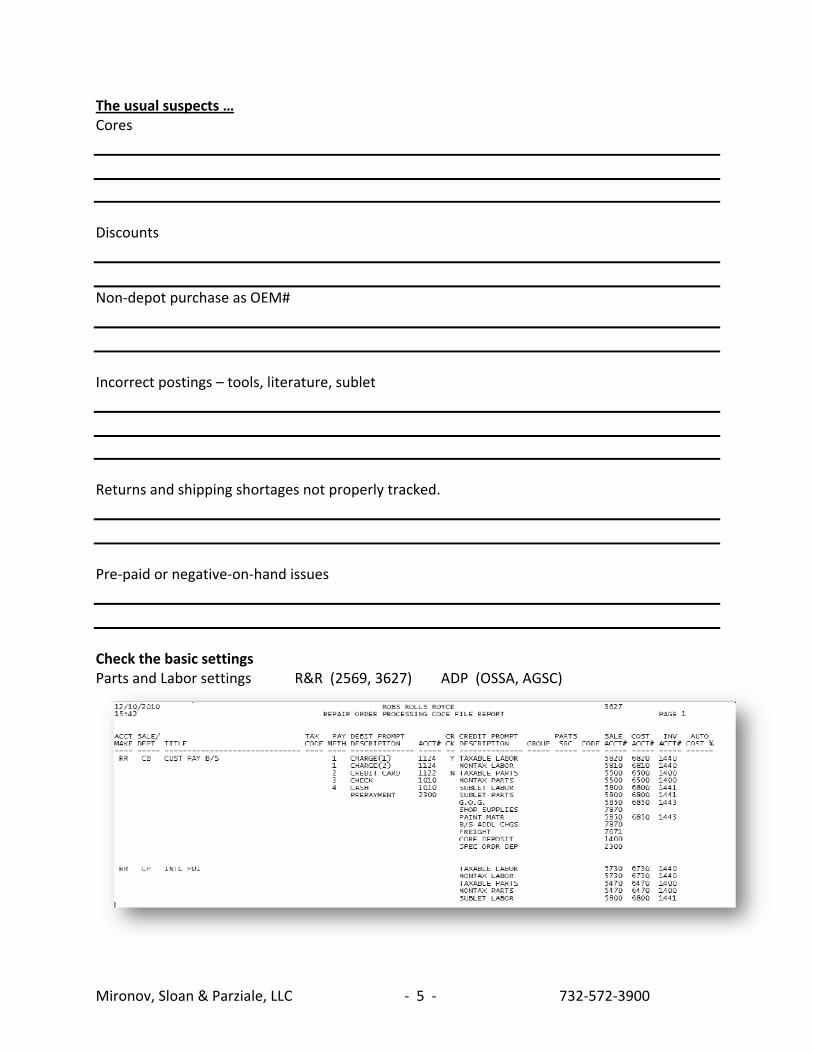
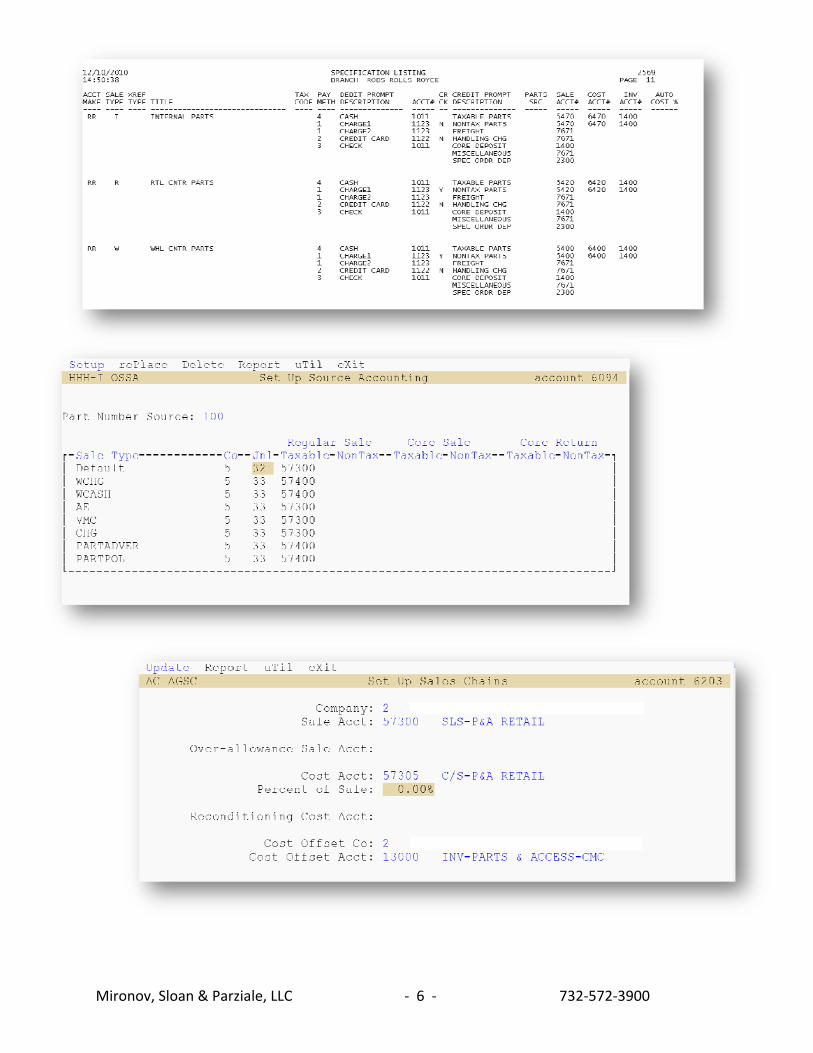
The usual suspects … Cores Discounts Non‐depot purchase as OEM# Incorrect postings – tools, literature, sublet Returns and shipping shortages not properly tracked. Pre‐paid or negative‐on‐hand issues Check the basic settings Parts and Labor settings R&R (2569, 3627) ADP (OSSA, AGSC)
Mironov, Sloan & Parziale, LLC ‐ 6 ‐ 732‐572‐3900
Mironov, Sloan & Parziale, LLC ‐ 7 ‐ 732‐572‐3900
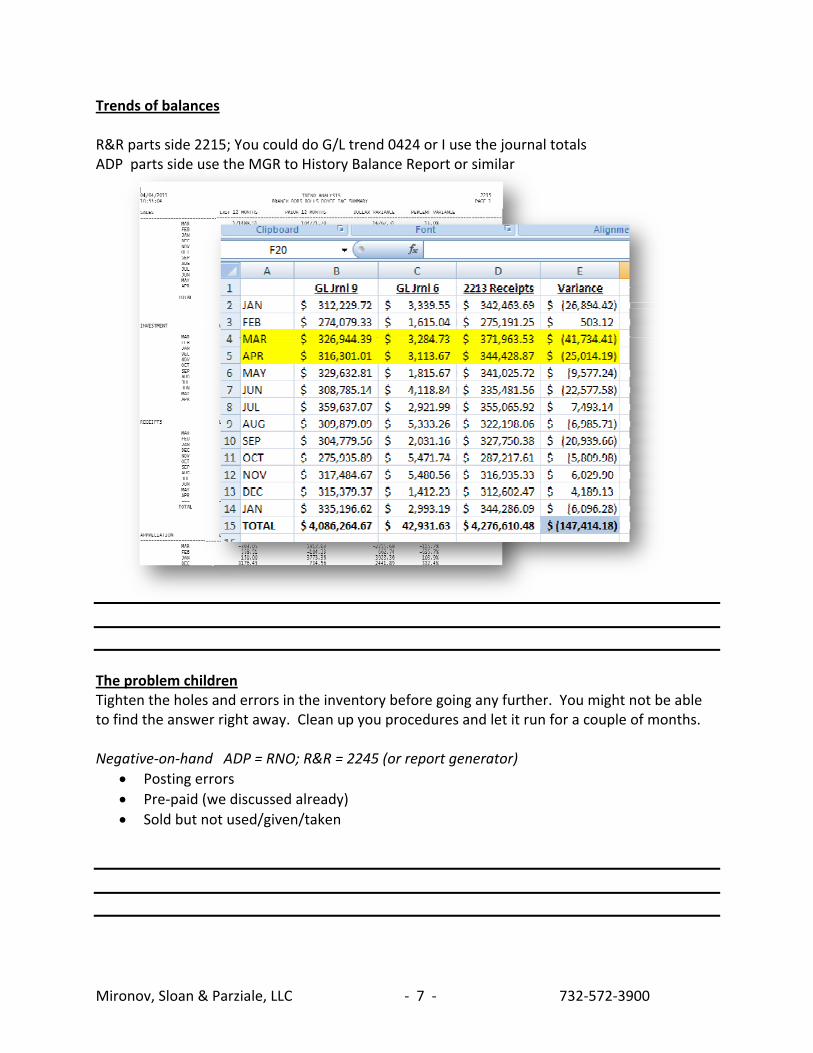
Trends of balances R&R parts side 2215; You could do G/L trend 0424 or I use the journal totals ADP parts side use the MGR to History Balance Report or similar The problem children Tighten the holes and errors in the inventory before going any further. You might not be able to find the answer right away. Clean up you procedures and let it run for a couple of months. Negative‐on‐hand ADP = RNO; R&R = 2245 (or report generator)
• Posting errors • Pre‐paid (we discussed already) • Sold but not used/given/taken
Mironov, Sloan & Parziale, LLC ‐ 8 ‐ 732‐572‐3900
Exceptions and Overrides – ADP – RXP, REX, ROV R&R – 2542, 3619
Parts with no cost ‐ ADP – RNC R&R – 2255
Transaction‐to‐transaction matching This is going to be the most laborious part and it is best if avoided. If there is not a single control between parts and accounting Receipts – Purchase Journals – Parts and Cash are usually it but check all the journals for potential postings into inventory. Depending on system it might be easier to start at the account and see journal activity and drill‐down; or it might be better to scan the journal totals. ADP most have DSDA and archive the Journals. They aren’t the best but usable. R&R if you have some kind of electronic archive great. Else you are doing with paper, and in the future putting “on‐hold” and using Download Report Wizard. (Side bar: why is anyone printing paper journals as main retention) Receipt reports in parts. ADP = RRH ; R&R = 2064
Mironov, Sloan & Parziale, LLC ‐ 9 ‐ 732‐572‐3900
Sales – Sales Journals – Parts Sales and Service Sales are usually it but check all the journals for potential sales transactions. Depending on system it might be easier to start at the account and see journal activity and drill‐down; or it might be better to scan the journal totals. Sales reports in parts. I generally write my own report to simply show part sales by RO or Counter Ticket. That is the easiest to compare. If you want to look at transactions ADP = RSA ; R&R = 2214
FINAL QUESTIONS OR CONCERNS Thank you for listening today!
Biographical_Info.doc
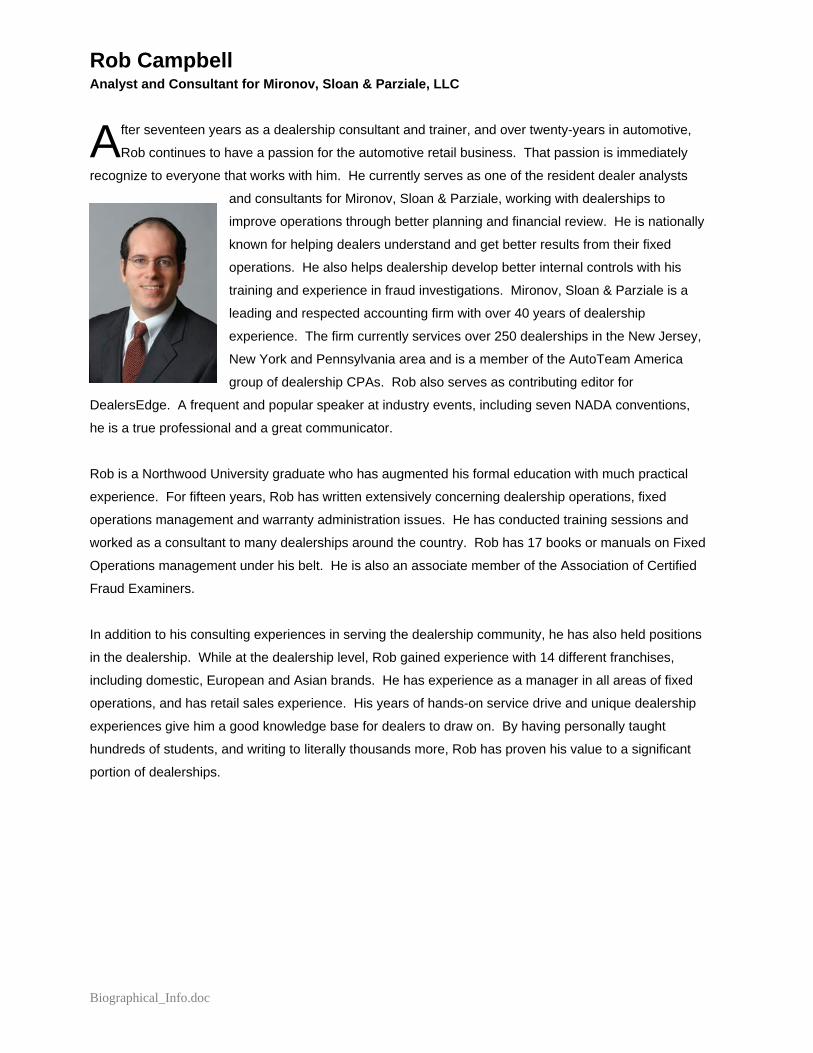
Rob Campbell Analyst and Consultant for Mironov, Sloan & Parziale, LLC
fter seventeen years as a dealership consultant and trainer, and over twenty-years in automotive,
Rob continues to have a passion for the automotive retail business. That passion is immediately
recognize to everyone that works with him. He currently serves as one of the resident dealer analysts
and consultants for Mironov, Sloan & Parziale, working with dealerships to
improve operations through better planning and financial review. He is nationally
known for helping dealers understand and get better results from their fixed
operations. He also helps dealership develop better internal controls with his
training and experience in fraud investigations. Mironov, Sloan & Parziale is a
leading and respected accounting firm with over 40 years of dealership
experience. The firm currently services over 250 dealerships in the New Jersey,
New York and Pennsylvania area and is a member of the AutoTeam America
group of dealership CPAs. Rob also serves as contributing editor for
DealersEdge. A frequent and popular speaker at industry events, including seven NADA conventions,
he is a true professional and a great communicator.
Rob is a Northwood University graduate who has augmented his formal education with much practical
experience. For fifteen years, Rob has written extensively concerning dealership operations, fixed
operations management and warranty administration issues. He has conducted training sessions and
worked as a consultant to many dealerships around the country. Rob has 17 books or manuals on Fixed
Operations management under his belt. He is also an associate member of the Association of Certified
Fraud Examiners.
In addition to his consulting experiences in serving the dealership community, he has also held positions
in the dealership. While at the dealership level, Rob gained experience with 14 different franchises,
including domestic, European and Asian brands. He has experience as a manager in all areas of fixed
operations, and has retail sales experience. His years of hands-on service drive and unique dealership
experiences give him a good knowledge base for dealers to draw on. By having personally taught
hundreds of students, and writing to literally thousands more, Rob has proven his value to a significant
portion of dealerships.
A
05APR2011 13:42:42 ROBS REALLY RELIABLE RENAULTS RRR-I01APR2011 Month End MAR 2011 MONTHLY SUMMARY REPORT Page 1
Grand Total
NBR OF PARTS PERCENT PARTS PIECES PERCENT PARTS COST PERCENT ------------ ------- ------------ ------- -------------- -------Inventory Balance 17,300 20,434 407,219.22 Active Parts 2,439 14.09 10,211 49.97 186,321.78 45.75 NS Parts 10,815 62.51 5,925 28.99 123,607.43 30.35 MO Parts 1,164 6.72 280 1.37 2,074.45 0.50 AP Parts 2,880 16.64 4,016 19.65 95,101.31 23.35 DP Parts 2 0.01 2 0.00 114.25 0.02 SP Parts DEL Parts
Parts With No Cost 342 1.97 60 0.29
Parts With Negative On-Hand 37 0.21 62 -6,636.61
Core/Exchange 72 0.41 104 0.50 7,503.50
Memos On File 1,475
Parts Added 1,001 5.78 134 0.65 6,912.73 1.69 Active Parts 8 0.79 6 4.47 222.15 3.21 NS Parts 992 99.10 128 95.52 6,690.58 96.78 MO Parts AP Parts 1 0.09 DP Parts SP Parts
Parts & Memos Deleted 2
Inventory Movement - Sales 0 to 3 Months 4,557 26.34 13,143 64.31 191,985.38 47.14 4 to 6 Months 1,987 11.48 2,669 13.06 55,785.09 13.69 7 to 12 Months 2,491 14.39 996 4.87 29,802.23 7.31 Over 12 Months 2,554 14.76 2,041 9.98 61,154.70 15.01 New Parts No Sales 5,711 33.01 1,585 7.75 68,491.82 16.81
Inventory Movement - Receipts 0 to 3 Months 4,484 25.91 11,633 56.92 221,534.67 54.40 4 to 6 Months 2,587 14.95 4,491 21.97 92,485.50 22.71 7 to 12 Months 2,473 14.29 965 4.72 28,565.40 7.01 Over 12 Months 2,633 15.21 3,218 15.74 59,797.67 14.68 New Parts No Receipts 5,123 29.61 127 0.62 4,835.98 1.18
Outstanding Orders 1,068 6.17 2,413 150,047.08 Stockorders 413 38.67 1,195 49.52 62,622.14 41.73 Supplemental Orders Customer Orders 282 26.40 443 18.35 37,095.26 24.72 Backorders 398 37.26 775 32.11 50,329.68 33.54 Stockorder Backorders 135 12.64 263 10.89 10,088.72 6.72 Supplemntl Backorders 8 0.74 21 0.87 339.77 0.22 Customer Backorders 262 24.53 491 20.34 39,901.19 26.59
Outstanding Forced Orders
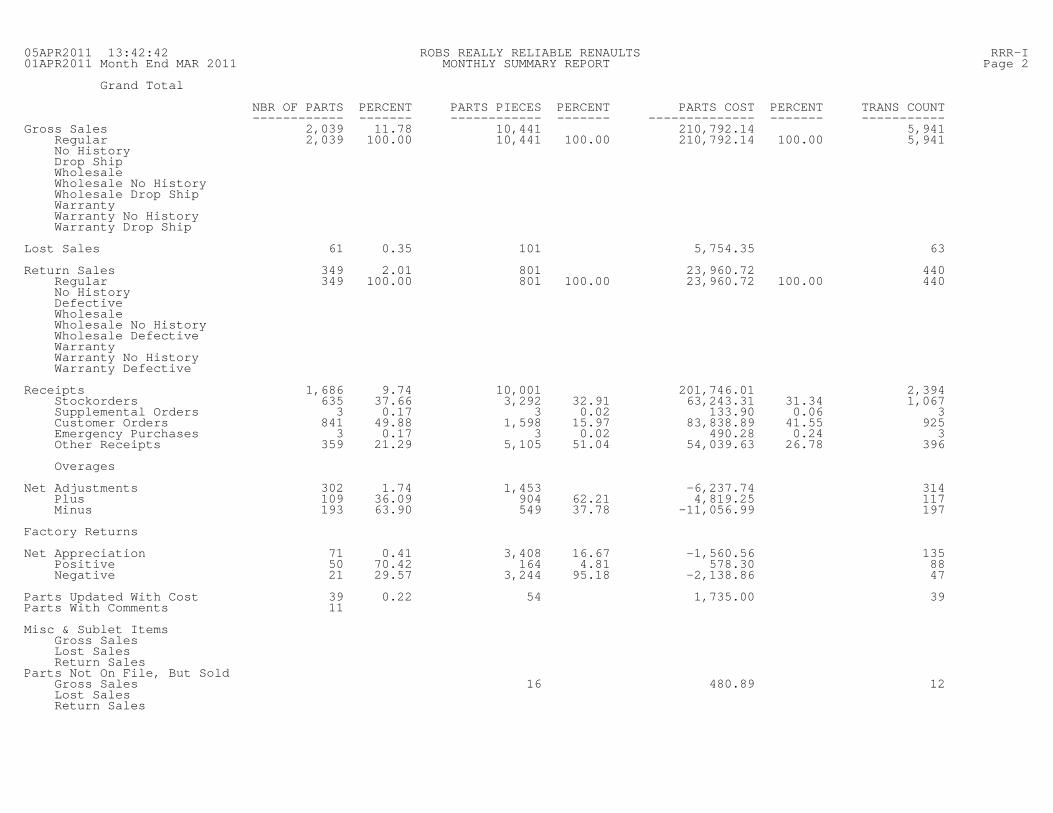
05APR2011 13:42:42 ROBS REALLY RELIABLE RENAULTS RRR-I01APR2011 Month End MAR 2011 MONTHLY SUMMARY REPORT Page 2
Grand Total
NBR OF PARTS PERCENT PARTS PIECES PERCENT PARTS COST PERCENT TRANS COUNT ------------ ------- ------------ ------- -------------- ------- -----------Gross Sales 2,039 11.78 10,441 210,792.14 5,941 Regular 2,039 100.00 10,441 100.00 210,792.14 100.00 5,941 No History Drop Ship Wholesale Wholesale No History Wholesale Drop Ship Warranty Warranty No History Warranty Drop Ship
Lost Sales 61 0.35 101 5,754.35 63
Return Sales 349 2.01 801 23,960.72 440 Regular 349 100.00 801 100.00 23,960.72 100.00 440 No History Defective Wholesale Wholesale No History Wholesale Defective Warranty Warranty No History Warranty Defective
Receipts 1,686 9.74 10,001 201,746.01 2,394 Stockorders 635 37.66 3,292 32.91 63,243.31 31.34 1,067 Supplemental Orders 3 0.17 3 0.02 133.90 0.06 3 Customer Orders 841 49.88 1,598 15.97 83,838.89 41.55 925 Emergency Purchases 3 0.17 3 0.02 490.28 0.24 3 Other Receipts 359 21.29 5,105 51.04 54,039.63 26.78 396
Overages
Net Adjustments 302 1.74 1,453 -6,237.74 314 Plus 109 36.09 904 62.21 4,819.25 117 Minus 193 63.90 549 37.78 -11,056.99 197
Factory Returns
Net Appreciation 71 0.41 3,408 16.67 -1,560.56 135 Positive 50 70.42 164 4.81 578.30 88 Negative 21 29.57 3,244 95.18 -2,138.86 47
Parts Updated With Cost 39 0.22 54 1,735.00 39Parts With Comments 11
Misc & Sublet Items Gross Sales Lost Sales Return Sales Parts Not On File, But Sold Gross Sales 16 480.89 12 Lost Sales Return Sales
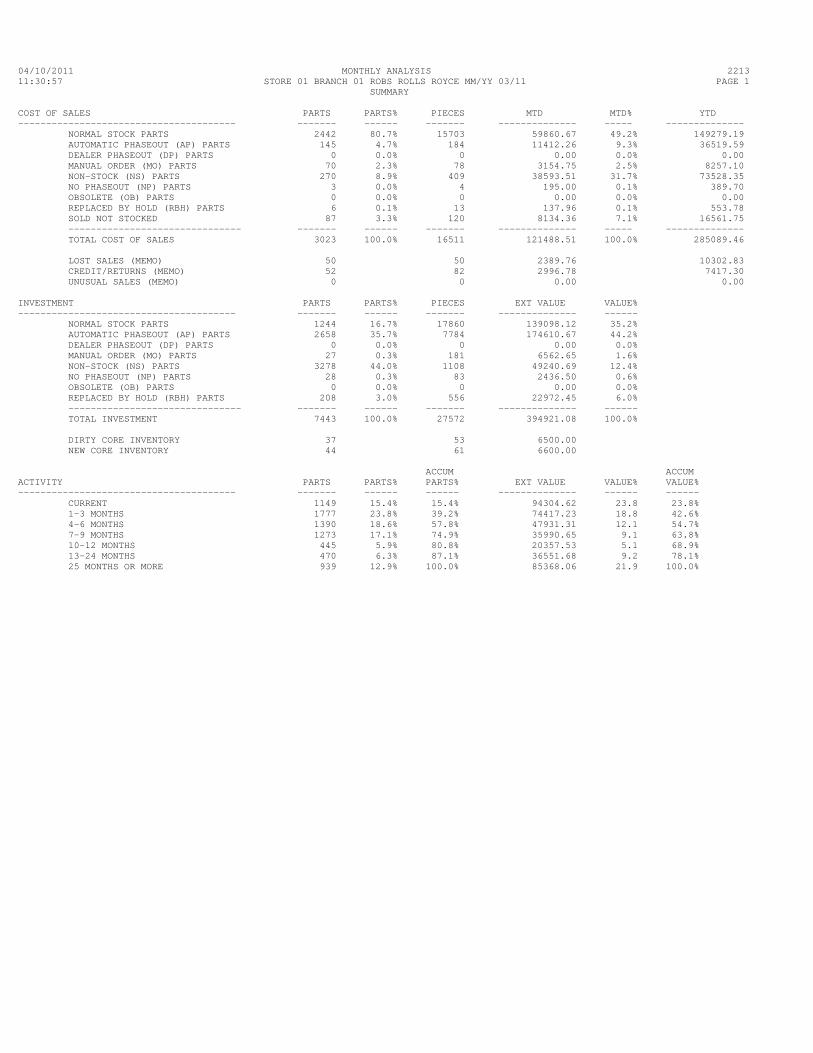
04/10/2011 MONTHLY ANALYSIS 2213 11:30:57 STORE 01 BRANCH 01 ROBS ROLLS ROYCE MM/YY 03/11 PAGE 1 SUMMARY COST OF SALES PARTS PARTS% PIECES MTD MTD% YTD --------------------------------------- ------- ------ ------- -------------- ----- -------------- NORMAL STOCK PARTS 2442 80.7% 15703 59860.67 49.2% 149279.19 AUTOMATIC PHASEOUT (AP) PARTS 145 4.7% 184 11412.26 9.3% 36519.59 DEALER PHASEOUT (DP) PARTS 0 0.0% 0 0.00 0.0% 0.00 MANUAL ORDER (MO) PARTS 70 2.3% 78 3154.75 2.5% 8257.10 NON-STOCK (NS) PARTS 270 8.9% 409 38593.51 31.7% 73528.35 NO PHASEOUT (NP) PARTS 3 0.0% 4 195.00 0.1% 389.70 OBSOLETE (OB) PARTS 0 0.0% 0 0.00 0.0% 0.00 REPLACED BY HOLD (RBH) PARTS 6 0.1% 13 137.96 0.1% 553.78 SOLD NOT STOCKED 87 3.3% 120 8134.36 7.1% 16561.75 ------------------------------- ------- ------ ------- -------------- ----- -------------- TOTAL COST OF SALES 3023 100.0% 16511 121488.51 100.0% 285089.46 LOST SALES (MEMO) 50 50 2389.76 10302.83 CREDIT/RETURNS (MEMO) 52 82 2996.78 7417.30 UNUSUAL SALES (MEMO) 0 0 0.00 0.00 INVESTMENT PARTS PARTS% PIECES EXT VALUE VALUE% --------------------------------------- ------- ------ ------- -------------- ------ NORMAL STOCK PARTS 1244 16.7% 17860 139098.12 35.2% AUTOMATIC PHASEOUT (AP) PARTS 2658 35.7% 7784 174610.67 44.2% DEALER PHASEOUT (DP) PARTS 0 0.0% 0 0.00 0.0% MANUAL ORDER (MO) PARTS 27 0.3% 181 6562.65 1.6% NON-STOCK (NS) PARTS 3278 44.0% 1108 49240.69 12.4% NO PHASEOUT (NP) PARTS 28 0.3% 83 2436.50 0.6% OBSOLETE (OB) PARTS 0 0.0% 0 0.00 0.0% REPLACED BY HOLD (RBH) PARTS 208 3.0% 556 22972.45 6.0% ------------------------------- ------- ------ ------- -------------- ------ TOTAL INVESTMENT 7443 100.0% 27572 394921.08 100.0% DIRTY CORE INVENTORY 37 53 6500.00 NEW CORE INVENTORY 44 61 6600.00 ACCUM ACCUM ACTIVITY PARTS PARTS% PARTS% EXT VALUE VALUE% VALUE% --------------------------------------- ------- ------ ------ -------------- ------ ------ CURRENT 1149 15.4% 15.4% 94304.62 23.8 23.8% 1-3 MONTHS 1777 23.8% 39.2% 74417.23 18.8 42.6% 4-6 MONTHS 1390 18.6% 57.8% 47931.31 12.1 54.7% 7-9 MONTHS 1273 17.1% 74.9% 35990.65 9.1 63.8% 10-12 MONTHS 445 5.9% 80.8% 20357.53 5.1 68.9% 13-24 MONTHS 470 6.3% 87.1% 36551.68 9.2 78.1% 25 MONTHS OR MORE 939 12.9% 100.0% 85368.06 21.9 100.0%
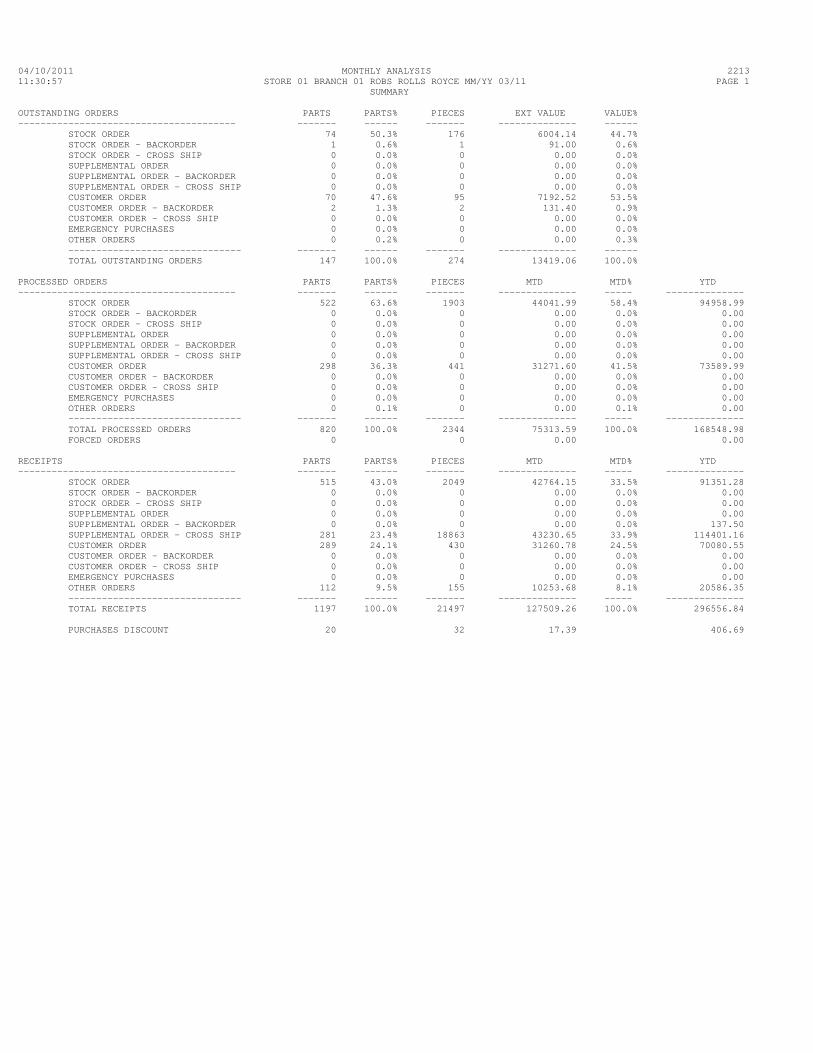
04/10/2011 MONTHLY ANALYSIS 2213 11:30:57 STORE 01 BRANCH 01 ROBS ROLLS ROYCE MM/YY 03/11 PAGE 1 SUMMARY OUTSTANDING ORDERS PARTS PARTS% PIECES EXT VALUE VALUE% --------------------------------------- ------- ------ ------- -------------- ------ STOCK ORDER 74 50.3% 176 6004.14 44.7% STOCK ORDER - BACKORDER 1 0.6% 1 91.00 0.6% STOCK ORDER - CROSS SHIP 0 0.0% 0 0.00 0.0% SUPPLEMENTAL ORDER 0 0.0% 0 0.00 0.0% SUPPLEMENTAL ORDER - BACKORDER 0 0.0% 0 0.00 0.0% SUPPLEMENTAL ORDER - CROSS SHIP 0 0.0% 0 0.00 0.0% CUSTOMER ORDER 70 47.6% 95 7192.52 53.5% CUSTOMER ORDER - BACKORDER 2 1.3% 2 131.40 0.9% CUSTOMER ORDER - CROSS SHIP 0 0.0% 0 0.00 0.0% EMERGENCY PURCHASES 0 0.0% 0 0.00 0.0% OTHER ORDERS 0 0.2% 0 0.00 0.3% ------------------------------- ------- ------ ------- -------------- ------ TOTAL OUTSTANDING ORDERS 147 100.0% 274 13419.06 100.0% PROCESSED ORDERS PARTS PARTS% PIECES MTD MTD% YTD --------------------------------------- ------- ------ ------- -------------- ----- -------------- STOCK ORDER 522 63.6% 1903 44041.99 58.4% 94958.99 STOCK ORDER - BACKORDER 0 0.0% 0 0.00 0.0% 0.00 STOCK ORDER - CROSS SHIP 0 0.0% 0 0.00 0.0% 0.00 SUPPLEMENTAL ORDER 0 0.0% 0 0.00 0.0% 0.00 SUPPLEMENTAL ORDER - BACKORDER 0 0.0% 0 0.00 0.0% 0.00 SUPPLEMENTAL ORDER - CROSS SHIP 0 0.0% 0 0.00 0.0% 0.00 CUSTOMER ORDER 298 36.3% 441 31271.60 41.5% 73589.99 CUSTOMER ORDER - BACKORDER 0 0.0% 0 0.00 0.0% 0.00 CUSTOMER ORDER - CROSS SHIP 0 0.0% 0 0.00 0.0% 0.00 EMERGENCY PURCHASES 0 0.0% 0 0.00 0.0% 0.00 OTHER ORDERS 0 0.1% 0 0.00 0.1% 0.00 ------------------------------- ------- ------ ------- -------------- ----- -------------- TOTAL PROCESSED ORDERS 820 100.0% 2344 75313.59 100.0% 168548.98 FORCED ORDERS 0 0 0.00 0.00 RECEIPTS PARTS PARTS% PIECES MTD MTD% YTD --------------------------------------- ------- ------ ------- -------------- ----- -------------- STOCK ORDER 515 43.0% 2049 42764.15 33.5% 91351.28 STOCK ORDER - BACKORDER 0 0.0% 0 0.00 0.0% 0.00 STOCK ORDER - CROSS SHIP 0 0.0% 0 0.00 0.0% 0.00 SUPPLEMENTAL ORDER 0 0.0% 0 0.00 0.0% 0.00 SUPPLEMENTAL ORDER - BACKORDER 0 0.0% 0 0.00 0.0% 137.50 SUPPLEMENTAL ORDER - CROSS SHIP 281 23.4% 18863 43230.65 33.9% 114401.16 CUSTOMER ORDER 289 24.1% 430 31260.78 24.5% 70080.55 CUSTOMER ORDER - BACKORDER 0 0.0% 0 0.00 0.0% 0.00 CUSTOMER ORDER - CROSS SHIP 0 0.0% 0 0.00 0.0% 0.00 EMERGENCY PURCHASES 0 0.0% 0 0.00 0.0% 0.00 OTHER ORDERS 112 9.5% 155 10253.68 8.1% 20586.35 ------------------------------- ------- ------ ------- -------------- ----- -------------- TOTAL RECEIPTS 1197 100.0% 21497 127509.26 100.0% 296556.84 PURCHASES DISCOUNT 20 32 17.39 406.69
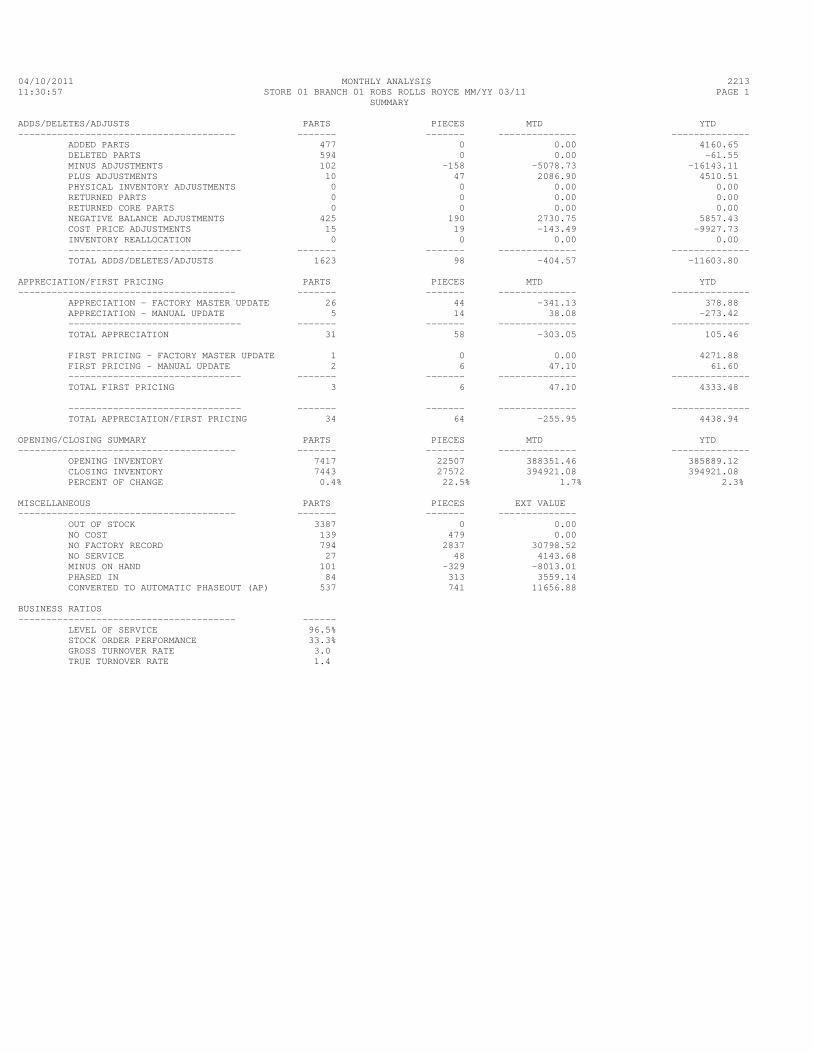
04/10/2011 MONTHLY ANALYSIS 2213 11:30:57 STORE 01 BRANCH 01 ROBS ROLLS ROYCE MM/YY 03/11 PAGE 1 SUMMARY ADDS/DELETES/ADJUSTS PARTS PIECES MTD YTD --------------------------------------- ------- ------- -------------- -------------- ADDED PARTS 477 0 0.00 4160.65 DELETED PARTS 594 0 0.00 -61.55 MINUS ADJUSTMENTS 102 -158 -5078.73 -16143.11 PLUS ADJUSTMENTS 10 47 2086.90 4510.51 PHYSICAL INVENTORY ADJUSTMENTS 0 0 0.00 0.00 RETURNED PARTS 0 0 0.00 0.00 RETURNED CORE PARTS 0 0 0.00 0.00 NEGATIVE BALANCE ADJUSTMENTS 425 190 2730.75 5857.43 COST PRICE ADJUSTMENTS 15 19 -143.49 -9927.73 INVENTORY REALLOCATION 0 0 0.00 0.00 ------------------------------- ------- ------- -------------- -------------- TOTAL ADDS/DELETES/ADJUSTS 1623 98 -404.57 -11603.80 APPRECIATION/FIRST PRICING PARTS PIECES MTD YTD --------------------------------------- ------- ------- -------------- -------------- APPRECIATION - FACTORY MASTER UPDATE 26 44 -341.13 378.88 APPRECIATION - MANUAL UPDATE 5 14 38.08 -273.42 ------------------------------- ------- ------- -------------- -------------- TOTAL APPRECIATION 31 58 -303.05 105.46 FIRST PRICING - FACTORY MASTER UPDATE 1 0 0.00 4271.88 FIRST PRICING - MANUAL UPDATE 2 6 47.10 61.60 ------------------------------- ------- ------- -------------- -------------- TOTAL FIRST PRICING 3 6 47.10 4333.48 ------------------------------- ------- ------- -------------- -------------- TOTAL APPRECIATION/FIRST PRICING 34 64 -255.95 4438.94 OPENING/CLOSING SUMMARY PARTS PIECES MTD YTD --------------------------------------- ------- ------- -------------- -------------- OPENING INVENTORY 7417 22507 388351.46 385889.12 CLOSING INVENTORY 7443 27572 394921.08 394921.08 PERCENT OF CHANGE 0.4% 22.5% 1.7% 2.3% MISCELLANEOUS PARTS PIECES EXT VALUE --------------------------------------- ------- ------- -------------- OUT OF STOCK 3387 0 0.00 NO COST 139 479 0.00 NO FACTORY RECORD 794 2837 30798.52 NO SERVICE 27 48 4143.68 MINUS ON HAND 101 -329 -8013.01 PHASED IN 84 313 3559.14 CONVERTED TO AUTOMATIC PHASEOUT (AP) 537 741 11656.88 BUSINESS RATIOS --------------------------------------- ------ LEVEL OF SERVICE 96.5% STOCK ORDER PERFORMANCE 33.3% GROSS TURNOVER RATE 3.0 TRUE TURNOVER RATE 1.4
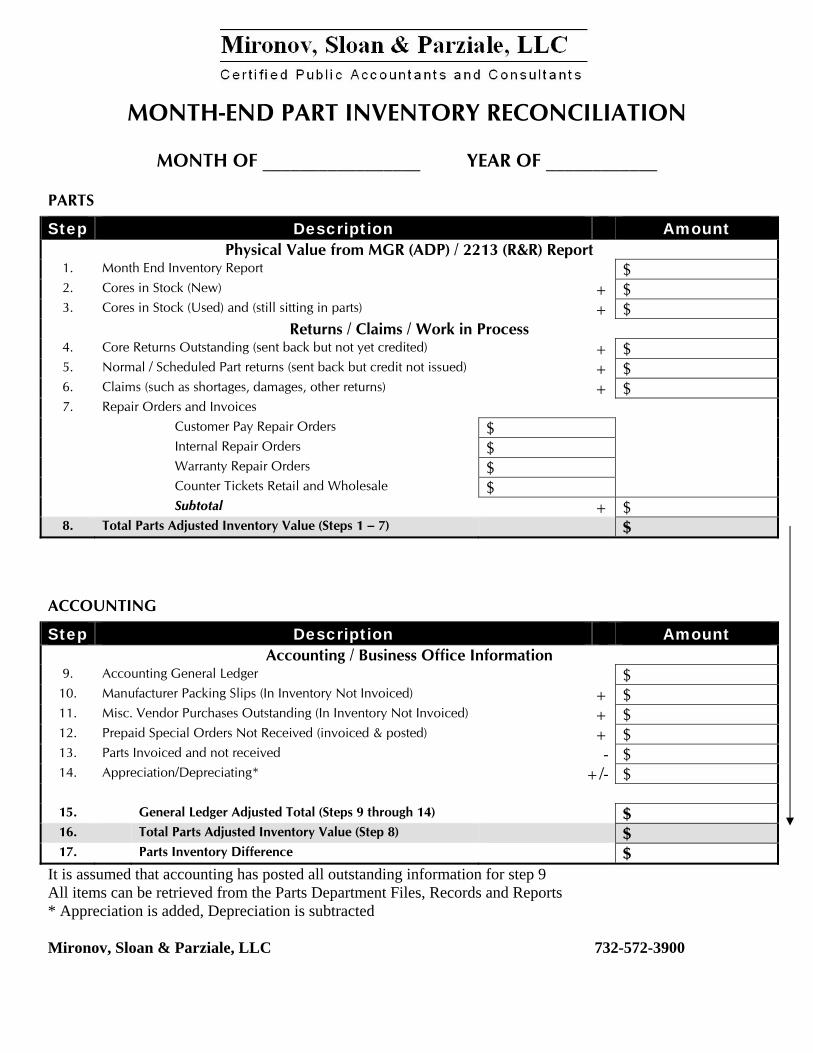
MONTH-END PART INVENTORY RECONCILIATION
MONTH OF _________________ YEAR OF ____________
PARTS
Step Description Amount Physical Value from MGR (ADP) / 2213 (R&R) Report
1. Month End Inventory Report $ 2. Cores in Stock (New) + $ 3. Cores in Stock (Used) and (still sitting in parts) + $
Returns / Claims / Work in Process 4. Core Returns Outstanding (sent back but not yet credited) + $ 5. Normal / Scheduled Part returns (sent back but credit not issued) + $ 6. Claims (such as shortages, damages, other returns) + $ 7. Repair Orders and Invoices Customer Pay Repair Orders $ Internal Repair Orders $ Warranty Repair Orders $ Counter Tickets Retail and Wholesale $ Subtotal + $
8. Total Parts Adjusted Inventory Value (Steps 1 – 7) $ ACCOUNTING
Step Description Amount Accounting / Business Office Information
9. Accounting General Ledger $ 10. Manufacturer Packing Slips (In Inventory Not Invoiced) + $ 11. Misc. Vendor Purchases Outstanding (In Inventory Not Invoiced) + $ 12. Prepaid Special Orders Not Received (invoiced & posted) + $ 13. Parts Invoiced and not received - $ 14. Appreciation/Depreciating* +/- $
15. General Ledger Adjusted Total (Steps 9 through 14) $ 16. Total Parts Adjusted Inventory Value (Step 8) $ 17. Parts Inventory Difference $
It is assumed that accounting has posted all outstanding information for step 9 All items can be retrieved from the Parts Department Files, Records and Reports * Appreciation is added, Depreciation is subtracted Mironov, Sloan & Parziale, LLC 732-572-3900