Embed Size (px)
Citation preview

Parts of a Science Fair
Project
Please make sure you have a
slide for each section

QUESTION
Put your question here.
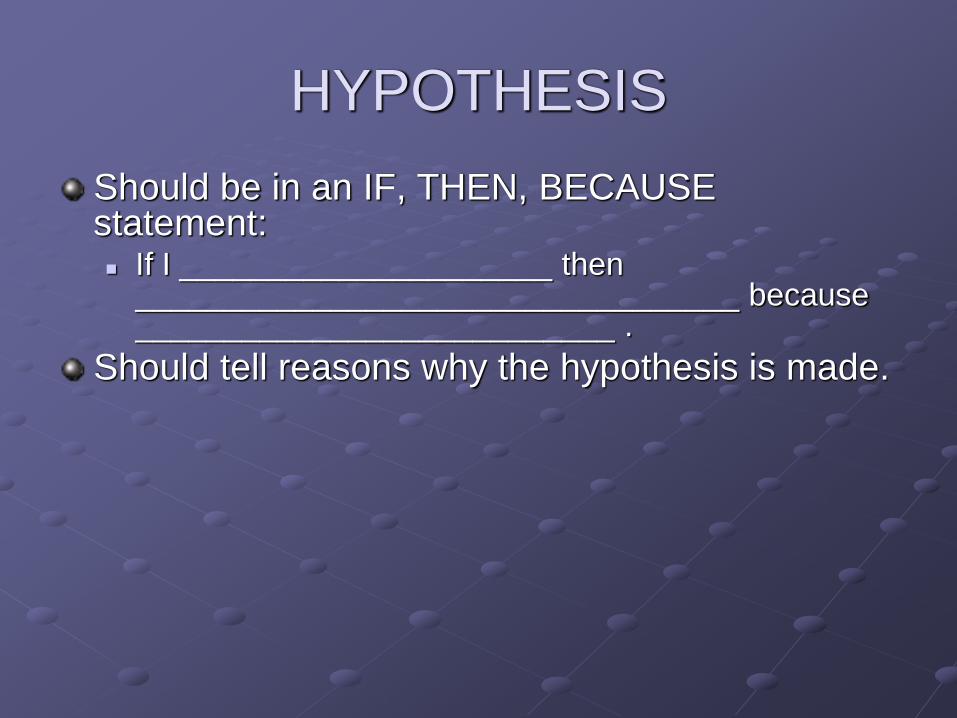
HYPOTHESIS
Should be in an IF, THEN, BECAUSE statement: If I _____________________ then
__________________________________ because ___________________________ .
Should tell reasons why the hypothesis is made.
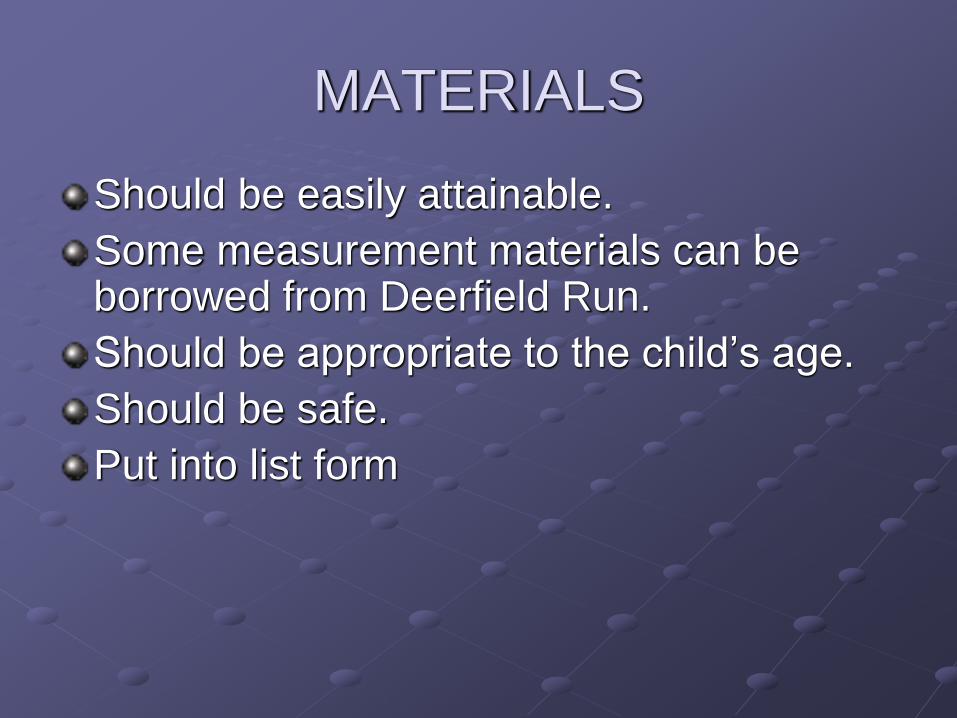
MATERIALS
Should be easily attainable.
Some measurement materials can be borrowed from Deerfield Run.
Should be appropriate to the child’s age.
Should be safe.
Put into list form
PROCEDURE
A set of numbered steps followed by the child
during the experiment.
Should be written in a clear, sequential manner.
Steps should show that the experiment is
repeated and recorded at least three times.
Should include how much of the materials are
used in each step.

VARIABLES
Independent Variable: this is the only thing that is changed in the experiment.
Dependent Variable: This is the outcome that is measured in the experiment.
Controlled Variables: each factor in the experiment that is kept the same, to keep the experiment a fair test of what is being tested.
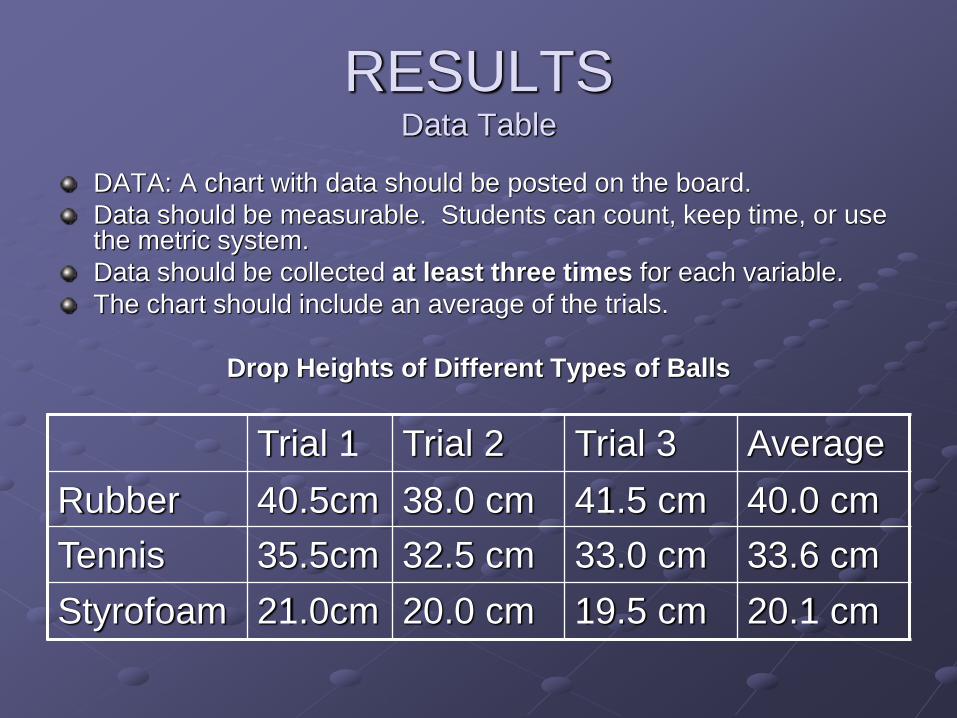
RESULTSData Table
DATA: A chart with data should be posted on the board.
Data should be measurable. Students can count, keep time, or use the metric system.
Data should be collected at least three times for each variable.
The chart should include an average of the trials.
Drop Heights of Different Types of Balls
Trial 1 Trial 2 Trial 3 Average
Rubber 40.5cm 38.0 cm 41.5 cm 40.0 cm
Tennis 35.5cm 32.5 cm 33.0 cm 33.6 cm
Styrofoam 21.0cm 20.0 cm 19.5 cm 20.1 cm
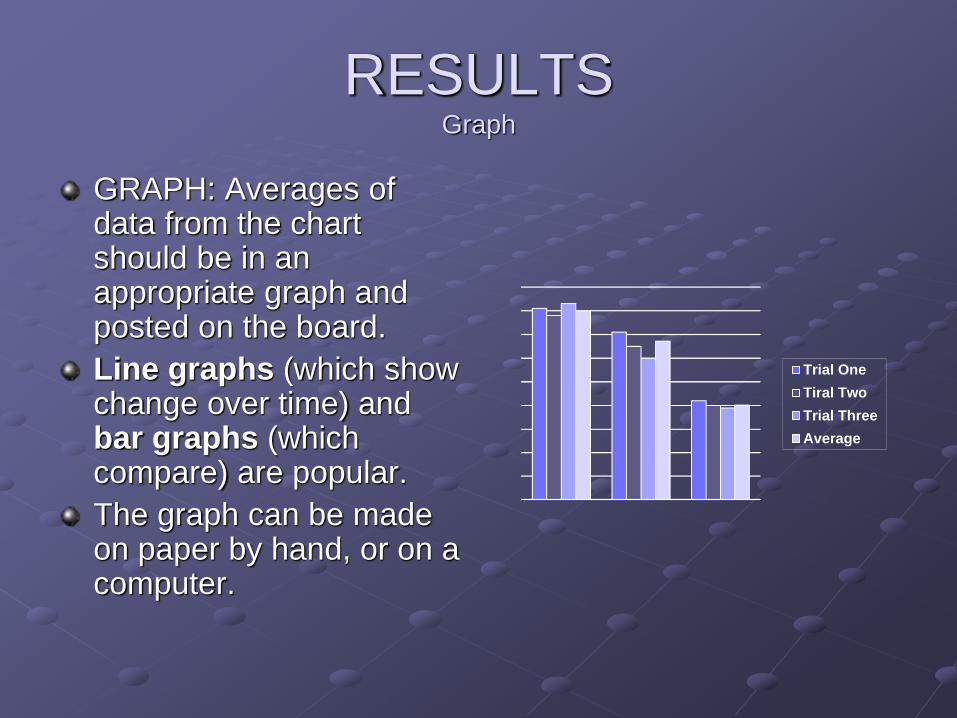
RESULTSGraph
GRAPH: Averages of data from the chart should be in an appropriate graph and posted on the board.
Line graphs (which show change over time) and bar graphs (which compare) are popular.
The graph can be made on paper by hand, or on a computer.
Trial One
Tiral Two
Trial Three
Average
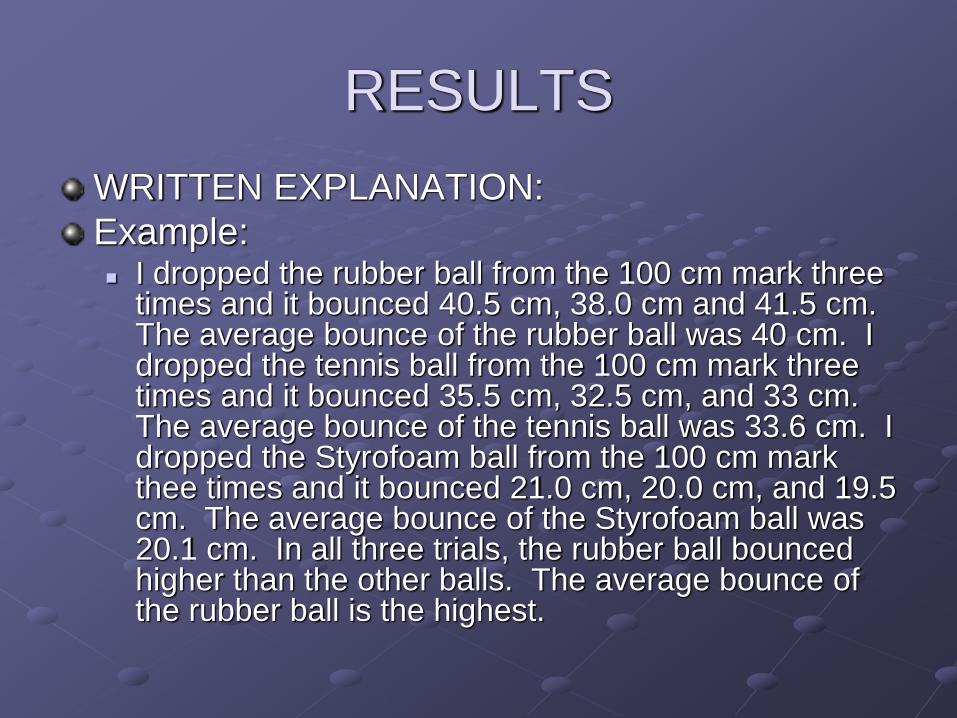
RESULTS
WRITTEN EXPLANATION:
Example: I dropped the rubber ball from the 100 cm mark three
times and it bounced 40.5 cm, 38.0 cm and 41.5 cm. The average bounce of the rubber ball was 40 cm. I dropped the tennis ball from the 100 cm mark three times and it bounced 35.5 cm, 32.5 cm, and 33 cm. The average bounce of the tennis ball was 33.6 cm. I dropped the Styrofoam ball from the 100 cm mark thee times and it bounced 21.0 cm, 20.0 cm, and 19.5 cm. The average bounce of the Styrofoam ball was 20.1 cm. In all three trials, the rubber ball bounced higher than the other balls. The average bounce of the rubber ball is the highest.
CONCLUSION
Should refer back to the hypothesis.
Should draw conclusions from the results.
What happened?
Should explain theories of why the student
thinks that happened.
May suggest changes to the experiment
for the future.