Embed Size (px)
Citation preview

4th NASA Integrated CNS Conference and Workshop, Fairfax, VA, April 26-30, 2004
Passive Wake Acoustics Measurements at Denver International Airport
Frank Y. Wang1, Hadi Wassaf1, Robert P. Dougherty2, Kevin Clark1,Andrew Gulsrud1, Neil Fenichel3 and Wayne H. Bryant4
1John A. Volpe National Transportation Systems Center, Cambridge MA2OptiNav, Inc., Bellevue, WA
3Microstar Laboratories, Bellevue, WA4NASA Langley Research Center, Hampton, VA
AbstractFrom August to September 2003, NASA conducted an extensive measurement campaign tocharacterize the acoustic signal of wake vortices. A large, both spatially as well as in number ofelements, phased microphone array was deployed at Denver International Airport for this effort.This paper will briefly describe the program background, the microphone array, as well as thesupporting ground-truth and meteorological sensor suite. Sample results to date are then presentedand discussed. It is seen that, in the frequency range processed so far, wake noise is generatedpredominantly from a very confined area around the cores.
Background and IntroductionWake vortex is a subject of continual interestin aviation since the 1970s from theperspectives of both safety and capacity.Currently the Federal AviationAdministration (FAA) and the NationalAeronautics and Space Administration(NASA) are conducting a joint WakeTurbulence Research Program. The overallresearch effort distinguishes between near-term, mid-term, and long-term activities.Long-term efforts, conducted primarily byNASA, will investigate a solution involvingactive prediction and monitoring of wakebehaviors to mitigate the adverse effect ofwake turbulence on airport operations.
As a part of the long-term research, NASAhas been working towards a real-time wakevortex advisory system. It is envisioned thatsuch a system could provide pilots andcontrollers advance warning of the locationand nature of hazardous wake turbulence. Anintegral part of such a wake vortex advisorysystem is a suite of meteorological and wakemonitoring sensors. Amongst the many wakesensor concepts, there is currently an effort in
examining the fundamental phenomenologyas well as the associated operationalimplications of acoustic emission from wakevortices as the basis for passively detecting,tracking and characterizing wake vortices.
The technical literature on acoustic emissionby wake vortices is rather sparse1-4.Consequently, as a first necessary step inachieving fundamental understanding of thephenomenon, a large microphone test wasconducted at Denver International Airport(DIA) from August 28th to September 19thof 2003. Under the sponsorship and overallsupervision of NASA Langley ResearchCenter, the DOT Volpe Center andsupporting contractors (Titan, OptiNav andMicrostar Laboratories) fielded a 252-element phased microphone array tocharacterize the acoustic signature of wakevortices as a function of aircraft type,meteorological conditions, as well as wakepositions and strengths measured by twoLidars5. In addition, the Denver microphonetest provided an opportunity to conduct fieldevaluation of recent modifications to a laser-based wake acoustic sensor named
https://ntrs.nasa.gov/search.jsp?R=20040139082 2020-03-24T22:51:28+00:00Z

4th NASA Integrated CNS Conference and Workshop, Fairfax, VA, April 26-30, 2004
SOCRATES (Sensor for OpticallyCharacterizing Ring-Eddy AtmosphericTurbulence Emanating Sound), which isbeing developed by Flight SafetyTechnologies (FST) and Lockheed-Martin(LM). A four-beam SOCRATES sub-systemwas also fielded by FST-LM at the Denvertest site. In addition, under the FST funding,the German Aerospace Center in Berlin (DLR- Berlin) deployed its phased microphonearray to further characterize the acousticproperties of aircraft wake vortices. Thecomplete list of the test participants andsupporting organizations is found in theAppendix.
Although the Denver experiment presentsample opportunities for cross validation ofsensors and processing techniques, thepresent paper will only focus on the NASA-DOT phased microphone array relatedefforts, as well as the exploratory results todate. Additional preliminary results from themicrophone test are also found in Ref. 6.
Test SiteDue to the interest to first characterize theacoustic signature of wake vortices in the out-of-ground-effect (OGE) regime (defined asaltitude over half of the initial lateralseparation distance of vortices firstgenerated), measurements were conducted ata location under the flight path of runway16L, at a location two nautical miles from therunway threshold where the nominal arrivingaircraft altitude is approximately 700 feet.Arrivals are the focus at this time in partbecause of the competing jet noise is greatlyreduced in such a flight profile. The selectionof the Denver International Airport ismotivated both by its diverse aircraft mix, aswell as the relative pristine acousticenvironment. Finally, it may be of interest tonote that the microphone measurements weremanned, and 99 percent of the measurementswere made under Visual MeteorologicalConditions (VMC).
Sensor LocationsFig. 1 shows an aerial photograph of the arraytest site. The magnetic-north direction in Fig.1 is approximately pointing at the 11 o’clockdirection. The various sensor locations aremarked by numbers and they are as follows.1: NASA-DOT Volpe Microphone Array; 2:Meteorological Tower, 3: AeroVironmentSodar; 4: NASA-DOT Volpe InstrumentationTrailer (which also housed a Metek SonicAnemometer and a Kipp & ZonenMicrowave Radioameter); 5: MIT LincolnLaboratory Continuous Wave Lidar; 6:SOCRATES Laser Array; 7: DLR - BerlinMicrophone Array; 8: FST-LM-DLRInstrumentation Trailers. Due to a requiredminimum standoff distance and topographyconsiderations, the CTI Pulsed Lidar waslocated 0.75 mile west of the NASA-DOTVolpe microphone array. The Pulse Lidar istherefore not shown in the aerial photographtaken right over the array area in Fig. 1.
Figure 1 Aerial Photograph of the Test Area.
The CTI Pulsed Lidar and MIT LincolnLaboratory’s Continuous Wave Lidar werefielded so that they both scanned over themicrophone array. As such, theycomplemented each other in providing theground-truth tracks and aerodynamiccharacterization of the wakes. They includepositions of the vortex cores, strengths of thevortices, as well as the velocity distribution asa function of time. Additional information onthe two Lidars can be found in Refs. 7 - 9.
Dynamics of wake vortices is recognized tobe strongly influenced by meteorologicalconditions. Likewise, meteorology has animportant impact on sound propagation and

4th NASA Integrated CNS Conference and Workshop, Fairfax, VA, April 26-30, 2004
attenuation. A suite of weather sensors wastherefore fielded to support both wakeaerodynamics and acoustics studies. Themeteorological sensors included a 107 feettower instrumented with three-axis R. M.Young Gill propeller anemometers at threeheights and a Vaisala temperature andrelative humidity point measurement sensorat mid-height of the tower. The tower was ofmobile nature and was used later to hang anoise source close to the microphone arraycenter for acoustic calibration. AnAeroVironment Sodar was used to measurethree components of the wind field above theheight of the meteorological tower. A Meteksonic anemometer was used to provide apoint measurement of the atmosphericturbulence as well as temperature. Lastly, aKipp & Zonen microwave radiometer wasused to provide temperature profiles over thearray area. Additional weather informationsuch as barometric pressure, ceiling, andRVR are obtained from airport ASOS data.
Microphone Array System DescriptionThe system was designed and integrated byMicrostar Laboratories and OptiNav. It iscapable of supporting up to 256 microphonechannels. For the Denver measurements, 252channels were used for microphones, and theremaining four channels were allocated forauxiliary input such as that from a GPSreceiver. The system’s main components are:252 Panasonic electric capsules WM-61Amicrophones, 8 32-channels’ preamplifierswith software configurable gain (made byACB Engineering), 32 8-channels Σ-∆ 16-bitA/D cards with on-board analog fourth-orderBessel anti-aliasing filters as well as on-boardDSP’s (made by Microstar Laboratories), anda data collection workstation. Both themicrophones and the preamplifiers canoperate in a frequency range from 20Hz to20kHz. The non-uniform spacing / sparsemicrophone array pattern was designed byOptiNav, with the array center being on theextended centerline of runway 16L. Aphotograph of the array area is shown in Fig.2.
Figure 2 Array Center Area with a Vintage Point ofLooking Towards Runway 16L (i.e., South). The
Rectangular Object is an Environmental EnclosureHousing the Data Acquisition Equipment for one of
the Four Sub-Arrays.
The pattern was designed to allow arrayprocessing over a broad frequency range of20 to 1000 Hz. The dimensions of the arraywere approximately 100 feet longitudinally(along the flight path), and 400 feet laterally(normal to the flight path) as shown in Fig. 3.The acoustic signal collected by each of themicrophones was first amplified, then passedthrough the anti-aliasing filter before it issampled at 153600 samples/sec., anddigitized by the A/D card. The digital signalundergoes 2 stages of filtering using 2symmetric linear phase FIR filtersimplemented by the on-board DSP beforedown-sampling the data to a rate of 25600samples/sec. Finally, it is important to notethat all the A/D channels were synchronouslysampled. This is critical to allow for theimplementation of the array processingalgorithms performed in the post processingstage.
Figure 3 The Microphone Array Pattern Used inthe Government Wake Acoustics Study.

4th NASA Integrated CNS Conference and Workshop, Fairfax, VA, April 26-30, 2004
Acoustic Data Processing DescriptionThe first stage of the data processing aims atproviding a quick-look and baselinedescription of the data from September 3rd toSeptember 19th - a period during which themeasurement equipment became fully online.The frequency band of 20 to 200Hz is thefocus in this first stage data processing.
The raw data are first passed forward andbackward through an 8th order IIRButterworth filter resulting in phaselessfiltering. The cutoff frequency of the filterwas approximately 200 Hz. It is thendecimated twice, by a factor of 5 each time,for a combined factor of 25. This reduced thesampling rate from 25,600 samples per sec. to1024 samples per sec. to enable fasterprocessing. A time domain delay-and-sumbeamforming1, 10 algorithm is used to focus atan altitude of 500 feet. A grid of 76 x 51points with a uniform spacing of 20 feet inboth directions was used. This represents a1500 feet x 1000 feet patch of the sky at 500feet with the larger dimension being normal(i.e., E-W) to the flight path. The choice ofthe grid spacing was in part assisted bysimulating the array response at the samealtitude. The simulation results showed thatthe resolution of the array at an altitude of500 feet above the center of the array isapproximately: 25 feet (E-W), 60 feet (N-S),and 200 feet (Upward), at 100 Hz (i.e., themiddle of the 200 Hz analysis band based on3 dB bandwidth). The beamformingalgorithm focuses the array at each point ofthe grid, and performs 2 seconds integrationof the acoustic power in the selectedfrequency band. At the end of each two-second integration period, a color contourmap revealing the noise source locations isgenerated. A 10 dB color scale is used whereblack is 0 or less, and the brightest color is 10dB or more. For each flyby, the frames areassembled into a movie file. Thispresentation scheme allows visualization ofthe wake evolution in manners similar toobserving smoke release in dedicated flighttests or from vortex-induced condensationmarking the vortex cores in very moist days.
Sample Results and DiscussionAs indicated before, only data fromSeptember 3rd to September 19th areexamined at this time. During this timeframe, 897 arrival measurement attemptswere made, and the associated aircraftdistribution is shown in Fig. 4.
Figure 4 Aircraft Distribution in the Data fromSeptember 3rd to September 19th.
It should be noted that Fig. 4 represents theresult of cross-referencing the field logbook(i.e., visual identification of aircraft byvarious array operators) with the ARTSdatabase from DIA noise abatement office.The category “not matched” refers to aircraftthat could not be uniquely cross-referencedwith the ARTS database. This is mostlyrelated to the ambiguous definition of arrivaltime in the ARTS data, as well as DIAcontrollers re-routing arrival traffic initiallybound for other runways to land on 16L toaccommodate the measurement campaign. Itis expected that a very significant portion ofthe aircraft in the “not matched” class can beidentified by cross-referencing with fieldlogbooks from other sensors.
For facilitating subsequent discussion, theconcept of non-dimensional wake age isintroduced11, 12. First, zero time is taken aswhen the aircraft flew over the array, whichin the two second averaged frames, is whenthe bright aircraft noise spot is approximatelyin the middle of the field of view. Time isthen normalized by the theoretical time ittakes for a vortex pair to sink by 79 (morespecifically, π/4) percent of the wingspan.

4th NASA Integrated CNS Conference and Workshop, Fairfax, VA, April 26-30, 2004
Fig. 5 shows a B767 flyby on September 3rd,at 7:43 pm local Denver time. Only everyother images from the beamforming moviesare shown for brevity. The bright oval noisesource shown in T = 0 sec. is the aircraftitself. Although wake vortices arecontinuously being generated for as long aslift is produced, it usually takes anywherebetween 5 to 10 seconds to complete the roll-up process and form the two salient counter-rotating features behind aircraft. This is alikely reason why vortex-like features do notappear immediately in these frames. Fig. 5suggests that for this arrival, vortices are fullyformed in the beam pattern at around 8seconds after flyby. Also from previouswake research, it is expected that wakeswould remain in their columnar form in auniform wind field and relatively insensitiveto external atmospheric influence. One non-dimensional time for 767 is approximately 24seconds, and the sequence of frames fromFig. 5 appears to be consistent with the earlierfinding.
The lateral separation distance in the vortexpair as revealed by the noise source maps isnext investigated. This distance istheoretically 79 percent of the wingspan.Such a comparison is best carried out whenthe wake reaches the beamforming altitude of500 feet. In the absence of Lidar data at thetime of this writing, the following estimate ismade. For B767, the vortex pair istheoretically estimated to descend with avelocity of 5.11 feet/sec. after rolled-up. Atthis speed, the wake will reach 500 feetaltitude at T = 39 sec. The average of lateralspacing taken from T = 38 (not shown in Fig.5) to T = 40 is 110 feet. This represents 70percent of the B767 wingspan, whichcompares quite favorable with the theory byassuming the wing being elliptically loaded.It should be emphasized that measurementson the initial separation distance of the vortexpair is not a trivial task, and this quantity isoften obtained from wind tunnels and towtanks. It may be of interest to compare thephased array results with the recent findingfrom a controlled, high Reynolds numberA340-300 tow tank test13 simulating cruise –
a condition that would better approximateelliptical wing loading. A spacing of 64percent of the wingspan was found to be amore representative percentage based on thisparticular tow tank test. It is interesting tonote that the phased microphone array andtow tank results both suggest that thetheoretical value of 79 percent of wingspanoften quoted may be too large. As for theremaining of the run, data collection wasunfortunately terminated prematurely for thisflyby. Information beyond 56 seconds wastherefore unavailable.
T = 0 sec. T = 4 sec. T = 8 sec.
T = 12 sec. T = 16 sec. T = 20 sec.
T = 24 sec. T = 28 sec. T = 32 sec.
T = 36 sec. T = 40 sec. T = 44 sec.
T = 48 sec. T = 52 sec. T = 56 sec.
Figure 5 Event 030903_194324
As another example, results are shown from aB737 flying over the array on September 16,at 11:25am local Denver time. From thesource localization map, the vortex pairappeared as a line of noise source. Furtherinvestigation is necessary to understand thisparticular type of appearance. However, aninterim candidate explanation is offered asfollows. The theoretical initial lateraldistance between the vortex pair for B737 isestimated to be 74.5 feet. Such a distance isspanned across less than four grid points inthe beamforming process. If the same scalingfactor of 0.7 from the previous sample result

4th NASA Integrated CNS Conference and Workshop, Fairfax, VA, April 26-30, 2004
were applied, the initial lateral separation ofthe vortices from a B737 would then havebeen 66 feet. Such a distance is about threegrid points in the beamforming process. Thephysical distance that needs to be resolvedtherefore borders the resolution limits of boththe beamforming grid and array resolution.
T = 0 sec. T = 4 sec. T = 8 sec.
T = 12 sec. T = 16 sec. T = 20 sec.
T = 24 sec. T = 28 sec. T = 32 sec.
T = 36 sec. T = 40 sec. T = 44 sec.
T = 48 sec. T = 52 sec. T = 56 sec.Figure 6 Event 030916_112527
The non-dimensional time for B737 is 12seconds, and it is again seen that the wakeremained straight within this time frame. Atabout 28 seconds after flyby, the wake is seento start developing a Crow instability14 ring-like feature. At 32 seconds after flyby, thering feature is very distinctive. Following thering motion in the subsequent frames, it canbe seen that the wind field is such that aheadwind and a crosswind from east existedduring this landing. At 60 seconds andbeyond (not shown here), the wake appearedto have been demised.
Although the size of the entire wake oval isof the order of twice that of the wingspan inthe lateral direction, the beamforming resultssuggest that sound generation in thefrequency band of 200 Hz and below isbasically confined to regions close to orwithin the cores.
Closing Remarks and Future WorkCurrently the Denver data are beingexamined by team members from NASALaRC (POC: Earl Booth), DOT-Volpe (POC:Frank Wang) and Florida Atlantic University(FAU; POC: Nurgun Erdol), as well asOptiNav (which produced the results givenhere; POC: Robert Dougherty) and Titan(POC: Robert D’Errico). The data processingand analysis activities shown here representonly a small fraction of the overall ongoingGovernment effort in understanding theacoustics of wake vortices. Additional signalprocessing techniques are being applied to thesame dataset in order to quantify the overallperformance relative to the baselineprocessing results. These activities areexpected to expand the state-of-the-artunderstanding of wake acoustics.Ultimately, the following list of technicalissues would need to be properly addressed invarious stages of the DIA data analysis.
• Do wake vortices generate a uniqueacoustic signature?
• How consistently do wake vorticesgenerate these signature?
• What are the characteristics of thesesignatures and circumstances underwhich they are generated?
• What is the frequency range of theseacoustic signals?
• Can wake strength be reliably inferredfrom wake acoustic signature? What isthe fundamental scientific principle?
• If the answers to all of the questions arepositive, then assess the feasibility of anacoustic-based sensor system indetecting, identifying, tracking wakevortices and quantifying the circulation ina high ambient noise environmenttypically found in major airports.
Results of these studies will be disseminatedto the community when available.

4th NASA Integrated CNS Conference and Workshop, Fairfax, VA, April 26-30, 2004
References1Michel, U. and Böhning, P., Investigation ofAircraft Wake Vortices with PhasedMicrophone Arrays, AIAA Paper 2002-2501,Breckenridge, CO, June 2002.
2Cotton, W. and William, R., PROJECTSOCRATES: A New Sensor Technology forEnhancement of Aviation Safety andCapacity, The 2002 FAA Airport TechnologyConference, Atlantic City, NJ, May 5 - 8,2002.
3Quazi, A. H., Detection and Tracking ofWake Vortices Using Socrates System,Presented in EUROMECH-433: Dynamics ofTrailing Vortices, Aachen, Germany, March20-22, 2002.
4Hallock, J. N., Wake Vortex Bibliography,http://www.volpe.dot.gov/wv/wv-bib.html
5Braukus, M. and Barnstorff, K., ScientistsListen in on Sounds of Aircraft WakeSignatures, NASA Press Release 03-271,August 19, 2003.
6Dougherty, R. P., Wang, F. Y., Booth, E. R.,Watts, M. E., Fenichel, N. and D'Errico, R.,Aircraft Wake Vortex Measurements atDenver International Airport, AIAA Paper2004-2880, Manchester, UK, May 2004.
7Hannon, S. M., Phillips, M. W., Thompson,J. A. and Henderson, S. W., Pulsed CoherentLidar Wake Vortex Detection, Tracking andStrength Estimate in Support of AVOSS,NASA First Wake Vortex Dynamic SpacingWorkshop - NASA CP-97-206235, May 13-15, 1997.
8Heinrichs, R. M., Wake VortexMeasurements with a CW 10.6 μm CoherentLaser Radar, NASA First Wake VortexDynamic Spacing Workshop - NASA CP-97-206235, May 13-15, 1997.
9Heinrichs, R. M. and Dasey, T. J., Analysisof Circulation Data from a Wake VortexLidar, AIAA Paper 97-0059, Reno, NV,January 1997.
10Johnson, D. H. and Dugeon, D. E., ArraySignal Processing: Concepts and Techniques,Prentice Hall, NJ, 1993.
11Greene, G. C., An Approximate Model ofVortex Decay in the Atmosphere, Journal ofAircraft, Vol. 23, No. 7, July 1986, pp. 566-573.
12Robins, R. E., Delisi, D. P. and Greene, G.C., Algorithm for Prediction of TrailingVortex Evolution, Journal of Aircraft, Vol.38, No. 5, September-October 2001.
13Scarano, F., van Wijk, C. and Veldhuis, L.L. M., Traversing Field of View and AR-PIVfor Mid-Field Wake Vortex Investigation in aTowing Tank, Experiments in Fluids, Vol. 33,No. 6, December 2002, pp. 950-961.
14Crow, S. C., Stability theory for a Pair ofTrailing Vortices, AIAA Journal, Vol. 8, No.12, December 1970, pp. 2172-2179.
Appendix: Test Participants andSupporting Organizations
• NASA LaRC• DOT Volpe Center• Titan• OptiNav• Microstar Laboratories• CTI• MIT LL• AeroVironment• WLR Research• SCENSI• FST• Lockheed Martin• Anteon• DLR – Berlin• FAU• United Airlines• DIA International Airport• Local Denver FAA

4th NASA Integrated CNS Conference and Workshop Fairfax, VA, April 26-30, 2004
NASA’s Wake Acoustics ResearchPresentation by NASA and DOT-Volpe Center
Denver Wake Acoustics Test – Introduction
NASA Conducted an Extensive Measurement Campaign at DIA on the Phenomenon of Acoustic Emission of Wake Vortices.
August 18 to September 26, 2003.
Recorded About 1200 Flybys (Mostly for Aircraft in Landing Configuration).

NASA’s Interest in Wake Sensors
• NASA Developed an Active Wake Vortex Predictor for the Terminal Area (AVOSS -Aircraft VOrtex Spacing System) which was Demonstrated at DFW in July 2000.
• Under the Joint NASA-FAA Wake Turbulence Research Management Plan (RMP), NASA Will Focus on Developing Mid- and Long-Term Products to Improve NAS Capacity without Compromising Safety.

• NASA, as Part of Its Long-Term RMP Efforts, Continues to Mature the Predictor and Wake Sensor Components.
• NASA Has Been Exploring a Number of Technologies for the Wake Sensor Component of a Wake Vortex Advisory System.
• Examples Are Lidar, Windline, Sodar, Radar, RASS and More Recently…
NASA’s Interest in Wake Sensors

NASA’s Interest in Passive Wake Acoustics
• Congress Directed NASA to Examine the Concept Behind SOCRATES (Sensor for Optically Characterizing Remote Atmospheric Turbulence Emanating Sound) - A Laser Based Passive Wake Acoustics Sensor Under Development.

1: Scientific Investigation of the Acoustic Properties of Aircraft Wake Vortices and Ambient Noise Characterization Using a NASA-DOT Phased Microphone Array.
2: Assess Improvements in SOCRATES Instrumentation.
3: Benchmark NASA-DOT Microphone Array Using DLR Array.
Objectives of the Denver Wake Acoustics Test

Denver International Airport
Desirable Acoustic Environment
Diverse Traffic Mix, Abundance of Large and Heavy Aircraft

Participating and Supporting Organizations
NASA LaRCDOT Volpe CenterTitanOptiNavMicrostar LaboratoriesCTIMIT LLAeroVironmentWLR ResearchFSTLockheed MartinDLR - BerlinAnteonFAU United AirlinesDIA AirportLocal Denver FAA

• Landing Configuration.
• Vortices Generated from Nominally 700 Feet Altitude.
• Acoustic Data from Government Microphone Array.
• Lidars Providing Ground-Truth Wake Track and Strength Data.
• Metrological Sensors Characterizing State of the Atmosphere.
• Aircraft Identification and Flight Tracks from ARTS.
General Test Configurations
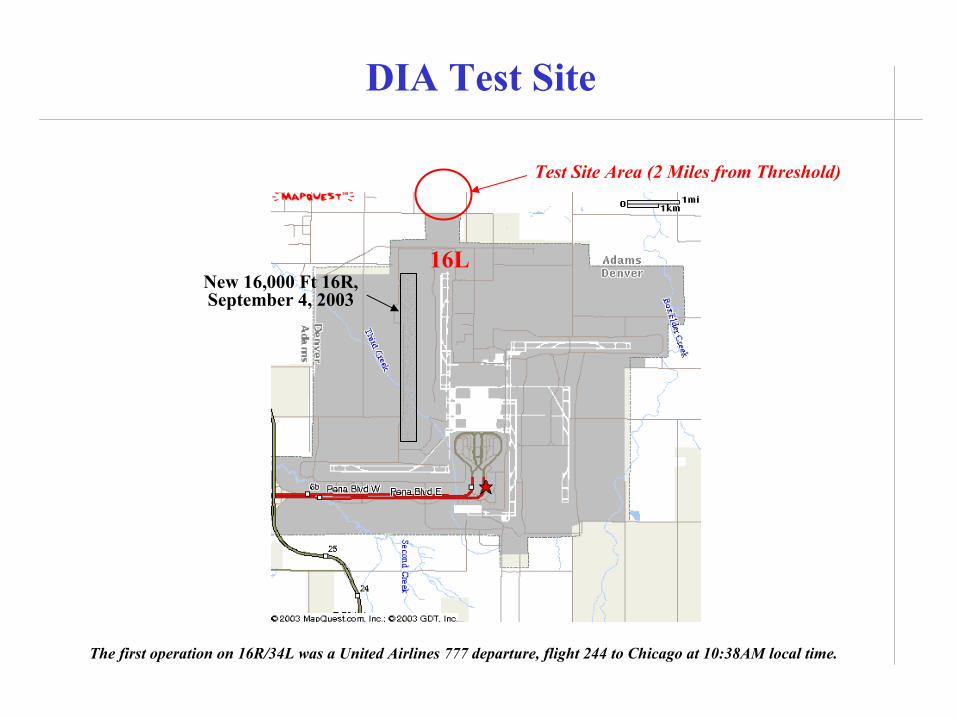
DIA Test Site
16LNew 16,000 Ft 16R, September 4, 2003
Test Site Area (2 Miles from Threshold)
The first operation on 16R/34L was a United Airlines 777 departure, flight 244 to Chicago at 10:38AM local time.

Extended Runway CenterlineJim Elliot Photograph
Test Site Aerial Photograph
128th AvenueN

Test Site Aerial Photograph
NASA-DOT Microphone Array
Metrological Tower
DLR Microphone Arrays
Government Trailer
AeroVironmentSodar
MIT LL CW-LidarSOCRATES Array
SOCRATES and DLR Trailers
CTI Pulsed Lidar: 0.75 Miles West
Jim Elliot Photograph

Primary Acoustic Sensor - NASA-DOT Array
Two Configurations Deployed.
Configuration 1 – 8/28 to 9/19 (20 – 1000 Hz).
Configuration 2 – 9/22 to 9/23 (10 – 2000 Hz).

Array Layout
Configuration 1 Configuration 2

Aerodynamic Sensors
CTI Pulsed Lidar
MIT LL CW Lidar

Metrological Sensors
AeroVironment Wind Sodar
107 Ft Tower with R. M. Young Propeller Anemometers at Three Heights
Vaisala Temperature and Relative Humidity Sensor at Mid-Height of Tower
Kipp & Zonen Microwave RadiometerTemperature Profiler
METEK Ultrasonic Anemometer

Additional Measurements
SOCRATES Laser Array
DLR Phased Microphone Arrays

Looking South from the Government Array

Close-Up of the Array Components

Looking West
Government Trailer MIT LL CW Lidar

Looking East from CTI Pulsed Lidar
Pulsed Lidar
CW-Lidar
Government Trailer

Looking South from SOCRATES
Government Microphone Array
SOCRATES Laser Array
Lockheed-Martin Photograph

Sodar Tower
Meteorological Sensors

Tower – Metrological and Array Calibration
Three-Axes Gill Propeller Anemometers OptiNav Photograph
VaisalaTemperature
and RH Sensor

Meteorological Sensors
Kipp & Zonen Microwave Radiometer
METEK Ultrasonic Anemometer

Array Signal Processing
Sound Source
Sensor 1 Sensor 2
Sensor 2 Hears an Earlier Version of Sensor 1

Array Signal Processing
Sound Source
Sensor 1 Sensor 2
The Time Delay Sensor 1 Hears is Proportional to the Additional Distance the Same Sound Needs to Travel in Getting to Sensor 1

Figure Taken from Johnson, P. and Dudgeon, 1993
Delay and Sum Beamforming
If the Location of Sound Source Were Known, Appropriate Time Shifts in the Recorded Signals from Different Sensor Elements in the Array can be Applied in Software.
Acoustic Signature from the Source of Interest is then added Constructively; Signal is Amplified from the Investigated Location.

Delay and Sum Beamforming
Figure Taken from Johnson, P. and Dudgeon, 1993
Meanwhile, Sound From Other Locations Add Up Incoherently. The Result of Incoherent Summation Could be Shown as a Lower-Amplitude Wave ; Unwanted Noise is, in Effective, Rejected.
Entire Array Acts as a Directional Acoustic Sensor (Hence, “Beamforming”).
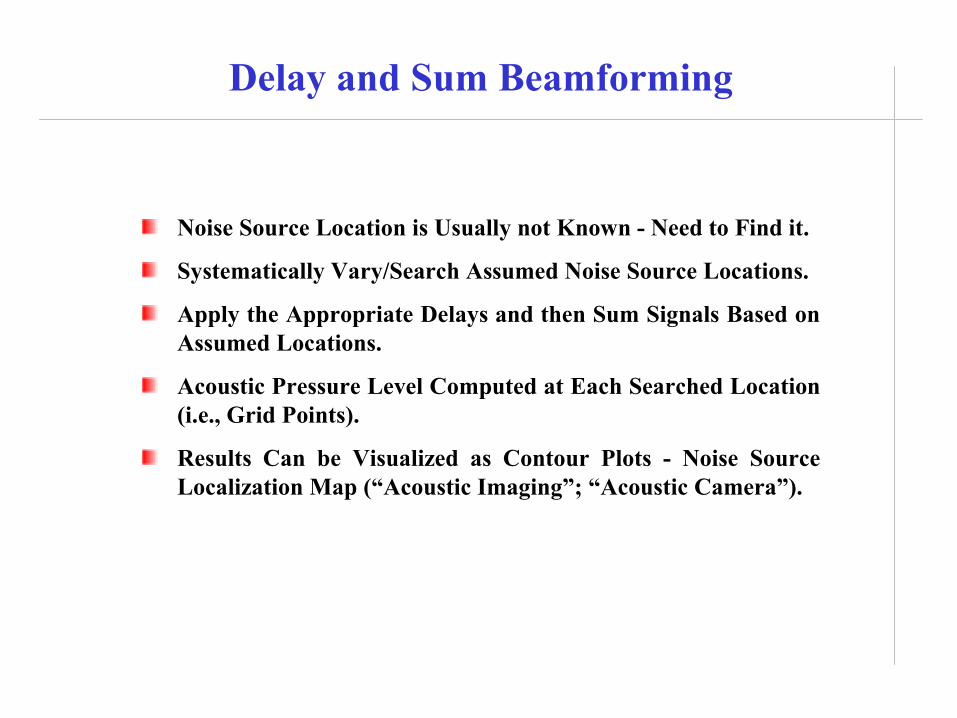
Delay and Sum Beamforming
Noise Source Location is Usually not Known - Need to Find it.
Systematically Vary/Search Assumed Noise Source Locations.
Apply the Appropriate Delays and then Sum Signals Based on Assumed Locations.
Acoustic Pressure Level Computed at Each Searched Location (i.e., Grid Points).
Results Can be Visualized as Contour Plots - Noise Source Localization Map (“Acoustic Imaging”; “Acoustic Camera”).

Sample Results - Microphone Array Run 030903_194324 : September 3 at 7:43PM Local Time ( B767 ). Beamforming at 500 Feet Altitude, 1000 Feet x 1500 Feet Coverage Area for a Horizontal Beamforming Planes (“Snapshots”).The Analysis Band is 200 Hz and Below.
T = 20 sec.
T = 0 sec. T = 4 sec. T = 8 sec.
T = 12 sec. T = 16 sec.
T = 24 sec. T = 28 sec. T = 32 sec.
T = 36 sec. T = 40 sec. T = 44 sec.
T = 48 sec. T = 52 sec. T = 56 sec.

Data Analysis Needs to Address
Do Wake Vortices Generate a Unique Acoustic Signature?
How Consistently do Wake Vortices Generate These Signature?
What Are the Characteristics of these Signatures and Circumstances Under which they are Generated?
What is the Frequency Range of these Acoustic Signals?

Data Analysis Needs to Address
Can Vortex Strength be Reliably Inferred from Wake Acoustic Signatures? What is the Fundamental Scientific Principle?
If the Answers to All of the Questions are Positive, Then Assess the Feasibility of an Acoustic-Based Sensor System Detecting, Identifying, Tracking Wake Vortices and Quantifying the Circulation in a High Ambient Noise Environment Typically Found in Major Airports.

Questions?
OptiNav Photograph