Embed Size (px)
Citation preview

Submitted to Management Sciencemanuscript 00631-2007.R2
Patents and the Performance of Voluntary StandardSetting Organizations
Marc RysmanBoston University, Departmant of Economics, [email protected]
Tim SimcoeUniversity of Toronto, Josph L. Rotman School of Management, [email protected]
Voluntary standard setting organizations (SSOs) are a common feature of systems industries, where firms
supply inter-operable components for a shared technology platform. These institutions promote coordinated
innovation by providing a forum for collective decision-making and a potential solution to the problem of
fragmented and overlapping intellectual property rights. This paper examines the economic and technologi-
cal significance of SSOs by analyzing the flow of citations to a sample of U.S. patents disclosed during the
standard-setting process. Our main results show that the age distribution of SSO patent citations is shifted
towards later years (relative to an average patent), and that citations increase substantially following stan-
dardization. These results suggest that SSOs identify promising technologies and influence their subsequent
adoption.
Key words : standards; compatibility; platform; intellectual property; patents; cumulative innovation
1. Introduction
Many products and services are based on inter-operable yet independently supplied component
technologies. In these markets, coordination is an important part of the innovation process. The
book “Startup” (Kaplan, 1996 pg. 146) provides a vivid description of the problem:
“All computer products are hopelessly interdependent. . . application designers exploit oper-ating systems tailored to computers built around chips that implement protocols based onspecifications developed in committees staffed by applications designers. Everyone in thisevolving loop must guess which new technologies are most likely to provide a solid and enduringplatform on which to build their own piece.”
Recent work in strategy and economics has emphasized the role of “platform leaders” in promot-
ing coordinated technical change (Bresnahan and Greenstein, 1999; Cusumano and Gawer, 2002).
But when leadership is distributed among many firms, coordination becomes more complex, and
major change is often orchestrated by voluntary standard setting organizations (SSOs).
1

Rysman and Simcoe: Patents and SSO Performance2 Article submitted to Management Science; manuscript no. 00631-2007.R2
SSOs work to create a consensus that can serve as a focal point for industry coordination or
lead to a bandwagon process among adopters, thus lowering the risk of “forking” or a standards
war. Some firms invest substantially in these efforts. In 2005 IBM spent an estimated $500 million
— roughly 8.5 percent of its R&D budget — on standards development. Hewlett Packard and Sun
Microsystems each participate in more than 150 SSOs.1
What do these companies get in return? It is often hard to say, since SSOs operate in diverse
markets and their effect on standard variables, such as price or quantity, is usually ambiguous.
While a large body of qualitative research describes how SSOs can facilitate technical coordination
and mitigate hold-up problems by promoting “open” technology (e.g. Besen 1988, 1989, 1991;
Weiss and Sirbu 1990; Hawkins 1995; Cargill 1997; Bolin 2002), there is no standard measure of
SSO performance, and very little quantitative evidence on the impact of these institutions.
This paper uses patent citations as a window onto the role of SSOs in economic and technological
change. Participants in the standard setting process are usually obliged to disclose relevant patents.
By searching publicly available disclosure archives, we identify a sample of 724 U.S. patents dis-
closed to four major SSOs: the American National Standards Institute (ANSI), the Institute for
Electrical and Electronic Engineers (IEEE), the Internet Engineering Task Force (IETF), and the
International Telecommunications Union (ITU). We track the flow of citations to these patents
and observe what happens following disclosure — which serves as a proxy for the creation of a new
standard based on the patented technology. Thus, our method builds on a large literature that has
established patent citations as a valid measure of economic and technological significance (Harhoff
et al 1999; Jaffe and Trajtenberg 2004; Allison et al 2004; Hall, Jaffe and Trajtenberg 2005) to
provide an initial measurement of the role of SSOs in the innovative process.
A first look at citation patterns reveals that SSO patents receive many more cites than other
patents from the same technological field and application year, suggesting that they are more
important or more valuable. We also use methods developed by Mehta, Rysman, and Simcoe
1 The IBM figures are from Forbes magazine, as cited in Chiao, Lerner and Tirole (2007, footnote 1). The figures onHP and Sun are from Updegrove (2003).

Rysman and Simcoe: Patents and SSO PerformanceArticle submitted to Management Science; manuscript no. 00631-2007.R2 3
(2007) to demonstrate a significant difference in the age distribution of citations to SSO patents.
Specifically, these cites are less concentrated in the first few years after the patent issues, suggesting
that SSO patents have a longer useful life. We consider two explanations for this pattern. The first
explanation is a selection effect: SSOs identify or attract technologies that are more significant (or
about to become so), and therefore more frequently cited. The second explanation is a marginal
effect: by fostering consensus and creating an open standard, the SSO causes firms to begin using
and citing a patented technology when they otherwise would not have, thus altering its citation
profile.
In order to identify the marginal effect, we must estimate a counterfactual: what would have
happened to a disclosed patent if the disclosure had never occurred? Obviously, we cannot observe
this scenario, so we focus on a closely related comparison: how do citations differ before and after
disclosure? In our statistical models, the impact of disclosure is identified by within-patent changes
in citation frequency around the time of disclosure. We must be cautious in interpreting this
comparison as identifying a causal effect. While we cannot sign the potential bias from measurement
error or endogeneity of the disclosure date, we provide several robustness checks that suggest the
validity of our results.
To summarize the results, we find that SSO patents’ pre-disclosure citation rate is roughly double
that of an average patent, while disclosure produces a 19 to 47 percent increase. The large difference
in baseline citation rates suggests that SSOs perform well in selecting important technologies. If
we are willing to place a causal interpretation on the disclosure effect, these results also imply that
SSOs increase the significance of standardized technology through formal endorsement and other
efforts to promote industry coordination. While it is difficult to attach a dollar value to citation
counts, the estimates in Harhoff et al (1999) and Hall, Jaffe and Trajtenberg (2005) suggest that
our results are economically meaningful.
These findings have both managerial and policy implications. While previous research on plat-
form management has emphasized the trade-off between “opening” a platform to grow the market,
and remaining “closed” to reduce competition or maintain control (e.g. Shapiro and Varian 1998;

Rysman and Simcoe: Patents and SSO Performance4 Article submitted to Management Science; manuscript no. 00631-2007.R2
Gawer and Henderson 2007), we focus on a complementary question: whether voluntary standards
can increase the value of a technology by creating a consensus around particular design elements
and providing a path to industry coordination. Our results suggest that they do. This does not
imply that managers should rush to join every new SSO or technology consortium — the four that
we study are widely viewed to be among the most influential. However, these findings provide some
quantitative evidence on the benefits of SSO endorsement, which managers should weigh against
the costs of participation and a commitment to openness.
Our results also help justify policy makers’ interest in preventing abuse of the standard-setting
process. For example, in 2005 the U.S. Federal Trade Commission (FTC) initiated an antitrust
action against Rambus for failing to disclose relevant patents while participating in an SSO.2
Arguments in the case centered on the distinction between selection and marginal effects — the
FTC alleged that Rambus had acquired market power by fraudulently manipulating the standards
process, and Rambus countered that it simply owned a superior technology, which would have been
chosen by the SSO, even if its patents had been disclosed. Our findings suggest that SSOs can
indeed have a significant impact on the value of a technology. Thus, concerns about manipulation of
the standards process to engineer patent hold-up are legitimate, and efforts to enforce SSOs’ private
intellectual property rules (which encourage disclosure and widespread licensing) may actually
stimulate innovation.
Related Literature and Outline
There is a relatively small theoretical literature on collaborative standards development. Farrell
and Saloner (1988) model consensus standard setting as a war of attrition and compare its perfor-
mance to a simplified “standards war.” Farrell and Simcoe (2008) extend the war of attrition model
to examine the welfare implications of different SSO policies, such as membership and licensing
rules. Lerner and Tirole (2006) also consider the choice of SSO policies, but emphasize the fact
that participants may be able to engage in “forum shopping” when there are multiple SSOs.3 This
2 In the Matter of Rambus Incorporated, FTC Docket Number 9302.
3 Lerner, Tirole and Strojwas (2003) also examine the closely related institution of patent pools.

Rysman and Simcoe: Patents and SSO PerformanceArticle submitted to Management Science; manuscript no. 00631-2007.R2 5
paper lends empirical support to an assumption shared by all of these models — that an SSO’s
formal endorsement increases demand for the standardized technology.
There is also a rapidly growing body of empirical work on SSOs. Bekkers et al (2002) document
the role of intellectual property strategy in standard setting for wireless telecommunication. Simcoe
(2006) examines the relationship between distributional conflicts and the duration of the IETF
standard setting process. Chiao, Lerner and Tirole (2007) find evidence of a negative relationship
between an SSO’s “sponsor friendliness” and the concessions required of technology sponsors.
While these papers focus on a single SSO, Leiponen (2006) suggests that in many cases standard
setting occurs within a network of loosely affiliated organizations, and that a firm’s position in
that network can influence its effectiveness within a focal SSO. Tassey (2003) outlines the methods
used by the National Institute of Standards and Technology (NIST) to evaluate the impact of
government research programs, which are based on augmenting any available industry-specific data
with surveys of industry participants to obtain the dollar impact of a given project. While the
NIST approach provides an estimate that is in principal easy to interpret, our method is attractive
in that it is inexpensive, objective, replicable and easy to compare across industries or over time.
Finally, this paper contributes to a stream of research on the impact of institutions on cumu-
lative technological change. For example, using an approach broadly similar to ours, Furman and
Stern (2006) exploit the longitudinal structure of citation data to examine the impact of biological
research centers on citation patterns.
2. SSOs and Intellectual Property
The four SSOs examined in this paper are the American National Standards Institute (ANSI),
the Institute of Electrical and Electronics Engineers (IEEE), the Internet Engineering Task Force
(IETF), and the International Telecommunications Union - Telecommunication Standardization
Sector (ITU-T, or often, ITU). Most of the patents disclosed to these four SSOs cover computing
and communications technology (see Table A-1 in the appendix for a complete breakdown).
The ITU is based in Switzerland. It is the oldest of the four SSOs, with origins dating back to
1865, and its original mission was to promote international coordination among the various rapidly

Rysman and Simcoe: Patents and SSO Performance6 Article submitted to Management Science; manuscript no. 00631-2007.R2
expanding domestic telephone networks. ITU members are either delegates from member nations, or
representatives of large network operators or equipment vendors. The ITU’s recent standard setting
efforts have focused on such issues as numbering and addressing, traffic management, monitoring
and accounting, and quality of service.
The IEEE was founded in 1884 by several pioneers in the field of electrical engineering. Members
include both individual engineers and companies interested in standards development. The IEEE’s
standard setting efforts cover a wide range of subjects, from electrical safety, to cryptography, to
standards for semiconductor testing equipment. In recent years, the IEEE’s most commercially
significant work has revolved around the 802.11 specifications for wireless networking (i.e. “Wi-Fi”).
ANSI was formed in 1918 to coordinate the ongoing standards development efforts of a number
of different organizations, and continues to play a role in coordinating the activities of hundreds of
different U.S. SSOs—primarily through an accreditation program focused on key dimensions of the
standards development process.4 While the IEEE is an ANSI accredited SSO, the majority of the
patents in ANSI’s disclosure records came from other standards developing organizations.5 In fact,
many of the ANSI disclosures are associated with the Telecommunications Industry Association,
which has worked on technologies such as DSL (for data transmission over phone lines) and TDMA
(a cellular telephony protocol).
The IETF creates protocols used to run the Internet. This organization grew out of an academic
computer networking community that emerged during the 1970s, and did not resemble a formal
SSO until the late 1980s (Mowery and Simcoe, 2002). Prominent IETF standards include the
Internet’s core transport protocols (TCP/IP and Ethernet), standards used to allocate network
addresses (DHCP), and specifications used by popular applications such as e-mail or file transfer.
Membership in the IETF is open to any interested individual, and much of the group’s work takes
place in online forums run by individual technical committees.
4 ANSI also serves as the U.S. representative on the two major non-treaty international standards organizations, theInternational Organization for Standardization (ISO) and the International Electrotechnical Commission (IEC).
5 The ANSI sample only contains disclosures that an accredited SSO chooses to forward to ANSI. This explains whythere is little overlap in Table A-2, even though the IEEE is a member of ANSI. While this feature changes theinterpretation of the ANSI sample, it is useful that it looks to largely independent sets of patents.
Rysman and Simcoe: Patents and SSO PerformanceArticle submitted to Management Science; manuscript no. 00631-2007.R2 7
While these four SSOs differ in their technology focus, membership rules, and level of formality,
their procedures for creating a new standard are quite similar. The process always begins with the
recognition of some coordination problem, which leads to the formation of a technical committee.
The committee’s job is to analyze the problem and recommend a consensus solution. While voting
rules differ across SSOs, “consensus” typically implies more than a simple majority, but less than
unanimity. Once a consensus is reached, the SSO publishes the resulting specification as a standard.
For an extended discussion of this process (which often takes several years) see, for example, Cargill
(1997).
Intellectual property rights are an increasingly important part of the technology evaluation pro-
cess at many SSOs. This growth partly reflects a well-documented surge in patenting—particularly
for ICT industries—that began in the mid-1980s. It may also reflect changes in patenting strategy.
Many firms would like to own IPR that is embedded in an industry standard. Patent owners fre-
quently seek royalty payments for the use of their technology—even (or, perhaps, especially) when
it is essential to the implementation of an industry standard.
Lemley (2002) surveyed the formal intellectual property policies of thirty-six SSOs, and suggests
that they have three basic parts: search, disclosure, and licensing rules. While only two of the
groups in his study required members to conduct a full patent search, twenty-seven (including
the four studied here) have rules stating that members should disclose any known property rights
as soon as possible. Firms have good reasons to adhere. In particular, the FTC has taken action
against firms that failed to disclose patents during the standard setting process and subsequently
tried to license the protected technology.6
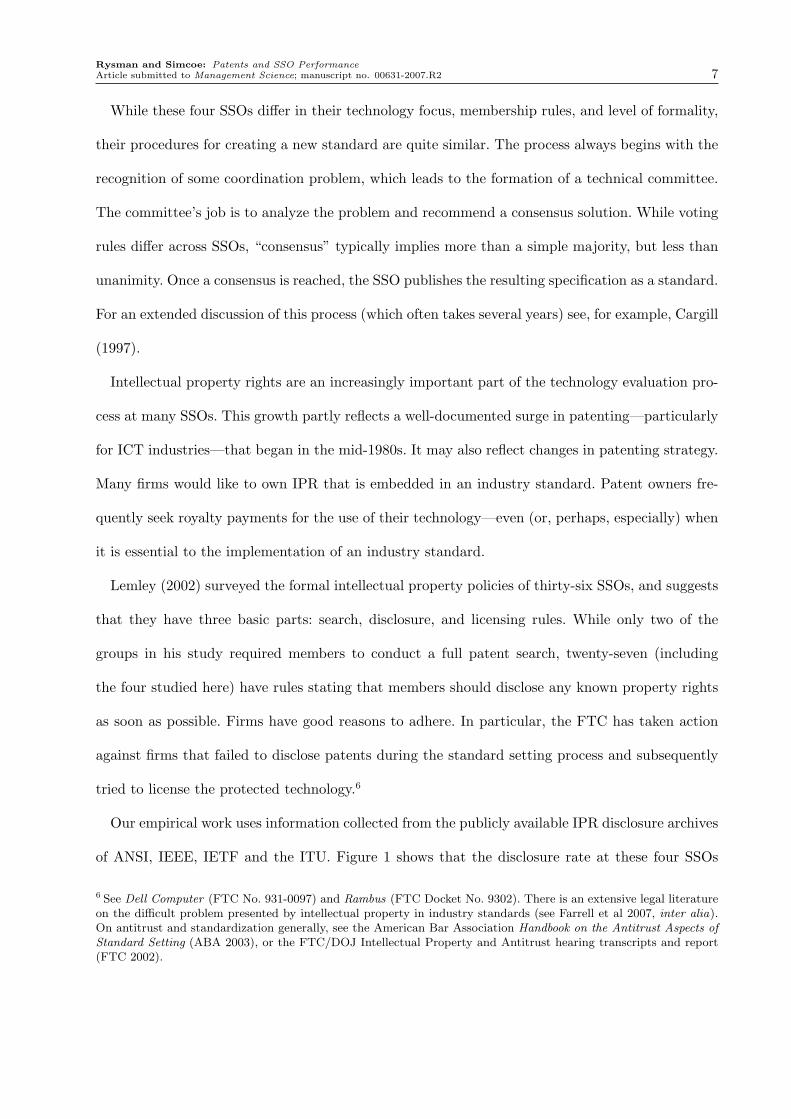
Our empirical work uses information collected from the publicly available IPR disclosure archives
of ANSI, IEEE, IETF and the ITU. Figure 1 shows that the disclosure rate at these four SSOs
6 See Dell Computer (FTC No. 931-0097) and Rambus (FTC Docket No. 9302). There is an extensive legal literatureon the difficult problem presented by intellectual property in industry standards (see Farrell et al 2007, inter alia).On antitrust and standardization generally, see the American Bar Association Handbook on the Antitrust Aspects ofStandard Setting (ABA 2003), or the FTC/DOJ Intellectual Property and Antitrust hearing transcripts and report(FTC 2002).

Rysman and Simcoe: Patents and SSO Performance8 Article submitted to Management Science; manuscript no. 00631-2007.R2
began to grow quite rapidly during the early 1990’s.7 This sustained growth reflects several factors:
the surge in ICT patents; increased demand for standards (driven by diffusion of the Internet and
wireless telecommunications); and a perceived strengthening of disclosure requirements, especially
in the wake of FTC actions.
Figure 1 Intellectual Property Disclosures
050
100
150
200
1981
1982
1983
1984
1985
1986
1987
1988
1989
1990
1991
1992
1993
1994
1995
1996
1997
1998
1999
2000
2001
2002
2003
2004
2005
ANSI IEEEIETF ITU
For our purposes, the rise in IPR disclosure means that we have access to a publicly available list
of patents associated with specific SSOs. Many features of these patents—such as the number of
citations they receive—are easily compared across different industries and time periods. Thus, dis-
closed patents provide a unique window through which to examine the economic and technological
significance of SSOs.
3. Data and Measurement
In this section, we discuss the contents of our data set and present some basic statistics. We then
provide a brief discussion of how we interpret a patent citation in our research.
3.1. Data
At most SSOs, an IPR disclosure consists of a letter (or email) indicating that a company owns
(or may own) intellectual property that is relevant to a proposed standard. We collected 1,664
disclosures filed between 1971 and 2006 at ANSI, IEEE, IETF or ITU. A close examination of these
7 We define a disclosure as an announcement on a given date by a single firm that it potentially owns one or morepieces of intellectual property needed to implement a proposed standard. When a firm claims that a single patentcovers two or more standards, each one counts as a separate disclosure. However, we only keep one copy of the patentin our data for analysis.

Rysman and Simcoe: Patents and SSO PerformanceArticle submitted to Management Science; manuscript no. 00631-2007.R2 9
letters reveals substantial variation in practice—both within and between SSOs. Some disclosures
contain detailed licensing terms and refer to specific patents, while others are simply general state-
ments regarding a firm’s willingness to offer a license. This variation in disclosure practices reflects
differences in SSO participants, policies, and objectives, as well as evolving industry norms with
respect to the entire issue of disclosure.8
Table 1 presents several summary statistics for our sample of IPR disclosures. The average
disclosure listed between 1.2 and 2.5 pieces of intellectual property (i.e. a specific patent or pending
application number). However, while some letters contained long lists of patents, a substantial
fraction at each SSO simply made “blanket” licensing assurances, or referred to unpublished patent
applications. Our analysis focuses on U.S. patents, which were listed in 20 to 30 percent of all
disclosures.
Table 1 IPR Disclosure Summary Statistics
IPR Disclosure Summary Patent Counts
First Total Average Lists U.S. U.S. TotalDisclosure Disclosures Size† Patent†† Patents Patents
ANSI 1971 278 2.04 0.33 194 222
IEEE 1983 390 2.48 0.31 425 588
IETF 1995 353 1.20 0.24 151 169
ITU 1983 643 1.99 0.22 337 532†Size is a count of the patent or application numbers listed in the disclosure.††Equals one if the disclosure provides one or more US patent numbers.
The last two columns in Table 1 show the total number of patents disclosed to each SSO. While
the majority of these patents were issued in the U.S. a number of international patents were also
disclosed. These international patents are often part of a “family” whose U.S. counterpart appears
in the estimation sample. After removing duplicate observations9, our review of the disclosure
letters published by ANSI, IEEE, IETF and ITU yields a pooled sample of 724 U.S. patents.
8 To provide a sense of this heterogeneity, we have reproduced two ANSI disclosure letters in the online appendix.Interested readers may also want to visit the public disclosure archives, such as the one located at www.ietf.org.
9 Table A-2, which may be found in the Appendix, shows that there is a small amount of overlap created by patentsdisclosed to more than one SSO.

Rysman and Simcoe: Patents and SSO Performance10 Article submitted to Management Science; manuscript no. 00631-2007.R2
Before turning to a closer examination of these patents, we pause to note several limitations of the
disclosure data. First, while it is trivial to link an IPR disclosure to an SSO, linking a disclosure to
a particular standard is often quite difficult. As a result, we observe only disclosures—not whether
the proposal became a standard, or whether the IPR was “essential” to the standard (i.e. whether
a license would be needed to create a legal implementation). Consequently, our sample of patents
will contain both “false positives” (non-essential patents or disclosures corresponding to a failed
proposal) and “false negatives” (unlisted but essential patents referenced in a “blanket” disclosure
or owned by non-participating firms).
Second, because we cannot link disclosures to standards, we do not observe when the SSO
reaches a consensus or makes a formal endorsement. While these dates are potentially important,
our analysis will focus on the disclosure date. The disclosure date is appealing as it represents the
moment when a link between the patent and a proposed standard becomes public information.
In practice, this tends to occur shortly before the emergence of a consensus. As noted above,
participants that delay for too long may forfeit their property rights. At the same time, premature
disclosure can be costly. For example, Chiao, Lerner and Tirole (2007) cite concerns that disclosure
may reveal sensitive information about a firm’s R&D strategy or spur efforts to “invent around”
a particularly strong patent.10 From a practical perspective, firms may save money by delaying
a full patent search until the outlines of a final specification become clear, since there is often
considerable uncertainty at the start of the standard-setting process.
Finally, it is unlikely that our sample of disclosed patents are broadly representative of the
technology evaluated by these four SSOs. Rather, these patents are likely to be concentrated within
several of the most commercially significant standard setting efforts. Nevertheless, we believe they
provide a unique window into the technology evaluated by SSOs, and can be used to address
important questions about SSO performance.
10 They also suggest that there is “news” in an IPR disclosures—even when the patent has already been granted andpublished by the USPTO. In particular, many firms indicate that the volume of issued patents can make the problemof identifying relevant property rights akin to finding a needle in a haystack.

Rysman and Simcoe: Patents and SSO PerformanceArticle submitted to Management Science; manuscript no. 00631-2007.R2 11
3.2. Descriptive statistics
We begin our evaluation of the SSO patents by linking them to the NBER U.S. patent data file
(Hall, Jaffe and Trajtenberg 2001), which contains several important variables, including appli-
cation and grant dates, assignee names, and citation counts.11 Table 2 compares the sample of
disclosed patents to a set of “control patents” with the same application year and primary tech-
nology class (nclass) as one or more SSO patents. The SSO patents contain more claims, receive
more citations, and are more likely to be part of an international “family” of patent applications.
They are also cited by patents from a broader set of technology classes, as indicated by the “gen-
erality” measure proposed in Henderson, Jaffe and Trajtenberg (1998).12 Prior research has shown
that these variables are positively correlated with a patent’s economic value. Table 2 also shows
that SSO patents are more likely to be assigned to a U.S. company, and reveals small differences
between a “matched” control sample (where the one-to-one match is based on application-year and
technology-class) and the set of all eligible controls.
While the control patents in Table 2 serve as a useful point of reference, it is unlikely that
they are a valid set of “controls” in the sense that they are statistically indistinguishable from
a pre-disclosure SSO patent. Our analysis uses the control patents to address macro changes to
the patenting regime, and our main results are based largely on variation within the SSO sample.
When we compare SSO patents to the control sample, it will be with an eye towards comparing
SSO patents to “average” patents, rather than patents that are truly identical but for disclosure.
3.3. What is a citation?
In the remainder of the paper, our primary measure of economic and technological significance
is based on forward-citations (i.e. cites that a focal patent receives from other patents). These
citations identify relevant “prior art” for an invention, thus delimiting the scope of its claims.
11 The NBER data have been updated through 2002 and are available on Bronwyn Hall’s web sitehttp://emlab.berkeley.edu/users/bhhall/bhdata.html. We are also grateful to Ajay Agrawal and Lee Fleming forproviding us with data on the citations from patents granted between 2003 and 2006.
12 This measure is 1−∑ni
j s2ij where sij is the share of citations received by patent i from class j (out of ni classes).
In other words, it is one minus a Herfindahl index based on patent classes.

Rysman and Simcoe: Patents and SSO Performance12 Article submitted to Management Science; manuscript no. 00631-2007.R2
Table 2 SSO Patent Characteristics
Pooled Sample Individual SSOs
Matched AllSSO Controls† Controls† ANSI IEEE IETF ITU
Total Claims 20.54 14.80 14.58 20.38 23.17 22.83 17.41
Total Cites 22.26 9.93 6.81 26.37 19.72 26.68 20.89
Cites/Year 2.36 1.16 0.92 2.41 2.19 3.14 2.18
Cites/Year/Claim 0.23 0.16 0.13 0.23 0.21 0.34 0.23
Generality 0.52 0.43 0.40 0.57 0.53 0.51 0.49
Int’l Family 0.42 0.33 0.31 0.37 0.39 0.29 0.56
Application Year 1992.7 1992.7 1993.9 1990.7 1993.6 1994.4 1992.0
Assignee TypeUS Company 0.67 0.57 0.56 0.73 0.70 0.71 0.57Foreign Company 0.26 0.36 0.38 0.17 0.23 0.19 0.39Other 0.07 0.07 0.06 0.10 0.07 0.11 0.04
Patents 724 724 185,357 131 267 101 225†Control patents have the same application-year and primary 3-digit USPTO technol-ogy classification (nclass) as one or more of the SSO patents. The “matched” controlsare a randomly selected one-to-one match (i.e. the joint distribution of application-yearand technology-class is identical to the SSO sample).
Because of this legal issue, patent citations are carefully vetted by the inventor, the inventor’s
attorney and the USPTO. However, there are still questions about exactly what a citation implies,
and what we can infer about economic processes from observing a patent citation.
One patent may obtain more citations than another for several reasons. To begin with, citations
may indicate efforts to build upon or invent around a specific technology, suggesting that a cited
patent has economic value. Harhoff et al (1999) document a positive relationship between cita-
tions and estimates of patent-value obtained from a survey of patent-holders. And Hall, Jaffe and
Trajtenberg (2005) show that citation-weighted patent counts are more correlated with a firm’s
market value than un-weighted patent counts.
However, differences in economic value are not the only reason a patent may garner more cita-
tions. A patent that is well-publicized (e.g. through disclosure to an SSO) might capture more cita-
tions. And if disclosure indicates a willingness to license on “reasonable” terms, forward-citations
may reflect follow-on innovations associated with a liberal licensing policy. Differences in the under-
lying technology could also influence citation rates. For example, patenting and citation patterns
differ across industries. Even within industry classifications, there is likely to be heterogeneity.

Rysman and Simcoe: Patents and SSO PerformanceArticle submitted to Management Science; manuscript no. 00631-2007.R2 13
For instance, within computing and electronics, platform technologies (i.e. those “at risk” for
standardization) might receive more citations because the nature of inter-operability makes them
relevant in a larger number of complementary markets. It seems possible (but not obvious) that
SSO endorsement can increase the “connectedness” of a patent without increasing its economic
value.
Since patent citations may arise from multiple sources such as economic value, publicity, licensing
practices, interconnectedness or other technological features, it is not obvious how to interpret
them. In this paper, we hold two interpretations simultaneously. If a reader wants to treat our
findings as purely descriptive, then citations are just a measure of how “interesting” a patent is,
where interest can arise from any of these sources. However, those willing to interpret citations as
a measure of economic value can use our results to infer the economic impact of SSOs. We provide
several statistics in support of this interpretation, e.g by showing that results are similar across
several control samples (including a group of “platform technologies”) and examining self-citations,
where issues of publicity should not play a role. However, definitively pinning down the meaning
of a citation is beyond the scope of this paper, and we approach our conclusions cautiously with
that thought in mind.
4. Citation Age Profiles
In this section, we examine the distribution of forward-citations to patents in the SSO and control
samples, focusing on the citation age profile—i.e. the average citation rate conditional on the age
of the cited patent. When comparing the age profile of SSO and control patents, we do not use
any information about the timing of disclosure (which may occur at any point during the life of
an SSO patent). Thus, we temporarily set aside the issue of selection versus marginal effects to
focus on the question of whether and for how long SSO patents are especially significant. Figure 2
illustrates our two main findings. First, SSO patents are cited at roughly twice the rate of the
controls. And second, SSO patents exhibit a different citation age-profile; specifically, a larger share
of their cumulative cites arrive in later years.

Rysman and Simcoe: Patents and SSO Performance14 Article submitted to Management Science; manuscript no. 00631-2007.R2
Figure 2 E[Cites|Age] for SSO and Control Patents
12
34
5A
vera
ge C
itatio
ns−3 0 3 6 9 12 15
Age Since Grant
Control Patents SSO Patents
In the remainder of this section, we estimate citation age profiles following an approach proposed
in Mehta, Rysman and Simcoe (2007). This method uses a full set of application- and citing-year
effects to control for various confounding factors — such as policy changes and funding issues at the
USPTO, increases in citation propensity over time, and differences in the technological significance
or “fertility” of various application-year cohorts. It is well known that one cannot identify a full set
of patent-age, application-year and citing-year effects in a linear model because age equals citation
year minus application year. Prior research on the age-profile of patent citations has relied on
non-linear functional form restrictions to solve this problem. Mehta, Rysman and Simcoe suggest
an alternative approach based on the assumption that the citation age process actually begins
when a patent is granted (rather than its application-year) and present evidence in favor of this
assumption for these data.13 Intuitively, the age effects are identified by comparing the citation
rate of patents from the same application-year cohort whose “age” differs as a result of variation
in the length of the USPTO review process.
We estimate a set of citation age profiles using the following model, where Cit is the number
of citations received by patent i in year t, αy are fixed effects for application year y, αt are fixed
effects for citing year t (as measured by the application year of the citing patent), αc are fixed
effects for the three-digit USPTO technology classification, αCTRLa and αSSO
a are the age effects for
13 The age process is meant to capture a process of diffusion and obsolescence. Plausibly, that process does not beginuntil the information in a patent is publicly available, which is the grant date for U.S. patents. If the publication lagis exogenous, this re-definition of “age” identifies a model containing age, year and cohort effects.

Rysman and Simcoe: Patents and SSO PerformanceArticle submitted to Management Science; manuscript no. 00631-2007.R2 15
the control patents and SSO patents at age a, εit is a patent-year error term that is uncorrelated
with the fixed effects, and f() is a Poisson process. Here, age is defined relative to the grant year g
(i.e. a= t−g), so patents will receive citations at negative ages if the application-year of the citing
patent is less than the grant-year of the cited patent.14
Cit = f(αy, αt, αc, αCTRLa , αSSO
a , εit) (1)
This specification is based on the assumption that application-year and citing-year effects are
identical for the SSO and control patents, but the age profiles can be different.15 While both the
control sample and the SSO sample contribute to identifying the application-year and citing-year
effects, the number of observations in the control sample dwarfs the number in the SSO sample.
Conceptually, we are using the control sample to identify the application-year and citing-year
effects, while estimating a separate age profile for each sample. Hence, the choice of the control
sample has little effect of the shape of the SSO age profile.
We limit the analysis to a period of about 15 years due to data availability. In particular, we have
very few observations on “old” SSO patents, since the majority were either granted or disclosed
near the end of the sample period.16 There is also some truncation of our dependent variable near
the end of the sample, since we do not observe citations made by patents with long pendency (i.e.
application-to-grant) lags. To compensate, we limit our analysis to citing-patents with application-
years prior to 2002 — even though we collected citations from patents granted through 2006. This
14 For the assumption that age begins at grant date to be exactly correct, it must be that these citations are addedby the patent examiner or turned up in a patent search as opposed to indicating an actual intellectual debt. Mehta,Rysman and Simcoe (2007) discuss this at length. In practice, we drop citations from ages below -2 from our dataset.
15 This additive specification also assumes that there is no “co-mingling” of the age, year and cohort effects (e.g.the age profiles are not changing over time). Mehta, Rysman and Simcoe (2007) provide evidence that the citationage-profile has remained relatively stable. We also experimented with interacting the citing-year and cohort effectsand found that it made little difference.
16 Figure A-1, which can be found in the Appendix, shows the application-year distribution for the SSO patents.While the truncation near the end of our sample might be an issue if the criteria for disclosure were changing rapidlyduring this time period, we find no evidence that this is the case. Table A-3, provides counts of the number of pre-and post-disclosure patent-year observations in our data set.

Rysman and Simcoe: Patents and SSO Performance16 Article submitted to Management Science; manuscript no. 00631-2007.R2
ensures that we only lose citations from patents with a pendency lag greater than five years, which
is observed for 1.02 percent of the patents in the NBER data.
We estimate Equation (1) separately on the pooled sample and for each SSO. Table A-4 provides
a complete set of age coefficients from these regressions. However, since it is difficult to evaluate
hypotheses about the shape of the age distribution using these coefficients, we focus on summary
statistics. In particular, we predict the number of citations conditional on age (setting the dummy
variables for application year 1999 and citation year 1999 on and leaving all other application
and citation years off) and use these values to compute a probability distribution. Then, we use
the probability distribution to compute an “average citation age” for each group of patents. We
compute standard errors for this statistic using the delta method, and test the hypothesis that the
mean citation-age is equal in the SSO and control samples.
Table 3 presents estimates of the “average citation age” using both the unadjusted age distri-
bution and the regression model. The average age is naturally higher when we use the regression
procedure, since it corrects for the truncation problem inherent in observing many patents near
the end of the sample period. The important point is that both methods indicate that SSO patents
receive a significantly greater share of their citations in later years. This result is particularly strik-
ing in light of the market value regressions in Hall Jaffe, and Trajtenberg (2005) that indicate that
“unexpected future citations” — which lead to a flatter age-profile — are more valuable than an
average cite.
Figures 3 and 4 graph the citation probability distributions over ages -2 to 12 as computed from
the regression results. Hall, Jaffe, and Trajtenberg (2001) draw similar graphs for a number of
groups of patents and always find peaks in the 4th or 5th year after application. This is consistent
with our control groups, which show peaks 1 to 2 years after the grant year. However, it contrasts
with the SSO patents, whose age distributions are substantially flatter. In each graph, we can see
that the SSO distribution is lower at low ages and higher at high ages, which implies that SSO
patents have a higher mean and median citation age.

Rysman and Simcoe: Patents and SSO PerformanceArticle submitted to Management Science; manuscript no. 00631-2007.R2 17
Table 3 Mean Citation Age
Raw Data Estimated PDF
Control SSO Control SSO Difference
Pooled Sample 2.50 4.26 4.16 4.97 0.81(0.00) (0.03) (0.05) (0.18) (0.17)
Highly Cited 2.60 4.26 4.39 5.08 0.69(0.00) (0.03) (0.06) (0.18) (0.18)
ANSI 3.11 5.94 4.47 5.40 0.93(0.00) (0.07) (0.08) (0.35) (0.34)
IEEE 2.22 4.43 4.22 5.03 0.81(0.00) (0.05) (0.08) (0.34) (0.33)
IETF 1.26 3.10 4.09 5.49 1.30(0.00) (0.05) (0.11) (0.29) (0.26)
ITU 2.50 4.24 4.06 4.81 0.76(0.00) (0.04) (0.08) (0.24) (0.23)
Mean citation ages for the Estimated PDF are an age-weightedaverage of fitted values from Equation (1). The standard errorsin parentheses were calculated using the delta method, startingfrom a heteroskedasticity-consistent covariance matrix clusteredon patents.
.02
.04
.06
.08
.1P
DF
−5 0 5 10 15Age Since Grant
Control pooled
Figure 3 Estimated Citation Age Profile for the Pooled Sample
One concern with these results may be that the high average citation age in the SSO sample
simply reflects greater overall importance. In other words, all highly cited patents might have a
similar age profile. We checked this by comparing the SSO patents to a set of highly cited controls:
patents in the top quartile of the cumulative cite distribution for a given grant-year technology-
class cohort. (This definition results in a control sample whose average citation rate is slightly
higher than the SSO patents.) The second row in Table 3 shows that with these controls, there is
a small (roughly 15 percent) and statistically insignificant drop in the difference in mean citation

Rysman and Simcoe: Patents and SSO Performance18 Article submitted to Management Science; manuscript no. 00631-2007.R2
age.
.02
.04
.06
.08
.1P
DF
−5 0 5 10 15Age Since Grant
Control ansi
.02
.04
.06
.08
.1P
DF
−5 0 5 10 15Age Since Grant
Control ieee
.02
.04
.06
.08
.1P
DF
−5 0 5 10 15Age Since Grant
Control ietf
.02
.04
.06
.08
.1P
DF
−5 0 5 10 15Age Since Grant
Control itu
Figure 4 Estimated Citation Age Profile for Individual SSOs
Another potential concern is that differences between samples may reflect different distributions
of application dates if the age profile is changing over time. However, Mehta, Rysman and Simcoe
(2007) examined this issue and found that the overall age profile is quite stable.
Perhaps the flatter age profile is characteristic of all platform technologies (i.e. those “at risk”
for standardization) and not just those disclosed to an SSO? There is no obvious way to identify
such a control sample. However, as an attempt along these lines, we take the set of all patents that
cite an IETF standard in their non-patent prior art, and compare them to both patents disclosed
in the IETF standards process and the baseline controls. (The basic premise is that patents citing
IETF standards are more likely to build upon or complement the Internet, making them plausible
platform technologies.) We focus on the IETF primarily because its naming conventions make it
particularly easy to locate relevant patents by searching for the string “RFCXXXX” in one or
more non-patent prior art citations. In principle, we could extend this analysis to other SSOs by
constructing a control sample based on patents that cite a disclosed patent. However, we are wary
of using the same observations to construct the dependent variable and serve as the control group.

Rysman and Simcoe: Patents and SSO PerformanceArticle submitted to Management Science; manuscript no. 00631-2007.R2 19
The non-patent prior-art cites provide a largely independent source of information for identifying
controls.
Using the USPTO’s Internet search engine, we identified 602 “platform technology” control
patents. We then re-estimated Equation (1) using the original IETF patents (both SSO and con-
trols) and the new set of platform technology patents. We continue to assume that technology-class,
application-year and calendar effects (αc,αy,αt) are constant across groups, but allow for three sep-
arate age profiles (αCTRLa ,αSSO
a ,αPLTFMa ). Because citations to IETF standards grew dramatically
in the early 1990’s, there is substantial right-censoring in the platform technology control sample.
We therefore limit the analysis to observations between -2 and 9 years since grant.
.04
.06
.08
.1.1
2P
DF
−2 −1 0 1 2 3 4 5 6 7 8 9Age Since Grant
Baseline IETFPlatform Tech Controls
Figure 5 Age Profile Comparison: IETF, Baseline controls and Platform technologies
The main results of this analysis are illustrated in Figure 5. The age profile for the platform
technology controls is quite similar to the baseline (technology class) control group, while the IETF
patents continue to receive relatively more cites in later years. The average citation age (computed
in the manner described above) is 3.61 for the platform technology controls, 3.74 for technology
class controls and 4.16 for patents disclosed to the IETF. The difference between the IETF and
the platform technology control patents is significant at a 90 percent level of confidence, and the
difference between the IETF and the larger technology class control patents is significant at a
Rysman and Simcoe: Patents and SSO Performance20 Article submitted to Management Science; manuscript no. 00631-2007.R2
99.9 percent confidence level. Thus, we find no evidence that the SSO patents’ unique citation age
profile is a characteristic of all platform technologies.
5. The Impact of SSOs
The previous section showed that patents disclosed to SSOs are cited more often than an average
patent and at later ages. While these findings suggest that SSO patents embody significant inven-
tions, the age profile results have two plausible interpretations. Differences between the SSO and
control patents could simply be a selection effect, whereby SSOs identify and endorse technologies
that are more likely to exhibit a particular age profile. On the other hand, if the SSO’s endorsement
and consensus-building activities lead firms to adopt and build upon patented technology when
they otherwise would not have, differences in the citation age profile will measure the marginal
effect, i.e. the causal impact of the formal standards process. We address this question by studying
the relationship between citation rates and the timing of disclosure. Our goal is to estimate the
impact of disclosure on the forward citation rate.
To do so, we discard the control patents and use only those patents disclosed to an SSO —
relying on variation in the timing of patent disclosures for identification. Specifically, we regress
the citation count on a set of patent fixed effects, citing-year effects and a dummy for disclosure,
using only SSO patents. In comparing this approach to that in the previous section, we can see
them as two extremes in the spectrum of constructing control groups. In the previous section, we
used a relatively broad set of controls. In this section, the “control sample” are patents that will
be disclosed to an SSO in the future.
Using pre-disclosure SSO patents to estimate a counter-factual citation rate controls for a great
many issues, including the inherent quality of the patent and the inter-connected nature of platform
technologies. In particular, a causal interpretation of these results does not rest on the maintained
assumption that patents are randomly selected for disclosure, but rather that an SSO patent’s age
at disclosure is exogenous to the citation process. While this assumption might still be violated,
we believe that it would be hard to construct a superior control group outside of a randomized

Rysman and Simcoe: Patents and SSO PerformanceArticle submitted to Management Science; manuscript no. 00631-2007.R2 21
setting. Our main results show that the impact of an SSO endorsement is statistically significant
and economically meaningful: disclosure generates a 19 to 47 percent increase in the citation rate.
Though we label the correlation between disclosure and citations the “marginal effect”, we do
not mean to overstate a causal interpretation of our results. If disclosure timing is correlated with
some unobserved process that causes citations, we cannot interpret the coefficient on the disclosure
dummy as causal. The sign of the associated bias is difficult to predict. For example, suppose there
is a large causal effect but SSO members can predict which patents will be disclosed and begin to
build upon or invent around them. In that case, SSO patents will start receiving citations before
the disclosure date, and our method will understate the impact of the SSO. A similar bias could
occur if patent examiners respond to disclosures by citing the SSO patents in pending applications
filed prior to the announcement. On the other hand, patent disclosures may be correlated with
time-varying unobservable events. If the usefulness of a patented idea becomes more apparent over
time, SSOs may select for emerging technologies around the time period when they begin to receive
a large number of citations. In this scenario, we would observe an increase in citations around
the date of disclosure even if there is no “true” marginal impact. In what follows, we attempt to
address this issue by studying pre-disclosure citation patterns. But regardless, these points caution
us in interpreting the coefficient on disclosure in causal terms.
5.1. Marginal Effects in the SSO Sample
In this sub-section, we use variation in the timing of SSO patent disclosures to estimate the marginal
effect. The advantage of using the disclosure year as a break point is that it is easily observed and
likely to occur within a few years of standardization. As we argued above, firms that delay for too
long risk losing their IPR, while disclosing too early has both practical and strategic costs.
Since we are no longer interested in separating the age, cohort and calendar effects, we rely on
a more flexible specification that includes individual patent fixed-effects. Specifically, we estimate
a fixed-effects Poisson model, where αDiscit is a post-disclosure dummy that captures the marginal
effect; αt are a set of citing-year effects; ageni are the non-linear terms from a fourth order polynomial

Rysman and Simcoe: Patents and SSO Performance22 Article submitted to Management Science; manuscript no. 00631-2007.R2
in age-since-grant for patent i; and γi is a patent conditional fixed-effect.17
Cit = f(αDiscit , αt, age
ni , γi, εit) (2)
While it is not possible to include a full set of age or cohort effects (since they are co-linear
with the calendar and patent fixed-effects), we include the non-linear age terms to capture the
hump-shaped age profile observed in Section 4 and earlier work.
By introducing patent-level fixed effects and dropping the control sample, this specification
controls for any time-invariant technology characteristics and addresses concerns about the selection
of SSO patents. In particular, αDiscit is estimated entirely off of within-patent variation in citation
rates and between-patent variation in the timing of disclosure.18 For example, if all SSO patents
were disclosed at the same age, αDiscit would not be identified, since it would be co-linear with some
combination of the patent and citing-year fixed-effects.
Table 4 presents our estimates of the disclosure effect. Each coefficient is a first-order approxima-
tion to the percentage change in the citation rate, though the figures discussed in the text are are
based on the incidence rate ratio exp(αDisc)−1, which provides a somewhat better approximation
for larger coefficients (e.g. above 0.3). Our main results are based on the pooled sample of SSO
patents. Since we are working with relatively small numbers of patents, the pooled estimates will
be less sensitive to outliers and timing issues than the individual SSOs. However, we include the
individual SSO results for comparison.
The first row of Table 4 presents our baseline estimates, which use a simple post-disclosure
dummy to estimate the marginal effect. The post-disclosure coefficient for the pooled sample indi-
cates that disclosure is associated with a 19 percent increase in the citation rate. The individual SSO
17 While the negative binomial model is widely used in similar settings, Wooldridge (1999) advocates for the fixed-effects Poisson, which provides a consistent estimate of the conditional mean function even when the dispersion ismis-specified. is consistent under quite general conditions. He also describes an estimator for the covariance matrix thatis robust to both hetero-skedasticity and arbitrary serial correlation in the dependent variable. Code for computingthese robust standard errors is available at http://www.rotman.utoronto.ca/timothy.simcoe/ and via the “ssc xtpqml”command in Stata.
18 Table A-3 shows that there is significant variation in disclosure timing. In particular, there are more than 30 pre-and post-disclosure SSO patent observations at each age from 0 to 10 years after the grant date.

Rysman and Simcoe: Patents and SSO PerformanceArticle submitted to Management Science; manuscript no. 00631-2007.R2 23
Table 4 Marginal Effects in the SSO Sample
DV = Citesit Pooled ANSI IEEE IETF ITU
Model 1: Baseline
PostDisclosure 0.177 0.215 0.059 0.285 0.175(0.086)** (0.139) (0.097) (0.113)** (0.129)
Patents 621 128 251 97 218Observations 5,337 1,317 1,962 686 2,046
Model 2: Marginal Effect Starts at Disclosure−2
PostDisclosure−2 0.221 0.230 0.186 0.328 0.328(0.075)*** (0.184) (0.090)** (0.132)** (0.133)**
Patents 621 128 251 97 218Observations 5,337 1,317 1,962 686 2,046
Model 3: Drop 2 year pre-disclosure window
PostDisclosure 0.388 0.257 0.227 0.659 0.569(0.128)*** (0.257)* (0.128)* (0.191)*** (0.242)**
Patents 571 120 227 90 204Observations 4,339 1,084 1,562 582 1,700
* Significant at 10%; ** Significant at 5%; *** Significant at 1%. Robuststandard errors in parentheses. Each column is based on the fixed-effectPoisson specification in Equation 2. Jointly significant age and citing-yeareffects are not reported. For pre- and post-disclosure SSO patent sample-sizesrefer to Table A-3.
results show a positive and statistically significant disclosure effect at the IETF—corresponding to
an increase of roughly 33 percent. The ANSI and ITU coefficients are comparable to the pooled
effect, but statistically insignificant, and the IEEE effect is negligible.
The second and third panels in Table 4 consider models that use alternative definitions of disclo-
sure. In Model 2, we artificially move the disclosure date forward by two years to look for evidence of
a large pre-disclosure citation increase. In this specification, the pooled sample coefficient increases
slightly, and there is an increase in the marginal effect at each of the individual SSOs. In par-
ticular, the post-disclosure coefficient becomes statistically significant for both IEEE and ITU.
These results suggest variation in the amount of measurement error on our post-disclosure variable
across the four SSOs in our sample. However, we find the relatively stable pooled sample results
reassuring.
Model 3 returns to the standard definition of disclosure, but omits any observations that fall
within a 2 year pre-disclosure window. Intuitively, this increases the likelihood that the baseline
against which post-disclosure citation increases are measured precedes the start of the standard

Rysman and Simcoe: Patents and SSO Performance24 Article submitted to Management Science; manuscript no. 00631-2007.R2
setting process. Not surprisingly, this also leads to an increase in the estimated marginal effects—in
this case for the pooled sample, as well as all four individual SSOs. The pooled sample coefficient in
this specification corresponds to a 47 percent increase in the baseline citation rate. While this is a
substantial increase, it is not statistically different from the baseline estimate. In this specification,
the marginal effect is positive and statistically significant at the 10-percent level or better for each
of the individual SSOs.
Comparing the results of these three different models suggests that the marginal effect of dis-
closure on citation rates is somewhere between 19 and 47 percent. Some of this increase predates
the actual disclosure letter. However, the results from Model 1 indicate that this effect continues
for several years after disclosure occurs. (We present more evidence on the timing of the disclosure
effect below.)
We performed a number of robustness checks and considered several alternative specifications
for these results (see Appendix Table A-5). To examine whether the marginal effect is actually
driven by “publicity effects” or increased awareness of the patent following disclosure — as opposed
to increased economic or technological significance — we examined the impact of disclosure on
self-citations. With self-citations, the citing and cited patent are owned by the same assignee, so it
is harder to argue that this firm was simply unaware of the cited technology before disclosure. The
self-citation analysis yields point estimates that are very similar to the marginal effects reported
above, although none of them are statistically significant (in part because roughly half of the SSO
patents receive no self-citations and are dropped from the regression).
We also estimated this model using OLS and a fixed-effects negative binomial specification. In
both cases, the results are consistent with our earlier estimates. Finally, we interacted the post-
disclosure variable with a dummy for whether the SSO patent was above the 75th percentile in
terms of cumulative pre-disclosure citations (relative to other patents with the same grant year).
In a Poisson specification, SSO patents below this threshold show a larger disclosure effect while
the opposite holds true for an OLS regression. While this is not surprising, it suggests that our

Rysman and Simcoe: Patents and SSO PerformanceArticle submitted to Management Science; manuscript no. 00631-2007.R2 25
main results are not driven by a small set of patents at either end of the pre-disclosure cumulative
citation distribution.
One drawback of a model with patent fixed-effects is that it precludes the estimation of a single
time-invariant “SSO effect” which might provide a useful point of comparison for the marginal
effects. To examine this additional benchmark, we re-introduce the full set of control patents and
estimate a specification with technology-class, cohort and calendar effects, a single age profile for
both SSO and control patents, and dummies for both an SSO and a disclosure effect. That is,
we estimate Equation (1) with a single set of age coefficients, and dummy variable to capture
the SSO and disclosure effects (see Appendix Table A-6 for results). While imposing a single age
profile contradicts our results in Section 4, doing so allows for a direct comparison of the SSO
coefficient and the disclosure coefficient (i.e. the selection effect and the marginal effect), which we
find compelling.
The disclosure effect in this pooled cross-sectional specification is remarkably similar to the
estimates produced by Equation (2): around 28 percent in the pooled sample. The selection effect
is four times larger. Thus, 20 percent of the difference between the patents disclosed to an SSO
and an average patent is due to disclosure, while 80 percent is a selection effect. Although we do
not have strong prior beliefs about this statistic, these estimates strike us as quite reasonable.
5.2. Disclosure Timing and Citation Trends
We would like to interpret the post-disclosure parameter as a causal effect that measures the
impact of an SSO’s formal endorsement (and other consensus-building activities) on the economic
and technological significance of a particular patent. However, this interpretation rests on the
assumption that disclosure timing is exogenous. While it is not possible to test this assumption, we
can look for supporting evidence in the pre-disclosure citation trends. We have already discussed
several reasons why the marginal effect might pre-date a formal IPR disclosure, such as lags between
the date when a committee learns about a patent and the formal disclosure letter. Nevertheless, the
absence of a sustained increase in SSO patent citation rates — relative to an appropriate control

Rysman and Simcoe: Patents and SSO Performance26 Article submitted to Management Science; manuscript no. 00631-2007.R2
sample — over the full pre-disclosure period would provide some evidence in favor of the causal
interpretation.
In this sub-section we use a series of age-relative-to-disclosure dummies to more carefully discern
how citation patterns change over time. This exercise requires the use of a control sample, since
the age-relative-to-disclosure dummies are co-linear with the patent and citing-year effects (or the
SSO effect in a cross-sectional model). Also, as this is a demanding task for our data set, we focus
on an eleven year time-window centered on the disclosure year.
We estimate two models. The first regression uses the broad set of technology-class control
patents, and adds a full set of age-relative-to-disclosure dummies to Equation (1), which already
includes a separate set of age-relative-to-grant-year effects for both SSO and control patents. The
second specification uses our sample of “highly-cited” controls (i.e. patents above the 75th per-
centile of the cumulative cite distribution within a technology-class grant-year cell) and replaces
the disclosure dummy in Equation (2) with a set of age-relative-to-disclosure effects. While the
cross-sectional specification will be more sensitive to patent-level heterogeneity and the composi-
tion of the SSO and control samples, the fixed-effects model assumes that the SSO and control
patents share a common age-profile. In practice, the fixed-effects model produces similar results if
we use the full set of control patents, since all un-cited patents are excluded from the estimation
procedure.
Figure 6 graphs our estimates of the pre- and post-disclosure SSO patent citation-trajectory,
along with a 95 percent confidence interval (the left-panel shows cross-sectional estimates, while
the right panel displays fixed-effects results). In both models, the SSO patent citation rate declines
relative to the controls from 5 until 2 years before disclosure, though the error bands show that we
cannot reject the null hypothesis of no difference in the pre-disclosure trends. In other words, the
SSO and control patents have a similar citation trajectory (conditional on age, citing-year, etc.) up
that point. The point estimates show that SSO patents begin to experience an increase in citations
two years before disclosure, and this trend lasts for a roughly five years, by which time the error
bands show that our estimates are fairly imprecise.

Rysman and Simcoe: Patents and SSO PerformanceArticle submitted to Management Science; manuscript no. 00631-2007.R2 27
−.4
−.2
0.2
.4E
stim
ated
Coe
ffici
ent
−5 −4 −3 −2 −1 0 1 2 3 4 5
Years Since Disclosure
Coefficeint 95% CI
Pooled cross−section (all controls)
−.4
−.2
0.2
.4E
stim
ated
Coe
ffici
ent
−5 −4 −3 −2 −1 0 1 2 3 4 5
Years Since Disclosure
Coefficeint 95% CI
Patent fixed effects (highly−cited controls)
Figure 6 Pre and Post-disclosure SSO Effects
As we have already discussed, there are a number of potential explanations for the observed
pre-disclosure “citation bump.” In particular, it may provide evidence that SSO patent disclosures
are correlated with a patent’s unobserved time-varying technological significance. However, we are
encouraged by the absence of a clear trend in the relative citation rate of the SSO patents from 5
until 2 years before disclosure. In particular, the data do not reject the hypothesis that the SSO
and control patents have a parallel citation trajectory during that time period. (We also verified
this claim by running models with a pre-disclosure time-trend for SSO patents, which was always
statistically insignificant.) These results provide some support for the assumption that disclosure-
timing is exogenous to the citation process. If this assumption is correct, pre-disclosure SSO patents
will provide an unbiased estimate of the counterfactual citation rate, and it would be appropriate
to place a causal interpretation on the estimated marginal effect.
Overall, we find that across several different SSOs and estimation methods, citation rates con-
sistently increase by 19 to 47 percent following the disclosure of a patent to an SSO. We remain
cautious about placing a strong causal interpretation on these results — primarily because it is
impossible to test whether firms or SSOs can select patents based on time varying unobserved
variables that are correlated with future citations. Nevertheless, lacking any truly exogenous events
that push patents into SSO standards, our approach provides a reasonable starting point for iden-
tifying the causal impact of SSOs.

Rysman and Simcoe: Patents and SSO Performance28 Article submitted to Management Science; manuscript no. 00631-2007.R2
We conclude this section by noting that our focus on marginal effects does not imply that we
find selection effects uninteresting. Rather, the existence of a significant marginal effect — which
we interpret as evidence that SSOs’ consensus-building efforts can have a significant impact —
reinforces the importance of identifying the best possible technologies. The presence of substantial
selection effects is therefore both reassuring and consistent with SSO claims regarding the role of
“technical merit” in the evaluation process.
6. Conclusions
While the importance of SSOs has been widely discussed, there have been no attempts to system-
atically measure the effects of these institutions. This paper is the first to address this question
using patent citations as a measure of SSO performance. Our approach leads immediately to the
question of causality. Specifically, do SSOs’ efforts to promote industry coordination confer an
advantage on the standards they promote, or do these groups merely identify or attract important
technologies?
We find substantial evidence that SSOs identify and endorse important technologies. In partic-
ular, patents disclosed in the standard setting process receive roughly twice as many citations as
a set of controls from the same technology-class and application-year. We also find a significant
increase in the citation rate of SSO patents following disclosure, which we use as a proxy for the
arrival of a new standard. Citations after disclosure are 19 percent higher in our base specification.
Even if one were to interpret these results entirely in terms of selection, they suggest that SSO’s
perform well in selecting important technologies. To the extent that the correlation of citations
with disclosure represents a causal effect, the results show that SSO’s contribute to the lasting
significance of the technologies they endorse.
These findings have significant managerial implications, particularly within the information and
communications technology sector, where SSOs frequently define the parameters that enable new
products to operate within existing platforms. For the consumers of voluntary consensus standards,
our findings are largely reassuring: large selection effects suggest these four SSOs are discriminating

Rysman and Simcoe: Patents and SSO PerformanceArticle submitted to Management Science; manuscript no. 00631-2007.R2 29
in the technology evaluation process, and significant marginal effects indicate success in promoting
industry coordination. For technology sponsors who question whether SSO participation is a wise
investment of time and resources, our results suggest that the answer can be yes — particularly if
we interpret the marginal effect as a causal relationship between SSO endorsement and subsequent
technology adoption. But these benefits do not come free. To secure an SSO endorsement, firms
typically give up some rights in their proprietary technology. Thus, our citation-based evidence
provides some insight into the trade-off between co-operating to create value and competing to
capture it. However, this evidence is just one part of a larger cost benefit calculation that may also
incorporate competitive factors, coalition building and parallel efforts to establish a standard in
the marketplace.
Our principal findings are also relevant to current policy debates regarding intellectual property
and compatibility standards. In particular, any evidence that SSO endorsement can add value to
a patented technology helps to justify recent policy initiatives aimed at promoting clarity and
preventing manipulation of the standards process. Standards implementers should take a keen
interest in these policies, which may help limit their exposure to “hold up” by other members of
an SSO. However, we should acknowledge that it is hard to draw clear welfare implications from
our current results. The impact of IPR on industry standards and cumulative technical progress
will depend on SSO rules and participants’ willingness to abide by them, as well as related public
policy.
More generally, our findings raise a variety of questions for future research. For example, with
data from a larger sample of SSOs, one might examine how selection and marginal effects vary
with changes in SSO policies, procedures or membership. Our methods for estimating the citation
age profile might be used to compare SSO patents to a control sample based on de facto industry
standards. And to the extent that our findings link SSO endorsement to the economic value of
a technology, our results raise a variety of interesting questions about competition within and
between SSOs.

Rysman and Simcoe: Patents and SSO Performance30 Article submitted to Management Science; manuscript no. 00631-2007.R2
Finally, though we have focused on compatibility standards, our analysis may offer some insights
into the broader topic of industry self-regulation. In particular, non-government organizations
increasingly use SSOs such as the Forest Sustainability Council or Fair Trade Labeling Organi-
zations International to create voluntary codes of corporate conduct. These efforts rely on the
consensus process, and raise questions about agenda selection versus marginal effects that are
very similar to those examined here. However, much work remains to determine whether and how
much compatibility standard setting can teach us about standardization in these other domains.
In particular, there is a clear need for theories that illustrate how the post-SSO process of market
or political competition influences SSO participation, agenda formation and standards selection,
and how these forces vary when standards promote quality or social responsibility as opposed to
product inter-operability.
Acknowledgments
Financial support for this research was provided by CITRIS, and the NET Institute. The comments of
two referees and the associate editor greatly improved the paper. Also, we received useful comments from
Kevin Lang, Josh Lerner, David Mowery, Bronwyn Hall, Avi Goldfarb, Shane Greenstein, Ken Corts, Katrin
Cremers, Catherine Tucker, Michael Ward and seminar participants at the FTC, Brandeis, UC Berkeley,
the International Industrial Organization Conference in Boston (2006), the NET Institute Conference (NY,
2006) and the Dartmouth Industrial Organization Conference (2007).
Rysman and Simcoe: Patents and SSO PerformanceArticle submitted to Management Science; manuscript no. 00631-2007.R2 31
References
Allison, J., M. Lemley, K. Moore, R Trunkey. 2004. Valuable patents. The Georgetown Law Journal 92
435–478.
Besen, S. M., J. Farrell. 1991. The role of the ITU in standardization - pre-eminence, impotence or rubber
stamp. Telecommunications Policy 15(4) 311–321.
Besen, S. M., Leland Johnson. 1988. Compatibility standards, competition and innovation in the broadcasting
industry. RAND Study R-3453-NSF .
Besen, S. M., G. Saloner. 1989. The economics of telecommunications standards. R. Crandall, K. Flamm,
eds., Changing the Rules: Technological Change, International Competition, and Regulation in Telecom-
munications. Brookings, Washington, 177–220.
Bolin, S., ed. 2002. Standards Edge: The Golden Mean. Bolin Communications, Ann Arbor.
Bresnahan, T. F., S. Greenstein. 1999. Technological competition and the structure of the computer industry.
Journal of Industrial Economics 47(1) 1–40.
Cargill, Carl F. 1997. Open Systems Standardization : A Business Approach. Prentice Hall PTR, Upper
Saddle River, NJ.
Chiao, B., J. Lerner, J. Tirole. 2007. The rules of standard setting organizations: An empirical analysis.
RAND Journal of Economics 38(4) 905–930.
Cusumano, M. A., A. Gawer. 2002. The elements of platform leadership. MIT Sloan Management Review
43(3) 51.
Farrell, J., G. Saloner. 1988. Coordination through committees and markets. Rand Journal of Economics
19(2) 235–252.
Farrell, J., T. Simcoe. 2006. Choosing the rules for formal standardization. Unpublished manuscript .
Furman, J., S. Stern. 2006. Climbing atop the shoulders of giants: The impact of institutions on cumulative
research. Unpublished manuscript .
Gawer, A., R. Henderson. 2007. Platform owner entry and innovation in complementary markets: Evidence
from Intel. Journal of Economics and Management Strategy 16(1) 1–34.
Hall, B. H., A. Jaffe, M. Trajtenberg. 2001. The NBER patent citations data file: Lessons, insights and
methodological tools. NBER Working Paper No. 8498 .

Rysman and Simcoe: Patents and SSO Performance32 Article submitted to Management Science; manuscript no. 00631-2007.R2
Hall, B. H., A. Jaffe, M. Trajtenberg. 2005. Market value and patent citations. Rand Journal of Economics
36(1) 16–38.
Harhoff, D., F. Narin, F. M. Scherer, K. Vopel. 1999. Citation frequency and the value of patented inventions.
Review of Economics and Statistics 81(3) 511–515.
Hawkins, R., R. Mansell, J. Skea. 1995. Standards, Innovation and Competitiveness : The Politics and
Economics of Standards in Natural and Technical Environments. Edward Elgar, Hants England ;
Brookfield, Vt., US.
Henderson, R., A. B. Jaffe, M. Trajtenberg. 1998. Universities as a source of commercial technology: A
detailed analysis of university patenting, 1965-1988. Review of Economics and Statistics 80(1) 119–127.
Jaffe, A., M. Trajtenberg. 2004. Patents, Citations and Innovations: A Window on the Knowledge Economy .
MIT Press, Cambridge.
Kaplan, J. 1996. Startup : A Silicon Valley Adventure. Penguin Books, New York.
Leiponen, A. 2006. Competing through cooperation: Standard setting in wireless telecommunications. Unpub-
lished manuscript .
Lemley, M. 2002. Intellectual property rights and standard setting organizations. California Law Review 90
1889–1981.
Lerner, J., J. Tirole. 2006. A model of forum shopping. American Economic Review 96(4) 1091–1113.
Lerner, J., J. Tirole, M. Strojwas. 2003. Cooperative marketing agreements between competitors: Evidence
from patent pools. NBER Working Paper No. 9680 .
Mehta, A., M. Rysman, T. Simcoe. 2006. Identifying the age profile of patent citations.
http://ssrn.com/abstract=892457 .
Mowery, D. C., T. Simcoe. 2002. Is the internet a us invention? - an economic and technological history of
computer networking. Research Policy 31(8-9) 1369–1387.
Shapiro, Carl, Hal R. Varian. 1998. Information Rules : A Strategic Guide to the Network Economy . Harvard
Business School Press, Boston, Mass.
Simcoe, T. 2006. Standard setting committees. http://ssrn.com/abstract=899595 .
Updegrove, Andrew. 2003. Survey: Major standards players tell how they evaluate standard setting organi-
zations. Consortium Standards Bulletin 2(7) http://www.consortiuminfo.org/bulletins/jun03.php.

Rysman and Simcoe: Patents and SSO PerformanceArticle submitted to Management Science; manuscript no. 00631-2007.R2 33
Weiss, M., M. Sirbu. 1990. Technological choice in voluntary standards committees: An empirical analysis.
Economics of Innovation and New Technology 1 111–134.
Wooldridge, J. 1999. Distribution-free estimation of some nonlinear panel data models. Journal of Econo-
metrics 90(1) 77–97.

Rysman and Simcoe: Patents and SSO Performance34 Article submitted to Management Science; manuscript no. 00631-2007.R2
This page is intentionally blank. Proper e-companion titlepage, with INFORMS branding and exact metadata of themain paper, will be produced by the INFORMS office whenthe issue is being assembled.

Rysman and Simcoe: Patents and SSO PerformanceArticle submitted to Management Science; manuscript no. 00631-2007.R2 35
Appendix 1 : Supporting Tables & Figures
Table A-1 Technology Classification of SSO Patents†
ANSI IEEE IETF ITU Totals
Computers & Communications 41 135 30 83 289
Computer Hardware & Software 56 95 65 80 296
Information Storage 10 7 2 0 19
Misc. Electrical 1 1 0 46 48
All Others 23 27 4 16 71
Total 131 267 101 225 724†Based on subcategory classifications in the NBER U.S. patentdatabase.
Table A-2 SSO Patent Overlap
ANSI IEEE IETF ITU
ANSI patents 131 5 7 19
IEEE patents 5 267 10 1
IETF patents 7 10 101 5
ITU patents 19 1 5 225
Total patents 162 283 123 247
020
4060
80
1974
1975
1977
1978
1979
1980
1981
1982
1983
1984
1985
1986
1987
1988
1989
1990
1991
1992
1993
1994
1995
1996
1997
1998
1999
2000
2001
ANSI IEEEIETF ITU
Figure A-1 SSO Patent Application Years

Rysman and Simcoe: Patents and SSO Performance36 Article submitted to Management Science; manuscript no. 00631-2007.R2
Table A-3 SSO Patent Observations by Age∗ (Pre & Post Disclosure)
Pooled Sample ANSI IEEE IETF ITU
Pre Post Disclosed† Pre Post Pre Post Pre Post Pre Post
Age -2 516 1 4 94 0 220 0 89 0 177 1
Age -1 631 5 56 124 0 260 2 101 0 218 3
Age 0 533 60 90 113 12 211 22 87 6 191 22
Age 1 395 142 58 73 39 166 40 64 18 144 55
Age 2 300 181 43 52 56 122 57 49 17 122 63
Age 3 231 193 20 40 60 94 64 41 13 94 71
Age 4 186 189 23 33 60 76 61 32 11 76 72
Age 5 150 196 14 28 63 62 61 25 12 60 75
Age 6 122 181 14 26 60 48 54 21 11 50 72
Age 7 98 162 14 23 57 36 43 17 8 42 66
Age 8 76 146 15 21 48 24 41 14 6 34 60
Age 9 54 135 11 15 43 16 40 13 3 25 54
Age 10 38 120 6 11 37 7 42 10 2 22 45
Age 11 29 97 9 10 28 6 30 5 5 16 43
Age 12 15 83 5 5 29 5 24 4 5 8 35
Age 13 8 72 1 4 25 3 23 4 4 3 30
Age 14 6 61 1 4 24 2 21 4 1 2 23
Age 15 4 46 1 3 19 1 16 1 0 2 16
Age 16 3 38 1 1 18 0 14 1 0 2 12
Age 17 2 29 0 0 15 0 9 1 0 2 11
Age 18 1 20 0 0 8 0 8 1 0 1 7
Age 19 1 15 0 0 7 0 7 0 0 1 4
Age 20 1 12 0 0 7 0 6 0 0 1 2
Totals 3,400 2,184 386 680 715 1,359 685 584 122 1,293 842∗ Age measured relative to grant-year of the disclosed patent.† This column reports the number of SSO patents disclosed at a given age.

Rysman and Simcoe: Patents and SSO PerformanceArticle submitted to Management Science; manuscript no. 00631-2007.R2 37
Table A-4 Age Effects for SSO and Control Patents
Pooled Sample ANSI IEEE IETF ITU
SSO Control SSO Control SSO Control SSO Control SSO Control
Age -2 0.649 0.174 0.575 1.068 -0.032
Age -1 1.124 0.517 0.821 0.526 1.059 0.463 1.302 0.415 0.863 0.514
Age 0 1.406 0.800 1.230 0.833 1.315 0.727 1.530 0.613 1.384 0.816
Age 1 1.613 0.970 1.544 1.019 1.592 1.884 1.517 0.794 1.621 1.982
Age 2 1.645 0.967 1.760 1.018 1.467 1.871 1.674 0.799 1.761 1.978
Age 3 1.676 0.906 1.783 0.965 1.538 1.795 1.752 0.756 1.785 1.913
Age 4 1.735 0.820 1.909 0.872 1.479 1.723 1.959 0.687 1.765 0.808
Age 5 1.669 0.706 1.939 0.767 1.514 0.643 1.943 0.565 1.669 0.678
Age 6 1.583 0.586 1.817 0.693 1.429 0.556 1.821 0.375 1.521 0.536
Age 7 1.454 0.476 1.622 0.649 1.340 0.489 1.567 0.300 1.358 0.409
Age 8 1.281 0.336 1.463 0.568 1.267 0.345 1.796 0.173 0.979 0.257
Age 9 1.264 0.229 1.632 0.513 1.088 0.180 1.795 0.048 1.008 0.147
Age 10 1.256 0.142 1.201 0.419 1.099 0.125 1.915 -0.062 1.158 0.055
Age 11 1.223 -0.011 1.460 0.224 0.995 -0.044 1.510 -0.102 1.195 -0.045
Age 12 1.318 -0.137 1.449 0.067 1.478 -0.223 1.719 -0.372 0.971 -0.155
Observations 1,278,584 622,636 605,514 249,633 639,841
Regressions based on Equation (1), including a full set of unreported application- and citing-year effects.

Rysman and Simcoe: Patents and SSO Performance38 Article submitted to Management Science; manuscript no. 00631-2007.R2
Table A-5 Robustness & Specification Checks
PooledDV = Citesit Sample ANSI IEEE IETF ITU
DV = Self-Citations
PostDisclosure 0.237 0.326 0.268 -0.130 0.257(0.151) (0.257) (0.314) (0.329) (0.227)
Patent Fixed Effects Y Y Y Y YCiting-year & age controls Y Y Y Y YPatents 321 79 121 54 105Observations 3,064 882 1,000 387 1,089
Ordinary Least Squares
PostDisclosure 0.915 1.752 0.151 2.986 0.877(0.248)*** (0.514)*** (0.425) (1.039)*** (0.404)**
Patent Fixed Effects Y Y Y Y YCiting-year & age controls Y Y Y Y YPatents 649 131 267 101 225Observations 5,445 1,339 2,000 699 2,092
Fixed Effects Negative Binomial
PostDisclosure 0.352 0.470 0.344 0.295 0.367(0.043)*** (0.098)*** (0.069)*** (0.095)*** (0.076)***
Patent Fixed Effects Y Y Y Y YCiting-year & age controls Y Y Y Y YPatents 621 128 251 97 218Observations 5,337 1,317 1,962 686 2,046
Pre-Disclosure Cites & Marginal Effects (Pooled Sample)
Specification Poisson OLS
PostDisc * Above Cutoff† 0.096 1.832(0.089) (0.290)***
PostDisc * Below Cutoff 0.748 -0.299(0.142)*** (0.320)
Patent Fixed Effects Y YCiting-year & age controls Y YPatents 621 639Observations 5,337 5,445
* Significant at 10%; ** Significant at 5%; *** Significant at 1%. Robust standard errors inparentheses. Each column is based on the fixed-effect Poisson specification in Equation 2.Age coefficients and citing-year effects not reported. For pre- and post-disclosure SSOpatent sample-sizes refer to Table A-3. †Cutoff is the seventy-fifth percentile of the pre-disclosure cumulative cite distribution within a grant-year cohort.

Rysman and Simcoe: Patents and SSO PerformanceArticle submitted to Management Science; manuscript no. 00631-2007.R2 39
Table A-6 Pooled Cross-sectional Estimates of Selection and Marginal Effects
DV = Citesit Pooled ANSI IEEE IETF ITU
Baseline Model: Age, Year, Cohort & Technology-class Effects
SSO Patent 0.713 0.521 0.712 1.100 0.663(0.051)*** (0.115)*** (0.081)*** (0.088)*** (0.091)***
PostDisclosure 0.247 0.561 0.175 0.129 0.308(0.078)*** (0.171)*** (0.123) (0.186) (0.114)**
Observations 1,318,816 460,036 623,606 251,997 654,054
Saturated Model: Age-Year, Cohort & Technology-class Effects
SSO Patent 0.710 0.524 0.710 1.067 0.661(0.031)*** (0.066)*** (0.048)*** (0.085)*** (0.053)***
PostDisclosure 0.250 0.545 0.187 0.170 0.307(0.053)*** (0.096)*** (0.076)** (0.102)* (0.092)***
Observations 1,318,807 460,036 623,606 251,979 653,993
Selection Effect Time-trend
SSO Patent 0.680 0.781 0.505 1.165 0.949(0.111)*** (0.152)*** (0.231)** (0.180)*** (0.187)***
SSO * (DiscYear-2000) -0.012 0.028 -0.074 0.090 0.048(0.020) (0.026) (0.037)** (0.084) (0.032)
PostDisclosure 0.233 0.457 0.055 0.266 0.252(0.078)*** (0.176)*** (0.147) (0.106)** (0.111)**
Observations 1,317,205 459,844 623,606 251,580 653,488
* Significant at 10%; ** Significant at 5%; *** Significant at 1%. Robust standard errors(clustered on patents) in parentheses. Each column is based on the Poisson QML specifica-tion in Equation ??. Application-year, citing-year, age, and technology-class fixed-effectsnot reported. For SSO patent sample-sizes refer to Table A-3.

Rysman and Simcoe: Patents and SSO Performance40 Article submitted to Management Science; manuscript no. 00631-2007.R2
Appendix 2 : Sample Disclosure Letters

Rysman and Simcoe: Patents and SSO PerformanceArticle submitted to Management Science; manuscript no. 00631-2007.R2 41
Heather Benko
From: [email protected]
Sent: Wednesday, January 12, 2005 4:18 PM
Subject: IPR/Patent Holder Statement
Page 1 of 1
1/12/2005
Document InformationReference Doc. No. PN-3-3972-UGRV.SF1
(refer to Project Number, Standards Proposal Number or title--one form per document. Note, may fill one statement for a document with multi-parts.)
Publication ID TIA-733-A [SF1]
Document Title Software Distribution for TIA-733-A - High Rate Speech Service Option17 for Wideband Spread Spectrum"
General InformationYour Name Michael WangYour TitleCompany Nortel NetworksCompany Phone 972-684-2848IPR Contact Michelle LeeAddress1 Mail Stop 036NO151Address2 8200 DIXIE ROAD SUITE 100City BRAMPTONState ONTARIOZip L6T 5P6Country CANADAPhone Number 905-863-1148"Fax NumberEmail [email protected] Nortel Networks states: 2b. A license under any Essential Patent(s) or published pending patent application(s) held by the undersigned company will be made available under reasonable terms and conditions that are demonstrably free of any unfair discrimination to applicants only and to the extent necessary for the practice of the TIA Publication. 3a. The commitment to license above selected will be made available only on a reciprocal basis. The term 'reciprocal' means that the licensee is willing to license the licensor in compliance with either (2a) or (2b) above as respects the practice of the TIA Publication.


![Welcome [learning.acm.org] · Public-sector mechanisms • Procurement regulations • Tax and other financial incentives • Public recognition • Voluntary standards setting by](https://img.pdfslide.net/doc/110x75/5f02b2d57e708231d40590a9/welcome-public-sector-mechanisms-a-procurement-regulations-a-tax-and-other.jpg)