Embed Size (px)
Citation preview

12 Jul 2002 9:59 AR AR165-PY40-13.tex AR165-PY40-13.SGM LaTeX2e(2002/01/18)P1: ILV10.1146/annurev.phyto.40.120501.101443
Annu. Rev. Phytopathol. 2002. 40:349–79doi: 10.1146/annurev.phyto.40.120501.101443
Copyright c© 2002 by Annual Reviews. All rights reserved
PATHOGEN POPULATION GENETICS,EVOLUTIONARY POTENTIAL, AND
DURABLE RESISTANCE
Bruce A. McDonald and Celeste LindeInstitute of Plant Sciences, Plant Pathology Group, Federal Institute ofTechnology, ETH-Zentrum, LFW, CH-8092 Zurich, Switzerland;e-mail: [email protected]; [email protected]
Key Words risk assessment, quantitative resistance, major gene resistance
■ Abstract We hypothesize that the evolutionary potential of a pathogen popula-tion is reflected in its population genetic structure. Pathogen populations with a highevolutionary potential are more likely to overcome genetic resistance than pathogenpopulations with a low evolutionary potential. We propose a flexible framework topredict the evolutionary potential of pathogen populations based on analysis of theirgenetic structure. According to this framework, pathogens that pose the greatest riskof breaking down resistance genes have a mixed reproduction system, a high potentialfor genotype flow, large effective population sizes, and high mutation rates. The lowestrisk pathogens are those with strict asexual reproduction, low potential for gene flow,small effective population sizes, and low mutation rates. We present examples of high-risk and low-risk pathogens. We propose general guidelines for a rational approach tobreed durable resistance according to the evolutionary potential of the pathogen.
INTRODUCTION
Our primary aim in this chapter is to illustrate how principles of population geneticscan be applied to guide resistance-breeding strategies. Though the focus will be onplant genetic resistance, these principles should also be relevant for managementof fungicides and antibiotics in agroecosystems. A secondary goal in this paper isto develop a flexible framework in which to consider the population genetics ofplant pathogens and then relate that framework to the “risk” of pathogen evolution.This framework may prove useful for many aspects of risk assessment related topathogen-plant interactions, including release of genetically engineered plants andmicroorganisms. Our final goal is to illustrate how this framework may be used todevelop resistance-breeding strategies that aim to attain durable disease resistance.
An important theme running through this paper is the concept of the geneticstructure of populations. We define genetic structure as the amount and distri-bution of genetic variation within and among populations. Genetic structure is a
0066-4286/02/0901-0349$14.00 349
Ann
u. R
ev. P
hyto
path
ol. 2
002.
40:3
49-3
79. D
ownl
oade
d fr
om a
rjou
rnal
s.an
nual
revi
ews.
org
by E
TH
on
06/2
8/05
. For
per
sona
l use
onl
y.

12 Jul 2002 9:59 AR AR165-PY40-13.tex AR165-PY40-13.SGM LaTeX2e(2002/01/18)P1: ILV
350 MCDONALD ¥ LINDE
consequence of interactions among the five forces that affect the evolution of pop-ulations. The genetic structure of a population is determined by the evolutionaryhistory of that population. Thus, knowledge of genetic structure gives insight intothe evolutionary processes that shaped a population in the past. We hypothesizethat knowledge of genetic structure also offers insight into the future evolutionarypotential of pathogen populations. We propose that pathogens with the greatest evo-lutionary potential pose the greatest “risk” of circumventing the effects (“breakingdown”) of major resistance genes or evolving to counteract other control methodssuch as applications of fungicides or antibiotics. Knowledge of the evolutionarypotential of pathogens may prove useful to optimize the management of resistancegenes, fungicides, and antibiotics to maximize their useful life expectancy andminimize the losses that result from loss in efficacy of these control methods (90).
Plant pathologists have witnessed changes in pathogen populations many timesover the nearly hundred years since Biffen first described the Mendelian inheritanceof disease resistance (4). The most dramatic changes were those that accompaniedthe breakdown of major resistance genes. Boom-and-bust cycles have been docu-mented most thoroughly with regards to cereal rusts [e.g., (64, 84)] and powderymildews of cereals [e.g., (11, 136)] that exhibit a gene-for-gene interaction withtheir hosts (28). In the majority of these cases, a single resistance gene with largeeffect became widely distributed over a large geographical area (the “boom”).The pathogen population adapted to the presence of a major resistance gene byevolving a new population that could overcome this resistance gene (the “bust”).In these cases, the “breakdown” of genetic resistance was due to the evolution ofthe local pathogen population because of selection for mutants, recombinants, orimmigrants that were better adapted to the resistant cultivar.
In our current understanding of the gene-for-gene interaction, pathogens pro-duce elicitor molecules that are recognized by specific receptors in the plant. Whena plant cell receptor recognizes a pathogen elicitor, a defense response is activatedthat often leads to the death of the infected plant cell and inhibition of the pathogen.Mutations from avirulence to virulence in the pathogen lead to a change in the elic-itor, or failure to produce the elicitor at all, that causes nonrecognition by the hostreceptor. Under this gene-for-gene model, a breakdown in resistance is due to an in-crease in the frequency of pathogen strains that harbor a mutation from avirulenceto virulence. Virulent mutants increase in frequency because host defense systemsare not activated early enough to prevent infection and subsequent pathogen re-production. After selection drives the virulence mutation to a high frequency inthe pathogen population, the resistance gene is no longer effective, and we say thatits resistance is “broken.” Gene-for-gene resistance is often called major-gene re-sistance or pathotype-specific resistance because its effects are large and effectiveonly against the portion of the pathogen population that produces the elicitor.
Resistance in plants can also be due to other types of genetically encodedproducts, such as preformed phytoalexins, chemical or physical barriers, PR-proteins, hydrolytic enzymes such as chitinases, and modifiers of host defenseresponses. We consider it likely that the individual actions of these genes are on
Ann
u. R
ev. P
hyto
path
ol. 2
002.
40:3
49-3
79. D
ownl
oade
d fr
om a
rjou
rnal
s.an
nual
revi
ews.
org
by E
TH
on
06/2
8/05
. For
per
sona
l use
onl
y.
12 Jul 2002 9:59 AR AR165-PY40-13.tex AR165-PY40-13.SGM LaTeX2e(2002/01/18)P1: ILV
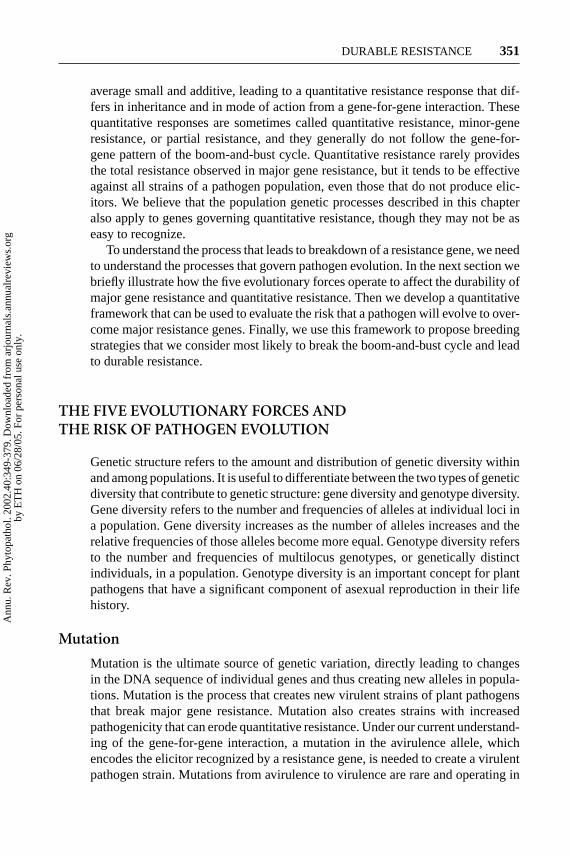
DURABLE RESISTANCE 351
average small and additive, leading to a quantitative resistance response that dif-fers in inheritance and in mode of action from a gene-for-gene interaction. Thesequantitative responses are sometimes called quantitative resistance, minor-generesistance, or partial resistance, and they generally do not follow the gene-for-gene pattern of the boom-and-bust cycle. Quantitative resistance rarely providesthe total resistance observed in major gene resistance, but it tends to be effectiveagainst all strains of a pathogen population, even those that do not produce elic-itors. We believe that the population genetic processes described in this chapteralso apply to genes governing quantitative resistance, though they may not be aseasy to recognize.
To understand the process that leads to breakdown of a resistance gene, we needto understand the processes that govern pathogen evolution. In the next section webriefly illustrate how the five evolutionary forces operate to affect the durability ofmajor gene resistance and quantitative resistance. Then we develop a quantitativeframework that can be used to evaluate the risk that a pathogen will evolve to over-come major resistance genes. Finally, we use this framework to propose breedingstrategies that we consider most likely to break the boom-and-bust cycle and leadto durable resistance.
THE FIVE EVOLUTIONARY FORCES ANDTHE RISK OF PATHOGEN EVOLUTION
Genetic structure refers to the amount and distribution of genetic diversity withinand among populations. It is useful to differentiate between the two types of geneticdiversity that contribute to genetic structure: gene diversity and genotype diversity.Gene diversity refers to the number and frequencies of alleles at individual loci ina population. Gene diversity increases as the number of alleles increases and therelative frequencies of those alleles become more equal. Genotype diversity refersto the number and frequencies of multilocus genotypes, or genetically distinctindividuals, in a population. Genotype diversity is an important concept for plantpathogens that have a significant component of asexual reproduction in their lifehistory.
Mutation
Mutation is the ultimate source of genetic variation, directly leading to changesin the DNA sequence of individual genes and thus creating new alleles in popula-tions. Mutation is the process that creates new virulent strains of plant pathogensthat break major gene resistance. Mutation also creates strains with increasedpathogenicity that can erode quantitative resistance. Under our current understand-ing of the gene-for-gene interaction, a mutation in the avirulence allele, whichencodes the elicitor recognized by a resistance gene, is needed to create a virulentpathogen strain. Mutations from avirulence to virulence are rare and operating in
Ann
u. R
ev. P
hyto
path
ol. 2
002.
40:3
49-3
79. D
ownl
oade
d fr
om a
rjou
rnal
s.an
nual
revi
ews.
org
by E
TH
on
06/2
8/05
. For
per
sona
l use
onl
y.

12 Jul 2002 9:59 AR AR165-PY40-13.tex AR165-PY40-13.SGM LaTeX2e(2002/01/18)P1: ILV
352 MCDONALD ¥ LINDE
isolation would not cause a breakdown in resistance. However, when mutation iscoupled with directional selection (i.e., deployment of a resistance gene), virulentmutants increase in frequency rapidly and cause a resistance gene to lose its effec-tiveness. Mutation rates are generally low, though they can differ among loci andpathogens (29, 141). Mutation is likely to be especially important for pathogenssuch as bacteria and viruses that exist as extremely large populations within indi-vidual plants. These large population sizes make it more likely that new mutantswith higher fitness will emerge within a host, be able to multiply within the infectedhost, and spread to new, uninfected hosts before the mutation is lost through ge-netic drift. In our risk model, pathogens with high mutation rates present a greaterrisk than pathogens with low mutation rates because a high mutation rate increasesthe likelihood that the mutation from avirulence to virulence or from low to highpathogenicity will be present in a pathogen population. For example, pathogenpopulations with active transposable elements may exhibit higher mutation ratesthan populations without active transposons (33a, 69a, 84a). Though it is difficultto imagine how a disease management program could reduce mutation rates andthus limit the creation of new alleles, any activity that slows the movement ofactive transposable elements or genome rearrangements among populations couldpotentially affect overall mutation rates for a pathogen species.
Population Size and Random Genetic Drift
Population size affects the probability that mutants will be present, and it caninfluence the diversity of genes in a population through a process called randomgenetic drift. Large populations have more mutants than small populations becausemutation rates are generally low. For example, with a mutation rate of 10−5, apopulation with 106 individuals is expected to have 10 mutants, and a populationwith 108 individuals is expected to have 1000 mutants. In small populations, geneticdrift leads to a loss of alleles over time. In our risk assessment model, pathogenswith large population sizes have greater evolutionary potential than pathogenswith small population sizes. Pathogens that undergo regular, severe reductions inpopulation size (bottlenecks), e.g., as a result of crop rotations or annual climaticextremes that kill the majority of individuals, are less diverse and slower to adaptthan populations that maintain a high population size year round. Any diseasemanagement program that keeps pathogen population sizes small assists controlby limiting the gene diversity in the pathogen population [for examples, see (78)].
Gene and Genotype Flow
Gene flow is a process in which particular alleles (genes) or individuals (genotypes)are exchanged among geographically separated populations. For strictly asexualorganisms that do not recombine genes, entire genotypes can be exchanged amongpopulations. We refer to this process as genotype flow. Gene/genotype flow isthe process that moves virulent mutant alleles and genotypes among differentfield populations. Pathogens that exhibit a high degree of gene/genotype flow
Ann
u. R
ev. P
hyto
path
ol. 2
002.
40:3
49-3
79. D
ownl
oade
d fr
om a
rjou
rnal
s.an
nual
revi
ews.
org
by E
TH
on
06/2
8/05
. For
per
sona
l use
onl
y.

12 Jul 2002 9:59 AR AR165-PY40-13.tex AR165-PY40-13.SGM LaTeX2e(2002/01/18)P1: ILV
DURABLE RESISTANCE 353
are expected to have greater genetic diversity than pathogens with low degreesof gene/genotype flow because high gene/genotype flow increases the effectivepopulation size by increasing the size of the genetic neighborhood. Pathogensthat produce propagules with the potential for long-distance dispersal, such asrust- and powdery mildew fungi, tend to have large genetic neighborhoods, whichmay encompass entire continents (e.g., thePucciniapathway in North America).Pathogens with propagules that move only short distances may exist in relativelysmall genetic neighborhoods, which may encompass only one field or even onesection in a field (e.g., nematodes). The size of the genetic neighborhood can beaffected by anthropogenic activities. Humans can move many pathogens far beyondtheir natural dispersal limits through agricultural practices and intercontinentaltravel and commerce. Thus, the actual degree of gene/genotype flow may be muchhigher than expected based on life history traits.
Our risk model proposes that pathogens with high gene/genotype flow pose agreater risk than pathogens with low gene/genotype flow. We hypothesize furtherthat gene flow involving asexual propagules (genotype flow) poses a higher riskthan movement of sexual propagules (gene flow) because the asexual propagulerepresents a linked package of coadapted alleles that has already been selected.Any disease management tactic that limits movements of genes and genotypesamong pathogen populations limits the spread of mutant alleles and genotypes[for examples, see (78)].
Reproduction and Mating System
Reproduction and mating systems affect how gene diversity is distributed withinand among individuals in a population. Reproduction can be sexual, asexual, ormixed. Mating system is relevant only to the sexual component of reproduction,and can vary from strict inbreeding to obligate outcrossing (Figure 1). In asexualpathogens, measures of genotype diversity are more meaningful than measures ofgene diversity because most of the genetic diversity is distributed among clonallineages. Populations of sexual pathogens usually exhibit a high degree of geno-type diversity, so measures of gene diversity are needed to compare the amountof genetic diversity in different populations. Our risk model hypothesizes thatpathogens undergoing regular recombination (this can include bacterial conjuga-tion, recombination between viral genomes in plants with mixed infections, andhyphal anastomosis and/or parasexual recombination in fungi) pose greater risksthan pathogens that undergo no or little recombination. A recombining pathogenpopulation can put together new combinations of virulence alleles as rapidly asbreeders can recombine resistance genes. For this reason, resistance gene pyra-mids may not be an effective long-term breeding strategy against pathogens thatundergo regular recombination. We propose that pathogens that outcross pose agreater risk than inbreeding pathogens because more new genotypes are createdthrough outcrossing. Disease management strategies that prevent the occurrenceof sexual reproduction assist with control [for examples, see (78)].
Ann
u. R
ev. P
hyto
path
ol. 2
002.
40:3
49-3
79. D
ownl
oade
d fr
om a
rjou
rnal
s.an
nual
revi
ews.
org
by E
TH
on
06/2
8/05
. For
per
sona
l use
onl
y.

12 Jul 2002 9:59 AR AR165-PY40-13.tex AR165-PY40-13.SGM LaTeX2e(2002/01/18)P1: ILV
354 MCDONALD ¥ LINDE
Figure 1 The interaction between mating systemand reproduction system in determining the evolu-tionary potential of a pathogen population.
We hypothesize that pathogens with mixed reproduction systems pose the high-est risk of evolution. During the sexual cycle, many new combinations of alleles(genotypes) are created through recombination. These recombined genotypes canbe “tested” in different environments, which may include new resistance genes,fungicides, or antibiotics. Combinations of alleles (genotypes) that are most fit areheld together through asexual reproduction and may increase to a high frequencyin selected clones. The spatial and temporal distribution of clones or clonal lin-eages within and among populations will depend mainly on the dispersal potentialof the asexual propagules. If the asexual spore or propagule is capable of long-distance dispersal, then the clone(s) with highest fitness can become distributedover a wide area through genotype flow, causing an epidemic. This process oftesting recombinants and amplifying selected genotypes occurs for many rust andpowdery mildew fungi. If the asexual propagule has limited dispersal potential,then the most damaging clones may be limited to a hot-spot that is only a fewmeters in diameter in a field. This may occur for sexual pathogens with splash-dispersed conidia such asMycosphaerella graminicola(80) andPhaeosphaerianodorum(82) on wheat and possiblyRhynchosporium secalis(110) on barley.
Selection Imposed by Major Gene Resistanceand Quantitative Resistance
Selection is the main force that drives changes in frequencies of mutant alleles.Directional selection occurs when a major resistance gene (encoded by a receptor)becomes widely distributed over a large geographical area. This leads to an increase
Ann
u. R
ev. P
hyto
path
ol. 2
002.
40:3
49-3
79. D
ownl
oade
d fr
om a
rjou
rnal
s.an
nual
revi
ews.
org
by E
TH
on
06/2
8/05
. For
per
sona
l use
onl
y.

22 Jul 2002 9:1 AR AR165-PY40-13.tex AR165-PY40-13.SGM LaTeX2e(2002/01/18)P1: ILV
DURABLE RESISTANCE 355
in frequency of the virulent mutant that has lost the elicitor (avirulence allele) untilthe major resistance gene is broken. The many examples of broken major generesistance offer abundant evidence that selection is efficient in agricultural ecosys-tems that are based on monoculture and genetic uniformity. There are severalpossibilities for deploying major gene resistance that can change the way thatselection operates on a pathogen population (78) (Figure 2). The most commonalternative is to pyramid several major resistance genes into a single cultivar inthe hope that the pathogen will not be able to undergo a sequence of mutationscorresponding to each resistance gene. Another option is to generate disruptiveselection by rotating major gene resistance through time and space or by grow-ing mixtures of cultivars with different resistance genes. These strategies disruptdirectional selection by favoring different mutant alleles or genotypes at differenttimes and places, reducing the rate at which the mutant allele or genotype in-creases in frequency. Gene rotations and mixtures have not been widely exploitedin modern agroecosystems, though some preliminary attempts show great promise[e.g., (140)].
Quantitative resistance is another option that plant breeders can utilize to obtainresistant cultivars. One hallmark of quantitative resistance is that it does not ex-hibit the boom-and-bust cycle characteristic of major resistance genes. It appearslikely that this is because quantitative resistance is not based on receptor-elicitorrecognition and thus appears to work equally across all pathogen strains. Becausequantitative resistance is sensitive to environmental conditions, it can be difficultto determine if pathogen strains differ in their degree of pathogenicity on the samequantitatively resistant cultivar. We consider it likely that pathogen populations alsoevolve to overcome quantitative resistance in agroecosystems. However, becausethe nature of this evolution differs from evolution against major gene resistance,it is more difficult to detect and is better characterized as a process of “erosion”rather than as a process of breakdown (Figure 3). The erosion of quantitative re-sistance is more difficult to observe because corresponding pathogen populationscan display a distribution of pathogenicity that may vary considerably from yearto year as a result of the strong genotype-by-environment interactions that occurfor quantitative characters in both plant and pathogen.
To illustrate the difficulty of detecting erosion of quantitative resistance, wedeveloped a model where resistance was due to five unlinked genes with equal andadditive effects (see Supplementary Materials on http://www.annualreviews.org/).For example, the resistance alleles could encode a combination of hydrolases(e.g., chitinases and glucanases) and/or pathogen-specific toxins (e.g., preformedchemical inhibitors or phytoalexins) that slow down or prevent infection by thepathogen. The diploid pathogen in the model had five unlinked genes with equal andadditive effects that could counteract the plant resistance genes. For example, the“pathogenicity” alleles might encode enzymes that inactivate preformed chemicalinhibitors or modify the pathogen substrate targeted by hydrolases. A continuumin pathogenicity has been described in crosses withNectria haematococcaonpeas (32) andUstilago hordei(20). If the gene products in pathogen and hostinteract in an equal and additive manner, then the degree of damage done to the
Ann
u. R
ev. P
hyto
path
ol. 2
002.
40:3
49-3
79. D
ownl
oade
d fr
om a
rjou
rnal
s.an
nual
revi
ews.
org
by E
TH
on
06/2
8/05
. For
per
sona
l use
onl
y.

12 Jul 2002 9:59 AR AR165-PY40-13.tex AR165-PY40-13.SGM LaTeX2e(2002/01/18)P1: ILV
356 MCDONALD ¥ LINDE
Ann
u. R
ev. P
hyto
path
ol. 2
002.
40:3
49-3
79. D
ownl
oade
d fr
om a
rjou
rnal
s.an
nual
revi
ews.
org
by E
TH
on
06/2
8/05
. For
per
sona
l use
onl
y.

12 Jul 2002 9:59 AR AR165-PY40-13.tex AR165-PY40-13.SGM LaTeX2e(2002/01/18)P1: ILV
DURABLE RESISTANCE 357
host (equivalent to pathogenicity) is proportional to the number of pathogenicityalleles. In our model, for example, each pathogenicity allele adds 5% to the leafarea infected on the resistant host. The most aggressive strain will cover 50%of the leaf area, the least aggressive strain will cover only 5% of the leaf area,and a strain with no pathogenicity alleles cannot infect a plant with maximumquantitative resistance.
Following many cycles of pathogen reproduction and selection, the level ofpathogenicity in the pathogen population will increase, and the quantitative resis-tance will erode (see Table, in Supplementary Materials on http://www.annualreviews.org/). However, the year-to-year change will be gradual and hard to de-tect because the individual strains in the pathogen population exhibit a largerange of pathogenicity (Figure 3 and Figure in Supplementary Materials on http://www.annualreviews.org/). Though the erosion of quantitative resistance differsquantitatively from the breakdown of major gene resistance, we believe that theevolutionary processes (and corresponding risk assessment) described in this sec-tion apply equally to both types of resistance. Note that resistance genes can differin the fitness consequences they impose on the corresponding mutants in pathogenpopulations (67). By choosing major resistance genes that have a large effect onthe fitness of virulent mutants, it may be possible to extend the durability of majorresistance genes. But under strong directional selection, even the most durable re-sistance genes may eventually break down because a new mutant or recombinantwill emerge (115).
The risk model proposes that pathogen populations exposed to strong (majorgene resistance), directional selection over many generations will evolve morequickly than populations that are exposed to weaker selection (quantitative resis-tance) or to disruptive selection imposed by temporal or spatial patterning of theselective force. Selection is the evolutionary force that is most easily manipulatedby humans [e.g., (90)], and thus offers the most practical point for interventionin the evolutionary process. Agroecosystems based on widespread deploymentof major gene resistance place maximum directional selection on the pathogen
←−−−−−−−−−−−−−−−−−−−−−−−−−−−−−−−−−−−−−−−−−−−−−−−−−−−−−−−−−Figure 3 Shifts in pathogen populations associated with breakdown of major generesistance and erosion of quantitative resistance. PanelsA andB show the rapid shiftfrom avirulence to virulence associated with breakdown of major gene resistance,where p and q represent frequencies of avirulence and virulence alleles, respectively,in the pathogen population. Differences in pathogenicity between strains that differ foravirulence and virulence are clear and virulence shifts in pathogen populations are easyto detect. PanelsC andD show the erosion of resistance, characterized by a gradualincrease in pathogenicity of the pathogen population toward a host with quantitativeresistance, associated with a quantitative resistance model described in the text. Verticallines indicate mean pathogenicity of populations that differ by 10% in the frequenciesof five alleles responsible for pathogenicity.
Ann
u. R
ev. P
hyto
path
ol. 2
002.
40:3
49-3
79. D
ownl
oade
d fr
om a
rjou
rnal
s.an
nual
revi
ews.
org
by E
TH
on
06/2
8/05
. For
per
sona
l use
onl
y.

12 Jul 2002 9:59 AR AR165-PY40-13.tex AR165-PY40-13.SGM LaTeX2e(2002/01/18)P1: ILV
358 MCDONALD ¥ LINDE
TABLE 1 Extremes of evolutionary risk posed by plant pathogens and examples offactors that affect risk assessment
Highest risk of evolution Lowest risk of evolution
High mutation rate Low mutation rateTransposable elements active No transposons
Large effective population sizes Small effective population sizesLarge overseasoning population No overseasoning propagulesExtinction of local populations rare Extinction of local populations commonNo genetic drift, no loss of alleles Significant genetic drift, alleles lost
High gene/genotype flow Low gene/genotype flowAsexual propagules dispersed by air Asexual propagules soilborneover long distancesHuman-mediated long-distance Quarantines effectivemovement common
Mixed reproduction system Asexual reproduction systemAnnual sexual outcrossing and Only asexual propagules producedasexual propagules produced
Efficient directional selection Disruptive selectionR-gene deployed in genetically uniform R-genes deployed in mixtures/multilinesmonocultureR-gene deployed continuously over large R-genes deployed as rotations in time orarea space
population. Agroecosystems that deploy major gene resistance in mixtures, or inrotations through time and space will reduce the efficiency of selection, or imposestabilizing or disruptive selection that can slow the rate of increase in the frequencyof virulent mutants.
The individual contributions of each evolutionary factor to the risk assessmentframework are summarized in Table 1. The end result of the interactions amongthese factors is the observed genetic structure of the pathogen population [forexamples see (78)]. By using selectively neutral genetic markers and hierarchicalsampling to determine the genetic structure of pathogen populations, we can beginto understand the evolutionary forces that shaped these populations, and infer theimportance of the individual evolutionary factors (76).
A MODEL FOR RISK ASSESSMENT
We propose to apply knowledge of the evolutionary forces and pathogen ge-netic structure to make predictions regarding the relative risks posed by differentpathogens for breaking down resistance. Our hypothesis is that much of the dura-bility of resistance genes is due to the nature of the pathogen population rather
Ann
u. R
ev. P
hyto
path
ol. 2
002.
40:3
49-3
79. D
ownl
oade
d fr
om a
rjou
rnal
s.an
nual
revi
ews.
org
by E
TH
on
06/2
8/05
. For
per
sona
l use
onl
y.

22 Jul 2002 9:6 AR AR165-PY40-13.tex AR165-PY40-13.SGM LaTeX2e(2002/01/18)P1: ILV
DURABLE RESISTANCE 359
than to the nature of the resistance gene. There will be cases where the resistancegene itself plays a key role in durability, e.g., mlo resistance in barley has beendurable thoughBlumeria graminisf. sp.hordeihas a high evolutionary potentialaccording to our risk model (11, 136), and there is good evidence that some re-sistance genes impose more severe constraints on the fitness of virulent mutantsthan other resistance genes (67). We offer these guidelines in anticipation that thegeneral pattern will hold true for the majority of pathogens, allowing us to ranktheir relative evolutionary potential and thus assess the relative risk they pose toagroecosystems. The framework we develop here can be used as a hypothesis totest against a large number of plant pathosystems. The underlying principles of theframework can be tested individually or in combination according to the availableknowledge of the population genetics for any pathogen.
Figure 4 is a simplified diagram that we propose as a model framework forassessing the evolutionary risk posed by most plant pathogens. The format usedto present the risk categories was inspired by a similar figure presented by Brent& Hollomon (8). Figure 4 considers only the evolutionary risk due to differencesin reproduction/mating system, gene/genotype flow, and effective population size.Mutation rate was not included in this diagram because we assumed that mutationrates would be low and relatively constant across pathogens. For pathogens knownto have very high mutation rates, or for bacteria and viruses where mutation islikely to play a more important role in evolution, these risk values can be increasedaccordingly. Selection was not included in this diagram under the assumptionthat selection is likely to be efficient in the genetically uniform monoculturesthat dominate modern agricultural ecosystems. Selection risk can be increasedby increasing the land area covered to the same resistance gene, or decreasedthrough resistance gene deployment strategies, such as gene rotations or mixtures.We expect that the population size for most pathogen populations is large, so itis likely that virulent mutants will be present and the effects of genetic drift willbe small. However, we recognize that some pathogen populations have smallereffective population sizes because of a founder effect, regular bottlenecks, or short-lived overseasoning propagules. Other populations have larger effective sizes dueto year-round multiplication, short latent periods, and production of long-livedoverseasoning propagules. We modified the risk values we originally proposed(78) by assigning risk values of 1, 2, and 3 for effective population sizes that aresmall, average, and large, respectively. We also made the effects additive instead ofmultiplicative. This results in a range of values for each cell in the matrix (Figure 4).The proposed risk categories may need to be adjusted in many cases as a resultof anthropogenic activities. For example, gene/genotype flow may be increasedbeyond the normal biological limits of spore dispersal by movement of inoculum orinfected plant material through international commerce and travel. Any activitiesthat reduce the effectiveness of quarantines, such as smuggling or war, may leadto an increase in gene/genotype flow. Similarly, the amount of sexual reproductionmay be affected by removal of alternate hosts or by changes in cultivation orsanitation practices.
Ann
u. R
ev. P
hyto
path
ol. 2
002.
40:3
49-3
79. D
ownl
oade
d fr
om a
rjou
rnal
s.an
nual
revi
ews.
org
by E
TH
on
06/2
8/05
. For
per
sona
l use
onl
y.

12 Jul 2002 9:59 AR AR165-PY40-13.tex AR165-PY40-13.SGM LaTeX2e(2002/01/18)P1: ILV
360 MCDONALD ¥ LINDE
The risk values presented in Figure 4 are on a 3–9 scale. These numbers are unit-less and have no specific biological meaning. The numbers attempt to provide a rel-ative ranking of the evolutionary potential inherent in different pathogen life histo-ries. This ranking system assumes that reproduction/mating system, gene/genotypeflow, and effective population size affect evolutionary potential equally. A furtherassumption is that these effects are additive. As more knowledge accumulates andthe hypotheses in this diagram are tested against many different pathosystems,we may learn that the forces do not contribute equally to evolutionary poten-tial or that their effects are multiplicative rather than additive. But the proposedscale offers many possibilities for developing testable hypotheses and assigningrelative evolutionary risks. For example, pathogens that have exclusively asex-ual reproduction and little potential for gene flow are assigned to the lowestrisk category. This category includes some bacterial pathogens and theFusar-ium oxysporumformae speciales (Figure 4). At the other extreme, pathogensthat have mixed reproduction and asexual spores that are disseminated over longdistances by wind are assigned to the highest risk category. This category in-cludes pathogens such as the powdery mildew fungi. In the intermediate riskcategories are pathogens that we expect to have more limited evolutionary po-tential as a result of lack of an asexual propagule that has high gene flow poten-tial, or lack of regular outcrossing that produces new recombinants (Figure 4).Figure 4 hypothesizes that pathogens with regular sexual cycles will evolve fasterthan pathogens without recombination. It also hypothesizes that pathogens produc-ing asexual propagules distributed over long distances will break down resistancegenes faster than pathogens with short distance dispersal of asexual propagules.
EXAMPLE PLANT PATHOSYSTEMSFIT INTO THE RISK MODEL
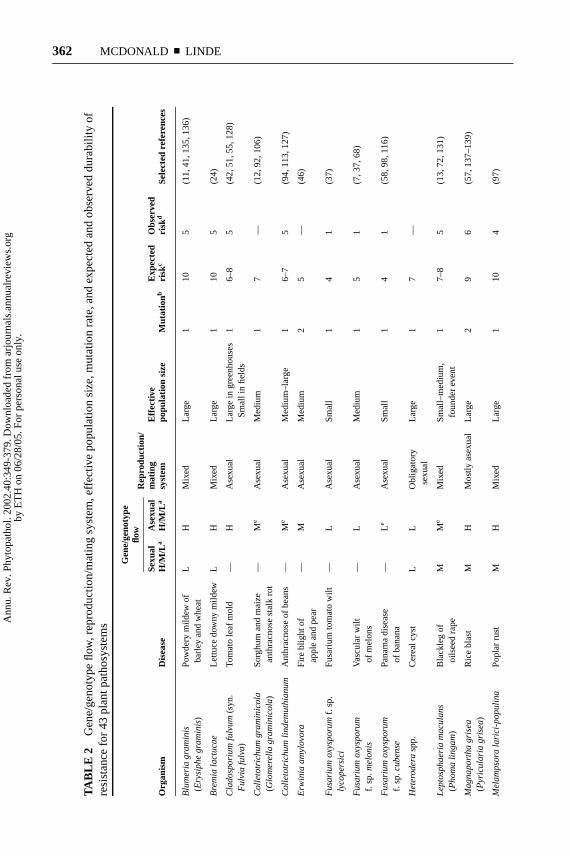
At this time, population genetic structure for most pathogens is unknown andaccurate records of the time needed to break down resistance genes or to becomeresistant to fungicides and antibiotics usually cannot be gleaned from the accessibleliterature. To properly test the model, we will need to consider a large numberof plant pathosystems to determine if the observed evolutionary rate correlateswith the predicted evolutionary potential. We conducted a preliminary test ofthe model by combing the plant pathology literature for examples where geneticstructure data were adequate to provide an estimate for expected evolutionarypotential, and records of breakdown of resistance could provide an estimate forobserved rate of evolution. In total, we considered 52 plant pathosystems. The43 examples with the most complete data are shown in Table 2. Thirty-four ofthe pathosystems had adequate information to allow us to approximate valuesfor four evolutionary forces using our risk model. We used Spearman rank ordercorrelation analysis to determine the correlations between the four “expected” riskfactors and the “observed” risk values for all 34 pathosystems. We found thatrs was−0.32 (P= 0.063) for reproduction/mating system, 0.26 (P= 0.141) for
Ann
u. R
ev. P
hyto
path
ol. 2
002.
40:3
49-3
79. D
ownl
oade
d fr
om a
rjou
rnal
s.an
nual
revi
ews.
org
by E
TH
on
06/2
8/05
. For
per
sona
l use
onl
y.

12 Jul 2002 9:59 AR AR165-PY40-13.tex AR165-PY40-13.SGM LaTeX2e(2002/01/18)P1: ILV
DURABLE RESISTANCE 361
effective population size, 0.36 (P= 0.037) for mutation, and 0.26 (P= 0.141) forgene/genotype flow. All significance values were for two-tailed t-tests. When theanalysis was conducted using the sum of mutation risk values and gene/genotypeflow risk values, the correlation was 0.35 (P= 0.044). When the largest outlier inthe correlation matrix, the nematodeMeloidogyne incognita, was removed from theanalysis, the correlation rose to 0.46 (P= 0.007). ForM. incognita, it is possiblethat the actual amount of genotype flow is much higher than the predicted amount ofgenotype flow as a result of movement of contaminated machinery, soil, and water(J. Starr, personal communication), in which caseM. incognitashould be placed ina higher risk category. The correlation between observed and predicted risk valuesbased on the sum of mutation and gene/genotype flow is shown in Figure 5. Thispreliminary analysis suggests that the contributions of the evolutionary forces maynot be equal, as proposed in Figure 4. It also indicates that gene/genotype flowand mutation may be the dominant forces driving pathogen evolution in the 34plant pathosystems we considered. However, we believe that many more examplepathosystems will need to be considered before firm conclusions can be drawn. Inthe rest of this section, we provide a few illustrative examples.
Xanthomonas oryzae pv. oryzae and Xanthomonascampestris pv. vesicatoria
Xanthomonas oryzaepv.oryzaereproduces clonally (89) and exhibits limited geneflow as it disperses mainly by rain splash (87), though typhoons may provide ameans for long-distance movement.Xa-3 in rice has been durable for at least15 years (5, 85) and cultivar Nongken 58 has been resistant for at least 25 years(5). These observations agree well with the prediction of our model. Race 2 ofX. oryzaepv. oryzaetook only 3–4 years to increase to high frequencies afterthe release of cultivars havingXa-4 in the 1970s (85). However, cultivars withXa-4 are still considered resistant and planted widely (5, 69). This resistance isachieved by cumulative effects of multiple QTLs, including the residual effects ofthe “defeated”Xa-4 (69). These observations do not correspond with our model,suggesting that the unique properties of theXa-4resistance gene may play a greaterrole than the biology of the pathogen in determining the durability of this resis-tance gene.Xanthomonas campestrispv. vesicatoriaalso reproduces clonally, butresistance genes in tomato and pepper are often defeated within a single growingseason (49, 65, 99). In this pathogen, new pathotypes develop from loss of theplasmid carrying the avirulence gene, from inactivation of the avirulence gene, orfrom insertion elements that inactivate avirulence genes (65). Pyramiding defeatedresistance genesBs1, Bs2, andBs3did not provide resistance, as they were de-feated within the same growing season during which they were first deployed (65).Though this rapid breakdown of a resistance gene pyramid does not correspondwell with expectations for an asexual organism in our model, the fact that two of theavirulence genes were on plasmids (65) increased the likelihood that multiple “mu-tations” to virulence could occur relatively quickly through asexual propagation.
Ann
u. R
ev. P
hyto
path
ol. 2
002.
40:3
49-3
79. D
ownl
oade
d fr
om a
rjou
rnal
s.an
nual
revi
ews.
org
by E
TH
on
06/2
8/05
. For
per
sona
l use
onl
y.
12 Jul 2002 9:59 AR AR165-PY40-13.tex AR165-PY40-13.SGM LaTeX2e(2002/01/18)P1: ILV
362 MCDONALD ¥ LINDE
TAB
LE2
Gen
e/ge
noty
peflo
w,r
epro
duct
ion/
mat
ing
syst
em,e
ffect
ive
popu
latio
nsi
ze,m
utat
ion
rate
,and
expe
cted
and
obse
rved
dura
bilit
yof
resi
stan
cefo
r43
plan
tpat
hosy
stem
s
Gen
e/ge
noty
peflo
wR
epro
duct
ion/
Sex
ual
Ase
xual
mat
ing
Effe
ctiv
eE
xpec
ted
Obs
erve
dO
rgan
ism
Dis
ease
H/M
/La
H/M
/La
syst
empo
pula
tion
size
Mut
atio
nbris
kc
risk
dS
elec
ted
refe
renc
es
Blu
me
ria
gra
min
isP
owde
rym
ildew
ofL
HM
ixed
Larg
e1
105
(11,
41,1
35,1
36)
(Ery
sip
he
gra
min
is)ba
rley
and
whe
at
Bre
mia
lact
uca
eLe
ttuce
dow
nym
ildew
LH
Mix
edLa
rge
110
5(2
4)
Cla
do
spo
riu
mfu
lvu
m(sy
n.To
mat
ole
afm
old
—H
Ase
xual
Larg
ein
gree
nhou
ses
16–
85
(42,
51,5
5,12
8)F
ulv
iafu
lva)
Sm
alli
nfie
lds
Co
lleto
tric
hu
mg
ram
inic
ola
Sor
ghum
and
mai
ze—
MeA
sexu
alM
ediu
m1
7—
(12,
92,1
06)
(Glo
me
rella
gra
min
ico
la)an
thra
cnos
est
alk
rot
Co
lleto
tric
hu
mlin
de
mu
thia
nu
mA
nthr
acno
seof
bean
s—
MeA
sexu
alM
ediu
m–l
arge
16–
75
(94,
113,
127)
Erw
inia
am
ylov
ora
Fire
blig
htof
—M
Ase
xual
Med
ium
25
—(4
6)ap
ple
and
pear
Fu
sariu
mo
xysp
oru
mf.s
p.F
usar
ium
tom
ato
wilt
—L
Ase
xual
Sm
all
14
1(3
7)ly
cop
ers
ici
Fu
sariu
mo
xysp
oru
mVa
scul
arw
ilt—
LA
sexu
alM
ediu
m1
51
(7,3
7,68
)f.
sp.m
elo
nis
ofm
elon
s
Fu
sariu
mo
xysp
oru
mP
anam
adi
seas
e—
Le
Ase
xual
Sm
all
14
1(5
8,98
,116
)f.
sp.c
ub
en
seof
bana
na
He
tero
de
rasp
p.C
erea
lcys
tL
LO
blig
ator
yLa
rge
17
—se
xual
Le
pto
sph
ae
ria
ma
cula
ns
Bla
ckle
gof
MM
eM
ixed
Sm
all–
med
ium
,1
7–8
5(1
3,72
,131
)(P
ho
ma
ling
am)
oils
eed
rape
foun
der
even
t
Mag
na
po
rth
ag
rise
aR
ice
blas
tM
HM
ostly
asex
ual
Larg
e2
96
(57,
137–
139)
(Pyr
icu
laria
grise
a)
Me
lam
pso
rala
rici
-po
pu
lina
Pop
lar
rust
MH
Mix
edLa
rge
110
4(9
7)
Ann
u. R
ev. P
hyto
path
ol. 2
002.
40:3
49-3
79. D
ownl
oade
d fr
om a
rjou
rnal
s.an
nual
revi
ews.
org
by E
TH
on
06/2
8/05
. For
per
sona
l use
onl
y.

12 Jul 2002 9:59 AR AR165-PY40-13.tex AR165-PY40-13.SGM LaTeX2e(2002/01/18)P1: ILV
DURABLE RESISTANCE 363
Me
lam
pso
rala
rici
-ep
itea
Will
owru
stM
HM
ixed
Larg
e1
104
(75,
96,1
01)
Me
lam
pso
ralin
if.sp
.lin
iF
lax
rust
MH
Mos
tlyas
exua
lLa
rge
18
6(1
6,28
,29)
Me
loid
ogyn
ein
cog
nita
Roo
t-kn
otne
mat
ode
—L
Mito
ticM
ediu
m1
56
(100
,125
)of
tom
ato
part
heno
geni
c
Myc
osp
ha
ere
llafij
ien
sis
Bla
cksi
gato
kaM
/HM
Mix
edS
mal
l,fo
unde
r1
74
(19,
39,8
6)(P
ara
cerc
osp
ora
fijie
nsi
s)of
bana
naev
ent
Myc
osp
ha
ere
llag
ram
inic
ola
Whe
atle
afbl
otch
M/H
MM
ixed
Larg
e1
94
(21,
23,5
4,80
,82)
(Se
pto
ria
triti
ci)
Ph
ae
osp
ha
eria
no
do
rum
Whe
atgl
ume
blot
chH
MM
ixed
Larg
e1
9—
(52,
79,8
8)(S
tag
on
osp
ora
no
do
rum)
Ph
yto
ph
tho
rain
fest
an
sP
otat
ola
tebl
ight
LeH
Mix
edM
ediu
m–L
arge
19–
105
(14,
26,3
4–36
,(n
ewpo
pula
tions
)73
,117
,118
,129
)O
ldpo
pula
tions
—H
Ase
xual
Sm
all,
foun
der
even
t1
65
Ph
yto
ph
tho
raso
jae
Soy
bean
root
LL
Hom
otha
llic
with
Med
ium
17
3(1
,31,
53,1
08,1
09,1
11,
and
stem
rot
low
outc
ross
ing
112,
126,
132)
Pra
tyle
nch
uss
pp.
Roo
tles
ion
nem
atod
esL
—O
blig
ator
yse
xual
Larg
e1
7—
Pse
ud
oce
rco
spo
rella
Whe
atey
espo
tM
MM
ixed
,mor
eM
ediu
m–l
arge
18–
103
(50)
he
rpo
tric
ho
ide
scl
onal
ly(T
ap
esi
aya
llun
da
e)
Pu
ccin
iaco
ron
ata
Oat
rust
—H
Ase
xual
Larg
e1
85
(2,2
2,38
,74,
93)
f.sp
.ave
na
e–-A
sexu
alpo
pula
tions
Sex
ualp
opul
atio
ns—
MH
Mix
edLa
rge
110
5al
tern
ate
host
pres
ent
Pu
ccin
iag
ram
inis
Ste
mru
stof
oats
—H
Ase
xual
(No
Med
ium
17
5(7
4)f.
sp.a
ven
ae
alte
rnat
eho
st)
Pu
ccin
iag
ram
inisf
.sp.
triti
ciW
heat
stem
rust
—H
Ase
xual
Med
ium
17
5(1
5,17
,56,
74,1
04,1
05)
Ase
xual
popu
latio
ns
Sex
ualp
opul
atio
ns—
alte
rnat
eM
HM
ixed
Larg
e1
105
host
pres
ent
(Co
ntin
ue
d)
Ann
u. R
ev. P
hyto
path
ol. 2
002.
40:3
49-3
79. D
ownl
oade
d fr
om a
rjou
rnal
s.an
nual
revi
ews.
org
by E
TH
on
06/2
8/05
. For
per
sona
l use
onl
y.

12 Jul 2002 9:59 AR AR165-PY40-13.tex AR165-PY40-13.SGM LaTeX2e(2002/01/18)P1: ILV
364 MCDONALD ¥ LINDE
TAB
LE2
(Co
ntin
ue
d)
Gen
e/ge
noty
peflo
wR
epro
duct
ion/
Sex
ual
Ase
xual
mat
ing
Effe
ctiv
eE
xpec
ted
Obs
erve
dO
rgan
ism
Dis
ease
H/M
/La
H/M
/La
syst
empo
pula
tion
size
Mut
atio
nbris
kc
risk
dS
elec
ted
refe
renc
es
Pu
ccin
iaso
rgh
i—A
sexu
alC
omm
onru
st—
HA
sexu
alM
ediu
m1
75
(9,4
3,95
)po
pula
tions
ofm
aize
Pu
ccin
iaso
rgh
i—al
tern
ate
MH
Mix
edLa
rge
110
—ho
stpr
esen
t
Pu
ccin
iast
riifo
rmis
Whe
atst
ripe
rust
—H
Ase
xual
:no
Med
ium
17
5(2
7,47
,48,
56,1
20,1
30)
alte
rnat
eho
st
Pu
ccin
iatr
itici
na
(syn
:Pu
ccin
iaW
heat
leaf
rust
—H
Ase
xual
Med
ium
17
5(1
5,18
,38,
56,6
1–64
,re
con
dita
f.sp
.tritic
i)—
Ase
xual
70,8
3,84
,114
)po
pula
tions
Sex
ualp
opul
atio
ns—
MH
Mix
edLa
rge
110
—al
tern
ate
host
pres
ent
Pyr
en
op
ho
ratr
itici
-re
pe
ntis
Tan
spot
ofw
heat
MM
Mix
edLa
rge
110
—(6
6)(D
rech
sle
ratr
itici
-re
pe
ntis)
Rh
izo
cto
nia
sola
ni
Ric
esh
eath
blig
htL
LM
ixed
?M
ediu
m1
7—
(91,
107)
Rh
ynch
osp
oriu
mse
calis
Bar
ley
scal
dH
MM
ixed
?M
ediu
m1
85
(40,
44,8
1,11
0)
Scl
ero
spo
rag
ram
inic
ola
Dow
nym
ildew
ofM
eH
Mix
edM
ediu
m1
95
(45,
123)
pear
lmill
et
Scl
ero
tinia
scle
rotio
rum
Scl
erot
inia
stem
MH
Mix
ed,i
nbre
edin
gM
ediu
m?
18
—(6
0)ro
tofc
anol
a
Se
tosp
ha
eria
turc
ica
Nor
ther
nco
rnle
afM
MM
ixed
Sm
all–
larg
e1
7–9
2(3
,6,1
22)
(Exs
ero
hilu
mtu
rcic
um;
syn:
blig
htH
elm
inth
osp
oriu
mtu
rcic
um)
Sp
oriso
riu
mre
ilia
nu
mS
orgh
uman
dm
aize
MM
Sex
ual,
Inbr
eedi
ngS
mal
l–m
ediu
m1
6–7
—(1
24)
head
smutAnn
u. R
ev. P
hyto
path
ol. 2
002.
40:3
49-3
79. D
ownl
oade
d fr
om a
rjou
rnal
s.an
nual
revi
ews.
org
by E
TH
on
06/2
8/05
. For
per
sona
l use
onl
y.

12 Jul 2002 9:59 AR AR165-PY40-13.tex AR165-PY40-13.SGM LaTeX2e(2002/01/18)P1: ILV
DURABLE RESISTANCE 365
Till
etia
triti
cian
dW
heat
com
mon
bunt
LH
Obl
igat
ory
sexu
alLa
rge
19
—(1
33)
T.la
evis
(stin
king
smut
)
Ust
ilag
oh
ord
ei
Bar
ley
smut
LH
Obl
igat
ory
sexu
alM
ediu
m1
8—
Ust
ilag
om
ayd
isM
aize
com
mon
smut
LH
Obl
igat
ory
sexu
alM
ediu
m1
8—
Ve
ntu
ria
ina
eq
ua
lisA
pple
scab
MM
Mix
edM
ediu
m–l
arge
18–
94
(71,
103,
121,
134)
(Sp
iloce
ap
om
i)
Xa
nth
om
on
as
cam
pe
stris
Bac
teria
lspo
tof
—Le
Ase
xual
Larg
e2
76
(25,
99,1
19)
pv.v
esi
cato
ria
tom
ato
and
pepp
er
Xa
nth
om
on
as
ma
lva
cea
rum
Cot
ton
blig
ht—
LeA
sexu
alLa
rge
27
6(1
0)
Xa
nth
om
on
as
Bac
teria
llea
f—
MA
sexu
alLa
rge
28
4(6
9,85
,102
)o
ryza
epv.
ory
zae
blig
htof
rice
a H=
high
;M=
mod
erat
e;an
dL=
low
gene
/gen
otyp
eflo
w.
b Mut
atio
nra
tes
are
know
nfo
ron
lya
smal
lnum
ber
ofpa
thog
ens.
Inpa
thos
yste
ms
whe
rem
utat
ion
rate
sar
ekn
own
tobe
high
,aris
kof
2w
asas
sign
edto
it,co
mpa
red
toa
risk
of1
for
othe
rsy
stem
sw
ithlo
wor
unkn
own
mut
atio
nra
tes.
All
bact
eria
wer
eas
sign
eda
risk
of2.
c Exp
ecte
dris
kw
asca
lcul
ated
asth
esu
mof
the
indi
vidu
alris
ksfo
rge
ne/g
enot
ype
flow
ofth
eas
exua
lpro
pagu
les
(hig
hge
ne/g
enot
ype
flow
=3;
mod
erat
ege
ne/g
enot
ype
flow=
2;lo
wge
ne/g
enot
ype
flow=
1),
repr
oduc
tion/
mat
ing
syst
em(m
ixed=
3;se
xual=
2;as
exua
l=1)
,ef
fect
ive
popu
latio
nsi
ze(la
rge=
3;m
ediu
m=
2;sm
all=
1),
and
mut
atio
nra
te(h
igh
mut
atio
nra
te=2;
aver
age
mut
atio
nra
te=1)
.d T
his
num
ber
repr
esen
tsth
eav
erag
enu
mbe
rof
year
sbe
fore
the
path
ogen
caus
edde
tect
able
dam
age
onpr
evio
usly
resi
stan
tcu
ltiva
rs.
The
sees
timat
esex
clud
eca
ses
whe
rere
sist
ance
gene
sre
mai
ned
effe
ctiv
e.In
man
yca
ses
thes
enu
mbe
rsva
ried
wid
ely
for
diffe
rent
resi
stan
cege
nes
and
thus
shou
ldbe
trea
ted
with
caut
ion.
Ris
kcl
asse
s:6
=1–
3ye
ars;
5=4–
6ye
ars;
4=
7–9
year
s;3=
10–1
2ye
ars;
2=13
–15
year
s;1=
mor
eth
an15
year
sun
tilbr
eakd
own.
Not
enou
ghin
form
atio
nw
asav
aila
ble
for
path
osys
tem
sin
dica
ted
with
a(
−).
e The
sepa
thog
ens
are
natu
rally
soilb
orne
and
are
expe
cted
toex
hibi
tlo
wge
ne/g
enot
ype
flow
.H
owev
er,
beca
use
som
ear
ese
edbo
rne
orm
ove
onin
fect
edpl
ant
mat
eria
l,ac
tual
gene
/gen
otyp
eflo
wca
nbe
muc
hhi
gher
asa
resu
ltof
hum
anac
tiviti
es.
Ann
u. R
ev. P
hyto
path
ol. 2
002.
40:3
49-3
79. D
ownl
oade
d fr
om a
rjou
rnal
s.an
nual
revi
ews.
org
by E
TH
on
06/2
8/05
. For
per
sona
l use
onl
y.

12 Jul 2002 9:59 AR AR165-PY40-13.tex AR165-PY40-13.SGM LaTeX2e(2002/01/18)P1: ILV
366 MCDONALD ¥ LINDE
Figure 5 The correlation between observed risk values and the predicted risk basedon the sum of gene/genotype flow and mutation. Values were taken from 34 plantpathosystems shown in Table 2. The dark triangle represents the largest outlier, thenematodeMeloidogyne incognita. Correlation and significance values (two-tailed t-test) were calculated excludingM. incognita.
X. campestrispv. vesicatoriaseems to exhibit limited gene/genotype flow as newpathotypes are often restricted to a specific country (49). However, gene flow isexpected to be higher than inX. oryzaepv. oryzaebecauseX. campestrispv.vesicatoriacan be seedborne (99).
Puccinia triticina
The wheat leaf rust fungus,P. triticina, represents a group of asexual rust pathogensthat fall in a medium risk category because of long-distance genotype flow. It isasexual (17) in most of the world except in the Mediterranean area (63), whereit would be placed in a higher risk category. Large population sizes can be main-tained by overwintering of local populations on winter wheat crops (63). Springwheat breeding programs in North America (62) and Australia (83) have generallybeen successful in producing cultivars with durable resistance. In contrast, winterwheats grown in the southern plains of the United States often lose effective resis-tance after only a few years (70). The faster resistance breakdown in the southernUnited States could be explained by a combination of high gene/genotype flowand large effective population sizes maintained over much of the period when the
Ann
u. R
ev. P
hyto
path
ol. 2
002.
40:3
49-3
79. D
ownl
oade
d fr
om a
rjou
rnal
s.an
nual
revi
ews.
org
by E
TH
on
06/2
8/05
. For
per
sona
l use
onl
y.

12 Jul 2002 9:59 AR AR165-PY40-13.tex AR165-PY40-13.SGM LaTeX2e(2002/01/18)P1: ILV
DURABLE RESISTANCE 367
wheat crop is in the ground. Thus, this pathogen provides us with an opportunityto compare the evolutionary potential of populations with different effective pop-ulation sizes. Fewer pathotypes are found in Australia compared to Canada (61),perhaps reflecting lower evolutionary potential in the Australian population dueto a founder effect.Lr13 broke down within a few years of release in the UnitedStates and Canada (61), South Africa, Europe, Mexico, and South America (114),but it remained effective in Australia for more than 20 years (84).
Phytophthora sojae on Soybean
Phytophthora sojae(syn.Phytophthora megaspermaf. sp.glycinea) is a homothal-lic (self-fertile) Oomycetous fungus, causing a root and stem rot of soybean. It isa medium-risk pathogen because it has the potential to outcross, but has lim-ited potential for gene flow because it is soilborne. Already, 46 pathotypes havebeen described for theP. sojaesoybean pathosystem (1, 108). DifferentP. sojaepathotypes probably evolved independently from the same clonal lineage, as itis homothallic and a poor correlation was found between RFLPs (132), mtDNApolymorphisms (30), and pathotypes. However,P. sojaedoes outcross at low fre-quencies (31, 132), and some of the pathotypes may have been created as a resultof outcrossing, although mutation is thought to be more important for creatingdiversity (31). A substantial level of genetic variation using RFLP markers was ob-served in the U.S. population, suggestingP. sojaemay be native to the United States(31). Single-gene resistance has been somewhat durable, lasting for 6 to 15 years(108, 111, 126). The longevity ofRpsresistance may reflect the soilborne natureof this pathogen. The dynamics of infection and subsequent inoculum productionand dissemination are limited to the soil environment. Because secondary infec-tion is limited, it is effectively a monocyclic disease, so there is only one chanceto develop new pathotypes during a growing season, giving it a lower effectivepopulation size.
Phytophthora infestans on Potatoes
Phytophthora infestansis heterothallic and has a high potential for genotype flowbecause it produces airborne asexual spores.P. infestansfirst appeared in theUnited States in 1843 and migrated to Europe in 1845. There is good evidence thatthe European population consisted of only one clone introduced from the UnitedStates (34). The introducedP. infestanspopulation probably consisted of only theA1 mating type and thus was restricted to asexual reproduction (33). As a result ofthe limited number of founding individuals and lack of recombination, Europeanpopulations ofP. infestanshave exhibited low levels of gene and genotype diversityover most of the past 155 years. The A2 mating type was first reported in Europein 1980, but it appears likely that A2 was introduced into Europe some time in the1970s. Since the introduction of the opposite mating type,P. infestanspopulationsin Europe have begun to reproduce sexually and produce oospores that have thepotential to overwinter in the soil. Thus, the introduction of the opposite matingtype has increased its evolutionary potential in the risk diagram (Figure 4) as a
Ann
u. R
ev. P
hyto
path
ol. 2
002.
40:3
49-3
79. D
ownl
oade
d fr
om a
rjou
rnal
s.an
nual
revi
ews.
org
by E
TH
on
06/2
8/05
. For
per
sona
l use
onl
y.

12 Jul 2002 9:59 AR AR165-PY40-13.tex AR165-PY40-13.SGM LaTeX2e(2002/01/18)P1: ILV
368 MCDONALD ¥ LINDE
result of the introduction of a sexual cycle. It is not yet clear if the oospores willincrease the population size sufficiently to merit a further increase in the risk value.
Blumeria graminis on Barley and Wheat
Blumeria graminisis characterized as a high-risk pathogen with a high potentialfor gene and genotype flow. It reproduces asexually on the crop and can survive be-tween crops as asexual colonies or as sexual ascospores inside cleistothecia. Greenbridges of host plants occur where winter and spring wheat or barley cultivars aregrown within the same genetic neighborhood, resulting in a very large effectivepopulation size. An annual sexual cycle produces many new allele combinations,and succeeding cycles of asexual reproduction can rapidly increase the frequenciesof selected allele combinations. These pathogens have a long history of defeatingsingle, major resistance genes and pyramids of major resistance genes. Barley cul-tivars with major gene resistance select isolates ofBlumeria graminisf. sp.hordeiwith matching virulence, and the effectiveness of most major gene resistance islost through the evolution of corresponding virulence in the pathogen (135). Manybarley cultivars with two resistance genes have rapidly become susceptible (135).
A DECISION DIAGRAM TO AID RESISTANCEBREEDING PROGRAMS
In this section, we propose guidelines based on the evolutionary potential of thepathogen to choose appropriate types of resistance and decide how to deploy majorresistance genes in a breeding program. The purpose here is to offer advice on thebest way to manage limited genetic resources in order to extend the useful life ex-pectancy of available genetic resistance. We have distilled most of these ideas intoa simple decision diagram presented in Figure 6. This diagram offers some broadguidelines to consider before embarking on a resistance-breeding project, with theobjective of matching the weapons (resistance-genes) to the targets (pathogens).The breeding goal is to choose the appropriate type of genetic resistance and thenapply a resistance gene management strategy that will match the pathogen’s bi-ology and minimize the likelihood that the pathogen population will evolve toovercome the resistance. In particular, we have attempted to indicate when single,major gene resistance is likely to be most effective, when resistance gene pyramidsare most likely to fail, and when gene deployment options such as cultivar mixturesor multilines should be considered early in the breeding program. Earlier versionsof this decision diagram were presented elsewhere (77, 78).
The decision diagram assumes that major gene resistance is based on thereceptor-elicitor model characteristic of the gene-for-gene relationship, and thatquantitative resistance is a quantitative character based on several unlinked genesthat usually show equal and additive effects. It is worth noting that the genesunderlying quantitative resistance do not always contribute equally to resistance[e. g., (112a)], and in some cases it appears that only one or a few genes may make
Ann
u. R
ev. P
hyto
path
ol. 2
002.
40:3
49-3
79. D
ownl
oade
d fr
om a
rjou
rnal
s.an
nual
revi
ews.
org
by E
TH
on
06/2
8/05
. For
per
sona
l use
onl
y.

12 Jul 2002 9:59 AR AR165-PY40-13.tex AR165-PY40-13.SGM LaTeX2e(2002/01/18)P1: ILV
DURABLE RESISTANCE 369
Figure 6 A simplified decision diagram to assist with developing resistance-breedingstrategies to achieve durable disease resistance. Major gene resistance (MGR): resis-tance that has large effects, is based on the hypersensitive response and follows thereceptor-elicitor model of the gene-for-gene interaction. Quantitative resistance (QR):resistance that has, on average, small, nearly equal, and additive effects that are equallyeffective against all strains of the pathogen.
the major contribution to a quantitative trait. The diagram assumes that both typesof resistance are available to the breeder, and that major gene resistance is preferredbecause it is easier to recognize and is more easily utilized in a breeding program.We did not attempt to include the effects of different mutation rates, populationsizes, or the full range of reproduction/mating systems. This diagram can be ex-tended with many additional branch points to encompass the full range of possibleinteractions among evolutionary forces and potential pathogen population geneticstructures. The outcome of the decision diagram is a general recommendation forchoosing the type of resistance to use and the optimum deployment method withthe aim of maximizing the useful lifespan of the resistance. This diagram shouldbe considered in the appropriate context in a resistance-breeding program, as anaid to assist decision-making. It is not intended as an authoritative guide that willlead to durable resistance.
At one end of the decision diagram are pathogens that have strictly asexual re-production, a low potential for gene/genotype flow, and small effective population
Ann
u. R
ev. P
hyto
path
ol. 2
002.
40:3
49-3
79. D
ownl
oade
d fr
om a
rjou
rnal
s.an
nual
revi
ews.
org
by E
TH
on
06/2
8/05
. For
per
sona
l use
onl
y.

12 Jul 2002 9:59 AR AR165-PY40-13.tex AR165-PY40-13.SGM LaTeX2e(2002/01/18)P1: ILV
370 MCDONALD ¥ LINDE
sizes. In our risk model, these are pathogens with the lowest evolutionary potential.These pathogen populations are characterized by low genotypic diversity that isoften arrayed in a limited number of clonal lineages. When a mutation occurs fromavirulence to virulence, it occurs randomly within a clonal lineage, and the virulentlineage does not disperse far from its origin due to lack of long-distance dispersalmechanisms. The virulence mutation is “trapped” in the original clonal lineage ow-ing to the absence of meiosis and recombination. For these pathogens, a breedingstrategy that relies on single major resistance genes is likely to be durable becausethe mutation to virulence will occur in a limited number of genetic backgroundsand the virulent lineages that inevitably arise are unlikely to move quickly to newfields planted to the same major resistance gene. An example of a class of pathogensthat follow this life history is theFusarium oxysporumwilts on many crops.
The next category in the decision diagram is asexual or inbreeding pathogensthat exhibit a high potential for genotype flow. These pathogens also exhibitlow genotypic diversity, but when the virulent lineage arises by mutation, it ismoved efficiently to neighboring fields or adjacent agricultural regions. In our riskmodel, these are pathogens with an intermediate evolutionary potential. For thesepathogens, a breeding strategy that pyramids major resistance genes is likely to bedurable because it is unlikely that a sequence of multiple mutations to virulence(loss of several elicitors simultaneously) will occur in the same clonal lineage.Examples of pathogens that follow this life history are the asexual rusts andMag-naporthe grisea. Pathogens that have a sexual cycle, but appear to be mainlyinbreeding, such asSclerotinia sclerotiorum(59), may also fall into this category.
Pathogens that exhibit mixed reproduction that includes regular recombinationpose a different type of evolutionary risk that requires a different breeding strat-egy. These pathogens exhibit higher genotype diversity as a result of recombinationand have greater potential for local adaptation to a changing environment. Aftera mutation to virulence occurs, it can be recombined into many different geneticbackgrounds, and it can be recombined with other virulence mutations that occurat unlinked loci. Thus pyramids are not an optimum approach for these pathogens.Pathogens with a mixed reproduction system and a low potential for gene/genotypeflow are placed in an intermediate risk category. For these pathogens, breedersshould focus on quantitative resistance instead of major gene resistance. As aresult of the mixed reproduction system, the mutation for virulence can be re-combined into many different genetic backgrounds, and it is likely that one ormore of the resulting pathogen strains will have a high level of fitness on thecorresponding resistant cultivar. A major resistance gene is likely to break downquickly under these circumstances. In the presence of quantitative resistance, thepathogen may evolve increased pathogenicity (the counterpart of plant quantitativeresistance), as shown in our model (Figure 1; Figure in Supplementary Materialson http://www.annualreviews.org/). To evolve a higher level of pathogenicity, thepathogen must recombine a number of alleles at independent loci into a singlegenotype (a coadapted gene complex). Sexual reproduction will tend to break upthese coadapted gene complexes in pathogen genotypes that have a high level of
Ann
u. R
ev. P
hyto
path
ol. 2
002.
40:3
49-3
79. D
ownl
oade
d fr
om a
rjou
rnal
s.an
nual
revi
ews.
org
by E
TH
on
06/2
8/05
. For
per
sona
l use
onl
y.

12 Jul 2002 9:59 AR AR165-PY40-13.tex AR165-PY40-13.SGM LaTeX2e(2002/01/18)P1: ILV
DURABLE RESISTANCE 371
pathogenicity, thus the increase in pathogenicity in sexually reproducing pathogensmay occur quite slowly and escape notice if asexual spores are not widely dispersedor if there are few asexual pathogen reproduction cycles per crop generation. Ifquantitative resistance is not available, then major gene resistance can be deployedin rotations through time or space. Rotations on a regional basis are expected to beeffective against low gene flow pathogens because the virulent mutants that ariseto overcome a major resistance gene in one region will not be likely to emigrate toother regions. Rotations of major resistance genes through time will produce dis-ruptive selection that may prevent different virulence mutations from accumulatingin the same genotype.
The highest risk pathogens have a mixed reproduction system and a high degreeof gene/genotype flow. We believe that these pathogens will require the greatesteffort to achieve durable resistance because the mutations to virulence can berecombined into many genetic backgrounds until a pathogen clone with high fitnessappears, and then this adapted genotype can be dispersed across long distancesand into new populations. For pathogens in this risk category, we suggest thebreeding effort should concentrate on quantitative resistance that will need to berenewed regularly to stay ahead of the pathogen. If quantitative resistance is notavailable, then major gene resistance should be managed aggressively, includingdevelopment of cultivar mixtures and multilines that can be used in combinationwith regional and temporal deployment strategies.
GENETICALLY ENGINEERED RESISTANCE
We have entered the era of genetic engineering of our major crops with caution.Genetic engineering technologies clearly offer great potential, but genetically engi-neered crops present a number of uncharacterized risks that require further investi-gation. One risk is that genetically engineered resistance genes will face the sameboom-and-bust cycles as the major resistance genes incorporated by traditionalbreeding methods. As molecular characterization of resistance genes proceeds,it will become progressively easier to manipulate genetic resistance and transferresistance genes within and among species. Our present knowledge indicates thatplants evolved leucine-rich repeat (LRR)-types of receptors to recognize a diversearray of pathogen elicitors, and it is likely that pathogens coevolved with these re-ceptors for millions of generations before agriculture arose. With this long historyof coevolution, it seems unlikely that we will be able to eliminate plant diseasesby engineering new receptors or combinations of receptors and putting them intoour crops. Pathogens will continue to evolve. However, genetic engineering offersnew opportunities to stay a few steps ahead of the pathogen. Genetic engineeringcan be used to create novel pyramids of major resistance alleles that can be trans-ferred into plants as a cassette of linked genes. It may become possible to create apyramid more quickly through a single transformation step than through a series ofhybridizations and backcrosses. Of course, plants already have evolved cassettes
Ann
u. R
ev. P
hyto
path
ol. 2
002.
40:3
49-3
79. D
ownl
oade
d fr
om a
rjou
rnal
s.an
nual
revi
ews.
org
by E
TH
on
06/2
8/05
. For
per
sona
l use
onl
y.
12 Jul 2002 9:59 AR AR165-PY40-13.tex AR165-PY40-13.SGM LaTeX2e(2002/01/18)P1: ILV
372 MCDONALD ¥ LINDE
of linked resistance genes over evolutionary timescales, and pathogens are stillwith us. Genetic engineering also could be used to synthesize multilines quicklyand efficiently by inserting different resistance alleles into superior agronomicgenotypes as they are developed. This approach may allow us to impose disruptiveselection that slows pathogen evolution, but it is unlikely to eliminate the pathogen.It is most likely that pathogen populations will continue to evolve and respond tothe new forms of genetic resistance that we deploy through genetic engineering.But with careful management of these new, engineered resistance genes, we maybe able to create truly durable forms of genetic resistance. The best way to insurethe durability of these new engineered resistance genes is to manage them wiselyusing knowledge of the evolutionary potential of the pathogen population.
The Annual Review of Phytopathologyis online at http://phyto.annualreviews.org
LITERATURE CITED
1. Abney TS, Melagar JN, Richards TL,Scott DH, Grogan J, Young J. 1997. Newraces ofPhytophthora sojaewith Rps1-dvirulence.Plant Dis.81:653–55
2. Bartos P, Fleischmann G, Samborski DJ,Shipton WA. 1969. Studies on asexualvariation in the virulence of oat crownrust,Puccinia coronataf. sp.avenae, andwheat leaf rust,Puccinia recondita.Can.J. Bot.47:1383–87
3. Bergquist RR, Masias OR. 1974. Phys-iologic specialization inTrichometas-phaeria turcicaf. sp.zeaandT. turcicain Hawaii.Phytopathology76:546–49
4. Biffen RH. 1905. Mendel’s laws of in-heritance and wheat breeding.J. Agric.Sci.1:4–48
5. Bonman JM, Khush GS, Nelson RJ.1992. Breeding rice for resistance topests.Annu. Rev. Phytopathol.30:507–26
6. Borchardt DS, Welz HG, Geiger HH.1998. Genetic structure ofSetosphaeriaturcica populations in tropical and tem-perate climates.Phytopathology 88:322–29
7. Bouhot D. 1981. Some aspects of thepathogenic potential in formae specialesand races ofFusarium oxysporumonCucurbitaceae. InFusarium: Diseases,Biology, and Taxonomy, ed. PE Nelson,
TA Toussoun, WFO Marasas, pp. 318–26. University Park, PA: Penn. StateUniv. Press
8. Brent KJ, Hollomon DW. 1998. Fungi-cide resistance: the assessment of risk.FRAC Monogr. No. 2, Global Prot. Fed.48 pp.
9. Brewbaker JL. 1983. Breeding for dis-ease resistance. InChallenging Prob-lems in Plant Health, ed. T Kommedahl,PH Williams, pp. 441–49. St. Paul, MN:Am. Phytopathol. Soc.
10. Brinkerhoff LA. 1970. Variation inXan-thomonas malvacearumand its rela-tion to control.Annu. Rev. Phytopathol.8:85–110
11. Brown JKM, Foster EM, O’Hara RB.1997. Adaptation of powdery mildewpopulations to cereal varieties in rela-tion to durable and non-durable resis-tance. InThe Gene-for-Gene Relation-ship in Plant-Parasite Interaction, ed. IRCrute, EB Holub, JJ Burdon, pp. 119–38.Wallingford, UK: CABI
12. Browning M, Rowley LV, Zeng PY,Chandlee JM, Jackson N. 1999. Morpho-logical, pathogenic, and genetic compar-isons ofColletotrichum graminicolaiso-lates from poaceae.Plant Dis.83:286–92
13. Brun H, Levivier S, Somda I, Ruer D,
Ann
u. R
ev. P
hyto
path
ol. 2
002.
40:3
49-3
79. D
ownl
oade
d fr
om a
rjou
rnal
s.an
nual
revi
ews.
org
by E
TH
on
06/2
8/05
. For
per
sona
l use
onl
y.

12 Jul 2002 9:59 AR AR165-PY40-13.tex AR165-PY40-13.SGM LaTeX2e(2002/01/18)P1: ILV
DURABLE RESISTANCE 373
Renard M, Ch`evre AM. 2000. A fieldmethod for evaluating the potential dura-bility of new resistance sources: applica-tion to the Leptosphaeria maculans–Brassica napuspathosystem.Phyto-pathology90:961–66
14. Brurberg MB, Hannukkala A, Her-mansen A. 1999. Genetic variability ofPhytophthora infestansin Norway andFinland as revealed by mating type andfingerprint probe RG57.Mycol. Res.103:1609–15
15. Burdon JJ, Luig NH, Marshall DR. 1983.Isozyme uniformity and virulence vari-ation in Puccinia graminisf. sp. triticiandP. reconditaf. sp.tritici in Australia.Aust. J. Biol. Sci.36:403–10
16. Burdon JJ, Roberts JK. 1995. The pop-ulation genetic structure of the rust fun-gus Melampsora lini as revealed bypathogenicity, isozyme and RFLP mark-ers.Plant Pathol.44:270–78
17. Burdon JJ, Roelfs AP. 1985. The ef-fect of sexual and asexual reproductionon the isozyme structure of populationsof Puccinia graminis. Phytopathology75:1068–73
18. Burdon JJ, Roelfs AP. 1985. Isozyme andvirulence variation in asexually repro-ducing populations ofPuccinia graminisandPuccinia reconditaon wheat.Phy-topathology75:907–13
19. Carlier J, Lebrun MH, Zapater MF,Dubois C, Mourichon X. 1996. Geneticstructure of the global population ofbanana black leaf streak fungus,My-cosphaerella fijiensis. Mol. Ecol.5:499–510
20. Caten CE, Person C, Groth JV, Dhahi SJ.1983. The genetics of pathogenic aggres-siveness in three dikaryons ofUstilagohordei. Can. J. Bot.62:1209–19
21. Chen RS, McDonald BA. 1996. Sex-ual reproduction plays a major role inthe genetic structure of populations ofthe fungusMycosphaerella graminicola.Genetics142:1119–27
22. Chong J, Kolmer JA. 1993. Virulence
dynamics and phenotypic diversity ofPuccinia coronata f. sp. avenae inCanada from 1974 to 1990.Can J. Bot.71:248–55
23. Cowger C, Hoffer ME, Mundt CC. 2000.Specific adaptation byMycosphaerellagraminicolato a resistant wheat cultivar.Plant Pathol.49:445–51
24. Crute IR. 1992. From breeding tocloning (and back again?): a case studywith lettuce downy mildew.Annu. Rev.Phytopathol.30:485–506
25. Dahlbeck D, Stall RE. 1979. Mutationsfor change of race in culture ofXan-thomonas vesicatoria. Phytopathology69:634–36
26. Drenth A, Tas ICQ, Govers F. 1994.DNA fingerprinting uncovers a new sex-ually reproducing population ofPhy-tophthora infestansin the Netherlands.Eur. J. Plant Pathol.100:97–107
27. Dubin HJ, Rajaram S. 1996. Breed-ing disease-resistant wheats for tropicalhighlands and lowlands.Annu. Rev. Phy-topathol.34:503–26
28. Flor HH. 1956. The complementarygenic systems in flax and flax rust.Adv.Genet.8:29–54
29. Flor HH. 1958. Mutation to wider viru-lence inMelampsora lini. Phytopathol-ogy48:297–301
30. Forster H, Kinscherf IG, Leong SA,Maxwell DP. 1989. Restriction frag-ment polymorphisms of the mitochon-drial DNA of Phytophthora megaspermaisolated from soybean, alfalfa, and fruittrees.Can. J. Bot.67:529–31
31. Forster H, Tyler B, Coffey MD. 1994.Phytophthora sojaeraces have arisen byclonal evolution and by rare outcrosses.Mol. Plant-Microbe Interact.7:780–91
32. Funnell DL, Matthews PS, VanEttenHD. 2000. Breeding for highly fertileisolates ofNectria haematococcaMPVIthat are highly virulent on pea andinplanta selection for virulent recombi-nants.Phytopathology91:92–101
33. Goodwin SB. 1997. The population
Ann
u. R
ev. P
hyto
path
ol. 2
002.
40:3
49-3
79. D
ownl
oade
d fr
om a
rjou
rnal
s.an
nual
revi
ews.
org
by E
TH
on
06/2
8/05
. For
per
sona
l use
onl
y.

12 Jul 2002 9:59 AR AR165-PY40-13.tex AR165-PY40-13.SGM LaTeX2e(2002/01/18)P1: ILV
374 MCDONALD ¥ LINDE
genetics ofPhytophthora. Phytopathol-ogy87:462–73
33a. Goodwin SB, Cavaletto JR, WaalwijkC, Kema GHJ. 2001. DNA fingerprintprobe fromMycosphaerella graminicolaidentifies an active transposable element.Phytopathology91:1181–88
34. Goodwin SB, Cohen BA, Fry WA. 1994.Panglobal distribution of a single clonallineage of the Irish potato famine fungus.Proc. Natl. Acad. Sci. USA91:11591–95
35. Goodwin SB, Drenth A. 1997. Origin ofthe A2 mating type ofPhytophthora in-festansoutside Mexico.Phytopathology87:992–99
36. Goodwin SB, Sujkowski LS, Dyer AT,Fry BA, Fry WE. 1995. Direct detec-tion of gene flow and probable sexualreproduction ofPhytophthora infestansin Northern America.Phytopathology85:473–79
37. Gordon TR, Martyn RD. 1997. The evo-lutionary biology ofFusarium oxyspo-rum. Annu. Rev. Phytopathol.35:111–28
38. Groth JV, Roelfs AP. 1982. Effects ofsexual and asexual reproduction on raceabundance in cereal rust fungus popula-tions.Phytopathology72:1503–7
39. Hayden HL. 2000.Population geneticstudies of Mycosphaerella species infect-ing banana. PhD thesis. Univ. Queens-land, St. Lucia, Aust.
40. Houston BR, Ashworth LJ Jr. 1957.Newly determined races of the barleyscald fungus in California.Phytopathol-ogy47:525
41. Howard HW, Johnson R, Russell GE,Wolfe MS. 1970.Problems in breedingfor resistance to diseases and pests.Rep.Plant Breed. Inst. 1969, Cambridge
42. Hubbeling N. 1978. Breakdown of resis-tance of the CF5 gene in tomato by an-other new race ofFulvia fulva.Med. Fac.Landbouww. Rijksuniv. Gent43:891–94
43. Hulbert SH, Lyons PC, Bennetzen JL.1991. Reactions of maize lines carry-ing Rpresistance genes to isolates of the
common rust pathogen,Puccinia sorghi.Plant Dis.75:1130–33
44. Jackson LF, Webster RK. 1976. Race dif-ferentiation, distribution, and frequencyof Rhynchosporium secalisin California.Phytopathology66:719–25
45. Jeger MJ, Gilijamse E, Bock CH, Frink-ing H. 1998. The epidemiology, variabil-ity and control of the downy mildewsof pearl millet and sorghum, with par-ticular reference to Africa.Plant Pathol.47:544–69
46. Johnson KB, Stockwell VO. 1998. Man-agement of fire blight: a case studyin microbial ecology.Annu. Rev. Phy-tophathol.36:227–48
47. Johnson R. 1992. Reflections of a plantpathologist on breeding for disease resis-tance, with emphasis on yellow rust andeyespot of wheat.Plant Pathol.41:239–54
48. Johnson R, Taylor AJ. 1980. Pathogenicvariation inPuccinia striiformisin rela-tion to the durability of yellow rust resis-tance in wheat.Ann. Appl. Biol.94:283–86
49. Jones JB, Stall RE, Bouzar H. 1998. Di-versity amongXanthomonaspathogenicon pepper and tomato.Annu. Rev. Phy-topathol.36:41–58
50. Jones SS, Murray TD, Allan RE. 1995.Use of alien genes for the developmentof disease resistance in wheat.Annu. Rev.Phytopathol.33:429–43
51. Joosten MHAJ, Cozijnsen TJ, de WitPJGM. 1994. Host-resistance to fungaltomato pathogen lost by a single base-pair change in an avirulence gene.Na-ture367:384–86
52. Jørgensen HJL, Smedegaard-Petersen V.1999. Host pathogen interactions in theSeptoria-disease complex. See Ref. 70a,pp. 131–60
53. Keeling BL. 1982. Four new physiologicraces ofPhytophthora megaspermaf. sp.glycinea. Plant Dis.66:334–35
54. Kema GHJ, Sayoud R, Annone JG, VanSilfhout CH. 1996. Genetic variation for
Ann
u. R
ev. P
hyto
path
ol. 2
002.
40:3
49-3
79. D
ownl
oade
d fr
om a
rjou
rnal
s.an
nual
revi
ews.
org
by E
TH
on
06/2
8/05
. For
per
sona
l use
onl
y.

12 Jul 2002 9:59 AR AR165-PY40-13.tex AR165-PY40-13.SGM LaTeX2e(2002/01/18)P1: ILV
DURABLE RESISTANCE 375
virulence and resistance in the wheat–Mycosphaerella graminicolapathosys-tem. II. Analysis of interactions be-tween pathogen isolates and host culti-vars.Phytopathology86:213–20
55. Kerr EA, Patrick ZA, Bailey DL. 1971.Resistance in tomato species to newraces of leaf mold (Cladosporium fulvumCke.).Hortic. Res.11:84–92
56. Kilpatrick RA. 1975. New wheat cul-tivars and longevity of rust resistance,1971–75.US Dep. Agric. Res. Serv.NE64:1–20
57. Kiyosawa S. 1982. Genetics and epi-demiological modelling of breakdown ofplant disease resistance.Annu. Rev. Phy-topathol.20:93–117
58. Koenig HC, Ploetz RC, Kistler HC.1997.Fusarium oxysporumf. sp. cub-enseconsists of a small number of di-vergent and globally distributed clonallineages.Phytopathology87:915–23
59. Kohli Y, Brunner LJ, Yoell H, Mil-groom MG, Anderson JB, et al. 1995.Clonal dispersal and spatial mixing inpopulations of the plant pathogenic fun-gus,Sclerotinia sclerotiorum. Mol. Ecol.4:69–77
60. Kohn LM. 1995. The clonal dynamicin wild and agricultural plant-pathogenpopulations.Can. J. Bot.73:S1231–40
61. Kolmer JA. 1989. Virulence and race dy-namics ofPuccinia reconditaf. sp. trit-ici in Canada during 1956–1987.Phy-topathology79:349–56
62. Kolmer JA. 1991. Effect of sexual re-combination in two populations of thewheat leaf rust fungusPuccinia recon-dita. Can. J. Bot.70:359–63
63. Kolmer JA. 1992. Diversity of virulencephenotypes and effect of host samplingbetween and within populations ofPuc-cinia reconditaf. sp. tritici in Canada.Plant Dis.76:618–21
64. Kolmer JA. 1996. Genetics of resis-tance to wheat leaf rust.Annu. Rev. Phy-topathol.34:435–55
65. Kousik CS, Ritchie DF. 1996. Race shift
in Xanthomonas campestrispv.vesicato-ria within a season in field-grown pep-per.Phytopathology86:952–58
66. Lamari L, Sayoud R, Boulif M, BernierCC. 1995. Identification of a new racein Pyrenophora tritici-repentis: implica-tions for the current pathotype classi-fication system.Can. J. Plant Pathol.17:312–18
67. Leach JE, Cruz CMV, Bai JF, Leung H.2001. Pathogen fitness penalty as a pre-dictor of durability of disease resistancegenes.Annu. Rev. Phytopathol.39:187–224
68. Leary JV, Wilbur WD. 1976. Identifica-tion of the races ofFusarium oxysporumf. sp.meloniscausing wilt of muskmelonin California.Phytopathology66:15–16
69. Li Z-K, Luo LJ, Mei HW, Paterson AH,Zhao XH, et al. 1999. A “defeated” riceresistance gene acts as a QTL against avirulent strain ofXanthomonas oryzaepv. oryzae. Mol. Gen. Genet.261:58–63
69a. Linde C, Zhan J, McDonald BA. 2002.Population structure ofMycosphaerellagraminicola:From lesions to continents.Phytopathology.In press
70. Long DL, Roelfs AP, Roberts JJ. 1992.Virulence of Puccinia reconditaf. sp.tritici in the United States during 1988–1990.Plant Dis.76:495–99
70a. Lucas JA, Bowyer P, Anderson HM, eds.1999.Septoria on Cereals: A Study ofPathosystems.Wallingford, UK: CABI
71. MacHardy WE, Gadoury DM, GesslerC. 2001. Parasitic and biological fit-ness ofVenturia inaequalis: relationshipto disease management strategies.PlantDis. 85:1036–51
72. Mahuku GS, Goodwin PH, Hall R,Hsiang T. 1997. Variability in the highlyvirulent type ofLeptosphaeria maculanswithin and between oilseed rape fields.Can. J. Bot.75:1485–92
73. Malcolmson JF. 1969. Races ofPhy-tophthora infestansoccurring in GreatBritain. Trans. Br. Mycol. Soc.53:417–23
Ann
u. R
ev. P
hyto
path
ol. 2
002.
40:3
49-3
79. D
ownl
oade
d fr
om a
rjou
rnal
s.an
nual
revi
ews.
org
by E
TH
on
06/2
8/05
. For
per
sona
l use
onl
y.

12 Jul 2002 9:59 AR AR165-PY40-13.tex AR165-PY40-13.SGM LaTeX2e(2002/01/18)P1: ILV
376 MCDONALD ¥ LINDE
74. Martens JW, Dyck PL. 1989. Genetics ofresistance to rust in cereals from a Cana-dian perspective.Can. J. Plant Pathol.11:78–85
75. McCracken AR, Dawson WM. 1998.Short rotation coppice willow in North-ern Ireland since 1973: development ofthe use of mixtures in the control of fo-liar rust (Melampsoraspp.).Eur. J. For.Pathol.28:241–50
76. McDonald BA. 1997. The populationgenetics of fungi: tools and techniques.Phytopathology87:448–53
77. McDonald BA. 1999. The population ge-netics of plant pathogens and resistancebreeding strategies.Vortr. Pflanzenzucht.46:235–44
78. McDonald BA, Linde C. 2002. Pathogenpopulation genetics and the durability ofdisease resistance.Euphytica.In press
79. McDonald BA, Miles J, Nelson LR,Pettway RE. 1994. Genetic variability innuclear DNA in field populations ofStagonospora nodorum. Phytopathol-ogy84:250–55
80. McDonald BA, Pettway RE, Chen RS,Boeger JM, Martinez JP. 1995. Thepopulation genetics ofSeptoria tritici(teleomorph Mycosphaerella gramini-cola). Can. J. Bot. 73(Suppl.):S292–S301
81. McDonald BA, Zhan J, Burdon JJ.1999. Genetic structure ofRhynchospo-rium secalisin Australia.Phytopathol-ogy89:639–45
82. McDonald BA, Zhan J, Yarden O, HoganK, Garton J, Pettway RE. 1999. Thepopulation genetics ofMycosphaerellagraminicola and Phaeosphaeria nodo-rum. See Ref. 70a, pp. 44–69
83. McIntosh RA. 1992. Pre-emptive breed-ing to control wheat rusts.Euphytica63:103–13
84. McIntosh RA, Brown GN. 1997. Antici-patory breeding for resistance to rust dis-eases in wheat.Annu. Rev. Phytopathol.35:311–26
84a. Mes JJ, Haring MA, Cornelissen BJC.
2000. Foxy: an active family of short in-terspersed nuclear elements fromFusar-ium oxysporum. Mol. Gen. Genet.263:271–80
85. Mew TW, Vera Cruz CM, Medalla ES.1992. Changes in race frequency ofXan-thomonas oryzaepv. oryzaein responseto rice cultivars planted in the Philip-pines.Plant Dis.76:1029–32
86. Mouliom-Pefoura A. 1999. First obser-vation of the breakdown of high resis-tance in Yangambi km 5 (Musasp.) to theblack leaf streak disease in Cameroon.Plant Dis.83:78
87. Mundt CC, Ahmed HU, Finckh MR,Nieva LP, Alfonso RF. 1999. Primarydisease gradients of bacterial blight ofrice.Phytopathology89:64–67
88. Mundt CC, Hoffer ME, Ahmed HU,Coakley SM, DiLeone JA, Cowger C.1999. Population genetics and host re-sistance. See Ref. 70a, pp. 115–30
89. Nelson RJ, Baraoidan MR, Vera CruzCM, Yap IV, Leach JE, et al. 1994. Rela-tionship between phylogeny and patho-type for the bacterial blight pathogen ofrice.Appl. Environ. Microbiol.60:3275–83
90. Palumbi SR. 2001. Humans as theworld’s greatest evolutionary force.Sci-ence293:1786–90
91. Pan XB, Rush MC, Sha XY, Xie QJ,Linscombe SD, et al. 1999. Major gene,nonallelic sheath blight resistance fromthe rice cultivars Jasmine 85 and Teqing.Crop Sci.39:338–46
92. Pande S, Thakur RP, Karunakar RI,Bandyopadhyay R, Reddy BVS. 1994.Development of screening methods andidentification of stable resistance to an-thracnose in sorghum.Field Crops Res.38:157–66
93. Park FF, Oates DD, Meldrum S. 2000.Recent pathogenic changes in the leaf(brown) rust pathogen of wheat and thecrown rust pathogen of oats in Australiain relation to host resistance.Acta Phy-topathol. Entomol. Hung.35:387–94
Ann
u. R
ev. P
hyto
path
ol. 2
002.
40:3
49-3
79. D
ownl
oade
d fr
om a
rjou
rnal
s.an
nual
revi
ews.
org
by E
TH
on
06/2
8/05
. For
per
sona
l use
onl
y.

12 Jul 2002 9:59 AR AR165-PY40-13.tex AR165-PY40-13.SGM LaTeX2e(2002/01/18)P1: ILV
DURABLE RESISTANCE 377
94. Pastor-Corrales MA, Otoya MM, MolinaA, Singh SP. 1995. Resistance toColletotrichum lindemuthianumisolatesfrom Middle America and Andean SouthAmerica in different common beanraces.Plant Dis.79:63–67
95. Pataky JK, Pate MC, Hulbert SH. 2001.Resistance genes in therp1 region ofmaize effective againstPuccinia sorghivirulent on theRp1-D gene in NorthAmerica.Plant Dis.85:165–68
96. Pei MH, Yuan ZW, Hunter T, Ruiz C.2000. Heterogenous nature of a ‘new’pathotype ofMelampsorarust onSalixrevealed by AFLP.Eur. J. Plant Pathol.106:771–79
97. Pinon J, Frey P. 1997. Structure ofMela-mpsora larici-populinapopulations onwild and cultivated poplar.Eur. J. PlantPathol.103:159–73
98. Ploetz RC, Pegg KG. 1999. Fusariumwilt. In Diseases of Banana, Abaca andEnset, ed. DR Jones, pp. 143–59. Wall-ingford, UK: CABI
99. Pohrenezny K, Stall RE, Caneros BI,Kegley M, Datnoff LE, Subramanya R.1992. Sudden shift in the prevalent raceof Xanthomonas campestrispv. vesica-toria in pepper fields in southern Florida.Plant Dis.76:118–20
100. Prot JC. 1984. A naturally occurring re-sistance breaking biotype ofMeloidog-yne incognitaon tomato. Reproductionand pathogenicity on tomato cultivarsRoma and Rossol.Rev. Nematol.7:3–28
101. Ramstedt M. 1999. Rust disease on wil-lows—virulence variation and resistancebreeding strategies.Forest Ecol. Manag.121:101–11
102. Reddy OR, Ou SH. 1976. Pathogenicvariability in Xanthomonas oryzae. Phy-topathology66:906–9
103. Roberts AL, Crute IR. 1994. Apple scabresistance fromMalus floribunda821(Vf ) is rendered ineffective by isolatesof Venturia inaequalisfrom Malus flori-bunda. Norw. J. Agric. Sci.17:403–6
104. Roelfs AP. 1985. Epidemiology in North
America. InThe Cereal Rusts, ed. WRBushnell, AP Roelfs, pp. 403–34. NewYork: Academic
105. Roelfs AP, Groth JV. 1980. A compar-ison of virulence phenotypes in wheatstem rust populations reproducing sex-ually and asexually.Phytopathology70:855–62
106. Rosewich UL, Pettway RE, McDonaldBA, Duncan RR, Frederiksen RA. 1998.Genetic structure and temporal dynam-ics of aColletotrichum graminicolapop-ulation in a sorghum disease nursery.Phytopathology88:1087–93
107. Rosewich UL, Pettway RE, McDonaldBA, Kistler HC. 1999. High levels ofgene flow and heterozygote excess char-acterize Rhizoctonia solaniAG-1 1A(Thanatephorus cucumeris) from Texas.Fungal Genet. Biol.28:148–59
108. Ryley MJ, Obst NR, Irwin JAG, DrenthA. 1998. Changes in the racial com-position ofPhytophthora sojaein Aus-tralia between 1979 and 1996.Plant Dis.82:1048–54
109. Ryley MJ, Obst NR, Stovold GE. 1991.A new race of Phytophthora mega-sperma f. sp. glycinea on soybean inAustralia.Aust. Plant Pathol.20:97–100
110. Salamati S, Zhan J, Burdon JJ, Mc-Donald BA. 2000. The genetic structureof field populations ofRhynchosporiumsecalis from three continents suggestsmoderate gene flow and regular recom-bination.Phytopathology90:901–8
111. Schmitthenner AF. 1985. Problems andprogress in control ofPhytophthorarootrot of soybean.Plant Dis.69:362–68
112. Schmitthenner AF, Hobe M, Bhat RG.1994.Phytophthora sojaeraces in Ohioover a 10-year interval.Plant Dis. 78:269–76
112a. Shaner G, Buechley G, Nyquist WE. In-heritance of latent period ofPuccinia re-conditain wheat.Crop Sci.37:748–56
113. Sicard D, Michalakis Y, Dron M,Neema C. 1997. Genetic diversity andpathogenic variation ofColletotrichum
Ann
u. R
ev. P
hyto
path
ol. 2
002.
40:3
49-3
79. D
ownl
oade
d fr
om a
rjou
rnal
s.an
nual
revi
ews.
org
by E
TH
on
06/2
8/05
. For
per
sona
l use
onl
y.

12 Jul 2002 9:59 AR AR165-PY40-13.tex AR165-PY40-13.SGM LaTeX2e(2002/01/18)P1: ILV
378 MCDONALD ¥ LINDE
lindemuthianumin three centers of di-versity of its host,Phaseolus vulgaris.Phytopathology87:807–13
114. Singh RP, Rajaram S. 1992. Geneticsof adult-plant resistance of leaf rust in‘Frontana’ and three CIMMYT wheats.Genome35:24–31
115. Staskawicz BJ, Mudgett MB, Dangl JL,Galan JE. 2001. Common and contrast-ing themes of plant and animal diseases.Science292:2285–89
116. Stover RH, Buddenhagen IW. 1986. Ba-nana breeding: polyploidy, disease resis-tance and productivity.Fruits41:175–91
117. Sujkowski LS, Goodwin SB, Dyer AT,Fry WE. 1994. Increased genotypicdiversity via migration and possible occ-urrence of sexual reproduction ofPhy-tophthora infestansin Poland. Phyto-pathology84:201–7
118. Swiezynski KM, Sieczka TM, Su-jkowski LS, Zarzycka H, Guzowska-Zimnoch E. 1991. Resistance toPhy-tophthora infestansin potato genotypesoriginating from wild potato species.Plant Breed.107:28–38
119. Swords KMM, Dahlbeck D, Kearney B,Roy M, Staskawich BJ. 1996. Sponta-neous and induced mutations in a sin-gle open reading frame to both viru-lence and avirulence inXanthomonascampestrispv. vesicatoria avrBs2. J.Bacteriol.178:4661–69
120. Ten Houten JG. 1974. Plant pathology:changing agricultural methods and hu-man society.Annu. Rev. Phytopathol.12:1–11
121. Tenzer I, Gessler C. 1997. Subdivisionand genetic structure of four populationsof Venturia inaequalisin Switzerland.Eur. J. Plant Pathol.103:565–71
122. Thakur RP, Leonard KJ, Jones RK. 1989.Characterization of a new race ofExsero-hilum turcicumvirulent on corn with re-sistance geneHtN. Plant Dis.73:151–55
123. Thakur RP, Rai KN, Rao VP, Rao AS.2001. Genetic resistance of pearl mil-let male-sterile lines to diverse Indian
pathotypes ofSclerospora graminicola.Plant Dis.85:621–26
124. Torres-Montalvo JH. 1998.The popula-tion genetics of Sporisorium reilianum,the head smut pathogen of sorghum andmaize. PhD thesis. Texas A&M Univ. 90pp.
125. Triantaphyllou AC. 1971. Genetics andcytology. InPlant Parasitic Nematodes,ed. BM Zuckerman, WF Mai, RA Ro-hde, pp. 1–32. New York: Academic
126. Troedson RJ, Ryley MJ, Byth DE, IrwinJAG. 1991. Effect of Phytophthora rootand stem rot on the response of field-grown soybean to saturated soil culture.Aust. J. Agric. Res.42:791–99
127. Tu JC. 1992.Colletotrichum lindemuthi-anumon bean. Population dynamics ofthe pathogen and breeding for resistance.In Colletotrichum—Biology, Pathologyand Control, ed. JA Bailey, MJ Jeger, pp.203–24. Wallingford, UK: CABI
128. Vos P, Hogers R, Bleeker M, Reijans M,van der Lee T. 1995. AFLP: a new tech-nique for DNA fingerprinting.NucleicAcid Res.23:4407–17
129. Webb RE, Bonde R. 1956. Physiologicraces of the late blight fungus frompotato dump-heap plants in Maine in1955.Am. Potato J.33:53–55
130. Wellings CR, McIntosh RA. 1990.Puc-cinia striiformisf. sp.tritici in Australa-sia: pathogenic changes during the first10 years.Plant Pathol.39:316–25
131. West JS, Kharbanda PD, Barbetti MJ,Fitt BDL. 2001. Epidemiology and man-agement of Leptosphaeria maculans(phoma stem canker) on oilseed rapein Australia, Canada and Europe.PlantPathol.50:10–27
132. Whisson SC, Drenth A, Maclean DJ, Ir-win JAG. 1994. Evidence for outcrossingin Phytophthora sojaeand linkage of aDNA marker to two avirulence genes.Curr. Genet.227:77–82
133. Wiese MV. 1991.Compendium of WheatDiseases. St. Paul, MN: APS Press
134. Williams EB, Brown AG. 1968. A new
Ann
u. R
ev. P
hyto
path
ol. 2
002.
40:3
49-3
79. D
ownl
oade
d fr
om a
rjou
rnal
s.an
nual
revi
ews.
org
by E
TH
on
06/2
8/05
. For
per
sona
l use
onl
y.
12 Jul 2002 9:59 AR AR165-PY40-13.tex AR165-PY40-13.SGM LaTeX2e(2002/01/18)P1: ILV
DURABLE RESISTANCE 379
physiological race ofVenturia inae-qualis, incitant of apple scab.Plant Dis.Rep.52:799–801
135. Wolfe MS. 1984. Trying to under-stand and control powdery mildew.PlantPathol.33:451–66
136. Wolfe MS, McDermott JM. 1994. Pop-ulation genetics of plant pathogen in-teractions: the example of theErysiphegraminis-Hordeum vulgarepathosys-tem.Annu. Rev. Phytopathol.32:89–113
137. Xia JQ, Correll JC, Lee FN, MarchettiMA, Rhoads DD. 1993. DNA finger-printing to examine microgeographicvariation in the Magnaporthe grisea(Pyricularia grisea) population in tworice fields in Arkansas.Phytopathology83:1029–35
138. Zeigler RS, Scott RP, Leung H, Bordeos
AA, Kumar J, Nelson RJ. 1997. Evi-dence of parasexual exchange of DNA inthe rice blast fungus challenges its exclu-sive clonality.Phytopathology87:284–94
139. Zeigler RS, Tohme J, Nelson RJ, LevyM, Correa VF. 1994. Lineage exclusion:a proposal for linking blast populationanalysis to resistance breeding. InRiceBlast Disease, ed. RS Zeigler, SA Leong,PS Teng, pp. 267–92. Wallingford, UK:CABI
140. Zhu Y, Chen H, Fan J, Wang Y, Li Y,et al. 2000. Genetic diversity and diseasecontrol in rice.Nature406:718–22
141. Zimmer DE, Schafer JF, Patterson FL.1963. Mutations for virulence inPuc-cinia coronata. Phytopathology53:171–76
Ann
u. R
ev. P
hyto
path
ol. 2
002.
40:3
49-3
79. D
ownl
oade
d fr
om a
rjou
rnal
s.an
nual
revi
ews.
org
by E
TH
on
06/2
8/05
. For
per
sona
l use
onl
y.

22 Jul 2002 8:44 AR AR165-13-COLOR.tex AR165-13-COLOR.SGM LaTeX2e(2002/01/18)P1: GDL
See
lege
ndon
next
page
Ann
u. R
ev. P
hyto
path
ol. 2
002.
40:3
49-3
79. D
ownl
oade
d fr
om a
rjou
rnal
s.an
nual
revi
ews.
org
by E
TH
on
06/2
8/05
. For
per
sona
l use
onl
y.

22 Jul 2002 8:44 AR AR165-13-COLOR.tex AR165-13-COLOR.SGM LaTeX2e(2002/01/18)P1: GDL
Figure 2 (See figure on previous page) Strategies for deployment of major resistancegenes (R-genes). (A) The traditional “plug, plant, and pray” approach of deployingsingle R-genes one at a time in a sequence that matches the boom and bust cycle.(B) Rotations of R-genes in time or space. Each R-gene is deployed over a limitednumber of years or area, and is withdrawn before the corresponding virulence al-lele achieves a high frequency in the pathogen population. (C) R-gene pyramid. AllR-genes are placed together in one plant genotype. (D) Regional deployment. DifferentR-genes are grown in different regions. This can be part of a gene rotation as describedin panel B. (E) Cultivar mixtures and multilines. Individual R-genes are grown as anintimate mixture in the same field.
Ann
u. R
ev. P
hyto
path
ol. 2
002.
40:3
49-3
79. D
ownl
oade
d fr
om a
rjou
rnal
s.an
nual
revi
ews.
org
by E
TH
on
06/2
8/05
. For
per
sona
l use
onl
y.
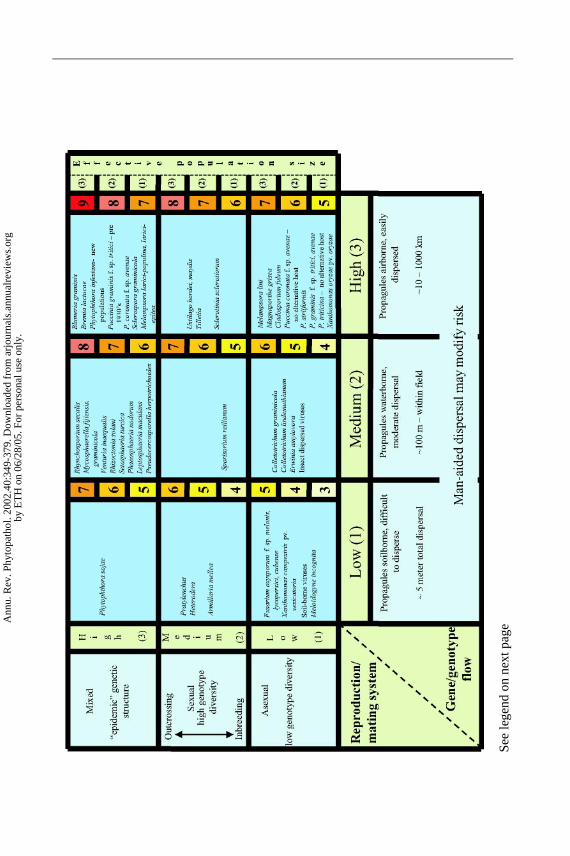
22 Jul 2002 8:44 AR AR165-13-COLOR.tex AR165-13-COLOR.SGM LaTeX2e(2002/01/18)P1: GDL
See
lege
ndon
next
pageA
nnu.
Rev
. Phy
topa
thol
. 200
2.40
:349
-379
. Dow
nloa
ded
from
arj
ourn
als.
annu
alre
view
s.or
gby
ET
H o
n 06
/28/
05. F
or p
erso
nal u
se o
nly.

22 Jul 2002 8:44 AR AR165-13-COLOR.tex AR165-13-COLOR.SGM LaTeX2e(2002/01/18)P1: GDL
Figure 4 (See figure on previous page) Scale of evolutionary risk organized accordingto reproduction/mating system, gene/genotype flow and effective population size. Theorganization of this diagram is modified from Figure 2 of Brent & Holloman (8).Effective population size (Ne) is on a 1–3 scale where 1 is small Ne, 2 is average Ne,and 3 is large Ne. Assignment of total risk value assumes that all effects are additive.This risk model assumes that mutation rates are constant and that selection is efficientfor all pathogens. Placement of example pathogens is according to principles explainedin the text or from Table 2.
Ann
u. R
ev. P
hyto
path
ol. 2
002.
40:3
49-3
79. D
ownl
oade
d fr
om a
rjou
rnal
s.an
nual
revi
ews.
org
by E
TH
on
06/2
8/05
. For
per
sona
l use
onl
y.

P1: LDI
July 12, 2002 14:14 Annual Reviews AR165-FM
Annual Review of PhytopathologyVolume 40, 2002
CONTENTS
FRONTISPIECE xii
ONE FOOT IN THE FURROW: IMPLICATIONS TO ONE’S CAREER
IN PLANT PATHOLOGY, D. E. Mathre 1
EVOLUTIONARY ECOLOGY OF PLANT DISEASES IN NATURAL ECOSYSTEMS,Gregory S. Gilbert 13
MAKING AN ALLY FROM AN ENEMY: PLANT VIROLOGY AND THE NEW
AGRICULTURE, Gregory P. Pogue, John A. Lindbo, Stephen J. Garger, andWayne P. Fitzmaurice 45
STRIPE RUST OF WHEAT AND BARLEY IN NORTH AMERICA:A RETROSPECTIVE HISTORICAL REVIEW, Roland F. Line 75
VIRAL SEQUENCES INTEGRATED INTO PLANT GENOMES, Glyn Harper,Roger Hull, Ben Lockhart, and Neil Olszewski 119
MOLECULAR BASIS OF RECOGNITION BETWEEN PHYTOPHTHORA
PATHOGENS AND THEIR HOSTS, Brett M. Tyler 137
COMPARATIVE GENOMIC ANALYSIS OF PLANT-ASSOCIATED
BACTERIA, M. A. Van Sluys, C. B. Monteiro-Vitorello, L. E. A. Camargo,C. F. M. Menck, A. C. R. da Silva, J. A. Ferro, M. C. Oliveira,J. C. Setubal, J. P. Kitajima, and A. J. Simpson 169
GENE EXPRESSION IN NEMATODE FEEDING SITES, Godelieve Gheysen andCarmen Fenoll 191
PHYTOCHEMICAL BASED STRATEGIES FOR NEMATODE CONTROL,David J. Chitwood 221
HOST-SELECTIVE TOXINS AND AVIRULENCE DETERMINANTS:WHAT’S IN A NAME? Thomas J. Wolpert, Larry D. Dunkle,and Lynda M. Ciuffetti 251
TOBACCO MOSAIC VIRUS ASSEMBLY AND DISASSEMBLY: DETERMINANTS IN
PATHOGENICITY AND RESISTANCE, James N. Culver 287
MICROBIAL POPULATIONS RESPONSIBLE FOR SPECIFIC SOIL
SUPPRESSIVENESS TO PLANT PATHOGENS, David M. Weller,Jos M. Raaijmakers, Brian B. McSpadden Gardener, andLinda S. Thomashow 309
v
Ann
u. R
ev. P
hyto
path
ol. 2
002.
40:3
49-3
79. D
ownl
oade
d fr
om a
rjou
rnal
s.an
nual
revi
ews.
org
by E
TH
on
06/2
8/05
. For
per
sona
l use
onl
y.

P1: LDI
July 12, 2002 14:14 Annual Reviews AR165-FM
vi CONTENTS
PATHOGEN POPULATION GENETICS, EVOLUTIONARY POTENTIAL,AND DURABLE RESISTANCE, Bruce A. McDonald and Celeste Linde 349
USE OF MULTILINE CULTIVARS AND CULTIVAR MIXTURES FOR DISEASE
MANAGEMENT, C. C. Mundt 381
BIOLOGICAL CONTROL OF POSTHARVEST DISEASES OF FRUITS,Wojciech J. Janisiewicz and Lise Korsten 411
ANTIBIOTIC USE IN PLANT AGRICULTURE, Patricia S. McManus,Virginia O. Stockwell, George W. Sundin, and Alan L. Jones 443
RISK ASSESSMENT OF VIRUS-RESISTANT TRANSGENIC PLANTS, Mark Tepfer 467
INDEXES
Subject Index 493Cumulative Index of Contributing Authors, Volumes 31–40 521Cumulative Index of Chapter Titles, Volumes 31–40 525
ERRATA
An online log of corrections to Annual Review of Phytopathology chapters(if any, 1997 to the present) may be found at http://phyto.annualreviews.org/
Ann
u. R
ev. P
hyto
path
ol. 2
002.
40:3
49-3
79. D
ownl
oade
d fr
om a
rjou
rnal
s.an
nual
revi
ews.
org
by E
TH
on
06/2
8/05
. For
per
sona
l use
onl
y.