Embed Size (px)
Citation preview

BioMed CentralMolecular Cancer
ss
Open AcceResearchPathway-specific differences between tumor cell lines and normal and tumor tissue cellsAdam Ertel1, Arun Verghese1, Stephen W Byers2, Michael Ochs3 and Aydin Tozeren*1Address: 1Center for Integrated Bioinformatics, School of Biomedical Engineering, Science and Health Systems, Bossone 714, Drexel University, 3143 Chestnut Street, Philadelphia, PA 19104, USA, 2Lombardi Comprehensive Cancer Center at Georgetown University, 3800 Reservoir Road, Washington DC 20057, USA and 3Division of Bioinformatics, Fox Chase Cancer Center, 333 Cottman Avenue, Philadelphia, PA 19111-2497, USA
Email: Adam Ertel - [email protected]; Arun Verghese - [email protected]; Stephen W Byers - [email protected]; Michael Ochs - [email protected]; Aydin Tozeren* - [email protected]
* Corresponding author
AbstractBackground: Cell lines are used in experimental investigation of cancer but their capacity torepresent tumor cells has yet to be quantified. The aim of the study was to identify significantalterations in pathway usage in cell lines in comparison with normal and tumor tissue.
Methods: This study utilized a pathway-specific enrichment analysis of publicly accessiblemicroarray data and quantified the gene expression differences between cell lines, tumor, andnormal tissue cells for six different tissue types. KEGG pathways that are significantly differentbetween cell lines and tumors, cell lines and normal tissues and tumor and normal tissue wereidentified through enrichment tests on gene lists obtained using Significance Analysis of Microarrays(SAM).
Results: Cellular pathways that were significantly upregulated in cell lines compared to tumor cellsand normal cells of the same tissue type included ATP synthesis, cell communication, cell cycle,oxidative phosphorylation, purine, pyrimidine and pyruvate metabolism, and proteasome. Resultson metabolic pathways suggested an increase in the velocity nucleotide metabolism and RNAproduction. Pathways that were downregulated in cell lines compared to tumor and normal tissueincluded cell communication, cell adhesion molecules (CAMs), and ECM-receptor interaction. Onlya fraction of the significantly altered genes in tumor-to-normal comparison had similar expressionsin cancer cell lines and tumor cells. These genes were tissue-specific and were distributed sparselyamong multiple pathways.
Conclusion: Significantly altered genes in tumors compared to normal tissue were largely tissuespecific. Among these genes downregulation was a major trend. In contrast, cell lines containedlarge sets of significantly upregulated genes that were common to multiple tissue types. Pathwayupregulation in cell lines was most pronounced over metabolic pathways including cell nucleotidemetabolism and oxidative phosphorylation. Signaling pathways involved in adhesion andcommunication of cultured cancer cells were downregulated. The three way pathways comparisonpresented in this study brings light into the differences in the use of cellular pathways by tumor cellsand cancer cell lines.
Published: 02 November 2006
Molecular Cancer 2006, 5:55 doi:10.1186/1476-4598-5-55
Received: 23 January 2006Accepted: 02 November 2006
This article is available from: http://www.molecular-cancer.com/content/5/1/55
© 2006 Ertel et al; licensee BioMed Central Ltd. This is an Open Access article distributed under the terms of the Creative Commons Attribution License (http://creativecommons.org/licenses/by/2.0), which permits unrestricted use, distribution, and reproduction in any medium, provided the original work is properly cited.
Page 1 of 13(page number not for citation purposes)

Molecular Cancer 2006, 5:55 http://www.molecular-cancer.com/content/5/1/55
BackgroundCell lines derived from tumors and tissues comprise themost frequently used living systems in research on cellbiology. Limitations on the abundance of tissue samplesnecessitate the use of animal models and cell lines in thestudies of tumor-related phenomena. Cancer cell lineshave been extensively used in screening studies involvingdrug sensitivity and effectiveness of anti cancer drugs [1].Other studies using cultured cells aimed at the determina-tion of the phenotypic properties of cancer cells such asproliferation rates, migration capacity and ability toinduce angiogenesis [2]. In other studies, human culturedcells were used to create tumors in the mice models [3].
Whether measurements on cell lines provide informationabout the metastatic behavior of cancer cells in vivo is cur-rently under investigation. Unsupervised classification ofgene expression profiles of cancer tissue and cancer celllines result in separate clustering of cancer cell lines fromtissue cells for both solid tumors and blood cancers [4].Sets of genes responsible for differences between solidtumors and cell lines in their response to anti cancer drugshave been identified in the Serial Analysis of Gene Expres-sion (SAGE) Database [5]. Most optimal cell lines to rep-resent given tumor tissue types were determined with theuse of a quantitative tissue similarity index [6]. Resultswere striking: only 34 of the 60 cell lines used in the anal-ysis were most similar to the tumor types from which theywere derived. The study provided valuable informationabout selection of most appropriate cell lines in pharma-ceutical screening programs and other cancer research. Ina more recent work Sandberg et al. [7] identified thosegene function groups for which cell lines differed mostsignificantly from tumors based on meta-analysis usingGene Ontology (GO). Genes involved in cell-cycle pro-gression, protein processing and protein turnover as wellas genes involved in metabolic pathways were found to beupregulated (an increase in expression reflected by mRNAtranscript levels) in cell lines, whereas genes for cell adhe-sion molecules and membrane signaling proteins in celllines were downregulated (a decrease in expressionreflected by mRNA transcript levels) in comparison withtumors [7]. To build on this approach, functional enrich-ment analysis based on Kyoto Encyclopedia of Genes andGenomes (KEGG) pathways [8,9] can be used to illustratecausal relationships between genes (gene products).While GO is organized into hierarchical annotations inthe context of normal cellular function, the KEGG data-base organizes the genes (gene products) into pathwayreaction maps and functional complexes, including somedisease-specific pathways.
The present study focuses on pathway specific differencesin gene expression patterns between cancer cell lines andtumors as well as cancer cell lines and normal tissue and
tumors and normal tissue. Extension of microarray dataanalysis to three-way comparison allows for the identifi-cation of gene expression patterns unique to cell lines.Such patterns might have arisen due to factors related tothe cell culture environment. We used publicly accessiblemicroarray data available for normal and cancer tissuesand associated NCI60 cell lines in a pathway-specificquantitative analysis of gene expression profiles. A domi-nant theme that emerged from our analysis was that path-way-specific gene expression differences between cancercell lines and cancer tissue were similar both in magnitudeand direction to corresponding differences between celllines and normal tissue cells. Cell cycle associated differ-ences between normal and tumor tissue were amplified incell lines. Results on metabolic pathways suggested anincrease in the velocity of RNA and DNA production andincreased flow of metabolites in the oxidative phosphor-ylation pathway. On the other hand, a small fraction ofsignificantly altered genes in tumor-to-normal compari-son had similar expressions in cancer cell lines and tumorcells. These genes were tissue-specific and were positionedsparsely along multiple pathways.
Materials and methodsMicroarray datasetsMicroarray datasets used in this study consisted of thepublicly accessible gene expression profile dataset forNCI60 cell lines [10] and similar data for a panel oftumors and normal tissue samples [11]. This dataset con-tains measurements obtained using the AffymetrixHu6800 arrays (Table 1). The tissue types considered inthis study (breast, CNS, colon, prostate, ovary, and renaltissue) were restricted to those where the microarrayresults were available for normal and tumor tissue as wellas corresponding cell lines. MDA-MB-435 and MDN cellline samples were excluded from these datasets becausetheir tissue of origin, previously thought to be breast, isnow suspect [6].
Quality of probe set annotationsQuality of the Hu6800 GeneChip annotation wasassessed because this platform is several versions awayfrom current human microarrays. While the Hu6800design is old and probe designs have since been greatlyimproved, the quality of probe annotation is maintainedthrough regular updates by Affymetrix. The annotationsused in this study are based on a July 12th 2006 update ofAffymetrix annotations according to the March 2006(NCBI Build 36.1) version of the human genome. A com-parison was done between gene annotations for theHu6800 GeneChip obtained from Webgestalt (web-basedgene set analysis toolkit) [12] and from the Affymetrixwebsite on August 7th, 2006. Out of the 7129 probesets onthe chip, 6058 had the same annotations from both Web-gestalt and Affymetrix. Of the remaining 1071 probesets,
Page 2 of 13(page number not for citation purposes)

Molecular Cancer 2006, 5:55 http://www.molecular-cancer.com/content/5/1/55
692 were not annotated, 288 were annotated in theAffymetrix list but not in Webgestalt, 28 were annotatedin Webgestalt but not Affymetrix, and 63 (~1%) probesetshad conflicting annotations in Webgestalt and Affymetrix.Only 42 (~0.70% of all genes) genes belonging to anyknown KEGG pathway had discrepancies between Webge-stalt and Affymetrix. While there were very few probeswith discrepant annotations in any given pathway, this listof 42 probes was enriched for Antigen processing andpresentation, Natural killer cell mediated cytotoxicity,Cell adhesion molecules (CAMs), Type I diabetes melli-tus, and SNARE interactions in vesicular transport path-ways. A review of this probe list revealed thatdiscrepancies were merely due to updates and minor revi-sions to the official gene symbol that may reflect increasedunderstanding of these genes functions. Genes associatedwith KEGG pathways represent a subset of well-studiedand sequenced genes. Overall, the probe sets of genesbelonging to KEGG pathways have well established andreliable annotations on the Hu6800 GeneChip. Annota-tions retrieved from Webgestalt were used for the remain-der of the analysis.
NormalizationGene expression data was normalized for each tissue typeby computing the Robust Multichip Average (RMA)[13,14] directly from the Affymetrix .CEL files for cell line,tumor, and normal samples. RMA consists of three steps:a background adjustment, quantile normalization andfinally summarization. Quantile normalization methodutilizes data from all arrays in an experiment in order toform the normalization relation [13,14] RMA generatedexpression measure is on the log base 2 scale.
Normalized data was generated using the Bioconductor(package for R) [15] implementation of RMA. R 2.3.1 [16]was first installed on an Intel Xeon machine running aWindows Professional Operating System. The Biobase1.10.1 (dated 20 June 2006) package which contains the
base functions for Bioconductor was installed by access-ing the getBioC.R script directly from the Bioconductorwebsite [17]. The "readaffy" command was used to loadall .CEL files for a single tissue type. The RMA expressionmeasures for each tissue type were computed using the"rma" function with default settings, including the PerfectMatch Adjustment Method setting as Perfect Match Onlyso that expression signal calculation was based upon theperfect match values from each probe set as described in[13]. The RMA computed expression values were writtenout to a comma separated text file.
The resulting expression values for each sample werechecked against the average expression across cell line,tumor, and normal populations by calculating their corre-lation coefficients. Two anomalous samples (one normaltissue sample from colon and one tumor sample fromprostate) were identified having correlations well outsidethe remaining population (R < 0.9) and removed; RMAfor those tissues was recomputed excluding the suspectsamples. The RMA generated gene expression data for theAffymetrix chips was clustered using a hierarchical cluster-ing algorithm with Pearson correlation coefficient as thedistance metric using average linkage using TIGR MeVVersion 3.1. For each of the six tissues under considera-tion, the cell line samples clustered together in a singlebranch distinct from the branches containing tumor andnormal tissue samples. This result confirmed that all thecell line samples have characteristics that are significantlydifferent from the tumor tissue.
Significance analysis for gene expressionThe Significance Analysis of Microarray Data (SAM)implementation [18] in the TIGR MeV Version 3.1 soft-ware [19] was used to identify those genes that had statis-tically significant differences in expression between tumorsamples, cell lines, and normal tissue. SAM analysis wasperformed using all default parameters and adjusting thedelta-value to obtain a maximum number of genes while
Table 1: Microarray data presented by Staunton et al. [10] and Ramaswamy et al. [11] used in the three way comparison of gene expression patterns in cell lines, tumors and normal tissue.
Cell lines* Normal tissue** Tumor tissue** Array
Breast 6 5 10 AffymetrixCNS 6 5 20 AffymetrixColon 7 10 9 AffymetrixOvary 6 4 9 AffymetrixProstate 2 7 7 AffymetrixRenal 8 11 8 Affymetrix
Sum 35 42 63
* Data obtained from Staunton et al [10]** Data obtained from Ramaswamy et al [11]
Page 3 of 13(page number not for citation purposes)

Molecular Cancer 2006, 5:55 http://www.molecular-cancer.com/content/5/1/55
maintaining a conservative false discovery rate of zero. Alist of significant genes was identified for cell line-tumorcell line-normal and normal-tumor combinations foreach of the six tissue types. When the set of significantgenes was deleted from the microarray data, clusteringanalysis based on the remaining genes interspersed micro-array datasets for cell lines with corresponding datasets fortissue.
Identification of significantly altered pathwaysTwo different methods were used for identifying signifi-cantly altered pathways. First, Kyoto Encyclopedia ofGenes and Genomes (KEGG) pathways [8,9] were identi-fied as significantly altered by performing a functionalenrichment analysis on genes identified as significant bySAM analysis. The analysis was carried out using the Web-gestalt system [12], comparing significant genes obtainedby SAM against all genes in the Affymetrix HU6800 array,for each comparison under study. A p-value for pathwayenrichment was obtained using the hypergeometiric testdocumented in [12]. Four different p-value cutoffs (0.001,0.01, 0.05 and 0.1) were used in order to assess thedependence of the significant pathway identification on pvalue. This process was also applied to subsets of signifi-cant genes, for example, the intersection of significantgenes from (CL - N) and (T - N).
A second method was applied to KEGG pathway genes inorder to detect changes that were not apparent on a single-gene basis. For this method, KEGG pathways weredeemed significantly altered if at least 80% of the genesfor that pathway contained on the HU6800 array wereshifted in the same direction for a given comparison. Foreach of the six tissues, three-way comparisons were per-formed between averaged cell line, tumor, and normalsamples. Similar examples of how significant changes infunctional pathways are revealed by a population ofrelated genes that are not evident from observations of asingle gene are found in [20,21].
ResultsSignificant genesThis article presents a pathway-specific analysis of geneexpression profile differences between cancer cell linesand normal and tumor tissue. The microarray data used inthe three-way comparison of gene expression profiles cov-ered breast, CNS, colon, ovary, prostate, and renal tissue(Table 1). Gene expression profiles of cancer cell linesderived from this data clustered together in a branchexclusive of tumor and normal tissue (3) within each tis-sue type and for all tissue types combined. Lists of signifi-cant genes (SAM genes) were determined using SAManalysis from the microarray data pairs of cell lines andtumors (CL - T), cell lines and normal tissue (CL - N) andtumor and normal tissue (T - N) for each of the six tissue
types under consideration. Table 2 provides a summary ofthe numbers of significant genes for the three-way com-parison. The table shows that the significant genes for (CL- T) and (CL - N) pairs ranged in numbers from low hun-dreds to thousands, depending on the tissue type. Signifi-cant genes for (T - N) pairs were lower in number thanthose for (CL - T) and (CL - N) pairs in all six tissues underconsideration. Downregulation of significant genes was atrend in (T - N) comparisons while a majority of SAMgenes were upregulated in cell lines compared to tumorand normal (CL - T; CL - N). Moreover, an overwhelmingmajority of the SAM genes in (T - N) comparison were notfound as significantly altered in (CL - T) comparisons. Thegene set (T - N) - (T - N ∩ CL - T) listed in Table 2 showsa vast majority of SAM genes in (T - N) comparison are notsignificantly altered in expression in (CL - T) comparison,suggesting that cancer cell lines may be good representa-tion models for tumor cells in gene expression profilestudies. On the other hand, the set (CL - T) contains manymore genes than the (T - N) comparison, revealing thatcancer cell lines have a large number of genes that are sig-nificantly altered in expression compared to tumor cells.The same trend holds true when cell lines are comparedwith normal tissue cells. These results indicate that globalgene expression profiles of cultured cancer cell lines con-tain significantly different gene expression patterns com-pared to the corresponding profiles for normal and tumortissue.
SAM genes common in (CL - T) comparisons for all six tis-sues were all upregulated. Table 3 shows the list of 51 sig-nificant genes in (CL - T) comparisons that are commonto the six tissue types under consideration. In this list of 51genes, the overrepresented KEGG pathways with a p-valuecutoff of 0.01 are cell cycle, oxidative phosphorylation,proteasome, pyrimidine metabolism, and ubiquitinmediated proteolysis. The 18 genes shown in italics alsoappeared among 29 significant genes that were commonto all (CL - N) comparisons. The 18 genes common toboth lists again showed overrepresentation of cell cycleand ubiquitin mediated proteolysis pathways under a p-value cutoff of 0.01. Moreover these eighteen genesshowed the same trend of upregulation in cell line-to-tumor (CL - T) and cell line-to-normal (CL - N) compari-sons. No significant genes identified in the (T - N) com-parisons were common to all six tissues.
Significant pathwaysKEGG pathways whose gene expression profiles differedsignificantly in (CL - T), (CL - N), and (T - N) pair compar-isons were identified using a hypergeometric test asdescribed in the Methods section. Figure 1 shows the mostfrequently observed KEGG pathways with altered geneexpression profiles for (CL - T), (CL - N) and (T - N) pairsfor breast, CNS, colon, ovary, prostate, and renal tissue.
Page 4 of 13(page number not for citation purposes)
Molecular Cancer 2006, 5:55 http://www.molecular-cancer.com/content/5/1/55
Cell cycle and a number of metabolic and transcription-related pathways emerged as significantly altered inalmost all (CL - T) and (CL - N) comparison pairs. Cellularpathways that were significantly altered in cell lines com-pared to tumor cells and normal cells of the same tissuetype in at least two tissue types included cell cycle, oxida-tive phosphorylation, purine and pyrimidine metabo-lism, proteasome, ribosome, and RNA polymerase. Themost striking difference between cell lines and tumor tis-sue in Figure 1 is in the oxidative phosphorylation path-way. Oxidative phoshorylation is the final stage of cellularmetabolism following glycolysis and the citric acid cycles.The loss of cancer cell dependence on oxidative metabo-lism may be an important factor in the development oftumors [22]. ECM-receptor interaction, which is thoughtto affect cell migration, appeared with more subtle differ-ences between all comparisons (CL - T), (CL - N), and (T- N). This may reflect more tissue-specific composition ofthe migration machinery utilized in tumor cell invasion.
Next we used pathway-specific analysis to identify up- anddownregulation patterns in three-way comparisons. Fig-ure 2 provides module maps showing the direction of reg-ulation of KEGG pathways that were identified to besignificantly different in at least 2 tissue types in (CL - T)comparisons. The pathways presented in Figure 2a weredeemed significantly altered if the average gene expressionbetween two conditions was altered in the same directionfor at least 80% of the genes in the pathway. This criterioncaptured seven of the significant pathways from Figure 1along with 23 additional pathways. The Figure 2a indi-cates a high degree of correlation in the direction of Ami-noacyl-tRNA synthetases, Monoterpenoid biosynthesis,Proteosome, and RNA polymerase pathway shifts in cellline – tumor and cell line – normal comparisons. Manymore pathways appear to be significantly altered in themodule map if the criterion for percentage of genesaltered in the same direction is reduced from 80% to 70%
(Figure 2b). These two module maps illustrate how exten-sive the pathway alterations are in cell lines compared totumor and normal tissue (CL - T; CL - N).
The pathway-specific results on cell line-tumor microarraydata comparisons presented in this study are in agreementwith the results recently published by Sandberg et al. [7]on the gene expressions patterns associated with geneontology categories in cell lines and tumors. Theseauthors have used the same microarray databases used inour study and reached highly similar conclusions on thedirections of difference between cell lines and tumorsalong equivalent pathways and gene ontology categories.Table 4 provides a comparison of the KEGG pathways(from Figure 1) against the most related gene ontologycategories from Sandberg et al. [7]. KEGG pathways forcomplement and coagulation cascade and phenylalaninemetabolism passed the significance criteria based on the(T - N) comparison in our study but we could not locatedthe corresponding GO categories in the Sandberg et al.study on cell lines vs. tumor tissue.
Gene expression changes in metabolic pathwaysMetabolic pathways such as oxidative phosphorylation,pyrimidine and purine metabolism account for some ofthe most significant alterations among the three-way com-parisons. The alterations in the oxidative phosphorylationpathway were discussed briefly in the previous section.Purine and pyrimidine metabolic pathways synthesize thenucleotides that make RNA and DNA. All of the nitrogensin the purine and pyrimidine bases (as well as some of thecarbons) are derived from amino acids glutamine, asparticacid, and glycine, whereas the ribose and deoxyribose sug-ars are derived from glucose. Figure 3 shows the KEGGdiagram of pyrimidine metabolism with the expressionvalues (averaged over six tissues) overlaid for (CL - T)(3a), (CL - N) (3b), and (T - N) (3c) comparisons. ThisKEGG pathway is altered with upregulated expression for
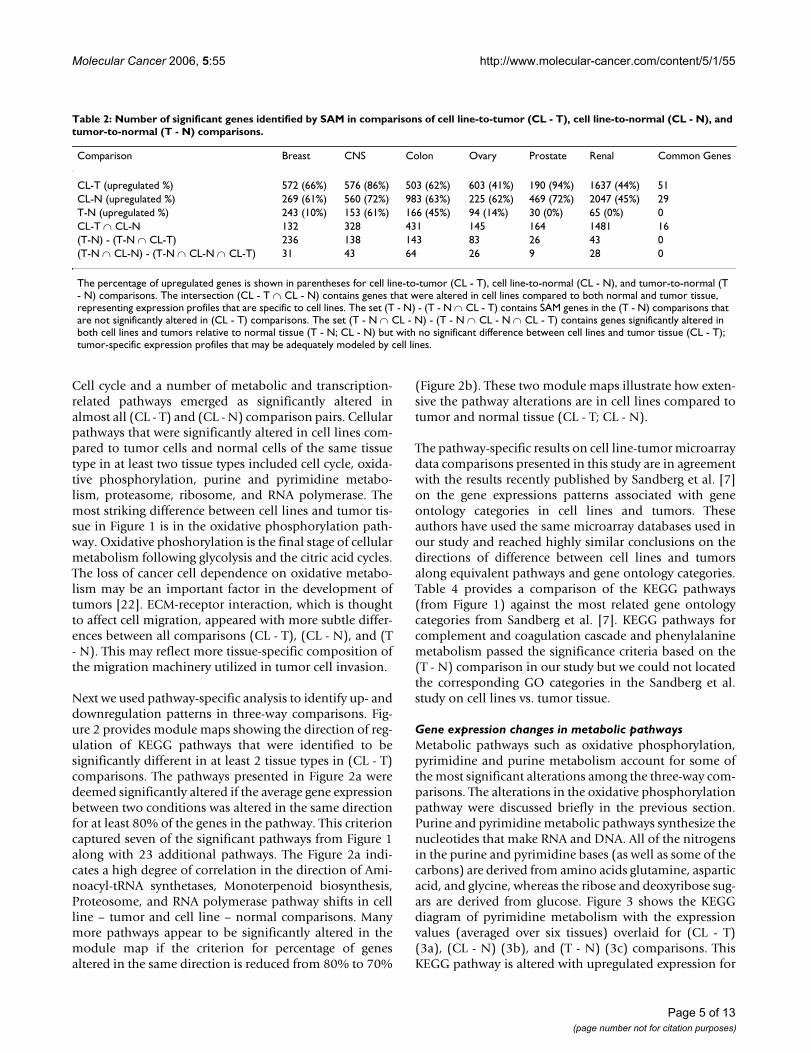
Table 2: Number of significant genes identified by SAM in comparisons of cell line-to-tumor (CL - T), cell line-to-normal (CL - N), and tumor-to-normal (T - N) comparisons.
Comparison Breast CNS Colon Ovary Prostate Renal Common Genes
CL-T (upregulated %) 572 (66%) 576 (86%) 503 (62%) 603 (41%) 190 (94%) 1637 (44%) 51CL-N (upregulated %) 269 (61%) 560 (72%) 983 (63%) 225 (62%) 469 (72%) 2047 (45%) 29T-N (upregulated %) 243 (10%) 153 (61%) 166 (45%) 94 (14%) 30 (0%) 65 (0%) 0CL-T ∩ CL-N 132 328 431 145 164 1481 16(T-N) - (T-N ∩ CL-T) 236 138 143 83 26 43 0(T-N ∩ CL-N) - (T-N ∩ CL-N ∩ CL-T) 31 43 64 26 9 28 0
The percentage of upregulated genes is shown in parentheses for cell line-to-tumor (CL - T), cell line-to-normal (CL - N), and tumor-to-normal (T - N) comparisons. The intersection (CL - T ∩ CL - N) contains genes that were altered in cell lines compared to both normal and tumor tissue, representing expression profiles that are specific to cell lines. The set (T - N) - (T - N ∩ CL - T) contains SAM genes in the (T - N) comparisons that are not significantly altered in (CL - T) comparisons. The set (T - N ∩ CL - N) - (T - N ∩ CL - N ∩ CL - T) contains genes significantly altered in both cell lines and tumors relative to normal tissue (T - N; CL - N) but with no significant difference between cell lines and tumor tissue (CL - T); tumor-specific expression profiles that may be adequately modeled by cell lines.
Page 5 of 13(page number not for citation purposes)

Mol
ecul
ar C
ance
r 200
6, 5
:55
http
://w
ww
.mol
ecul
ar-c
ance
r.com
/con
tent
/5/1
/55
Page
6 o
f 13
(pag
e nu
mbe
r not
for c
itatio
n pu
rpos
es)
Table 3: SAM genes that were upregulated in cell lines compared to tumors in all the 6 tissues considered in the study (CL - T).
Gene Symbol Gene Name Kegg Pathway(s)
ATP5B ATP synthase, H+ transporting, mitochondrial F1 complex, beta polypeptide Oxidative phosphorylation, ATP synthesisATP5G3 ATP synthase, H+ transporting, mitochondrial F0 complex, subunit C3 (subunit 9) ATP synthesis, Oxidative phosphorylationC1QBP complement component 1, q subcomponent binding protein (Immune Response)CBX3 chromobox homolog 3 (HP1 gamma homolog, Drosophila) N/ACCNB1 cyclin B1 Cell cycleCCT5 chaperonin containing TCP1, subunit 5 (epsilon) N/ACDC20 CDC20 cell division cycle 20 homolog (S. cerevisiae) Ubiquitin mediated proteolysis, Cell cycleCDKN3 cyclin-dependent kinase inhibitor 3 (CDK2-associated dual specificity phosphatase) N/ACHAF1A chromatin assembly factor 1, subunit A (p150) N/ACKAP1 cytoskeleton associated protein 1 N/ACKS1B CDC28 protein kinase regulatory subunit 1B N/ACKS2 CDC28 protein kinase regulatory subunit 2 N/ACOX8A cytochrome c oxidase subunit 8A (ubiquitous) Oxidative phosphorylationCYC1 cytochrome c-1 Oxidative phosphorylationDNMT1 DNA (cytosine-5-)-methyltransferase 1 Methionine metabolismDYNLL1 dynein, light chain, LC8-type 1 N/AEBNA1BP2 EBNA1 binding protein 2 N/AHMGB2 high-mobility group box 2 N/AKIAA0101 KIAA0101 N/AKIF2C kinesin family member 2C N/ALMNB2 lamin B2 Cell communicationMCM3 MCM3 minichromosome maintenance deficient 3 (S. cerevisiae) Cell cycleMCM4 MCM4 minichromosome maintenance deficient 4 (S. cerevisiae) Cell cycleMCM7 MCM7 minichromosome maintenance deficient 7 (S. cerevisiae) Cell cycleMRPL12 mitochondrial ribosomal protein L12 N/ANDUFS8 NADH dehydrogenase (ubiquinone) Fe-S protein 8, 23kDa (NADH-coenzyme Q reductase) Oxidative phosphorylationPAICS phosphoribosylaminoimidazole carboxylase, phosphoribosylaminoimidazole succinocarboxamide synthetase Purine metabolismPCNA proliferating cell nuclear antigen Cell cyclePOLR2G polymerase (RNA) II (DNA directed) polypeptide G Purine metabolism, RNA polymerase, Pyrimidine metabolismPRMT1 protein arginine methyltransferase 1 Selenoamino acid metabolism, Nitrobenzene degradation, Aminophosphonate
metabolism, Tryptophan metabolism, Histidine metabolism, Androgen and estrogen metabolism, Tyrosine metabolism
PSMA1 proteasome (prosome, macropain) subunit, alpha type, 1 ProteasomePSMB2 proteasome (prosome, macropain) subunit, beta type, 2 ProteasomePSMB5 proteasome (prosome, macropain) subunit, beta type, 5 ProteasomePSMB6 proteasome (prosome, macropain) subunit, beta type, 6 ProteasomePSMD14 proteasome (prosome, macropain) 26S subunit, non-ATPase, 14 ProteasomeRANBP1 RAN binding protein 1 N/ASFRS9 splicing factor, arginine/serine-rich 9 N/ASNRPA small nuclear ribonucleoprotein polypeptide A N/ASNRPB small nuclear ribonucleoprotein polypeptides B and B1 N/ASNRPC small nuclear ribonucleoprotein polypeptide C N/ASNRPD2 small nuclear ribonucleoprotein D2 polypeptide 16.5kDa N/ASNRPD3 small nuclear ribonucleoprotein D3 polypeptide 18kDa N/ASNRPE small nuclear ribonucleoprotein polypeptide E N/ASNRPF small nuclear ribonucleoprotein polypeptide F N/ASNRPG small nuclear ribonucleoprotein polypeptide G N/ATCEB1 transcription elongation factor B (SIII), polypeptide 1 (15kDa, elongin C) Ubiquitin mediated proteolysisTUBG1 tubulin, gamma 1 N/ATXNRD1 thioredoxin reductase 1 Pyrimidine metabolismTYMS thymidylate synthetase Pyrimidine metabolism, One carbon pool by folateUBE2C ubiquitin-conjugating enzyme E2C Ubiquitin mediated proteolysisUBE2S ubiquitin-conjugating enzyme E2S N/A
SAM genes shown in italic also belonged to cell lines and normal tissue comparison. There were no downregulated genes common to all tissue types in cell line-tumor (CL - T) comparisons.

Molecular Cancer 2006, 5:55 http://www.molecular-cancer.com/content/5/1/55
a majority of genes in cell lines and tumors when com-pared to normal tissue. The increased levels of pyrimidinemetabolism gene expression are most pronounced in celllines (Fig 3a). A predicted increase in the velocity of RNAand DNA base production in cell lines is consistent withtrends of increasing rates of cell division observed in cellcultures [23]. The observation that nucleotide metabo-lism accelerates in cancer has been discussed in the litera-ture. Development of pyrimidine and purine analogs aspotential antineoplastic agents evolved from an early pre-sumption that cancer is a disease of uncontrolled growthand nucleic acids are involved in growth control [24].
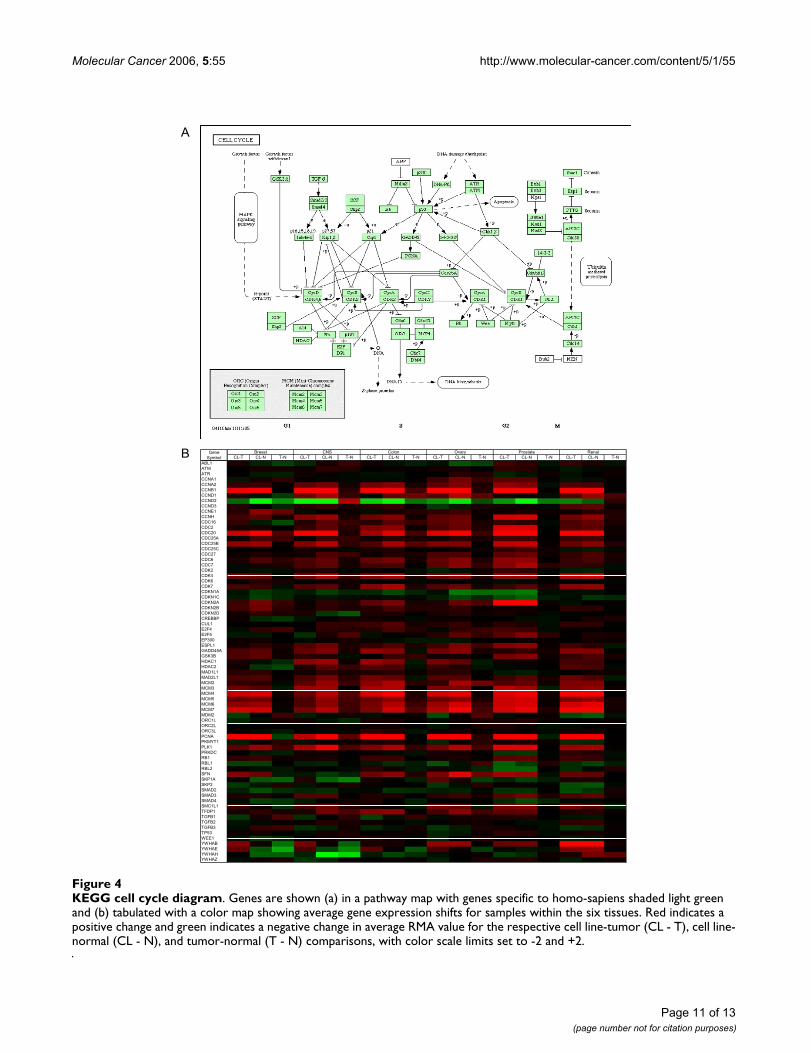
Gene expression pattern changes in cell cycleIn contrast to the pyrimidine metabolism pathway dis-cussed above, the gene expression alterations along thecell cycle pathway appear to be more complex and tissue-specific. Figure 4a shows the KEGG diagram of cell divi-sion cycle with genes specific to Homo sapiens shadedlight green. Figure 4b shows the extent of alteration ofthese genes in the three-way comparisons for each tissuetype with a graded color map representing maximumupregulation in red and maximum downregulation ingreen.
Perhaps the most obvious feature of this color map is howsubtle the changes in (T - N) comparisons are relative to(CL - T) and (CL - N) comparisons in all six tissues underconsideration. Genes such as CCNA2, CCNB1, CDC20,CDK4, and MDM2 through MDM7 are consistentlyupregulated in cell lines compared to tumors and normaltissue. On the other hand, genes such as CCND1, CCND3,CDC16, and CDK2 do not exhibit quickly a recognizablepattern. A multitude of gene expression profiles in cellcycle may point towards the same disease process.
SAM genes common to cancer cell lines and tumor cellsIt is of interest to cell biologists to identify similaritiesbetween cancer cell lines and tumors. Towards that goal,one can determine the list of SAM genes belonging to both(T - N) and (CL - N) comparisons but do not appear to besignificant in (CL - T) comparison. This list is shown inTable 5 for all six tissues under consideration. Table 5gives an indication of the size of the SAM gene subsets thatare preserved and commonly regulated in cell lines andtumors but not in normal tissues. The list of genes in Table5 comprises mostly downregulated genes for breast,colon, ovary, prostate, and renal tissue, with CNS as theonly exception. When these lists were projected ontoKEGG pathways, the probability of enrichment scorecould not be used as an indication that the pathways are
KEGG pathways identified to be significantly altered in cell lines and tumors (CL - T), cell lines and normal tissue (CL - N), and tumor and normal tissue (T - N) comparisonsFigure 1KEGG pathways identified to be significantly altered in cell lines and tumors (CL - T), cell lines and normal tis-sue (CL - N), and tumor and normal tissue (T - N) comparisons. The term frequency shown in the figure is defined as the ratio of tissue types for which a pathway identified as significantly altered to the total number of tissue types (6). KEGG pathways were identified as significantly altered by using a hypergeometric test with a p-value cutoff. The minimum number of SAM genes in each significantly altered pathway has been set to two. The error bars indicate the standard deviation of fre-quency for different p- value cutoffs (p = 0.001, 0.01, 0.05 and 0.1).
Significant Differences in KEGG Pathways
0
0.1
0.2
0.3
0.4
0.5
0.6
0.7
0.8
0.9
1
Oxi
dativ
ep
hosp
hory
latio
n
Pro
teas
ome
Pyr
imid
ine
met
abo
lism
Cel
l cyc
le
RN
Apo
lym
era
se
Rib
osom
e
Pur
ine
met
abo
lism
ATP
syn
the
sis
Foca
l ad
hesi
on
Co
mpl
emen
ta
nd c
oag
ulat
ion
casc
ade
s
Cel
lC
omm
unic
atio
n
Phe
nyla
lan
ine
me
tab
olis
m
One
car
bon
poo
lby
fola
te
Cel
l ad
hesi
onm
ole
cule
s(C
AM
s)
EC
M-r
ecep
tor
inte
ract
ion
KEGG Pathway Title
Freq
uenc
y w
ithin
Six
Tis
sues
CL vs. T
CL vs. N
T vs. N
Page 7 of 13(page number not for citation purposes)

Molecular Cancer 2006, 5:55 http://www.molecular-cancer.com/content/5/1/55
Page 8 of 13(page number not for citation purposes)
A module map showing the direction of regulation of cellular pathways that were identified as significantly altered in cell lines compared to tumor tissue (CL - T) in at least 2 of the 6 tissues considered in this studyFigure 2A module map showing the direction of regulation of cellular pathways that were identified as significantly altered in cell lines compared to tumor tissue (CL - T) in at least 2 of the 6 tissues considered in this study. In (a), a pathway is deemed significantly altered if at least 80% of the genes in the pathway are shifted in a common direction. In (b), a pathway is deemed significantly altered if at least 70% of the genes in the pathway are shifted in a common direction. The color red indicates an upregulated pathway, the color green indicates a downregulated pathway, and the color black indicates that the pathway was not significant in that comparison.
A
Bre
ast
CN
S
Col
on
Ova
ry
Pro
stat
e
Ren
al
Bre
ast
CN
S
Col
on
Ova
ry
Pro
stat
e
Ren
al
Bre
ast
CN
S
Col
on
Ova
ry
Pro
stat
e
Ren
al
-0.6 -0.8 -0.6 -0.8 0.6 -0.6 0.6 -0.6 -0.6 0.6 0.8 -0.6 -0.6 -0.6 0.6 0.8 -0.6 0.6 Alkaloid biosynthesis I0.91 0.82 0.86 0.91 0.82 0.91 0.73 0.86 0.82 0.95 0.91 0.91 -0.9 0.68 0.82 0.59 0.59 0.77 Aminoacyl-tRNA synthetases-0.9 0.57 0.86 -0.7 -0.6 -0.6 -0.7 0.86 0.57 -0.7 -0.7 -0.7 -0.7 -0.6 -0.7 -0.7 -0.6 -0.9 Ascorbate and aldarate metabolism0.7 0.7 0.83 0.83 0.74 0.83 0.65 0.74 0.87 0.74 0.74 0.83 0.57 0.74 0.61 0.61 -0.5 0.74 Basal transcription factors
0.92 0.62 0.92 0.85 0.54 0.69 0.85 -0.5 0.85 0.92 0.62 0.69 -0.5 -0.6 0.54 0.62 0.77 -0.7 Biosynthesis of steroids-0.9 -0.8 -0.9 -0.9 -0.9 -0.9 0 -0.9 -0.8 -0.8 -0.9 -0.9 1 -0.9 0.63 0.75 -0.6 -0.8 Blood group glycolipid biosynthesis-lactoseries-0.8 -0.8 -0.8 -0.8 0 -0.8 0.67 0 -0.7 -0.8 -0.6 -0.8 1 0.67 0.67 -0.6 -0.7 0.58 C21-Steroid hormone metabolism-0.8 -0.8 -0.9 -0.8 -0.7 -0.7 -0.7 -0.7 -0.8 -0.8 -0.7 -0.7 0.65 0.57 0.55 0.58 0.58 0.61 Cell adhesion molecules (CAMs)-0.8 -0.7 -0.8 -0.8 -0.7 -0.8 -0.5 -0.5 -0.7 -0.7 -0.7 -0.7 0.69 0.67 0.67 0.64 0.6 0.57 Complement and coagulation cascades-0.8 -0.7 0 0 -0.7 -0.8 0 -0.8 0 -0.7 -0.7 -0.8 0.67 0 -0.7 0 0.67 -0.7 Ethylbenzene degradation
1 0.8 0.6 1 1 0.8 -0.6 0.6 0.6 1 1 0.8 -1 -0.8 -0.6 0.8 -0.6 -0.8 Glyoxylate and dicarboxylate metabolism-1 -1 0 -1 1 0 0 1 1 0 1 0 1 1 0 0 0 0 High-mannose type N-glycan biosynthesis
-0.7 -0.7 -0.7 -0.7 -0.9 -0.9 -0.6 -0.6 -0.7 -0.7 -0.9 -0.9 0.86 0.57 -0.6 0.57 -0.6 0.71 Keratan sulfate biosynthesis-0.8 -0.8 -0.8 -0.8 -0.6 -0.8 0.56 -0.7 -0.9 -0.8 0.56 -0.8 0.94 0.61 0 0.78 0.78 0.83 Linoleic acid metabolism-0.6 -0.8 -0.9 0 0.55 -0.6 0.73 -0.7 0 -0.5 0 -0.6 0.95 0 0.68 -0.5 -0.6 -0.6 Maturity onset diabetes of the young
-1 -1 -1 -1 0 -1 0 -1 -1 -1 0 -1 1 0 0 0 1 1 Monoterpenoid biosynthesis-0.8 -0.8 -0.7 -0.8 -0.5 -0.8 0.6 -0.7 -0.7 -0.6 -0.5 -0.8 0.9 0.61 0.62 0.84 0.54 0.57 Neuroactive ligand-receptor interaction0.8 0.7 0.8 0.8 0.6 0.6 0.6 0.7 0.9 0.8 0.6 0.7 -0.7 0.6 0.7 0.9 0.6 0.6 One carbon pool by folate
1 1 0.96 1 0.96 1 1 1 1 1 1 1 -0.8 0.63 0.93 0.81 0.67 0.78 Proteasome0.79 0.85 0.77 0.83 0.83 0.79 0.77 0.85 0.81 0.89 0.81 0.83 0.6 0.7 0.81 0.66 0.55 0.66 Pyrimidine metabolism
1 0 0.67 1 0.67 0.83 0.67 0 0.67 1 0.67 0.83 -0.8 -0.7 -0.7 0.83 -0.7 -1 Reductive carboxylate cycle (CO2 fixation)-1 -1 0 -1 0 -1 -1 0 -1 -1 -1 -1 0 0 -1 0 -1 1 Retinol metabolism
0.97 0.97 0.92 0.95 0.68 0.97 -0.5 0.98 0.92 0.67 0.67 0.97 -0.9 -0.6 0.67 -1 0.55 0.64 Ribosome0.8 0.9 0.9 0.9 0.9 0.8 0.8 0.9 0.9 0.9 0.8 1 -0.9 0.6 0.8 0 -0.6 0 RNA polymerase
-0.8 -0.7 -0.8 -0.8 -0.7 -0.8 -0.7 0 -1 -0.7 -0.7 -0.8 0.83 -0.7 -0.7 0.83 0.83 0.83 Stilbene, coumarine and lignin biosynthesis-0.7 -0.8 0 -0.7 0 -0.8 0 -0.8 0.67 0.67 0.67 -0.8 0.83 0 0.83 0 0.83 0 Taurine and hypotaurine metabolism
1 1 1 1 0 0.75 0.75 0 1 1 0 1 -0.8 -0.8 0 -0.8 0.75 0 Terpenoid biosynthesis-1 0 0 -1 -1 0 -1 0 0 -1 -1 0 0 -1 -1 -1 -1 -1 Tetrachloroethene degradation
-0.8 -0.8 -0.8 -0.7 -0.7 -0.7 -0.6 -0.8 -0.7 -0.7 -0.7 -0.7 0.79 0.6 0.73 0.55 -0.5 0.55 Type I diabetes mellitus0.62 0.62 0.86 0.76 0.86 0.81 0.52 0.76 0.76 0.9 0.76 0.71 0.52 0.81 0.71 0.76 -0.7 -0.5 Ubiquitin mediated proteolysis
CL-T CL-N T-N
B
Bre
ast
CN
S
Col
on
Ova
ry
Pro
stat
e
Ren
al
Bre
ast
CN
S
Col
on
-0.8 -0.7 -0.6 -0.7 -0.6 -0.7 -0.7 -0.7 -0.5 --0.6 -0.7 -0.7 0.52 0.61 -0.7 0.65 -0.5 0.52-0.6 -0.8 -0.6 -0.8 0.6 -0.6 0.6 -0.6 -0.60.91 0.82 0.86 0.91 0.82 0.91 0.73 0.86 0.820.71 0.71 0.86 0.71 0.57 0.71 1 0.71 0.71 00.59 -0.5 0.71 0.59 0.65 0.76 0.65 -0.5 0.65-0.7 -0.7 -0.6 -0.7 -0.6 -0.7 0.59 -0.6 0.52-0.7 -0.7 -0.8 -0.7 -0.6 -0.7 0.58 -0.6 -0.7 --0.8 -0.8 -0.8 -0.8 -0.6 -0.7 -0.6 -0.6 -0.8-0.9 0.57 0.86 -0.7 -0.6 -0.6 -0.7 0.86 0.570.72 0.6 0.6 0.72 0.68 0.68 0.64 0.52 0.60.7 0.7 0.83 0.83 0.74 0.83 0.65 0.74 0.87
0.92 0.62 0.92 0.85 0.54 0.69 0.85 -0.5 0.85-0.9 -0.8 -0.9 -0.9 -0.9 -0.9 0 -0.9 -0.8-0.9 -0.8 -0.8 -0.8 0 -0.6 0 -0.6 0
Ova
ry
Pro
stat
e
Ren
al
Bre
ast
CN
S
Col
on
Ova
ry
Pro
stat
e
Ren
al
0.7 -0.7 -0.7 0.53 -0.5 -0.7 0.6 0.6 -0.7 1- and 2-Methylnaphthalene degradation0.7 0.61 -0.6 0.87 0.74 0.7 0.87 -0.6 0.61 ABC transporters - General0.6 0.8 -0.6 -0.6 -0.6 0.6 0.8 -0.6 0.6 Alkaloid biosynthesis I
0.95 0.91 0.91 -0.9 0.68 0.82 0.59 0.59 0.77 Aminoacyl-tRNA synthetases.86 0.57 0.71 -0.6 0.57 0.71 -0.6 -0.6 0.57 Aminophosphonate metabolism
0.59 0.53 0.76 0.59 -0.5 -0.6 0.59 -0.7 0.71 Amyotrophic lateral sclerosis (ALS)-0.5 -0.6 -0.7 0.81 0.63 0.63 0.67 -0.7 -0.5 Androgen and estrogen metabolism0.7 -0.6 -0.7 0.64 0.65 0.68 0.55 0.58 0.58 Antigen processing and presentation
-0.6 -0.6 -0.7 0.76 0.59 0.53 0.62 0 0.59 Arachidonic acid metabolism-0.7 -0.7 -0.7 -0.7 -0.6 -0.7 -0.7 -0.6 -0.9 Ascorbate and aldarate metabolism0.8 0.72 0.64 -0.7 -0.9 -0.6 -0.6 -0.6 -0.8 ATP synthesis
0.74 0.74 0.83 0.57 0.74 0.61 0.61 -0.5 0.74 Basal transcription factors0.92 0.62 0.69 -0.5 -0.6 0.54 0.62 0.77 -0.7 Biosynthesis of steroids-0.8 -0.9 -0.9 1 -0.9 0.63 0.75 -0.6 -0.8 Blood group glycolipid biosynthesis-lactoseries
0 0 -0.6 1 0 0 0.88 0 0 Blood group glycolipid biosynthesis-neolactoseries-0.8 -0.8 -0.8 -0.8 0 -0.8 0.67 0 -0.7 -0-0.6 -0.8 -0.7 -0.6 -0.5 -0.7 0.59 -0.7 -0.60.63 0.75 0.75 0.75 0 0.63 0 0.63 0.63-0.8 -0.8 -0.9 -0.8 -0.7 -0.7 -0.7 -0.7 -0.8-0.7 -0.6 -0.7 -0.7 -0.6 -0.6 -0.7 -0.6 -0.7 -0.66 0.61 0.75 0.67 0.74 0.68 0.66 0.73 0.740.63 0.75 -0.6 0.63 0.75 0 -0.6 0.750.67 -0.6 0.67 0.78 0.78 0.67 0.67 0.67 0.89-0.8 -0.7 -0.8 -0.8 -0.7 -0.8 -0.5 -0.5 -0.7 --0.8 -0.8 -0.8 -0.8 -0.6 -0.7 0.52 -0.6 -0.7-0.8 -0.7 0 0 -0.7 -0.8 0 -0.8 0 -0.7 0 0.6 0.8 -0.6 0 -0.6 0 0
-0.7 -0.7 -0.6 -0.6 -0.6 -0.6 0.55 -0.6 0.55-0.8 -0.7 -0.6 -0.8 -0.5 -0.6 -0.6 -0.5 -0.5-0.7 -0.8 -0.6 -0.7 -0.6 -0.7 0.57 -0.7 0.51-0.7 -0.7 -0.7 -0.7 -0.7 -0.6 -0.6 -0.7 -0.6 -0
1 0.8 0.6 1 1 0.8 -0.6 0.6 0.6-0.6 -0.7 -0.8 -0.6 -0.7 -0.7 0.53 -0.7 -0.6-0.7 -0.7 -0.8 -0.8 -0.6 -0.7 -0.6 -0.6 -0.8 -0
-1 -1 0 -1 1 0 0 1 1-0.7 -0.8 -0.6 -0.7 -0.6 -0.6 0.5 -0.5 -0.6 --0.7 -0.7 -0.7 -0.7 -0.9 -0.9 -0.6 -0.6 -0.7-0.8 -0.8 -0.8 -0.8 -0.6 -0.8 0.56 -0.7 -0.9-0.6 -0.8 -0.9 0 0.55 -0.6 0.73 -0.7 0 --0.8 -0.6 -0.7 -0.7 -0.5 -0.7 -0.6 -0.6 -0.7
-1 -1 -1 -1 0 -1 0 -1 -1-0.7 -0.8 -0.7 -0.7 -0.5 -0.6 0.55 -0.6 -0.6-0.8 -0.8 -0.7 -0.8 -0.5 -0.8 0.6 -0.7 -0.7 -0.75 0 1 0.75 0 0.75 1 0.75 0.75 0-0.8 -0.8 -0.8 -0.6 -0.6 -0.7 -0.7 -0.7 -0.7
0 -0.6 0.88 0.75 -0.6 0.63 0 0 0.880.8 0.7 0.8 0.8 0.6 0.6 0.6 0.7 0.9
0.79 0.73 0.74 0.77 0.79 0.77 0.71 0.65 0.73-0.7 -0.5 -0.7 -0.6 -0.7 -0.7 -0.8 -0.5 -0.60.83 -0.6 0 0.75 0.67 0.75 0.58 0.67 0.67-0.8 -0.8 0 0 0 -0.6 -0.8 -0.6 0 0-0.7 -0.7 -0.7 -0.7 -0.6 -0.7 -0.6 -0.7 -0.70.73 0.64 0.64 0.73 -0.5 0.64 -0.6 0.64 -0.7
1 1 0.96 1 0.96 1 1 1 10.75 1 0.75 0.75 0.75 0.75 -0.6 0.75 0.880.79 0.85 0.77 0.83 0.83 0.79 0.77 0.85 0.81
1 0 0.67 1 0.67 0.83 0.67 0 0.67-1 -1 0 -1 0 -1 -1 0 -1
0.97 0.97 0.92 0.95 0.68 0.97 -0.5 0.98 0.920.8 0.9 0.9 0.9 0.9 0.8 0.8 0.9 0.9
-0.8 -0.7 -0.8 -0.8 -0.7 -0.8 -0.7 0 -1-0.7 -0.6 -0.7 -0.6 -0.6 -0.6 -0.6 -0.7 -0.9-0.7 -0.8 0 -0.7 0 -0.8 0 -0.8 0.67
1 1 1 1 0 0.75 0.75 0 1-1 0 0 -1 -1 0 -1 0 0
-0.8 -0.8 -0.8 -0.7 -0.7 -0.7 -0.6 -0.8 -0.70.62 0.62 0.86 0.76 0.86 0.81 0.52 0.76 0.760.56 -0.6 0.78 0.67 0.78 0.56 0.67 0.78 0.78
CL-T CL-N
.8 -0.6 -0.8 1 0.67 0.67 -0.6 -0.7 0.58 C21-Steroid hormone metabolism-0.5 -0.6 -0.7 0.79 0.54 0.62 0.71 -0.5 0.51 Calcium signaling pathway
1 0.63 -0.6 -0.6 0 0 0.75 -0.6 -1 Caprolactam degradation-0.8 -0.7 -0.7 0.65 0.57 0.55 0.58 0.58 0.61 Cell adhesion molecules (CAMs)0.6 -0.6 -0.6 0.55 0.56 0.57 0.58 -0.6 0.55 Cell Communication
0.76 0.74 0.68 0.62 0.76 0.66 0.78 -0.5 0.67 Cell cycle0 0 0 0 -0.6 0.88 0.63 -0.6 -0.6 0.75 Chondroitin / Heparan sulfate biosynthesis
0.67 0.78 0.67 -0.6 0.89 0.89 0.67 -0.6 -0.6 Circadian rhythm0.7 -0.7 -0.7 0.69 0.67 0.67 0.64 0.6 0.57 Complement and coagulation cascades
-0.6 -0.6 -0.7 0.83 0.63 0.61 0.72 0.53 0.67 Cytokine-cytokine receptor interaction0.7 -0.7 -0.8 0.67 0 -0.7 0 0.67 -0.7 Ethylbenzene degradation0.7 -0.7 -0.6 -0.8 0 -0.6 0.6 -0.7 -0.7 Fatty acid elongation in mitochondria
-0.6 -0.6 -0.6 0.82 -0.6 0.55 0.73 0.64 0.55 Globoside metabolism-0.6 -0.6 -0.7 0.59 0.51 -0.6 0.59 -0.5 -0.6 Glycerolipid metabolism0.51 -0.6 -0.7 0.74 0.57 0.51 0.63 0.63 0.51 Glycerophospholipid metabolism
.7 -0.6 -0.6 0 0 -0.6 0.67 0.56 0.67 Glycosphingolipid metabolism1 1 0.8 -1 -0.8 -0.6 0.8 -0.6 -0.8 Glyoxylate and dicarboxylate metabolism
-0.5 -0.7 -0.7 0.77 0 0.6 0.7 0.53 0.57 Hedgehog signaling pathway.7 -0.6 -0.7 0.79 0.55 -0.6 0.7 0.53 0.65 Hematopoietic cell lineage0 1 0 1 1 0 0 0 0 High-mannose type N-glycan biosynthesis
0.6 -0.5 -0.6 0.75 0.68 0.58 0.68 0.53 0.61 Jak-STAT signaling pathway-0.7 -0.9 -0.9 0.86 0.57 -0.6 0.57 -0.6 0.71 Keratan sulfate biosynthesis-0.8 0.56 -0.8 0.94 0.61 0 0.78 0.78 0.83 Linoleic acid metabolism0.5 0 -0.6 0.95 0 0.68 -0.5 -0.6 -0.6 Maturity onset diabetes of the young
-0.6 -0.5 -0.7 0.7 -0.6 -0.6 0.68 0.59 0.55 Metabolism of xenobiotics by cytochrome P450-1 0 -1 1 0 0 0 1 1 Monoterpenoid biosynthesis
-0.6 -0.5 -0.6 0.77 0.59 0.62 0.67 -0.5 0.61 Natural killer cell mediated cytotoxicity0.6 -0.5 -0.8 0.9 0.61 0.62 0.84 0.54 0.57 Neuroactive ligand-receptor interaction.75 0 0.75 -0.8 0.75 0.75 -0.8 -0.8 0 Nitrobenzene degradation
-0.6 -0.6 -0.8 0.81 0.63 -0.6 0.75 0.63 -0.7 Nitrogen metabolism0.75 0 0.63 0.88 0.88 0.63 0.75 -0.6 0.75 O-Glycan biosynthesis0.8 0.6 0.7 -0.7 0.6 0.7 0.9 0.6 0.6 One carbon pool by folate
0.84 0.82 0.74 -0.7 -0.8 -0.6 0 -0.6 -0.7 Oxidative phosphorylation0.55 -0.6 -0.7 -0.6 0.55 0.64 0.64 -0.6 0.55 Pantothenate and CoA biosynthesis0.92 0.58 0.75 0.67 0 0.75 -0.7 -0.7 0.67 Parkinson's disease.63 0.63 -0.6 0.75 0 -0.8 0.88 0.63 0.63 Pentose and glucuronate interconversions
-0.7 -0.6 -0.8 0.62 0.54 -0.7 0.62 0.62 0 Phenylalanine metabolism0.55 -0.7 0.73 -0.7 0.73 -0.8 -0.6 -0.7 0.55 Prion disease
1 1 1 -0.8 0.63 0.93 0.81 0.67 0.78 Proteasome0.88 0.75 0.75 -0.9 -0.9 -0.9 -0.9 -0.6 0 Protein export0.89 0.81 0.83 0.6 0.7 0.81 0.66 0.55 0.66 Pyrimidine metabolism
1 0.67 0.83 -0.8 -0.7 -0.7 0.83 -0.7 -1 Reductive carboxylate cycle (CO2 fixation)-1 -1 -1 0 0 -1 0 -1 1 Retinol metabolism
0.67 0.67 0.97 -0.9 -0.6 0.67 -1 0.55 0.64 Ribosome0.9 0.8 1 -0.9 0.6 0.8 0 -0.6 0 RNA polymerase
-0.7 -0.7 -0.8 0.83 -0.7 -0.7 0.83 0.83 0.83 Stilbene, coumarine and lignin biosynthesis-0.9 -0.6 -0.6 0.71 -0.7 -0.7 -0.6 -0.7 0.71 Streptomycin biosynthesis0.67 0.67 -0.8 0.83 0 0.83 0 0.83 0 Taurine and hypotaurine metabolism
1 0 1 -0.8 -0.8 0 -0.8 0.75 0 Terpenoid biosynthesis-1 -1 0 0 -1 -1 -1 -1 -1 Tetrachloroethene degradation
-0.7 -0.7 -0.7 0.79 0.6 0.73 0.55 -0.5 0.55 Type I diabetes mellitus0.9 0.76 0.71 0.52 0.81 0.71 0.76 -0.7 -0.5 Ubiquitin mediated proteolysis
0.78 0.78 0.56 -0.6 0.56 0.67 0.67 0.67 0.56 Valine, leucine and isoleucine biosynthesis
T-N

Molecular Cancer 2006, 5:55 http://www.molecular-cancer.com/content/5/1/55
similar because KEGG pathways that include genes fromthese lists also included SAM genes from (CL - T) compar-isons. In conclusion, it was not possible to assert pathwaysimilarity with statistical confidence using this analysis.
ConclusionOur study shows that a large portion of genes implicatedin the emergence and progression of cancer have similargene expression values in tumors and cancer cell linesindicating the value of cultured cell lines in cancerresearch. However, the pair-wise comparisons of geneexpression profiles of CL, T, and N across all tissues illus-trate that there are pronounced changes in gene expres-sion specific to cell lines (CL - T; CL - N) that may notrepresent a disease process. This study also identified thesignaling and metabolic pathways in cell lines that havedistinctly different gene expression patterns than thoseassociated with normal and tumor tissue. Pathway-spe-cific gene expression changes in (CL - T) and (CL - N)comparisons were more consistent than (T - N) compari-sons in the set of six tissues under consideration. Just asthe gene expression changes in tumor – normal tissuecomparison were largely tissue-specific, the significantlyaltered pathways among tumor – normal comparisonswere limited to a small number of tissues. Functional
enrichment analysis allows us to explore significantchanges in pathways despite having heterogeneouschanges in gene expression across different tissues. Cellu-lar pathways that were significantly upregulated in celllines compared to tumor cells and normal cells of thesame tissue type included ATP synthesis, cell cycle, oxida-tive phosphorylation, purine, pyrimidine and pyruvatemetabolism, and proteasome. Results on metabolic path-ways suggested an increase in the velocity nucleotidemetabolism and RNA production.
The dominant trend in the gene expression profiles alongsignificantly altered pathways in cell lines appeared to beupregulation of genes when compared either to tumor ornormal tissue. Exceptions included genes in the cell adhe-sion molecules, cell communication, and ECM-receptorinteraction, focal adhesion, and complement/coagulationcascade pathways. The apparent downregulation of thecomplement/coagulation cascade in cell lines may be dueto the heterogeneous mixture of cells in tumor samplesincluding immune cells as well as tissue-specific cells.
The composition of the cell culture medium may be thereason why gene expression patterns that differentiatecancer cell lines from tumor tissue are similar to those pat-
Table 4: Comparison of results obtained from this study with those based on Gene Ontology Processes by Sandberg et al. [7]
KEGG Pathway Related GO category Direction of regulation in cell lines with respect to tumorsThis study Gene Ontology Study [7]
ATP synthesis ATP synthesis coupled proton transport (GO:0015986)
↑ ↑
Cell cycle Cell cycle (GO:0007049) ↑ ↑One carbon pool by folate Nucleotide biosynthesis
(GO:0009165)↑ ↑
Oxidative phosphorylation Oxidative phosphorylation (GO:0006119)
↑ ↑
Proteasome Ubiquitin-dependent protein catabolism (GO:0006511); Modification-dependent protein catabolism (GO:0019941)
↑ ↑
Purine metabolism Purine nucleotide metabolism (GO:0006163)
↑ ↑
Pyrimidine metabolism Nucleobase, nucleoside, nucleotide and nucleic acid metabolism (GO:0006139)
↑ ↑
Ribosome Protein biosynthesis (GO:0006412) ↑ ↑RNA polymerase Nucleobase, nucleoside, nucleotide
and nucleic acid metabolism (GO:0006139)
↑ ↑
Cell adhesion molecules (CAMs) Cell adhesion (GO:0007155) ↓ ↓Cell communication Cell adhesion (GO:0007155) ↓ ↓Complement and coagulation cascade Complement activation (GO:0006956) ↓ N/AECM-receptor interaction Cell adhesion (GO:0007155) ↓ ↓Focal Adhesion Cell adhesion (GO:0007155) ↓ ↓Phenylalanine metabolism Phenol metabolism (GO:0018958) ↓ N/A
The symbol [↑] indicates upregulation in cell lines with respect to tumors and [↓] indicates downregulation in cell lines with respect to tumors (CL - T).
Page 9 of 13(page number not for citation purposes)

Molecular Cancer 2006, 5:55 http://www.molecular-cancer.com/content/5/1/55
Page 10 of 13(page number not for citation purposes)
KEGG pyrimidine metabolism diagramFigure 3KEGG pyrimidine metabolism diagram. Gene expression shifts are projected from comparisons of cell line-to-tumor (CL - T), cell line-to-normal (CL - N), and tumor-to-normal (T - N) comparisons averaged over all six tissues. The color red indicates upregulated genes, green indicates downregulated genes and grey indicates the genes that are not on the microarray. Uncolored genes are not in the organism-specific pathway for Homo sapiens. A gene is identified as upregulated (downregu-lated) if its gene expression value averaged over 6 tissue types were greater (or lesser) in cell lines compared to tumor or nor-mal tissue. Colored genes with white lettering were also identified with SAM in at least two tissues.
A. (CL – T)
B. (CL – N) C. (T – N)
Molecular Cancer 2006, 5:55 http://www.molecular-cancer.com/content/5/1/55
Page 11 of 13(page number not for citation purposes)
KEGG cell cycle diagramFigure 4KEGG cell cycle diagram. Genes are shown (a) in a pathway map with genes specific to homo-sapiens shaded light green and (b) tabulated with a color map showing average gene expression shifts for samples within the six tissues. Red indicates a positive change and green indicates a negative change in average RMA value for the respective cell line-tumor (CL - T), cell line-normal (CL - N), and tumor-normal (T - N) comparisons, with color scale limits set to -2 and +2.
A
B CL-T CL-N T-N CL-T CL-N T-N CL-T CL-N T-N CL-T CL-N T-N CL-T CL-N T-N CL-T CL-N T-NABL1ATMATRCCNA1CCNA2CCNB1CCND1CCND2CCND3CCNE1CCNHCDC16CDC2CDC20CDC25ACDC25BCDC25CCDC27CDC6CDC7CDK2CDK4CDK6CDK7CDKN1ACDKN1CCDKN2ACDKN2BCDKN2DCREBBPCUL1E2F4E2F5EP300ESPL1GADD45AGSK3BHDAC1HDAC2MAD1L1MAD2L1MCM2MCM3MCM4MCM5MCM6MCM7MDM2ORC1LORC2LORC3LPCNAPKMYT1PLK1PRKDCRB1RBL1RBL2SFNSKP1ASKP2SMAD2SMAD3SMAD4SMC1L1TFDP1TGFB1TGFB2TGFB3TP53WEE1
Gene S
YWHABYWHAEYWHAHYWHAZ
ymbolBreast RenalProstateOvaryColonCNS

Molecular Cancer 2006, 5:55 http://www.molecular-cancer.com/content/5/1/55
Page 12 of 13(page number not for citation purposes)
Table 5: Genes that were identified by SAM in both (T - N) and (CL - N) comparisons but not in (CL - T) comparisons; (T - N ∩ CL - N) – (T - N ∩ CL - N ∩ CL - T).
Breast CNS Colon Ovary Prostate RenalUP DOWN UP DOWN UP DOWN UP DOWN UP DOWN UP DOWN
GALNS APP ACTB ATP5O ARD1A ADH1B MCM2 ACTG2 APOD ADH1BGP9 AQP1 CPSF1 COX7A1 ARPC1B BRD2 AEBP1 CCND2 ALDH4A1LCAT ARHGEF6 DDX11 CTNNB1 BCAT1 C7 C7 CXCL12 ANPEPRND2 ATP6V1B2 ECE1 GYPE CCND1 CA2 CEBPD KCNMB1 ASS
BRD2 EEF1A1 ITGB7 CPNE1 CALCOCO2 CNN1 MATN2 ATP6V1B1CTNNB1 EEF1G KIAA0513 CUL7 CASC3 DPYSL2 PTGDS C7CXCL12 FRAP1 MEF2C ERCC1 CES2 DUSP1 PTN CLCNKBDUSP1 GNAI2 MRPS21 GPS1 CHGA EGR1 SERPING1 ENGEGR1 GNB1 MYOM2 MDK CLEC3B FOS SPARCL1 EPHX2EGR3 GNB2 PCP4 PDXK CNN1 GYPC FABP1IGFBP4 GPIAP1 PVALB PEX6 CRYAB IGFBP5 GATA3JUND GPS1 S100A1 PHLDA2 CTNNB1 JUNB GATMKHSRP H3F3B SEPP1 S100A11 CUGBP2 LMOD1 GPX3KIT HNRPF SERPINI1 TEAD4 DMD LUM GSTA2KRT15 KHDRBS1 DPYSL2 MYH11 HMGCS2KRT5 MAZ FABP4 MYLK HPDMXI1 NONO FCGBP NDN KCNJ1MYH11 ODC1 FGFR2 NR4A1 MT1GNFIB PCBP2 FHL1 PPAP2B MT1XNSMAF RAB7 GDI1 SEPP1 PAHPCBP1 RBM10 GPD1L SERPINF1 PALMSERPINA3 RBM5 HMGCS2 SPARCL1 PCK2SNTB2 RHOB HSD11B2 TNXB PRODH2SOX9 SMARCA4 HSPA1A ZBTB16 PTHR1SPARCL1 SRM IL11RA ZFP36 SERPINA5VWF TRIM28 IL6R TACSTD1ZFP36 TUBB ITGA7 UGT2B7
UFM1 ITPKB UMODYBX1 LMOD1
LPLMAOANFIBNR3C2PCK1PLNPPAP2BPPP1R1APRKCB1SEPP1SLC26A3SMTNSPIBSRPXTACR2TGFBR3TPM1TPM2TSPAN7TUBA3ZBTB16

Molecular Cancer 2006, 5:55 http://www.molecular-cancer.com/content/5/1/55
terns that differentiate between cell lines and normal tis-sue. Typical cell culture medium is replete withmetabolites, growth factors, and cytokines, among others,for which cells normally must compete in vivo [24]. Mul-ticellular interfaces with which tumor cells interact in vivoare not replicated for cells grown in cell culture plates [26-29]. The differences in environmental selection pressuresmay help explain the differential gene expression patternsbetween the tumor tissue and the cell lines. Our findingabout the upregulation of oxidative phosphorylation incell lines is supported by previous metabolic studies[30,31]. The documentation of gene expression differ-ences along signaling and metabolic pathways is impor-tant in compound screening during the drug discoveryprocess. Compounds may affect significantly altered path-ways between cell lines and tumor tissue differently.Recent studies are taking advantage of the technologicaladvances in microfluidics and tissue engineering todevelop three-dimensional cell culture systems that aimsimulating in vivo culture conditions. Whether cell linescan be made to mimic tumor cell gene expression patternsby altering the culture medium conditions is a questionyet to be fully explored.
AcknowledgementsThis study was supported by the National institute of Health (NIH) grant #232240 and by the National science Foundation (NSF) grant # 235327.
References1. Yamori T: Panel of human cancer cell lines provides valuable
database for drug discovery and bioinformatics. Cancer Chem-other Pharmacol 2003, 52(Suppl 1):S74-9.
2. Kim JB, Stein R, O'Hare MJ: Three-dimensional in vitro tissueculture models of breast cancer – a review. Breast Cancer ResTreat 2004, 85(3):281-91.
3. Price JE, Zhang RD: Studies of human breast cancer metastasisusing nude mice. Cancer Metastasis Rev 1990, 8:285-297.
4. Ross DT, Perou CM: A comparison of gene expression signa-tures from breast tumors and breast tissue derived cell lines.Dis Markers 2001, 17(2):99-109.
5. Stein WD, Litman T, Fojo T, Bates SE: A Serial Analysis of GeneExpression (SAGE) database analysis of chemosensitivity:comparing solid tumors with cell lines and comparing solidtumors from different tissue origins. Cancer Res 2004,64(8):2805-16.
6. Sandberg R, Ernberg I: Assessment of tumor characteristic geneexpression in cell lines using a tissue similarity index (TSI).Proc Natl Acad Sci USA 2005, 102(6):2052-2057.
7. Sandberg R, Ernberg I: The molecular portrait of in vitro growthby meta-analysis of gene-expression profiles. Genome Biol2005, 6(8):R65.
8. Kanehisa M: A database for post-genome analysis. Trends Genet1997, 13:375-376.
9. Kanehisa M, Goto S: KEGG: Kyoto Encyclopedia of Genes andGenomes. Nucleic Acids Res 2000, 28:27-30.
10. Staunton JE, Slonim DK, Coller HA, Tamayo P, Angelo MJ, Park J,Scherf U, Lee JK, Reinhold WO, Weinstein JN, Mesirov JP, Lander ES,Golub TR: Chemosensitivity prediction by transcriptionalprofiling. Proc Natl Acad Sci USA 2001, 98(19):10787-92.
11. Ramaswamy S, Tamayo P, Rifkin R, Mukherjee S, Yeang CH, AngeloM, Ladd C, Reich M, Latulippe E, Mesirov JP, Poggio T, Gerald W,Loda M, Lander ES, Golub TR: Multiclass cancer diagnosis usingtumor gene expression signatures. Proc Natl Acad Sci USA 2001,98(26):15149-54.
12. Zhang B, Kirov S, Snoddy J: WebGestalt: an integrated systemfor exploring gene sets in various biological contexts. NucleicAcids Res 2005, 33:W741-8.
13. Irizarry RA, Hobbs B, Collin F, Beazer-Barclay YD, Antonellis KJ,Scherf U, Speed TP: Exploration, normalization, and summa-ries of high density oligonucleotide array probe level data.Biostatistics 2003, 4(2):249-64.
14. Bolstad BM, Irizarry RA, Astrand M, Speed TP: A Comparison ofNormalization Methods for High Density OligonucleotideArray Data Based on Bias and Variance. Bioinformatics 2003,19(2):185-193. Supplemental information
15. Gentleman RC, Carey VJ, Bates DM, Bolstad B, Dettling M, Dudoit S,Ellis B, Gautier L, Ge Y, Gentry J, Hornik K, Hothorn T, Huber W,Iacus S, Irizarry R, Leisch F, Li C, Maechler M, Rossini AJ, Sawitzki G,Smith C, Smyth G, Tierney L, Yang JY, Zhang J: Bioconductor: opensoftware development for computational biology and bioin-formatics. Genome Biol 2004, 5(10):R80.
16. Ihaka R, Gentleman R: R: A Language for Data Analysis andGraphics. Journal of Computational and Graphical Statistics 1996,3(5):299-314.
17. Bioconductor for R Installation Script [http://www.bioconductor.org/getBioC.R]
18. Tusher VG, Tibshirani R, Chu G: Significance analysis of micro-arrays applied to the ionizing radiation response. Proc NatlAcad Sci USA 2001, 98:5116-5121.
19. Saeed AI, Sharov V, White J, Li J, Liang W, Bhagabati N, Braisted J,Klapa M, Currier T, Thiagarajan M, et al.: TM4: a free, open-sourcesystem for microarray data management and analysis. Bio-techniques 2003, 34:374-378.
20. Segal E, Friedman N, Koller D, Regev A: A module map showingconditional activity of expression modules in cancer. NatGenet 2004, 36(10):1090-8.
21. Segal E, Friedman N, Kaminski N, Regev A, Koller D: From signa-tures to models: understanding cancer using microarrays.Nat Genet 2005:S38-45.
22. Chevrollier A, Loiseau D, Gautier F, Malthiery Y, Stepien G: ANT2expression under hypoxic conditions produces opposite cell-cycle behavior in 143B and HepG2 cancer cells. Mol Carcinog2005, 42(1):1-8.
23. A predicted increase in the velocity of RNA and DNA baseproduction in cell lines is in line with trend of increasing ratesof cell division observed in cell cultures. .
24. Kufe Donald W, Pollock Raphael E, Weichselbaum Ralph R, Bast Rob-ert C, Gansler Ted S Jr, Holland James F, Frei Emil III: Pyrimidineand Purine Antimetabolites. Cancer Medicine Inc 6th edition.2003:50.
25. Vogel TW, Zhuang Z, Li J, Okamoto H, Furuta M, Lee YS, Zeng W,Oldfield EH, Vortmeyer AO, Weil RJ: Proteins and protein pat-tern differences between glioma cell lines and glioblastomamultiforme. Clin Cancer Res 2005, 11(10):3624-32.
26. Dipasquale B, Colombatti M, Tridente G: Morphological hetero-geneity and phenotype modifications during long term invitro cultures of six new glioblastoma cell lines. Tumori 1990,76(2):172-8.
27. Chen MH, Yang WK, Whang-Peng J, Lee LS, Huang TS: Differentialinducibilities of GFAP expression, cytostasis and apoptosis inprimary cultures of human astrocytic tumours. Apoptosis1998, 3:171-82.
28. Pandita A, Aldape KD, Zadeh G, Guha A, James CD: Contrasting invivo and in vitro fates of glioblastoma cell subpopulationswith amplified EGFR. Genes Chromosomes Cancer 2004, 39:29-33.
29. Pieper RO: Defined human cellular systems in the study of gli-oma development. Front Biosci 2003, 8:s19-27.
30. Faure Vigny H, Heddi A, Giraud S, Chautard D, Stepien G: Expres-sion of oxidative phosphorylation genes in renal tumors andtumoral cell lines. Mol Carcinog 1996, 16(3):165-72.
31. Franks SE, Kuesel AC, Lutz NW, Hull WE: 31P MRS of humantumor cells: effects of culture media and conditions on phos-pholipid metabolite concentrations. Anticancer Res 1996,16(3B):1365-74.
Page 13 of 13(page number not for citation purposes)