Embed Size (px)
Citation preview
Pathways to Education: An IntegratedApproach to Helping At-Risk HighSchool Students
Philip Oreopoulos
University of Toronto, National Bureau of Economic Research, and Canadian Institutefor Advanced Research
Robert S. Brown
Toronto District School Board
Adam M. Lavecchia
University of Ottawa
Wethat iBascoThomthusi
Electro[ Journa© 2017
All us
Pathways to Education is a comprehensive support program devel-oped to improve academic outcomes of high school students fromvery poor social-economic backgrounds. The program includes proac-tive mentoring, daily tutoring, and group activities, combined with in-termediate and long-term incentives to reinforce a minimum degreeof mandatory participation; it began in 2001 for entering grade 9 stu-dents living in Regent Park, the largest public housing project in To-ronto. It expanded in 2007 to include two additional Toronto projects.Comparing students from other housing projects before and after theintroduction of the program, high school graduation and postsecond-ary enrollment rates rose dramatically for Pathways-eligible students,in some cases by more than 50 percent.
thank the editor, Jim Heckman, and four anonymous referees for helpful commentsmproved the paper. We are extremely grateful to Pathways’ administrators, Diannembe, Megan Conway, Margaret Douglin, Petrona Eccleston, Sharmini Fernando,as Greginis, David Hughes, Faisal Islam, Irene Parvin, and Stacey Young, for their en-
astic support and for providing program details and participation data and making
nically published June 26, 2017l of Political Economy, 2017, vol. 125, no. 4]by The University of Chicago. All rights reserved. 0022-3808/2017/12504-0004$10.00
947
This content downloaded from 128.100.177.180 on May 31, 2020 12:08:01 PMe subject to University of Chicago Press Terms and Conditions (http://www.journals.uchicago.edu/t-and-c).
948 journal of political economy
All
I. Introduction
Children from very poor social-economic backgrounds are subject tomany stresses while growing up and are vastly more at risk of ending uppoor, incarcerated, unhealthy, and unhappy than children from moreaffluent backgrounds (Lynn and McGeary 1990; McLoyd 1998; Holzeret al. 2008). Not only do impoverished children often receive poorer pa-rental investments—in part because parents are subject to many social-economic stresses themselves—they also are exposed to far worse schooland neighborhood environments at critical development stages. Thiscompounding adversity can take a serious psychological toll (Dearing2008). Ethnographic studies document harsh realities from being reg-ularly exposed to violence, subject to low expectations, and, overall,“weighed down by a world of no” (Osofsky 1999; Dvorak 2010; Polidano,Broadway, and Buddelmeyer 2012).1
Overarching programs have long been sought to meaningfully over-come these challenges. Evidence on their effectiveness is usually disap-pointing, but there are exceptions (Camilli et al. 2010). Preschool inter-ventions involving home visits to offer support and advice have proveneffective in helping improve human capital among disadvantaged chil-dren (Olds et al. 2004; Schweinhart et al. 2005; Gertler et al. 2014;Attanasio et al. 2015). Researchers suggest that the long-term benefitsfrom these programs may work by encouraging the development of notonly cognitive skills, such as numeracy and reading, but also noncognitiveskills such as perseverance, conscientiousness, and grit. In turn, improve-ment in these skills may make it easier to encourage development at laterages (a feature known as dynamic complementarity; Cunha andHeckman2007). Many have concluded from this research that early childhood is acritical period for promoting human capital (Heckman 2004; Cunha,Heckman, and Schennach 2010; Aizer and Cunha 2012; Caucutt andLochner 2012; Heckman, Pinto, and Savelyev 2013; Attanasio et al. 2015).More recent research also suggests that adolescence is a critical period
of skill development (Selemon 2013; Steinberg, forthcoming). In line
1 For ethnographic study examples, see Venkatesh (2002) and the BBC documentary se-ries Growing Up Poor (http://www.bbc.co.uk/programmes/b01s8p78/episodes/guide).
available internal reports. We also thank Marc Frenette for producing the census robust-ness analysis in an earlier version of this paper and seminar participants from the CanadianInstitute for Advanced Research’s Social Interactions, Identity, and Well Being group,Brigham Young University, University of Montreal, Laval University, University of WesternOntario, University of Stavanger Workshop on Labor Markets, Families, and Children,DIW Berlin, Simon Fraser University, University of Toronto, the Canadian Economics As-sociation meetings, the Midwest Economics Association meetings, the 12th Conference onResearch on Economic Theory and Econometrics, and the NBER Summer Institute Chil-dren’s group. Research support was provided by Education Policy Research Initiative. Anyerrors or omissions are those of the authors. Data are provided as supplementary materialonline.
This content downloaded from 128.100.177.180 on May 31, 2020 12:08:01 PM use subject to University of Chicago Press Terms and Conditions (http://www.journals.uchicago.edu/t-and-c).
pathways to education 949
with this possibility, impressive long-term benefits have accrued to dis-advantaged teenagers accepted to some chartered schools via lottery(Abdulkadiroglu et al. 2011; Dobbie and Fryer 2011). Dobbie and Fryer(2013) identify common features among them, including more time inschool, tutoring, after-school assistance, and a culture of high expecta-tions. Fryer (2014) finds that applying these features to public schoolscan generate similar effects. Similarly, impressive gains to high school at-tainment and academic performance are found in another recent ran-domized trial that provided daily two-on-one tutoring combined with social-cognitive behavioral therapy todisadvantaged students fromChicago (Cooket al. 2014).This paper evaluates another comprehensive effort to help at-risk youth.
The Pathways to Education Program (Pathways) began as a grassroots ef-fort by community workers in Regent Park, Canada’s oldest and largestpublic housing project, in Toronto. Regent Park is one of Canada’s poor-est neighborhoods. It comprises 2,087 high- and low-rise apartment unitswithin a self-contained downtown community and is home to 7,500 res-idents, all paying rent geared to income. The community faces relativelyhigh levels of crime and gang activity. From the 2001 census, 87 percentof family households living in Regent Park are classified as being below Sta-tistics Canada’s Low-Income Cut-Off (LICO), 56 percent of residents aresingle parents, and 59 percent of residents have no earnings.2 In the 1990s,more than half of Regent Park youths failed to complete high school.Against this backdrop, the Board of Directors for the Regent Park
Community Health Centre began developing a program to promoteand support academic achievement for Regent Park youths, with the ul-timate goal of fostering a more positive community environment. Theprogramadopts amultifaceted approach, offering extensive tutoring,men-toring, financial support (such as bus tickets tied to school attendance andbursaries for postsecondary schooling), and easy access to student-parentworkers who provide information and advice on a wide range of issues. Af-ter several years of consultation and fund-raising, the program began inthe 2001–2 school year for entering grade 9 students from Regent Parkand was phased in for successive grade 9 cohorts each year thereafter. El-igibility is based solely on residing in Regent Park, though participationrequires a written commitment by both parents and students to the pro-gram’s high expectations.We estimate the effect of Pathways’ eligibility on high school comple-
tion, postsecondary enrollment, and intermediate high school achieve-
2 A household falls below the LICO if it spends more than 20 percentage points abovethe average comparative household on food, clothing, and shelter. For example, if the av-erage Canadian family spends 35 percent of before-tax income on food, clothing, and shel-ter, a family that spends more than 55 percent of before-tax income on these items fallsbelow the LICO.
This content downloaded from 128.100.177.180 on May 31, 2020 12:08:01 PMAll use subject to University of Chicago Press Terms and Conditions (http://www.journals.uchicago.edu/t-and-c).
950 journal of political economy
All
ment measures. Our difference-in-differences empirical strategy com-pares students from Regent Park to students from other Toronto publichousing projects before and after the introduction of the program in2001. Two key features of Pathways’ rolloutmake it amenable to a rigorousevaluation. First, the program was not announced to residents prior to itsinitial recruitment. This feature, combined with long wait times for subsi-dized housing in Toronto, makes it unlikely that motivated students andfamilies could have sorted into Regent Park. Second, since enrollmentwas phased in for successive cohorts, we can compare eligible studentsliving in Regent Park to students living in other public housing projectsbefore and after 2001. We find that Pathways had high participation rates,rising to more than 85 percent after 3 years. Eligibility for Pathways in-creased high school completion by 35 percent (from 44 to 59 percent) andpostsecondary enrollment by more than 60 percent (from 31 to 50 per-cent). We also detect intermediate effects on math and reading gradesand on the likelihood of taking more university prerequisite courses. Path-ways affects females more than males, higher initial ability students morethan lower ability, and immigrant and nonimmigrant families equally.We check the internal and external validity of the Regent Park estimatesby exploiting the expansion of Pathways in 2007 at two additional Torontohousing projects (Rexdale and Lawrence Heights). As in Regent Park,high school completion effects are large, but mostly for females, while2-year community college going effects are large, but mostly for malesThe next section details the structure of the Pathways program. Sec-
tion III describes the data and empirical strategy. Section IV presents themain results and sensitivity checks. In Section V, we discuss possible mech-anisms underlying the results and present a mediation analysis. Section VIpresents conclusions and provides an outline for further research.
II. The Structure of the Pathwaysto Education Program
Eligibility for Pathways is inclusive, based only on residence, and is avail-able to every Regent Park youth attending high school (beginning withstudents entering grade 9 in 2001 and continuing with successive enter-ing grade 9 cohorts thereafter).3 The program expanded in 2007 to in-clude two additional disadvantaged neighborhoods, Rexdale and Law-rence Heights.4 Participation in Pathways is voluntary and requires
3 For more details about the origins and administration of Pathways to Education, seeonline app. B, as well as Bales (2004), Rowen and Gosine (2006), and Rowen (2012).
4 Pathways has since expanded to more than 11 additional sites across Canada, includ-ing a fourth site in Toronto (Scarborough Village) and sites in Ottawa, Vancouver, andMontreal.
This content downloaded from 128.100.177.180 on May 31, 2020 12:08:01 PM use subject to University of Chicago Press Terms and Conditions (http://www.journals.uchicago.edu/t-and-c).

pathways to education 951
both students and parents to agree each year in writing to the program’sconditions and high expectations.5 To recruit students, Pathways devel-oped strong ties with the five elementary schools that include RegentPark in their catchment areas. Schools help identify eligible students,provide contact information, and facilitate introductory presentationswith students and parents.There are four pillars of support to the Pathways program: counseling,
academic, social, and financial. Each student is assigned to a student-parent support worker (SPSW), who is employed full-time by Pathways.SPSWs serve as the main connection between students and the program.They are responsible for working with each student and parent to helpensure academic success. The relationship begins prior to the start ofhigh school at a mandatory orientation session. Students are requiredtomeet with their SPSWs at least twice amonth,more if needed.Meetingsare scheduled at specific times, often during lunch or after class, and areheld either at school or at the Pathways office. Through their relation-ships with high schools, SPSWs monitor students’ absenteeism, grades,and participation in other Pathways activities. They provide informationto students about events and community resources and distribute freebus tickets. SPSWs often serve as the go-to people for dealing with any is-sue that may arise at home, at school, or around the community.6 Theyare each responsible for approximately 50 students over a school year,though much of their time is focused on those with the most need. Ifcrises or issues arise, they may work together with other facilitators to de-termine how to best manage these situations. Many SPSWsmaintain con-tact with their students after graduation on an informal basis.7
Pathways participants also receive extensive academic support in theform of free tutoring, usually at a local church hall, for up to four nightsa week. Tutoring is conducted in small groups and on a one-on-one basis.It is available in core academic subjects, as well as for development of lit-eracy and general study skills. Tutoring is mandatory twice a week, withexemptions for students with a previous term grade average above athreshold (60 percent in grade 9, 70 percent in grade 10 and beyond).Tutors are volunteers that receive some training and help about 5 hoursper week, on average. They include accountants, retired teachers, invest-ment bankers, parents, graduate students from teacher colleges, and cur-
5 Copies of both agreements are shown in app. A.6 As one SPSW put it, “I support [students] through their schooling, through their fam-
ily, peer issues, sometimes I’m an advocate for them, and sometimes I’m sort of the voice ofreason, or sometimes I’m just a sounding board—someone to vent to. So really, I just gowith what the students need to do.”
7 A 2009 documentary film, Invisible City, follows two struggling Regent Park and Path-ways students over 3 years and an SPSW worker who tries to help them. The film can beviewed at http://www.nfb.ca/film/invisible_city/trailer/invisible_city_trailer.
This content downloaded from 128.100.177.180 on May 31, 2020 12:08:01 PMAll use subject to University of Chicago Press Terms and Conditions (http://www.journals.uchicago.edu/t-and-c).
952 journal of political economy
All
rent and former Pathways students. The student-tutor ratio is generallyless than 5∶1. Students who SPSWs believe would benefit from special at-tention often get one-on-one support.In grades 9 and 10, Pathways students receive social support in the
form of group mentoring. Students select at least two activities a monthfrom a wide range of daily options designed to foster social and groupwork skills and a commitment to the community. Previous examples in-cluded attending sporting events, theater, participating in creative arts,cooking, bowling, community recycling projects, andmartial arts. Groupmentoring now includes workshops from the “YouCan” program to teachcognitive behavioral therapy (http://www.youcan.ca). Other activities in-clude the photography program, Adventures in Science, Big Brothers/Sisters, recreation, and art. Mentoring groups typically comprise about15 youths and three volunteermentors, who are often university students.By grades 11 and 12, students may still choose from the specific activitiesoffered but also may play more of an active role in choosing more inde-pendent activities based on their own talents and interests. SPSWs andstudents agree on biweekly activities that may occur within or outsideof the community (including tutoring younger grades). Social supportalso comes in the form of career mentoring. Pathways offers many eventsfor students preparing to exit high school, including resume preparationclasses, job interview practice, college and university campus visits, andvisits to potential employers. Students also receive personal assistancefrom SPSWs on postsecondary applications, including fee waivers.The final pillar of Pathways support is financial. Support comes in two
forms: immediate assistance to help with the costs of going to school andlonger-term assistance to help with the costs of going to college. Immedi-ate financial assistance is in the form of free public transportation ticketsand school supplies, but Pathways’ participants must meet with theirSPSWs to get them. Tickets are allocated biweekly on the basis of previousperiod school attendance.8 Since the three high schools most commonlyattended by Pathways’ students are 2, 3, and 5 kilometers away, the ticketsprovide a strong motivation for program participation and school atten-dance, according to focus groups and Pathways’ staff.9 Longer-term fi-
8 In March 2015, the one-way public transit fare was $2 per trip for high school students. Aweekly (monthly) pass that allows an unlimited number of rides was $33 per week ($112 permonth) for high school students (https://www.ttc.ca/Fares_and_passes/Prices/index.jsp).
9 In one focus group, a student remarked, “If I don’t go to school one day and like nexttime, I get my tickets, my SPSW would be like, you didn’t go to school these days, and soyou’d get two less tickets ’cause this day you didn’t go to school so you shouldn’t have thosetickets and so you know, you can’t skip because you’re like damn I need these tickets.” An-other grade 11 student remarked, “I have to go [to tutoring] because of Pathways. If I don’tgo I’mnot gonna get my tickets to go to school, if I don’t get my tickets, I can’t go to schoolthere’s no other way . . . except . . . walking.”
This content downloaded from 128.100.177.180 on May 31, 2020 12:08:01 PM use subject to University of Chicago Press Terms and Conditions (http://www.journals.uchicago.edu/t-and-c).
pathways to education 953
nancial assistance is provided through a trust fund for each participant.The program sets aside $1,000, up to a maximum of $4,000 (tax-free),for each year of participation that can be used toward tuition and otherpostsecondary expenses after high school graduation.10
If students in Pathways miss school, SPSW meetings, tutorial sessions,or group mentoring workshops, their SPSWs will actively reach out tothem. SPSWs first focus on encouraging attendance before mentioningthe possibility of program withdrawal. If lack of participation is discussedand no meaningful response occurs, a warning letter is sent home to aparent encouraging the student to participate more. If there is still noprogress, the student may be dropped from the program. Very few stu-dents are ultimately dropped, however, since the approach usually is tokeep reengaging. As the Pathways coordinator of tutoring andmentoringpreviously remarked, “We do not give up easily. . . .Our philosophy is thatyou set high expectations and the kids will rise to them. If they haven’tmet them, they are on their way. If they have made a mistake, we try tohelp them see it as a small setback” (Bales 2004).
III. Data and Methodology
A. Toronto District School Board Data
Data for this study come from three main sources: the Toronto DistrictSchool Board (TDSB), Toronto Community Housing, and Pathways ad-ministrators. This section summarizes the three data sets and the con-struction of key variables. More details are provided in online appendix C.TDSBadministrative data are available forhigh school students whoenteredgrade 9 beginning in 2000, the year before Pathways was introduced. Ourbaseline data begin with all recorded students entering grade 9 at a TDSBschool between 2000 and 2008.11 Background information includes gen-der, immigrant status, immigrant year of arrival, language spoken at home,age, high school attended, and residential address. Cohort data for oneearlier year (ninth graders in 1999) exist, but only for students attendingschools in the former City of Toronto, before it was amalgamated to in-clude several suburbs.12Weuse this additional year of data to checkwhether
10 The postsecondary bursary covers a significant fraction of postsecondary tuition. Av-erage 4-year university undergraduate tuition in Ontario ranged from $5,000 per year to$7,000 per year from 2006 to 2014 (from Statistics Canada’s socioeconomic database,CANSIM table 477-0021). Average 2-year community college tuition is approximately$3,000 per year (http://www.ontariocolleges.ca/colleges/paying-for-college).
11 Students attending Catholic or private schools are therefore not included in the anal-ysis. This omission does not likely affect the results given the small fraction attending non-TDSB schools (about 10 percent) and the fact that Pathways eligibility is based on locationof residence, not location of school.
12 These suburbs include the municipalities of East York, Etobicoke, North York, Scar-borough, and York. Brown (2006) describes the data in more detail.
This content downloaded from 128.100.177.180 on May 31, 2020 12:08:01 PMAll use subject to University of Chicago Press Terms and Conditions (http://www.journals.uchicago.edu/t-and-c).

954 journal of political economy
All
the Regent Park results depend significantly on having one or two pre-Pathways cohorts.We estimate Pathways’ impact on a variety of outcomes, beginning in
grade 9. The TDSB data contain information on grade 9 performancein mathematics and English courses. For each year and cohort, these var-iables are standardized to have amean of zero and a standard deviation ofone. We construct a summary dummy variable for grade 9 performanceequal to one if a student fails at least one of grade 9 math or English(which we call “low grade 9 grades”) and zero otherwise. For juniorand senior classes, we have transcript information with the average gradefor all grade 11 and 12 courses ever taken, regardless of when the coursewas taken and whether the course was passed or dropped. This variableis also standardized.Our data indicate whether students passed both the reading and writ-
ing components of the Ontario Secondary School Literacy Test (OSSLT)when the test was initially taken in grade 10, a requirement for highschool completion. Further, we record whether a student takes coursesin grades 9 and 10 that place him or her on a university track. Underthe Ontario secondary school curriculum, students choose a programof study that includes grade 9 and 10 courses classified as academic(university-directed), applied (college-directed), or locally developed es-sentials (workplace-directed). Our indicator variable takes a value of oneif a majority of grade 9 and 10 courses are academic and zero otherwise.13
Our outcome variable for high school graduation is equal to one forstudents recorded as completing their Ontario Secondary School Di-ploma by the end of their fifth year since entering high school (in grade 9)or as having completed at least 30 credits (a student with 30 or more cred-its, but not recorded as graduated, is likely misclassified). Otherwise, it isequal to zero for students who either (i) remained in the TDSB system thefollowing fall (in year 6), (ii) transferred outside TDSB to another schoolsystem, or (iii) left school without graduating.Ontario’s two central application service organizations for postsecond-
ary education (one for colleges, another for universities) provide TDSBwith application data and confirmations, acceptances, and registrations.Therefore, we know whether students applied, accepted, and registeredto attend a college or university program within 5 years. Students are per-mitted to accept only one offer. For exposition, we refer to those registeredas enrolled, since the outcome is associated with paying initial fees andchoosing courses (Brown 2006).
13 About three-quarters (75.8 percent) of Toronto students from the 2000 cohort areclassified as on the academic track, compared to about half (48.5) for our sample of publichousing tenants.
This content downloaded from 128.100.177.180 on May 31, 2020 12:08:01 PM use subject to University of Chicago Press Terms and Conditions (http://www.journals.uchicago.edu/t-and-c).
pathways to education 955
B. Public Housing Address Data
The TDSB data are matched to Toronto public housing projects usinguniquely identifiable postal codes. We focus on the 113 projects built be-fore 1976 by the Metro Toronto Housing Corporation Authority, nowcalled Toronto Community Housing (TCH).14 To create a publicly avail-able data set, some nearby small projects are grouped together, so we endup with 70 housing project groups. Addresses for these locations were ob-tained from TCH and cross-checked using Canada Post’s online postalcode finder. Every household residing in these projects pays rent gearedto income, with approximately 25–30 percent of a household’s gross totalincome charged as rent.15
The TCH application process is centralized. Although applicants areable to state preferences, families have an incentive to remain eligiblefor as many housing projects as possible. Around the time of the intro-duction of Pathways in Regent Park, average wait times for public housingaveraged 5–7 years (Toronto Social Housing Connections 1998). Giventhis excess demand, offers of accommodation were given to families withthe greatest financial need. Pathways was not announced to residentsprior to its initial recruitment, both in Regent Park and in the 2007 ex-pansion sites, Rexdale and Lawrence Heights. Given the chronologicalapproach to assigning applicants to public housing units and the longwait times, it is unlikely that households with a preference for these proj-ects because of Pathways would be in our data (in general, applicants pre-fer smaller projects to avoid living in neighborhoods with a high densityof poor households). Movement across projects is rare and is not allowedwithout an exceptional reason (e.g., change in work location).Wematch public housing postal code addresses, recorded when enter-
ing grade 9, to the TDSB data. Each code generally refers to one side of acity street, often covering only one block or a single apartment building.Approximately three-fourths of families living in these postal codes werelocated in public housing addresses with unique postal codes. To ensuresimilarity across our sample, we use only postal codes that uniquelymatchto these projects. With this match, our baseline sample is 7,770 studentswho began grade 9 at a TDSB high school between 2000 and 2008 whileresiding in a Toronto public housing project in which all parents weresubject to rent geared to income.
14 Projects that accommodate seniors, Aboriginals, or special-needs people are omitted.15 Smaller TCH projects built after 1976 allowed for mixed housing, with some house-
holds paying rent geared to income and others paying market rent. For the main analysis,we omit these residences to focus on a comparison group of grade 9 students whose par-ents pay rent only geared to income. In an unreported robustness check, we find that theinclusion of these “nonunique matches” does not affect our main estimates.
This content downloaded from 128.100.177.180 on May 31, 2020 12:08:01 PMAll use subject to University of Chicago Press Terms and Conditions (http://www.journals.uchicago.edu/t-and-c).
956 journal of political economy
All
C. Pathways Participation Data
Pathways registration and participation data are alsomatched to the base-line TDSB data. Pathways administrators provided a list of all students everregistered for the program since its inception in 2001. Information on stu-dent name, gender, date of birth, andOntario EducationNumbermade itpossible to link the two data sets.We also have registration status for 2007. This allows us to examine
changes in registration status between grade 9 and grade 12 for the 2003cohort, changes in status between grade 9 and grade 11 for the 2004 co-hort, and changes in status between grade 9 and grade 10 for the 2005cohort. Finally, we have information on recorded monthly mentoringand tutoring sessions. Data quality is questionable for earlier years, sowe use data from the 2010 grade 9 cohort as a representative case.
D. Qualitative Interviews
To better understand the complexities and challenges faced in operatingsuch an extensive program, we conducted interviews with Pathways staff.These discussions provided an opportunity to listen to SPSWs, tutors, andother administrators about their experiences and impressions of whatmechanisms may be at play. We conducted 10 interviews in total, about1 hour each. While these interviews cannot provide conclusive informa-tion about causal mechanisms behind the program, they illustrate howthe program may be helping. We reference these interviews throughoutthe paper and in the appendix.
E. Difference-in-Difference Analysis
Program eligibility effects are estimated from a difference-in-differencesmethodology, which compares the relative differences in outcomes be-tween students from Regent Park, Rexdale, and Lawrence Heights andstudents fromotherhousing projects before and after Pathways was intro-duced. Our baseline results are from the following regression model:
yi 5 bTp ið Þc ið Þ 1 d0Xi 1 ep ið Þ 1 ec ið Þ 1 ei , (1)
where the subscript i denotes individuals, p denotes housing projects,and c denotes cohorts (year entered grade 9). The term yi is an outcomevariable for individual i, T is a dummy variable indicating whether anindividual is eligible for Pathways, and X is a vector of the individual’sdemographic characteristics (gender, age in grade 9, immigrant status,and a dummy for whether English is the primary language spoken athome). All specifications include housing project fixed effects (ep(i)) and
This content downloaded from 128.100.177.180 on May 31, 2020 12:08:01 PM use subject to University of Chicago Press Terms and Conditions (http://www.journals.uchicago.edu/t-and-c).
pathways to education 957
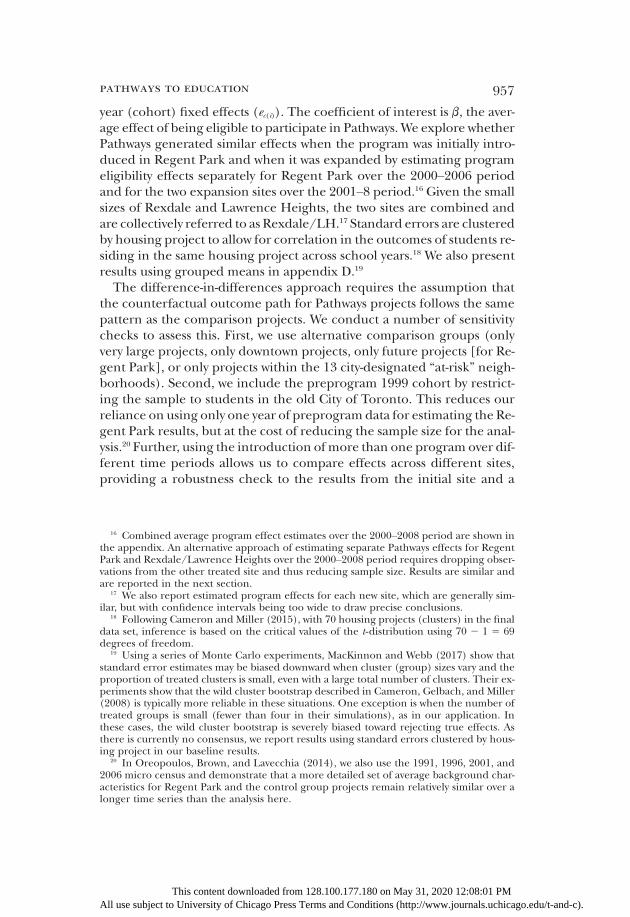
year (cohort) fixed effects (ec(i)). The coefficient of interest is b, the aver-age effect of being eligible to participate in Pathways.We explore whetherPathways generated similar effects when the program was initially intro-duced in Regent Park and when it was expanded by estimating programeligibility effects separately for Regent Park over the 2000–2006 periodand for the two expansion sites over the 2001–8 period.16 Given the smallsizes of Rexdale and Lawrence Heights, the two sites are combined andare collectively referred to as Rexdale/LH.17 Standard errors are clusteredby housing project to allow for correlation in the outcomes of students re-siding in the same housing project across school years.18 We also presentresults using grouped means in appendix D.19
The difference-in-differences approach requires the assumption thatthe counterfactual outcome path for Pathways projects follows the samepattern as the comparison projects. We conduct a number of sensitivitychecks to assess this. First, we use alternative comparison groups (onlyvery large projects, only downtown projects, only future projects [for Re-gent Park], or only projects within the 13 city-designated “at-risk” neigh-borhoods). Second, we include the preprogram 1999 cohort by restrict-ing the sample to students in the old City of Toronto. This reduces ourreliance on using only one year of preprogram data for estimating the Re-gent Park results, but at the cost of reducing the sample size for the anal-ysis.20 Further, using the introduction ofmore than one program over dif-ferent time periods allows us to compare effects across different sites,providing a robustness check to the results from the initial site and a
16 Combined average program effect estimates over the 2000–2008 period are shown inthe appendix. An alternative approach of estimating separate Pathways effects for RegentPark and Rexdale/Lawrence Heights over the 2000–2008 period requires dropping obser-vations from the other treated site and thus reducing sample size. Results are similar andare reported in the next section.
17 We also report estimated program effects for each new site, which are generally sim-ilar, but with confidence intervals being too wide to draw precise conclusions.
18 Following Cameron and Miller (2015), with 70 housing projects (clusters) in the finaldata set, inference is based on the critical values of the t-distribution using 70 2 1 5 69degrees of freedom.
19 Using a series of Monte Carlo experiments, MacKinnon and Webb (2017) show thatstandard error estimates may be biased downward when cluster (group) sizes vary and theproportion of treated clusters is small, even with a large total number of clusters. Their ex-periments show that the wild cluster bootstrap described in Cameron, Gelbach, and Miller(2008) is typically more reliable in these situations. One exception is when the number oftreated groups is small (fewer than four in their simulations), as in our application. Inthese cases, the wild cluster bootstrap is severely biased toward rejecting true effects. Asthere is currently no consensus, we report results using standard errors clustered by hous-ing project in our baseline results.
20 In Oreopoulos, Brown, and Lavecchia (2014), we also use the 1991, 1996, 2001, and2006 micro census and demonstrate that a more detailed set of average background char-acteristics for Regent Park and the control group projects remain relatively similar over alonger time series than the analysis here.
This content downloaded from 128.100.177.180 on May 31, 2020 12:08:01 PMAll use subject to University of Chicago Press Terms and Conditions (http://www.journals.uchicago.edu/t-and-c).

958 journal of political economy
All
check of the program’s external validity. It is also reassuring that we findsimilar effects across subgroups, suggesting that our findings are notspurious.
F. Descriptive Statistics
Table 1 presents sample size counts of our baseline data. From the 7,770students entering a TDSB school in grade 9 between 2000 and 2008 froma TCH housing project, 1,296 are from Regent Park, 854 are fromRexdale/LH, and 5,620 are from other projects. Each year, we trackroughly 140 students entering grade 9 from Regent Park, 90 studentsfrom Rexdale/LH, and about 600 students from other projects. In com-parison, the TDSB’s 2000 grade 9 cohort consisted of 18,798 students(Brown 2006).
G. Pathways Registration and Participation
Beginning in the 2001–2 school year, all children entering grade 9 andliving in Regent Park are eligible to participate in Pathways. Similarly, en-tering grade 9 students living in Rexdale/LH became eligible in 2007–8.Participation requires students and their parents to register each year bycompleting an agreement form. Figure 1 shows Pathways registrationrates among TDSB students entering grade 9 between 2000 and 2008from Regent Park and Rexdale/LH. For the program’s first year in Re-gent Park, 58.8 percent of eligible students registered. In the second year,the fraction registered climbed to 80.7 percent, and, by the third year,89.3 percent of all eligible TDSB Regent Park students enrolled in theprogram. Participation remained high for the next 5 years and was simi-larly impressive at the Rexdale and Lawrence Heights sites, where Path-ways was introduced for the 2007 cohort. Not shown in the figure, butnoteworthy, is that grade 9 registration rates are similar for males andfemales, English-speaking and non-English-speaking students, and low-and high-performing students.Participation in various Pathways activities was not well recorded. Be-
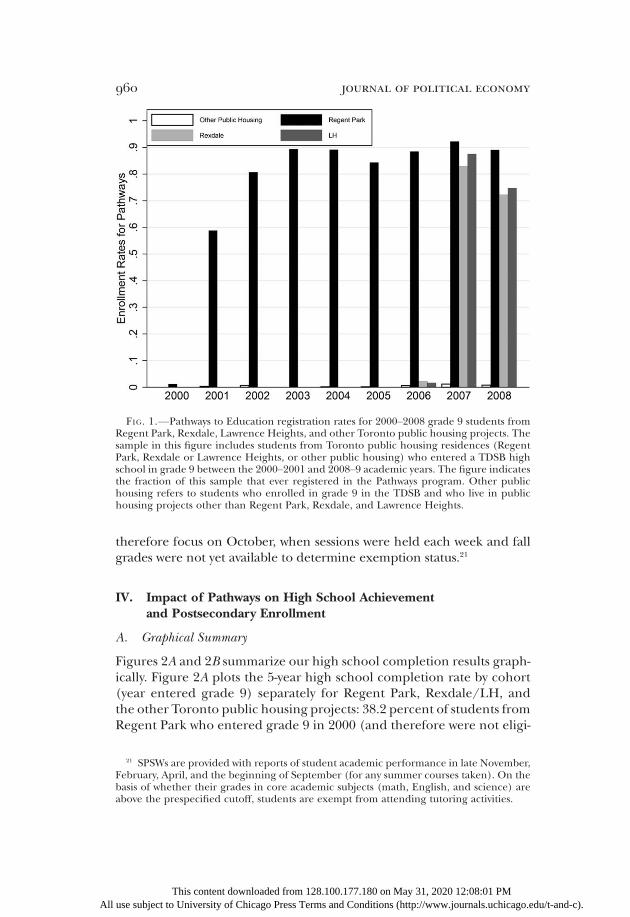
fore 2008, no data were collected on public transportation ticket provi-sion or SPSW meetings. A representative sample of 2014 SPSW monthlycase notes suggests that students meet about twice a month with SPSWs,sometimes more. The notes indicate that SPSWs were very active in aca-demicmatters and follow up not only with students but also with parents,teachers, counselors, and principals. Tables 2 and 3 summarize monthlymentoring and tutoring participation for 2010 Pathways registrants bygrade level. Generally, participants are required to attend two tutoringsessions each week unless exempted because of grade performance. We
This content downloaded from 128.100.177.180 on May 31, 2020 12:08:01 PM use subject to University of Chicago Press Terms and Conditions (http://www.journals.uchicago.edu/t-and-c).
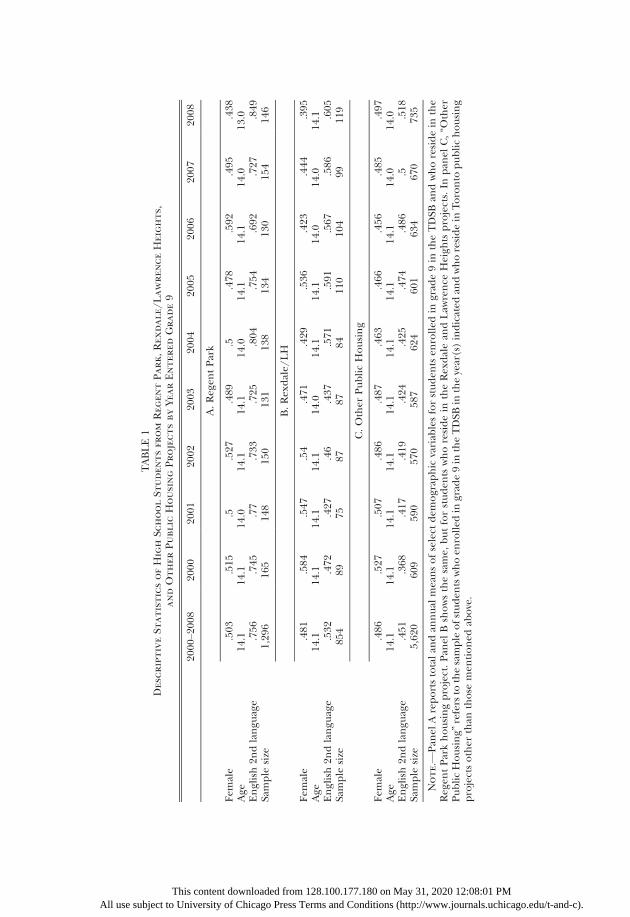
TABLE1
DescriptiveStatisticsofHighSchoolStudentsfrom
RegentPark,Rexdale/LawrenceHeights,
andOtherPublicHousingProjectsbyYearEnteredGrade9
2000
–20
0820
0020
0120
0220
0320
0420
0520
0620
0720
08
A.Reg
entPark
Fem
ale
.503
.515
.5.527
.489
.5.478
.592
.495
.438
Age
14.1
14.1
14.0
14.1
14.1
14.0
14.1
14.1
14.0
13.0
English2n
dlangu
age
.756
.745
.77
.733
.725
.804
.754
.692
.727
.849
Sample
size
1,29
616
514
815
013
113
813
413
015
414
6
B.Rex
dale/
LH
Fem
ale
.481
.584
.547
.54
.471
.429
.536
.423
.444
.395
Age
14.1
14.1
14.1
14.1
14.0
14.1
14.1
14.0
14.0
14.1
English2n
dlangu
age
.532
.472
.427
.46
.437
.571
.591
.567
.586
.605
Sample
size
854
8975
8787
8411
010
499
119
C.Other
PublicHousing
Fem
ale
.486
.527
.507
.486
.487
.463
.466
.456
.485
.497
Age
14.1
14.1
14.1
14.1
14.1
14.1
14.1
14.1
14.0
14.0
English2n
dlangu
age
.451
.368
.417
.419
.424
.425
.474
.486
.5.518
Sample
size
5,62
060
959
057
058
762
460
163
467
073
5
Note.—
Pan
elAreportstotalan
dan
nual
meansofselect
dem
ograp
hic
variab
lesforstuden
tsen
rolled
ingrad
e9in
theTDSB
andwhoresidein
the
Reg
entParkhousingproject.Pan
elBshowsthesame,
butforstuden
tswhoresidein
theRex
dalean
dLaw
rence
Heigh
tsprojects.In
pan
elC,“O
ther
PublicHousing”refersto
thesample
ofstuden
tswhoen
rolled
ingrad
e9in
theTDSB
intheyear(s)indicated
andwhoresidein
Toronto
publichousing
projectsother
than
those
men
tioned
above.
This content downloaded from 128.100.177.180 on May 31, 2020 12:08:01 PMAll use subject to University of Chicago Press Terms and Conditions (http://www.journals.uchicago.edu/t-and-c).
960 journal of political economy
All
therefore focus on October, when sessions were held each week and fallgrades were not yet available to determine exemption status.21
IV. Impact of Pathways on High School Achievementand Postsecondary Enrollment
A. Graphical Summary
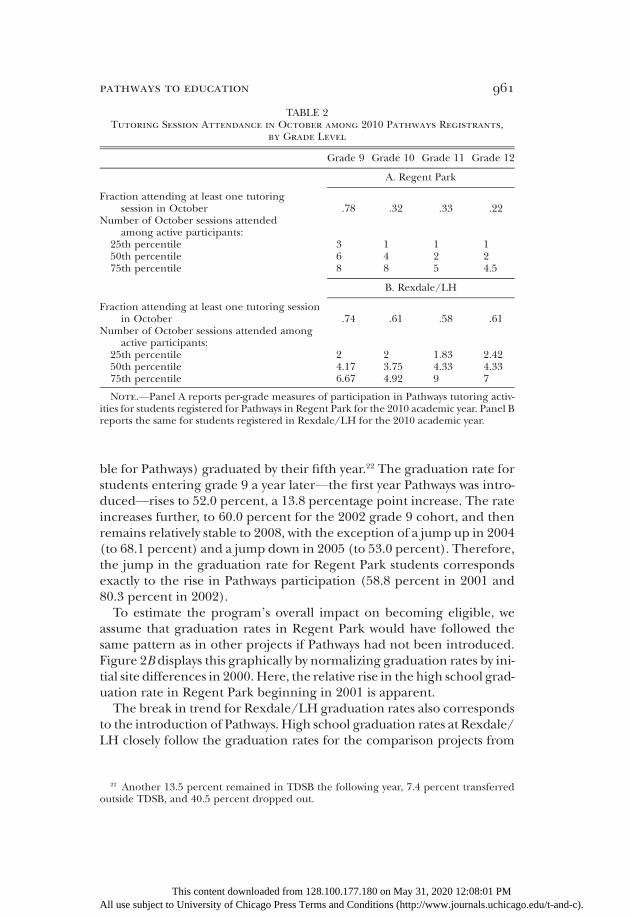
Figures 2A and 2B summarize our high school completion results graph-ically. Figure 2A plots the 5-year high school completion rate by cohort(year entered grade 9) separately for Regent Park, Rexdale/LH, andthe other Toronto public housing projects: 38.2 percent of students fromRegent Park who entered grade 9 in 2000 (and therefore were not eligi-
FIG. 1.—Pathways to Education registration rates for 2000–2008 grade 9 students fromRegent Park, Rexdale, Lawrence Heights, and other Toronto public housing projects. Thesample in this figure includes students from Toronto public housing residences (RegentPark, Rexdale or Lawrence Heights, or other public housing) who entered a TDSB highschool in grade 9 between the 2000–2001 and 2008–9 academic years. The figure indicatesthe fraction of this sample that ever registered in the Pathways program. Other publichousing refers to students who enrolled in grade 9 in the TDSB and who live in publichousing projects other than Regent Park, Rexdale, and Lawrence Heights.
21 SPSWs are provided with reports of student academic performance in late November,February, April, and the beginning of September (for any summer courses taken). On thebasis of whether their grades in core academic subjects (math, English, and science) areabove the prespecified cutoff, students are exempt from attending tutoring activities.
This content downloaded from 128.100.177.180 on May 31, 2020 12:08:01 PM use subject to University of Chicago Press Terms and Conditions (http://www.journals.uchicago.edu/t-and-c).
pathways to education 961
ble for Pathways) graduated by their fifth year.22 The graduation rate forstudents entering grade 9 a year later—the first year Pathways was intro-duced—rises to 52.0 percent, a 13.8 percentage point increase. The rateincreases further, to 60.0 percent for the 2002 grade 9 cohort, and thenremains relatively stable to 2008, with the exception of a jump up in 2004(to 68.1 percent) and a jump down in 2005 (to 53.0 percent). Therefore,the jump in the graduation rate for Regent Park students correspondsexactly to the rise in Pathways participation (58.8 percent in 2001 and80.3 percent in 2002).To estimate the program’s overall impact on becoming eligible, we
assume that graduation rates in Regent Park would have followed thesame pattern as in other projects if Pathways had not been introduced.Figure 2B displays this graphically by normalizing graduation rates by ini-tial site differences in 2000. Here, the relative rise in the high school grad-uation rate in Regent Park beginning in 2001 is apparent.The break in trend for Rexdale/LH graduation rates also corresponds
to the introduction of Pathways. High school graduation rates at Rexdale/LH closely follow the graduation rates for the comparison projects from
TABLE 2Tutoring Session Attendance in October among 2010 Pathways Registrants,
by Grade Level
Grade 9 Grade 10 Grade 11 Grade 12
A. Regent Park
Fraction attending at least one tutoringsession in October .78 .32 .33 .22
Number of October sessions attendedamong active participants:
25th percentile 3 1 1 150th percentile 6 4 2 275th percentile 8 8 5 4.5
B. Rexdale/LH
Fraction attending at least one tutoring sessionin October .74 .61 .58 .61
Number of October sessions attended amongactive participants:
25th percentile 2 2 1.83 2.4250th percentile 4.17 3.75 4.33 4.3375th percentile 6.67 4.92 9 7
22 Another 13.5 percent remained in TDSB thoutside TDSB, and 40.5 percent dropped out.
This content downloaded from 128.All use subject to University of Chicago Press Terms
e followin
100.177.18 and Cond
g year, 7.4
0 on May 3itions (http:
percent tr
1, 2020 12://www.journ
Note.—Panel A reports per-grade measures of participation in Pathways tutoring activ-ities for students registered for Pathways in Regent Park for the 2010 academic year. Panel Breports the same for students registered in Rexdale/LH for the 2010 academic year.
ansferred
08:01 PMals.uchicago.edu/t-and-c).
962 journal of political economy
All
2000 to 2006 and then jump from 49.0 percent to 64.6 percent in 2007,when the program was introduced. The graduation rate declines slightlyfor the 2008 cohort. This could, in part, be due to the decline in Pathways’participation for this group. The overall patterns are similar using collegeenrollment outcomes in figures 3A and 3B.
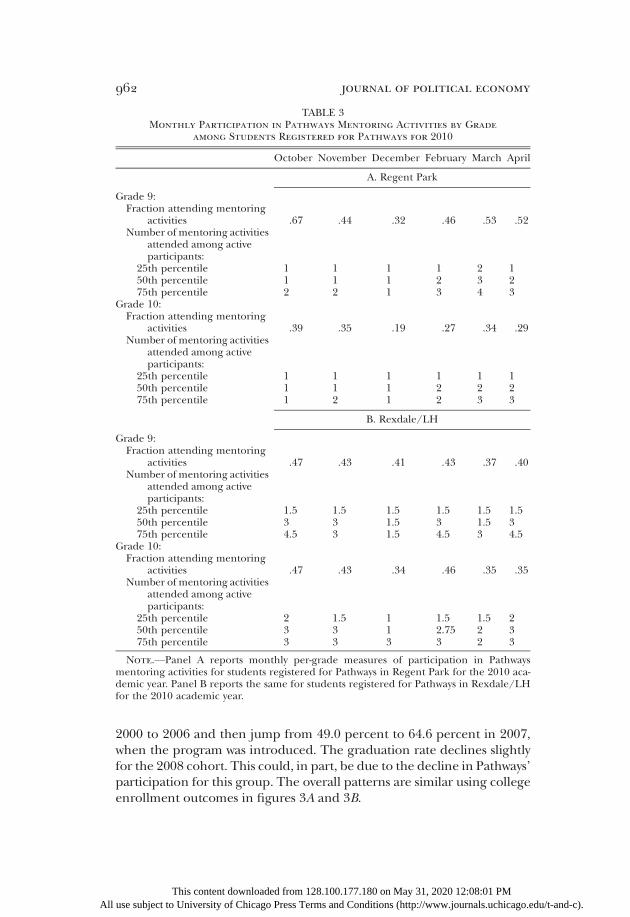
TABLE 3Monthly Participation in Pathways Mentoring Activities by Grade
among Students Registered for Pathways for 2010
October November December February March April
A. Regent Park
Grade 9:Fraction attending mentoring
activities .67 .44 .32 .46 .53 .52Number of mentoring activities
attended among activeparticipants:
25th percentile 1 1 1 1 2 150th percentile 1 1 1 2 3 275th percentile 2 2 1 3 4 3
Grade 10:Fraction attending mentoring
activities .39 .35 .19 .27 .34 .29Number of mentoring activities
attended among activeparticipants:
25th percentile 1 1 1 1 1 150th percentile 1 1 1 2 2 275th percentile 1 2 1 2 3 3
B. Rexdale/LH
Grade 9:Fraction attending mentoring
activities .47 .43 .41 .43 .37 .40Number of mentoring activities
attended among activeparticipants:
25th percentile 1.5 1.5 1.5 1.5 1.5 1.550th percentile 3 3 1.5 3 1.5 375th percentile 4.5 3 1.5 4.5 3 4.5
Grade 10:Fraction attending mentoring
activities .47 .43 .34 .46 .35 .35Number of mentoring activities
attended among activeparticipants:
25th percentile 2 1.5 1 1.5 1.5 250th percentile 3 3 1 2.75 2 375th percentile 3 3 3 3 2 3
This content downloade use subject to University of Chicago
d from 12 Press Term
8.100.177.18s and Cond
0 on May 31itions (http:/
, 2020 12:/www.journ
08:01 PMals.uch
Note.—Panel A reports monthly per-grade measures of participation in Pathwaysmentoring activities for students registered for Pathways in Regent Park for the 2010 aca-demic year. Panel B reports the same for students registered for Pathways in Rexdale/LHfor the 2010 academic year.
icago.edu/t-and-c).

FIG. 2.—Fraction graduated from high school by fifth year among 2000–2008 grade 9students from Pathways and non-Pathways housing projects. Panel A shows average 5-yearhigh school graduation rates for students living in Toronto public housing who enteredgrade 9 between the 2000–2001 and 2008–9 academic years. Panel B shows the same infor-mation except that the high school graduation rate for each group for the 2000 cohort wassubtracted from the actual rate for each cohort, leading to a baseline value of zero for allgroups in 2000.
This content downloaded from 128.100.177.180 on May 31, 2020 12:08:01 PMAll use subject to University of Chicago Press Terms and Conditions (http://www.journals.uchicago.edu/t-and-c).

All
FIG. 3.—Fraction enrolled in college or university by end of fifth year for 2000–2008grade 9 students from Pathways and non-Pathways Toronto public housing projects. Panel Ashows average postsecondary enrollment rates after 5 years since starting high school for stu-dents living in Toronto public housing who entered grade 9 between the 2000–2001 and2008–9 academic years. Panel B shows the same except that the postsecondary enrollmentrate for each group for the 2000 cohort was subtracted from the actual rate for each cohort,leading to a baseline value of zero for all groups in 2000.
This content downloaded from 128.100.177.180 on May 31, 2020 12:08:01 PM use subject to University of Chicago Press Terms and Conditions (http://www.journals.uchicago.edu/t-and-c).
pathways to education 965
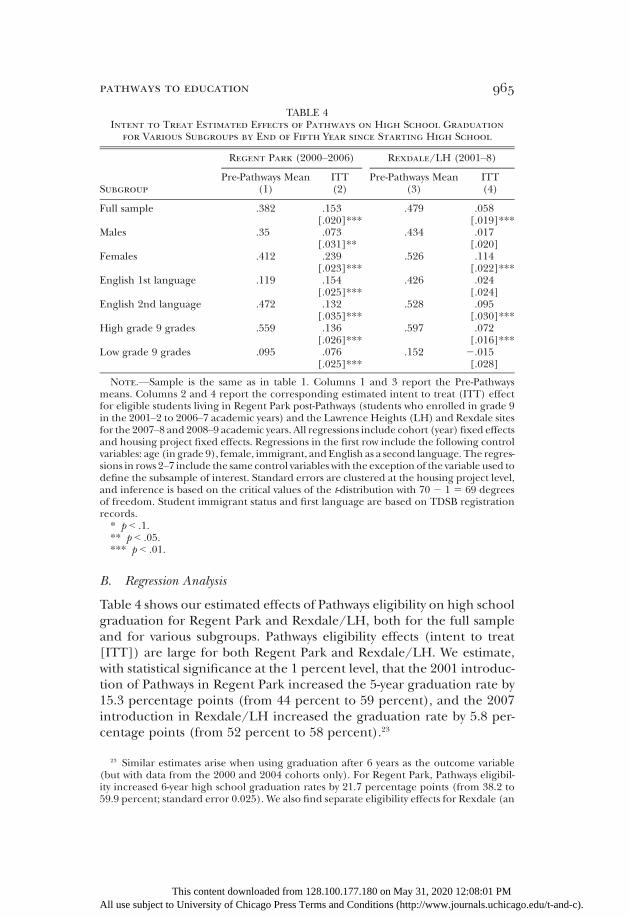
B. Regression Analysis
Table 4 shows our estimated effects of Pathways eligibility on high schoolgraduation for Regent Park and Rexdale/LH, both for the full sampleand for various subgroups. Pathways eligibility effects (intent to treat[ITT]) are large for both Regent Park and Rexdale/LH. We estimate,with statistical significance at the 1 percent level, that the 2001 introduc-tion of Pathways in Regent Park increased the 5-year graduation rate by15.3 percentage points (from 44 percent to 59 percent), and the 2007introduction in Rexdale/LH increased the graduation rate by 5.8 per-centage points (from 52 percent to 58 percent).23
TABLE 4Intent to Treat Estimated Effects of Pathways on High School Graduation
for Various Subgroups by End of Fifth Year since Starting High School
Regent Park (2000–2006) Rexdale/LH (2001–8)
Subgroup
Pre-Pathways Mean(1)
ITT(2)
Pre-Pathways Mean(3)
ITT(4)
Full sample .382 .153 .479 .058[.020]*** [.019]***
Males .35 .073 .434 .017[.031]** [.020]
Females .412 .239 .526 .114[.023]*** [.022]***
English 1st language .119 .154 .426 .024[.025]*** [.024]
English 2nd language .472 .132 .528 .095[.035]*** [.030]***
High grade 9 grades .559 .136 .597 .072[.026]*** [.016]***
Low grade 9 grades .095 .076 .152 2.015[.025]*** [.028]
23 Similar estimates aris(but with data from the 2ity increased 6-year high s59.9 percent; standard err
This contenAll use subject to University
e when using graduation after000 and 2004 cohorts only). Forchool graduation rates by 21.7 por 0.025). We also find separate e
t downloaded from 128.100.177.1 of Chicago Press Terms and Cond
6 years as the outcomRegent Park, Pathwercentage points (frligibility effects for R
80 on May 31, 2020 12itions (http://www.jou
Note.—Sample is the same as in table 1. Columns 1 and 3 report the Pre-Pathwaysmeans. Columns 2 and 4 report the corresponding estimated intent to treat (ITT) effectfor eligible students living in Regent Park post-Pathways (students who enrolled in grade 9in the 2001–2 to 2006–7 academic years) and the Lawrence Heights (LH) and Rexdale sitesfor the 2007–8 and 2008–9 academic years. All regressions include cohort (year) fixed effectsand housing project fixed effects. Regressions in the first row include the following controlvariables: age (in grade 9), female, immigrant, andEnglish as a second language. The regres-sions in rows 2–7 include the same control variables with the exception of the variable used todefine the subsample of interest. Standard errors are clustered at the housing project level,and inference is based on the critical values of the t-distribution with 70 2 1 5 69 degreesof freedom. Student immigrant status and first language are based on TDSB registrationrecords.* p < .1.** p < .05.*** p < .01.
e variableays eligibil-om 38.2 toexdale (an
:08:01 PMrnals.uchicago.edu/t-and-c).
966 journal of political economy
All
Table 4 also shows how these effects differ by student background. Path-ways affects females significantly more than males, though both gendergroups benefit. Our estimated Pathways impacts are similar by whetherEnglish is spoken at home. We also compare results for high- and low-achieving grade 9 students. While this variable is likely endogenous toPathways eligibility (as we provide evidence for in table 6 below), the biasis downward for both subgroups. The results help shed light on possibledynamic complementarities.Defining Pathways participation as ever signing up for the program,
participation effects are 20–25 percent larger than eligibility effects. On-line appendix table 2 shows these treatment on the treated (TOT) esti-mates using Pathways eligibility as an instrument for Pathways participa-tion and the same difference-in-differences methodology as above. Forthe TOTeffects to be valid, we must assume that nonparticipants are un-affected by Pathways and that no one is made worse off. Under these as-sumptions, Pathways led participants to a 19.1 and 7.5 percentage pointincrease in the 5-year high school graduation rates for Regent Park andRexdale/LH, respectively. Online appendix table 2 also shows participa-tion effects with participation defined as signing up for Pathways and at-tending at least onementoring or tutoring session in grade 9 (only for the2003, 2007, and 2008 cohorts for which we have data). Here the TOT ef-fects are larger, especially for Rexdale/LH (a 9.5 percentage point treat-ment effect).Pathways not only aims to help high-risk students graduate but also en-
courages postsecondary education. This is done by creating a collegescholarship for each participant of up to $4,000, college application assis-tance and fee waivers, and organized campus visits. Additionally, the pro-gram promotes college implicitly by helping improve grades (and eligi-bility) and through regular advising. Table 5 looks at postsecondaryoutcomes for Regent Park (panel A) and Rexdale/LH (panel B).24 ForRegent Park, we estimate very large impacts of Pathways eligibility onpostsecondary enrollment. Application rates increase by 16.5 percentagepoints, up from amean of 35.8 percent in Regent Park in 2000, leading toa 9.4 percentage point increase in the 2-year college enrollment amongPathways-eligible cohorts and a 9.2 percentage point increase in univer-sity program enrollment by the end of their fifth year. Similar to the grad-uation findings, impacts on postsecondary enrollment are significantlylarger among females than males, though significant for both. For fe-males, Pathways in Regent Park more than doubles college enrollment.
24 Colleges in Canada are generally 2-year colleges focusing mainly on vocational pro-grams. Universities offer 4-year programs that are more academic.
8.2 percentage point increase in high school graduation from a pre-Pathways mean of45.4 percent) and Lawrence Heights (a 4.5 percentage point increase from a mean of49.3 percent).
This content downloaded from 128.100.177.180 on May 31, 2020 12:08:01 PM use subject to University of Chicago Press Terms and Conditions (http://www.journals.uchicago.edu/t-and-c).
pathways to education 967
Moreover, Regent Park Pathways effects on postsecondary enrollmentare large for both English and non-English home-speaking students andhigher for students not initially failing their grade 9 English or mathcourses.Panel B of table 5 shows the postsecondary program eligibility impacts
for the new Pathways sites introduced in 2007. College and university ap-plication rates rise by about 9 percentage points (up from 45.0 percent)and 2-year college enrollment increases by 6.4 percentage points, withthe impact concentrated among boys (a more than doubling of enroll-ment, from 10.4 to 22.3 percentage points). The estimated change in4-year university enrollment is not statistically significant.Finally, we estimate Pathways eligibility effects on some intermediate
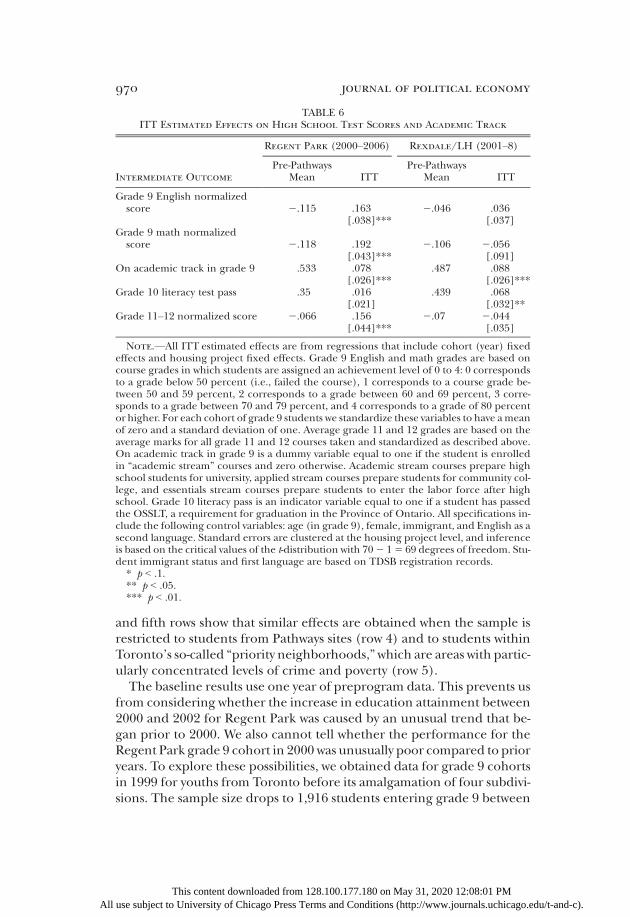
high school outcomes to explore possiblemechanisms by which Pathwaysimproves high school completion. Table 6 shows program eligibility ef-fects on grade 9 math and English grades, grade 9 and 10 academic trackstatus, OSSLT pass rates, and standardized grade 11–12 average grades.All four intermediate outcomes are significantly affected by Pathways’ in-troduction, for either Regent Park or Rexdale/LH or both.
C. Alternative Comparison Groups
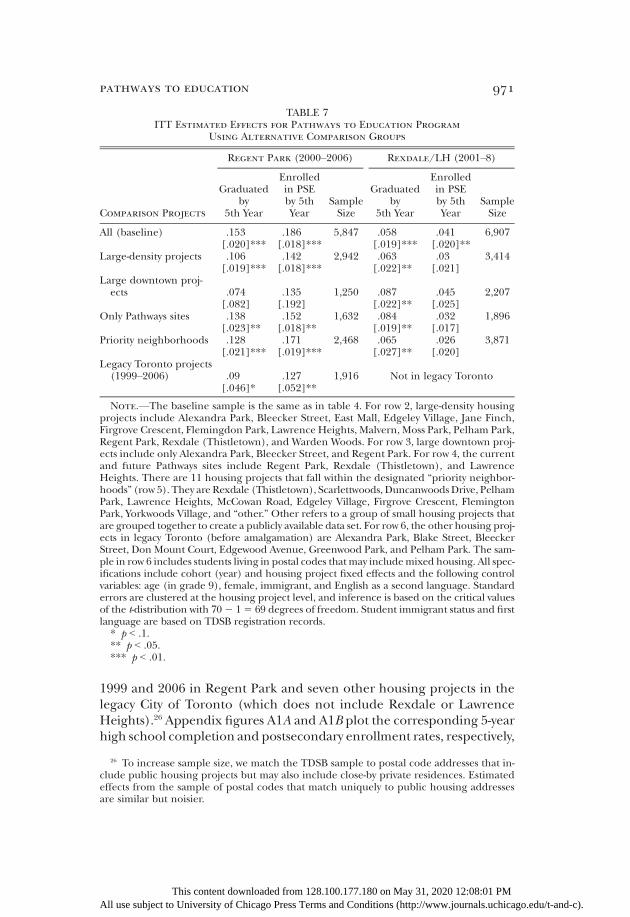
As a robustness check we consider alternative comparison groups to ourbaseline sample since some housing projects in our baseline sample areconsiderably smaller than Pathways projects and are located in differentregions of Toronto. Although the application procedure is centralizedand generic for all projects, applicants can specify region preferences orproject-specific preferences (the default is an applicant’s current censussubdivision). Table 7 shows results from the same difference-in-differencesmethodology as in our baseline results, but with different comparisongroups.The first row of table 7 shows the baseline results for Pathways eligibility
on high school attainment and postsecondary enrollment. The secondrow uses only the 11 largest housing projects for the comparison group,in addition to Regent and Rexdale/LH, which are all similar in size andnotoriety.25 Although the sample size drops by almost one-half, the effectsremain large: about a 10.6 percentage point increase in high school grad-uation and a 14.2 percentage point increase in postsecondary enroll-ment. The third row uses only the two largest downtown projects in thesame census subdivision as Regent Park.Here the point estimate for grad-uation is a 7.4 percentage point increase (standard error 8.2). The fourth
25 The 11 large projects are Alexandra Park, Bleecker Street, East Mall, Edgeley Village,Jane Finch, Firgrove Crescent, Flemingdon Park, Lawrence Heights, Malvern, Moss Park,Pelham Park, Regent Park, Rexdale (Thistletown), and Warden Woods.
This content downloaded from 128.100.177.180 on May 31, 2020 12:08:01 PMAll use subject to University of Chicago Press Terms and Conditions (http://www.journals.uchicago.edu/t-and-c).
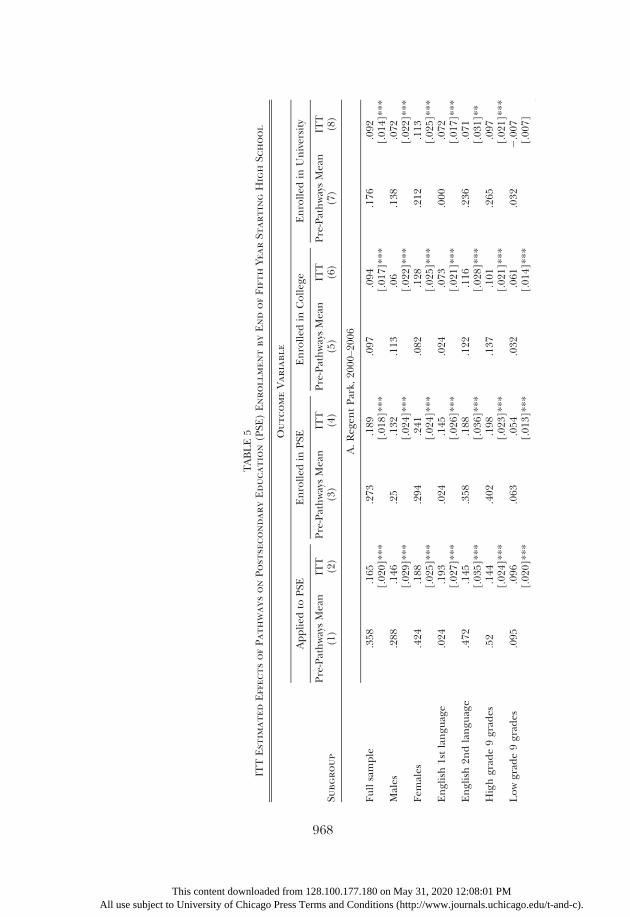
TABLE5
ITTEstimatedEffectsofPathwaysonPostsecondaryEducation(PSE)EnrollmentbyEndofFifthYearStartingHighSchool
OutcomeVariable
Applied
toPSE
Enrolled
inPSE
Enrolled
inColleg
eEnrolled
inUniversity
Subgroup
Pre-PathwaysMean
(1)
ITT
(2)
Pre-PathwaysMean
(3)
ITT
(4)
Pre-PathwaysMean
(5)
ITT
(6)
Pre-PathwaysMean
(7)
ITT
(8)
A.Reg
entPark,
2000
–20
06
Fullsample
.358
.165
.273
.189
.097
.094
.176
.092
[.02
0]***
[.01
8]***
[.01
7]***
[.01
4]***
Males
.288
.146
.25
.132
.113
.06
.138
.072
[.02
9]***
[.02
4]***
[.02
2]***
[.02
2]***
Fem
ales
.424
.188
.294
.241
.082
.128
.212
.113
[.02
5]***
[.02
4]***
[.02
5]***
[.02
5]***
English1stlangu
age
.024
.193
.024
.145
.024
.073
.000
.072
[.02
7]***
[.02
6]***
[.02
1]***
[.01
7]***
English2n
dlangu
age
.472
.145
.358
.188
.122
.116
.236
.071
[.03
5]***
[.03
6]***
[.02
8]***
[.03
1]**
Highgrad
e9grad
es.52
.144
.402
.198
.137
.101
.265
.097
[.02
4]***
[.02
3]***
[.02
1]***
[.02
1]***
Lowgrad
e9grad
es.095
.096
.063
.054
.032
.061
.032
2.007
[.02
0]***
[.01
3]***
[.01
4]***
[.00
7]
968
This content downloaded from 128.100.177.180 on May 31, 2020 12:08:01 PMAll use subject to University of Chicago Press Terms and Conditions (http://www.journals.uchicago.edu/t-and-c).

TABLE5(C
ONTIN
UED)
OutcomeVariable
Applied
toPSE
Enrolled
inPSE
Enrolled
inColleg
eEnrolled
inUniversity
Subgroup
Pre-PathwaysMean
(1)
ITT
(2)
Pre-PathwaysMean
(3)
ITT
(4)
Pre-PathwaysMean
(5)
ITT
(6)
Pre-PathwaysMean
(7)
ITT
(8)
B.Rex
dale/
LH,20
01–8
Fullsample
.450
.088
.355
.041
.126
.064
.229
2.023
[.01
5]***
[.02
0]**
[.01
8]***
[.01
8]Males
.344
.124
.265
.102
.104
.119
.161
2.018
[.02
2]***
[.03
5]***
[.01
6]***
[.02
9]Fem
ales
.560
.056
.448
2.030
.149
2.005
.299
2.025
[.02
2]**
[.01
9][.02
4][.02
8]English1stlangu
age
.366
.045
.287
.053
.113
.078
.174
2.025
[.02
4]*
[.03
1]*
[.06
0][.03
5]English2n
dlangu
age
.528
.131
.418
.048
.138
.053
.280
2.006
[.02
0]***
[.01
8]**
[.03
2]*
[.04
3]Highgrad
e9grad
es.572
.086
.460
.030
.154
.067
.306
2.036
[.01
8]***
[.02
6][.01
7]***
[.02
8]Lowgrad
e9grad
es.110
.053
.062
.043
.048
.056
.014
2.013
[.07
8][.05
1][.05
6][.00
8]
Note.—
Sample
isallstuden
tswhoen
rolled
ingrad
e9in
aTDSB
schoolbetween20
00an
d20
06.A
pplied
toPSE
isadummyvariab
leeq
ual
tooneifa
studen
tap
plied
toat
leastonePSE
institutionin
theprovince
ofOntarioin
hisorher
final
year
ofhighschoolan
deq
ual
tozero
otherwise.
Enrolled
inPSE
isadummyvariab
leeq
ual
tooneifastuden
tacceptedan
offer
ofad
missionto
a(2-year)
colleg
eor(4-year)
universityin
Ontariouponco
mpleting
highschoolandzero
otherwise.Enrolled
inco
lleg
e(u
niversity)isadummyvariab
leeq
ualto
oneifastuden
tacceptedan
offer
ofad
missionfrom
a2-year
communityco
lleg
e(u
niversity)in
Ontarioan
dzero
otherwise.
Columns1,
3,5,
and7report
thepre-PathwaysmeansforReg
entPark(studen
tswho
enrolled
ingrad
e9in
the20
00–20
01acad
emic
year).Columns2,
4,6,
and8reporttheco
rrespondingIT
TeffectsforeligibilityforPathways.Allregres-
sionsincludeco
hort
(year)
fixe
deffectsan
dhousingproject
fixe
deffects.Reg
ressionsin
thetoprowincludethefollowingco
ntrolvariab
les:age(in
grad
e9),female,
immigrant,an
dEnglishas
aseco
ndlangu
age.
Theregressionsin
rows2–
7includethesameco
ntrolvariab
leswiththeex
ceptionof
thevariab
leusedto
defi
nethesubsample
ofinterest.Stan
darderrors
areclustered
atthehousingproject
level,an
dinference
isbased
onthecritical
values
ofthet-d
istributionwith70
215
69deg
rees
offreedom.Studen
tim
migrantstatusan
dfirstlangu
agearebased
onTDSB
registrationreco
rds.
*p<.1.
**p<.05.
***p<.01.
969
This content downloaded from 128.100.177.180 on May 31, 2020 12:08:01 PMAll use subject to University of Chicago Press Terms and Conditions (http://www.journals.uchicago.edu/t-and-c).
970 journal of political economy
All
and fifth rows show that similar effects are obtained when the sample isrestricted to students from Pathways sites (row 4) and to students withinToronto’s so-called “priority neighborhoods,”which are areas with partic-ularly concentrated levels of crime and poverty (row 5).The baseline results use one year of preprogram data. This prevents us
from considering whether the increase in education attainment between2000 and 2002 for Regent Park was caused by an unusual trend that be-gan prior to 2000. We also cannot tell whether the performance for theRegent Park grade 9 cohort in 2000 was unusually poor compared to prioryears. To explore these possibilities, we obtained data for grade 9 cohortsin 1999 for youths from Toronto before its amalgamation of four subdivi-sions. The sample size drops to 1,916 students entering grade 9 between
TABLE 6ITT Estimated Effects on High School Test Scores and Academic Track
Regent Park (2000–2006) Rexdale/LH (2001–8)
Intermediate Outcome
Pre-PathwaysMean ITT
Pre-PathwaysMean ITT
Grade 9 English normalizedscore 2.115 .163 2.046 .036
[.038]*** [.037]Grade 9 math normalizedscore 2.118 .192 2.106 2.056
[.043]*** [.091]On academic track in grade 9 .533 .078 .487 .088
[.026]*** [.026]***Grade 10 literacy test pass .35 .016 .439 .068
[.021] [.032]**Grade 11–12 normalized score 2.066 .156 2.07 2.044
[.044]*** [.035]
This content downlo use subject to University of Chica
aded from 128.100.177.180 on Mgo Press Terms and Conditions
ay 31, 2020 12:08(http://www.journa
Note.—All ITT estimated effects are from regressions that include cohort (year) fixedeffects and housing project fixed effects. Grade 9 English and math grades are based oncourse grades in which students are assigned an achievement level of 0 to 4: 0 correspondsto a grade below 50 percent (i.e., failed the course), 1 corresponds to a course grade be-tween 50 and 59 percent, 2 corresponds to a grade between 60 and 69 percent, 3 corre-sponds to a grade between 70 and 79 percent, and 4 corresponds to a grade of 80 percentor higher. For each cohort of grade 9 students we standardize these variables to have ameanof zero and a standard deviation of one. Average grade 11 and 12 grades are based on theaverage marks for all grade 11 and 12 courses taken and standardized as described above.On academic track in grade 9 is a dummy variable equal to one if the student is enrolledin “academic stream” courses and zero otherwise. Academic stream courses prepare highschool students for university, applied stream courses prepare students for community col-lege, and essentials stream courses prepare students to enter the labor force after highschool. Grade 10 literacy pass is an indicator variable equal to one if a student has passedthe OSSLT, a requirement for graduation in the Province of Ontario. All specifications in-clude the following control variables: age (in grade 9), female, immigrant, and English as asecond language. Standard errors are clustered at the housing project level, and inferenceis based on the critical values of the t-distribution with 702 15 69 degrees of freedom. Stu-dent immigrant status and first language are based on TDSB registration records.* p < .1.** p < .05.*** p < .01.
:01 PMls.uchicago.edu/t-and-c).
pathways to education 971
1999 and 2006 in Regent Park and seven other housing projects in thelegacy City of Toronto (which does not include Rexdale or LawrenceHeights).26 Appendix figures A1A and A1B plot the corresponding 5-yearhigh school completion and postsecondary enrollment rates, respectively,
TABLE 7ITT Estimated Effects for Pathways to Education Program
Using Alternative Comparison Groups
Regent Park (2000–2006) Rexdale/LH (2001–8)
Comparison Projects
Graduatedby
5th Year
Enrolledin PSEby 5thYear
SampleSize
Graduatedby
5th Year
Enrolledin PSEby 5thYear
SampleSize
All (baseline) .153 .186 5,847 .058 .041 6,907[.020]*** [.018]*** [.019]*** [.020]**
Large-density projects .106 .142 2,942 .063 .03 3,414[.019]*** [.018]*** [.022]** [.021]
Large downtown proj-ects .074 .135 1,250 .087 .045 2,207
[.082] [.192] [.022]** [.025]Only Pathways sites .138 .152 1,632 .084 .032 1,896
[.023]** [.018]** [.019]** [.017]Priority neighborhoods .128 .171 2,468 .065 .026 3,871
[.021]*** [.019]*** [.027]** [.020]Legacy Toronto projects(1999–2006) .09 .127 1,916 Not in legacy Toronto
[.046]* [.052]**
26 To increase sample sclude public housing proeffects from the sample oare similar but noisier.
This conteAll use subject to Universit
ize, we match the TDSB samplejects but may also include close-f postal codes that match uniqu
nt downloaded from 128.100.177.1y of Chicago Press Terms and Con
to postal codby private reely to public
80 on May 31ditions (http://
e addressessidences. Eshousing ad
, 2020 12:08www.journa
Note.—The baseline sample is the same as in table 4. For row 2, large-density housingprojects include Alexandra Park, Bleecker Street, East Mall, Edgeley Village, Jane Finch,Firgrove Crescent, Flemingdon Park, Lawrence Heights, Malvern, Moss Park, Pelham Park,Regent Park, Rexdale (Thistletown), and Warden Woods. For row 3, large downtown proj-ects include only Alexandra Park, Bleecker Street, and Regent Park. For row 4, the currentand future Pathways sites include Regent Park, Rexdale (Thistletown), and LawrenceHeights. There are 11 housing projects that fall within the designated “priority neighbor-hoods” (row 5). They are Rexdale (Thistletown), Scarlettwoods, DuncanwoodsDrive, PelhamPark, Lawrence Heights, McCowan Road, Edgeley Village, Firgrove Crescent, FlemingtonPark, Yorkwoods Village, and “other.” Other refers to a group of small housing projects thatare grouped together to create a publicly available data set. For row 6, the other housing proj-ects in legacy Toronto (before amalgamation) are Alexandra Park, Blake Street, BleeckerStreet, Don Mount Court, Edgewood Avenue, Greenwood Park, and Pelham Park. The sam-ple in row 6 includes students living in postal codes thatmay includemixed housing. All spec-ifications include cohort (year) and housing project fixed effects and the following controlvariables: age (in grade 9), female, immigrant, and English as a second language. Standarderrors are clustered at the housing project level, and inference is based on the critical valuesof the t-distribution with 702 15 69 degrees of freedom. Student immigrant status and firstlanguage are based on TDSB registration records.* p < .1.** p < .05.*** p < .01.
that in-timateddresses
:01 PMls.uchicago.edu/t-and-c).
972 journal of political economy
All
normalized around the group means between 1999 and 2000. The 1999Regent Park completion and enrollment rates are not unusually loweror higher than the 2000 rates. The last row of table 7 shows the corre-sponding estimated Pathways eligibility effect on high school graduationof 9.0 percentage points, though the estimate is less precise than the base-line estimate. The estimated impact on postsecondary enrollment is 12.7percentage points. We conclude that the large estimated gains to educa-tion attainment from the Pathways program are relatively insensitive toa wide range of alternative (and smaller) samples.27
V. Discussion of Mechanisms through WhichPathways May Be Working
Results from the previous section suggest that Pathways significantly im-proved key long-term student outcomes. Using mediation analysis, staffinterviews, and earlier research, this section discusses possible mecha-nisms underlying these improvements. Understanding themmore couldhelp contain costs, lead to better theories of change, and increase effec-tiveness.
A. Mediation Analysis
We begin by presenting amediation analysis (Heckman and Pinto 2015).The aim is to determine the extent to which the estimated increase inhigh school graduation and postsecondary enrollment rates, attributedto eligibility for Pathways, is due to improvements in intermediate out-comes. Our intermediate outcomes (potential mediators), indexed byj, are a student’s standardized course grade in grade 9math, standardizedcourse grade in grade 9 English, standardized grade point average (GPA)across all courses in grades 11 and 12, likelihood of taking academic track(university preparation) courses, and likelihood of passing the OSSLT.Additional details on the mediation analysis are provided in online ap-pendix E.Following Heckman et al. (2013) and Heckman and Pinto (2015), we
assume that long-term outcomes (yi) are a linear function of the interme-diate outcomes (mediators) (vi
j) and student demographic characteris-
27 As a test for spillovers, we ran a difference-in-differences regression comparing theachievement of non-Pathways-eligible public housing students for those who attendedthe three schools with a large number of Pathways students to the achievement of thosewho attended other schools. Estimates for the effect of Pathways on noneligible studentssuggest a potentially large spillover effect (a 6.2 percentage point increase in high schoolcompletion), although standard errors are too high for causal inference (the standard er-ror is 7.3 percentage points). Further, given that less than 20 percent of students in thethree schools are Pathways students, large spillover effects seem unlikely. Overall, we con-clude that evidence of spillover effects is inconclusive.
This content downloaded from 128.100.177.180 on May 31, 2020 12:08:01 PM use subject to University of Chicago Press Terms and Conditions (http://www.journals.uchicago.edu/t-and-c).
pathways to education 973
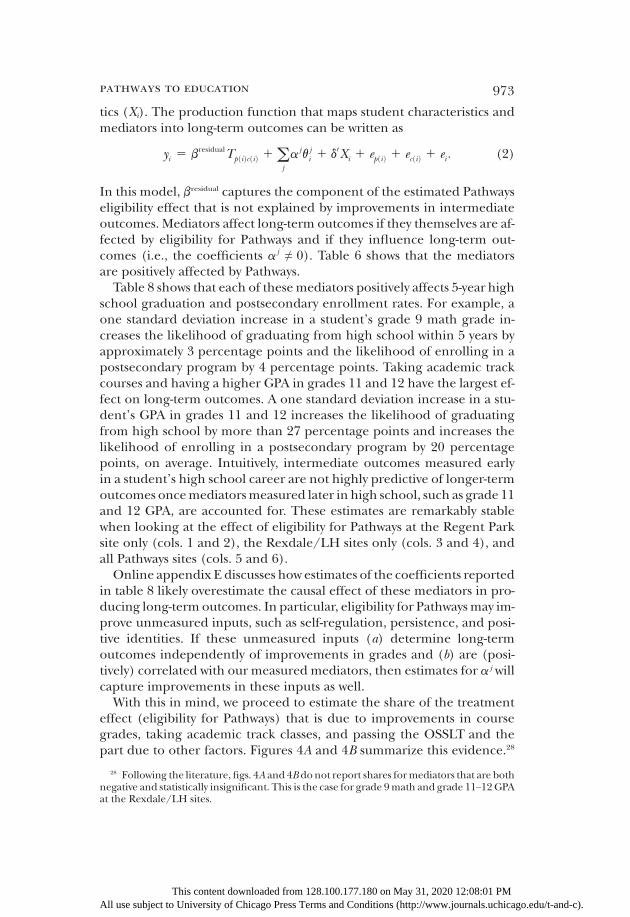
tics (Xi). The production function that maps student characteristics andmediators into long-term outcomes can be written as
yi 5 bresidualTp ið Þc ið Þ 1oj
a jv ji 1 d0Xi 1 ep ið Þ 1 ec ið Þ 1 ei: (2)
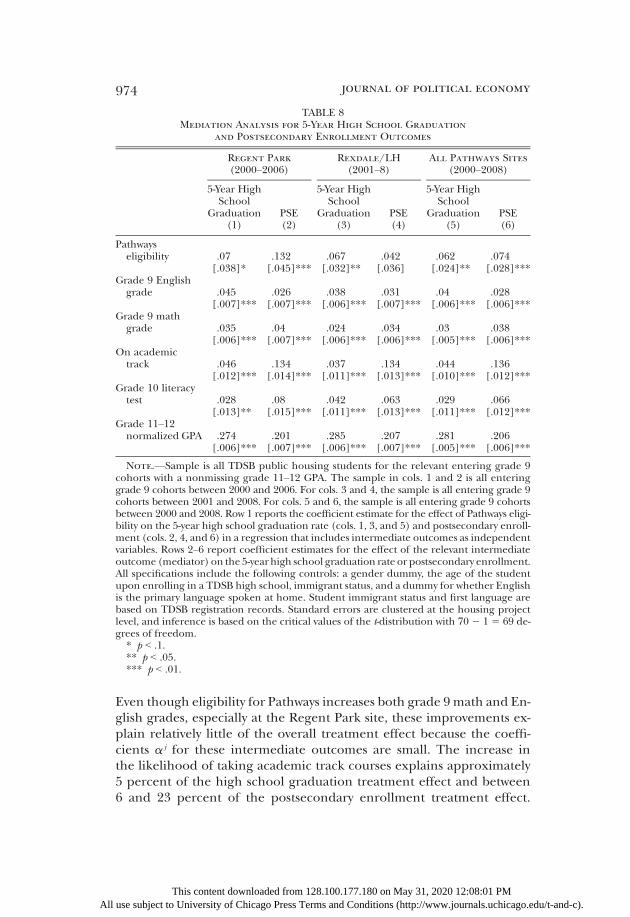
In this model, bresidual captures the component of the estimated Pathwayseligibility effect that is not explained by improvements in intermediateoutcomes. Mediators affect long-term outcomes if they themselves are af-fected by eligibility for Pathways and if they influence long-term out-comes (i.e., the coefficients a j ≠ 0). Table 6 shows that the mediatorsare positively affected by Pathways.Table 8 shows that each of thesemediators positively affects 5-year high
school graduation and postsecondary enrollment rates. For example, aone standard deviation increase in a student’s grade 9 math grade in-creases the likelihood of graduating from high school within 5 years byapproximately 3 percentage points and the likelihood of enrolling in apostsecondary program by 4 percentage points. Taking academic trackcourses and having a higher GPA in grades 11 and 12 have the largest ef-fect on long-term outcomes. A one standard deviation increase in a stu-dent’s GPA in grades 11 and 12 increases the likelihood of graduatingfrom high school by more than 27 percentage points and increases thelikelihood of enrolling in a postsecondary program by 20 percentagepoints, on average. Intuitively, intermediate outcomes measured earlyin a student’s high school career are not highly predictive of longer-termoutcomes oncemediatorsmeasured later in high school, such as grade 11and 12 GPA, are accounted for. These estimates are remarkably stablewhen looking at the effect of eligibility for Pathways at the Regent Parksite only (cols. 1 and 2), the Rexdale/LH sites only (cols. 3 and 4), andall Pathways sites (cols. 5 and 6).Online appendix Ediscusses how estimates of the coefficients reported
in table 8 likely overestimate the causal effect of these mediators in pro-ducing long-term outcomes. In particular, eligibility for Pathwaysmay im-prove unmeasured inputs, such as self-regulation, persistence, and posi-tive identities. If these unmeasured inputs (a) determine long-termoutcomes independently of improvements in grades and (b) are (posi-tively) correlated with our measured mediators, then estimates for a j willcapture improvements in these inputs as well.With this in mind, we proceed to estimate the share of the treatment
effect (eligibility for Pathways) that is due to improvements in coursegrades, taking academic track classes, and passing the OSSLT and thepart due to other factors. Figures 4A and 4B summarize this evidence.28
28 Following the literature, figs. 4A and 4B donot report shares formediators that are bothnegative and statistically insignificant. This is the case for grade 9math and grade 11–12GPAat the Rexdale/LH sites.
This content downloaded from 128.100.177.180 on May 31, 2020 12:08:01 PMAll use subject to University of Chicago Press Terms and Conditions (http://www.journals.uchicago.edu/t-and-c).
974 journal of political economy
All
Even though eligibility for Pathways increases both grade 9math and En-glish grades, especially at the Regent Park site, these improvements ex-plain relatively little of the overall treatment effect because the coeffi-cients a j for these intermediate outcomes are small. The increase inthe likelihood of taking academic track courses explains approximately5 percent of the high school graduation treatment effect and between6 and 23 percent of the postsecondary enrollment treatment effect.
TABLE 8Mediation Analysis for 5-Year High School Graduation
and Postsecondary Enrollment Outcomes
Regent Park
(2000–2006)Rexdale/LH(2001–8)
All Pathways Sites
(2000–2008)
5-Year HighSchool
Graduation(1)
PSE(2)
5-Year HighSchool
Graduation(3)
PSE(4)
5-Year HighSchool
Graduation(5)
PSE(6)
Pathwayseligibility .07 .132 .067 .042 .062 .074
[.038]* [.045]*** [.032]** [.036] [.024]** [.028]***Grade 9 Englishgrade .045 .026 .038 .031 .04 .028
[.007]*** [.007]*** [.006]*** [.007]*** [.006]*** [.006]***Grade 9 mathgrade .035 .04 .024 .034 .03 .038
[.006]*** [.007]*** [.006]*** [.006]*** [.005]*** [.006]***On academictrack .046 .134 .037 .134 .044 .136
[.012]*** [.014]*** [.011]*** [.013]*** [.010]*** [.012]***Grade 10 literacytest .028 .08 .042 .063 .029 .066
[.013]** [.015]*** [.011]*** [.013]*** [.011]*** [.012]***Grade 11–12normalized GPA .274 .201 .285 .207 .281 .206
[.006]*** [.007]*** [.006]*** [.007]*** [.005]*** [.006]***
This co use subject to Univer
ntent downloaded from 12sity of Chicago Press Ter
8.100.177.180 on May 31ms and Conditions (http://
, 2020 12:08:www.journals
Note.—Sample is all TDSB public housing students for the relevant entering grade 9cohorts with a nonmissing grade 11–12 GPA. The sample in cols. 1 and 2 is all enteringgrade 9 cohorts between 2000 and 2006. For cols. 3 and 4, the sample is all entering grade 9cohorts between 2001 and 2008. For cols. 5 and 6, the sample is all entering grade 9 cohortsbetween 2000 and 2008. Row 1 reports the coefficient estimate for the effect of Pathways eligi-bility on the 5-year high school graduation rate (cols. 1, 3, and 5) and postsecondary enroll-ment (cols. 2, 4, and 6) in a regression that includes intermediate outcomes as independentvariables. Rows 2–6 report coefficient estimates for the effect of the relevant intermediateoutcome (mediator) on the 5-yearhigh school graduation rate or postsecondary enrollment.All specifications include the following controls: a gender dummy, the age of the studentupon enrolling in a TDSB high school, immigrant status, and a dummy for whether Englishis the primary language spoken at home. Student immigrant status and first language arebased on TDSB registration records. Standard errors are clustered at the housing projectlevel, and inference is based on the critical values of the t-distribution with 70 2 1 5 69 de-grees of freedom.* p < .1.** p < .05.*** p < .01.
01 PM.uchicago.edu/t-and-c).
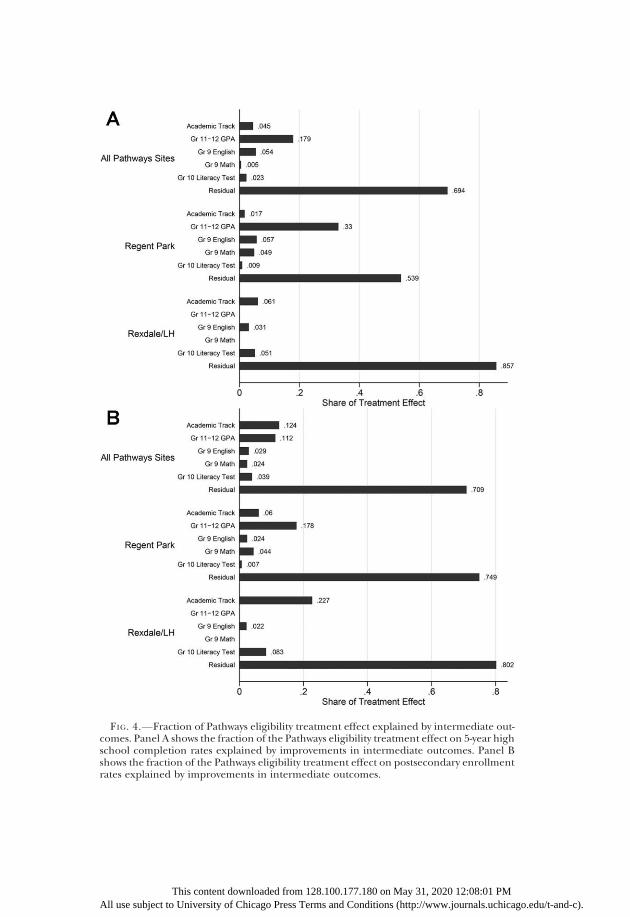
FIG. 4.—Fraction of Pathways eligibility treatment effect explained by intermediate out-comes. Panel A shows the fraction of the Pathways eligibility treatment effect on 5-year highschool completion rates explained by improvements in intermediate outcomes. Panel Bshows the fraction of the Pathways eligibility treatment effect on postsecondary enrollmentrates explained by improvements in intermediate outcomes.
This content downloaded from 128.100.177.180 on May 31, 2020 12:08:01 PMAll use subject to University of Chicago Press Terms and Conditions (http://www.journals.uchicago.edu/t-and-c).
976 journal of political economy
All
Not surprisingly, taking academic track courses has more explanatorypower for the postsecondary enrollment outcome (table 8, row 4). Highergrade 11 and 12 grades explain up to 20 percent of the estimated treat-ment effect at the Regent Park site, with more explanatory power for highschool graduation than for postsecondary enrollment. In unreported re-sults, we also find that improvements in course grades and increased like-lihood of taking academic track courses explain a large fraction of thePathways treatment effect on (4-year) university enrollment. In contrast,these intermediate academic outcomes are less important in explainingthe increase in (2-year) college enrollment.Across all Pathways sites, the unexplained portion of the estimated ef-
fect of Pathways is at least 55 percent for both long-term outcomes. Aver-aging across the Regent Park and Rexdale/LH sites, 70 percent of theestimated treatment effect for both high school graduation and post-secondary enrollment is unexplained by improvements in course gradesand the increased likelihood of taking academic courses (top panel offigs. 4A and 4B). This is consistent with nonacademic components of theprogram—such as the one-on-one meeting with SPSWs, assistance withpostsecondary and jobapplications, andgroupmentoring activities—playinga key role in improving student outcomes.
B. Staff Interviews
The staff we spoke with did not attribute the program’s success to any onecomponent.29 Many of them emphasized the importance of operatingwithin the housing project community as an advantage for establishingstrong ties among residents.One SPSW, for example, remarked that “Path-ways has become just something you do if you live in Regent Park andyou’re going to high school.”Several staff members feel that Pathways plays a paternalistic role, pro-
viding support and encouragement to students not receiving enough athome. One staff member said,
29 Onlin
use subject
Our approach is just about “you know what? I see you, I hearyou, I love you.” Maybe it’s not the same kind of love you getfrom your parent but I do love you because I’m seeing you yearafter year for 4, 5, 6, sometimes 7 years. We have kids in this pro-gram whose primary relationship could be an SPSWor could bea mentor. Could be a tutor who is a volunteer. That’s the kindof basic technology that we’re using here that seems to workwhich is centering that kid in all her complexity and saying,“it’s going to be OK—you have the resilience to do it.”
e app. C presents more detailed discussions with Pathways staff.
This content downloaded from 128.100.177.180 on May 31, 2020 12:08:01 PMto University of Chicago Press Terms and Conditions (http://www.journals.uchicago.edu/t-and-c).

pathways to education 977
Fostering positive interactions with fellow students was also mentionedas a way through which Pathways develops more mature social identities:“I watched students lead completely closed off, non-successful, zero self-esteem, to all of a sudden having peers that they could identify with, theycould be themselves with. I saw them smiling, laughing, talking, earningcredits, working with teachers. So for me it was a really great reminderthat the school system really fails a lot of students and how well those stu-dents can do with a little extra attention and positive space, and a reallysafe place to go to school.”One clear consensus that did emerge concerns the importance of fi-
nancial incentives for encouraging participation. Staff mentioned thatbus tickets, in particular, get students to regularly meet with SPSWs. Inturn, SPSWs remind students to regularly utilize the program’s otherservices: “Students know us as mostly helping them with bus tickets, butthen all the other things just fall into place.” Some SPSWs even make stu-dents pick up bus tickets twice a week unless they attend tutoring ormentoring services more frequently.The program does not help all students equally. Estimates are larger
among students with higher initial measured abilities (which we proxywith grade 9 math and English performance). This suggests dynamiccomplementarities in human capital formation, in line with earlier evi-dence suggesting that better-prepared students are more able to benefitfrom additional investment. In the context of Pathways, students disen-gaged from school are not easy to help. One SPSW commented, “stu-dents that we don’t—can’t support well are those that are not interestedin school.” Another said, “If a student’s focus is not academics we losethem. . . . I think the students who are most successful are the oneswho were able to hear out what somebody is saying, take some of thatin, like some of the suggestions.” Reasons behind disengagement maygo well beyond lack of motivation. Staff mentioned mental health prob-lems and stressful situations at home such as pregnancy, unemployment,sexual and physical assault, marital tensions, and unsupportive parentsas other serious obstacles that many Regent Park students experience.
C. Common Features with Other Successful Programs
Our interviews with Pathways staff suggest that components of the pro-gram that aim to support students beyond improving academic out-comes, especially the student-SPSW relationship, play an important role.The large component of the Pathways treatment effect that is not ex-plained by improvements in course grades is consistent with this. Recentresearch also finds evidence of large impacts for interventions that pro-vide personalized assistance and mentoring for adolescents and young
This content downloaded from 128.100.177.180 on May 31, 2020 12:08:01 PMAll use subject to University of Chicago Press Terms and Conditions (http://www.journals.uchicago.edu/t-and-c).
978 journal of political economy
All
adults. Bettinger and Baker (2014) show that personalized and regularcoaching increases persistence for college students. Assistance with col-lege transition and applications, including paying application fees, canmarkedly increase college enrollment (Bettinger et al. 2012; Carrelland Sacerdote 2013).The Accelerated Study in Associate Program, a comprehensive in-
tervention designed to increase 2-year college completion rates for low-income community college students, features many of the same compo-nents as Pathways. Students who are randomly selected into the programreceive free public transportation tickets, mandatory tutoring, regularcounseling overmultiple years, and career advising services. Recent resultsfrom this program include a doubling of the 3-year graduation rate (40.1vs. 21.8 percent) and a 45 percent increase in 4-year college enrollment(25.1 vs. 17.3 percent; Scrivener et al. 2015). A randomized trial inChicagoprovided social-cognitive skills training, along with mandatory daily two-on-one tutoring, to improve disadvantaged youths’ social interaction skillsand self-regulation. The program generated large improvements in schoolengagement, math, and reading; these effect sizes are some of the largestin the literature (Cook et al. 2014). The Quantum Opportunity Programalso offered a range of social, community, and educational after-school ser-vices to disadvantaged high school students. The program increased on-time high school graduation and college enrollment, though, likely be-cause of lower participation rates, the program had smaller effects thanPathways (Rodriguez-Planas 2012).College scholarship incentives, similar to those offered by Pathways,
have also been found effective. A study in New Brunswick that randomlyoffered entering grade 9 students college trust funds that accumulated by$2,000 each year in high school, up to a maximum of $8,000—doublePathways’ incentive—reduced dropout rates by about 8 percentage pointsand increased postsecondary enrollment rates by about 10 percentagepoints (Ford et al. 2012). A program that offered an entire sixth-grade classfull college financial support, along with academic and social support, ledto a near doubling of high school graduation rates, from roughly 35 to70 percent (Kahne and Bailey 1999).As discussed earlier, tutoring, after-school assistance, and a culture of
high expectations are key parts to highly effective chartered schools(Dobbie and Fryer 2013). We found that participation in tutoring andmentoring activity is sporadic for some students. Less than half the stu-dents in Regent Park, for example, attended any tutoring sessions in Oc-tober after grade 9 or attended any group mentoring session during anygiven month. We suspect, therefore, that the impacts from the programare coming more from regular interactions with SPSWs than from accessto tutoring or mentor programming. There may be opportunities for en-couraging further participation in these areas.
This content downloaded from 128.100.177.180 on May 31, 2020 12:08:01 PM use subject to University of Chicago Press Terms and Conditions (http://www.journals.uchicago.edu/t-and-c).
pathways to education 979
VI. Conclusion
Pathways to Education is a comprehensive youth support program devel-oped to improve academic outcomes among those entering high schoolfrom very poor social-economic backgrounds. The program includesproactive case workers assigned to each student, free weekly tutoringand group activities, career counseling, college transition assistance, andimmediate and long-termfinancial incentives. The program is communitybased and attempts to address the poor academic performance from threeof Toronto’s largest public housing complexes. Since its start in 2001, Path-ways has attracted national public and media interest. An internal 2007consulting report concluded that “Pathways is one of the most success-ful programs we have found anywhere in North America.” The programhas recently been expanded to 11 other communities across Canada,and expansion efforts continue. About half its financial support (47 per-cent) comes from national, provincial, and local levels of government.The otherhalf comes froma considerable foundation (20percent), corpo-rate (19 percent), individual (8 percent), and other (6 percent) support.This paper attempts to evaluate Pathways and explore whether impacts
were replicated at expansion sites. Overall, our findings suggest that Path-ways has an impressive effect on youths:
• Pathways reaches a remarkably high fraction of its target group: 80–95 percent of eligible students entering high school and their par-ents register in writing for the program.
• At the program’s initial site (Regent Park), fifth-year high schoolgraduation rates increased from 44 percent to 59 percent, whilefifth-year postsecondary enrollment rates rose from 31 percent to50 percent.
• The program’s 2007 expansion at two other sites also led to impres-sive gains: an immediate 6 percentage point increase in high schoolgraduation and about a 12 percentage point increase in postsec-ondary enrollment for males.
• Effects are larger for girls and for students not failing grade 9 mathand English classes. Impacts are similar for students with Englishand non-English languages spoken at home.
• Program effects are positive for most of the limited intermediateoutcomes we explore: grade 9 math and English grades, taking ac-ademic track courses, and grade 11 and 12 marks.
Pathways costs approximately $3,500 per student-year in 2010 Canadiandollars, along with $1,200 per student-year in head office administrativecosts (Boston Consulting Group 2011). Direct operating costs comprise20 percent for public transportation tickets, 15 percent for scholarship
This content downloaded from 128.100.177.180 on May 31, 2020 12:08:01 PMAll use subject to University of Chicago Press Terms and Conditions (http://www.journals.uchicago.edu/t-and-c).
980 journal of political economy
All
expenditures, and 65 percent toward SPSWs, tutoring, and group activityoperations. On one hand, the average cost for a participant’s high schooltenure is estimated at $13,400 in present value direct operating costs, plusindirect administrative costs and costs fromextended enrollment in school.On the otherhand, lifetimebenefits fromPathways are large.Using afinan-cial return to high school completion of 20 percent and a return to enroll-ing in college for marginal students of 22 percent (Oreopoulos and Pet-ronijevic 2013), the benefit-to-cost ratio from Pathways eligibility across allsites is 3.92.30 For the Rexdale/LH expansion sites, the smaller estimatedtreatment effects make the benefit-to-cost ratio depend more on the dis-count rate, but, in general, benefits exceed costs. Including the many pos-sible nonpecuniary benefits from additional schooling (Oreopoulos andSalvanes 2011), reductions in social assistance payments, and social bene-fits from reduced crime and improvements to health (Lochner 2011)would provide further support for maintaining or extending the program.We demonstrate that Pathways generates large improvements in stu-
dent outcomes. However, it is not possible with the methodology em-ployed here to determine whether these results rely on a few componentsof the program or whether program integration is crucial. Being able toexperiment with variations of the program or further qualitative researchthrough survey and ethnographic research may help. The expansion ofadditional Pathways sites outside of Toronto also provides an opportunityto test whether these initial impacts can be replicated. Implementationquality, community support, recruitment, communication efforts, andtarget population may be key underlying ingredients for the program’seffectiveness that could explain why some site impacts are larger thanothers. Still, the program’s initial sites were highly effective in improvingeducation attainment for a sample of very poor youths. These results arepromising, similar to recent intensive efforts to target disadvantagedyouths, and point to the need for further research and policy discussion.
30 See online app. F for more details.
This content downloaded from 128.100.177.180 on May 31, 2020 12:08:01 PM use subject to University of Chicago Press Terms and Conditions (http://www.journals.uchicago.edu/t-and-c).

pathways to education 981
Appendix
FIG. A1.—Normalized fraction graduated from high school and enrolled in postsecond-ary education by the end of fifth year among 1999–2006 grade 9 students from Regent Parkand other public housing projects in preagglomeration Toronto. Panel A shows high schoolcompletion rates after 5 years since starting high school for students living in Toronto publichousing who entered grade 9 between the 1999–2000 and 2008–9 academic years, normal-ized around the group mean rate between the 1999 and 2000 cohorts. Panel B shows thesame information except that the outcome is postsecondary enrollment rates.
This content downloaded from 128.100.177.180 on May 31, 2020 12:08:01 PMAll use subject to University of Chicago Press Terms and Conditions (http://www.journals.uchicago.edu/t-and-c).
982 journal of political economy
All
References
Abdulkadiroglu, Atila, Joshua Angrist, Susan Dynarski, Thomas J. Kane, andParag Pathak. 2011. “Accountability in Public Schools: Evidence from Boston’sCharters and Pilots.” Q.J.E. 126 (2): 699–748.
Aizer, Anna, and Flavio Cunha. 2012. “The Production of Human Capital: En-dowments, Investments and Fertility.”Working Paper no. 18429 (September),NBER, Cambridge, MA.
Attanasio, Orazio, Sarah Cattan, Emla Fitzsimons, CostasMeghir, andMarta Rubio-Codina. 2015. “Estimating the Production Function for Human Capital: Resultsfrom a Randomized Control Trial in Colombia.”Working Paper no. 20965 (Feb-ruary), NBER, Cambridge, MA.
Bales, Vicki. 2004. “The Community Succession Project and Pathways to Educa-tion.” Report to the Ontario Trillium Foundation (November), Toronto.
Bettinger, Eric, and Rachel Baker. 2014. “The Effects of Student Coaching: AnEvaluation of a Randomized Experiment in Student Advising.” Educ. Evalua-tion and Policy Analysis 36 (1): 3–19.
Bettinger, Eric, Bridget Long, Philip Oreopoulos, and Lisa Sanbonmatsu. 2012.“Helping Complete College Financial Aid Applications: Evidence from aRandomized Trial with H&R Block.” Q.J.E. 127 (3): 1205–42.
Boston Consulting Group. 2011. “BCG Assessment of Pathways to Education:Executive Summary.” Slides (February), Boston Consulting Group.
Brown, Robert S. 2006. “The Grade 9 Cohort Study: A Five-Year Analysis, 2000–2005.” Research Report no. 05/06-05 (April), Toronto District School Board.
Cameron, A. Colin, Jonah B. Gelbach, and Douglas L. Miller. 2008. “Bootstrap-Based Improvements for Inference with Clustered Errors.” Rev. Econ. andStatis. 90 (3): 414–27.
Cameron, A. Colin, andDouglas L.Miller. 2015. “APractitioner’s Guide toCluster-Robust Inference.” J. Human Resources 50 (2): 317–72.
Camilli, Gregory, Sadako Vargas, Sharon Ryan, and W. Steven Barnett. 2010.“Meta-Analysis of the Effects of Early Education Interventions on Cognitiveand Social Development.” Teachers Coll. Record 112 (3): 579–620.
Carrell, Scott E., and Bruce Sacerdote. 2013. “Late Interventions Matter Too:The Case of College Coaching New Hampshire.” Working Paper no. 19031(May), NBER, Cambridge, MA.
Caucutt, ElizabethM., and Lance Lochner. 2012. “Early and Late Human CapitalInvestments, Borrowing Constraints, and the Family.”Working Paper no. 18493(October), NBER, Cambridge, MA.
Cook, Philip J., Kenneth Dodge, George Farkas, et al. 2014. “The (Surprising)Efficacy of Academic and Behavioral Intervention with Disadvantaged Youth:Results from a Randomized Experiment in Chicago.”Working Paper no. 19882( January), NBER, Cambridge, MA.
Cunha, Flavio, and James J. Heckman. 2007. “The Technology of Skill Forma-tion.” A.E.R. 97 (2): 31–47.
Cunha, Flavio, James J. Heckman, and SusanneM. Schennach. 2010. “Estimatingthe Technology of Cognitive andNon-cognitive Skill Formation.” Econometrica 78(3): 883–931.
Dearing, Eric. 2008. “Psychological Costs of Growing Up Poor.” Ann. New YorkAcad. Sci. 1136:324–32.
Dobbie, Will, and Roland G. Fryer. 2011. “Are High Quality Schools Enough toIncrease Achievement among the Poor? Evidence from the Harlem Children’sZone.” American Econ. J.: Appl. Econ. 3 (3): 158–87.
———. 2013. “Getting Beneath the Veil of Effective Schools: Evidence from NewYork City.” American Econ. J.: Appl. Econ. 5 (4): 28–60.
This content downloaded from 128.100.177.180 on May 31, 2020 12:08:01 PM use subject to University of Chicago Press Terms and Conditions (http://www.journals.uchicago.edu/t-and-c).
pathways to education 983
Dvorak, Petula. 2010. “The Grinding Reality of Growing Up Poor.” WashingtonPost, September 30, Metro Sec.
Ford, Reuben,Marc Frenette, Claudia Nicholson, et al. 2012. “Future toDiscover:Post-secondary Impacts Report.”Manuscript (October), Soc. Res. and Demon-stration Corp., Ottawa.
Fryer, Roland G. 2014. “Injecting Successful Charter School Strategies into Tra-ditional Public Schools: Evidence from Field Experiments.” Q.J.E. 129 (3):1355–1407.
Gertler, Paul, James J. Heckman, Rodrigo Pinto, et al. 2014. “Labor Market Re-turns to an Early Childhood Stimulation Intervention in Jamaica.” Science344 (6187): 998–1001.
Heckman, James J. 2004. “Lessons from the Technology of Skill Formation.”Ann. New York Acad. Sci. 1038:179–200.
Heckman, James J., and Rodrigo Pinto. 2015. “Econometric Mediation Analyses:Identifying the Sources of Treatment Effects from Experimentally EstimatedProduction Technologies with Unmeasured and Mismeasured Inputs.” Econo-metric Revs. 34 (1–2): 6–31.
Heckman, James J., Rodrigo Pinto, and Peter Savelyev. 2013. “Understanding theMechanisms through Which an Influential Early Childhood Program BoostedAdult Outcomes.” A.E.R. 103 (6): 2052–86.
Holzer, Harry J., Diane Whitmore Schanzenbach, Greg J. Duncan, and Jens Lud-wig. 2008. “The Economic Costs of Childhood Poverty in the United States.”J. Children and Poverty 14 (1): 41–61.
Kahne, Joseph, and Kim Bailey. 1999. “The Role of Social Capital in Youth Devel-opment: The Case of ‘I Have a Dream’ Programs.” Educ. Evaluation and PolicyAnalysis 21 (3): 321–43.
Lochner, Lance. 2011. “Nonproduction Benefits of Education: Crime, Health,and Good Citizenship.” In Handbook of the Economics of Education, vol. 4, editedby E. Hanushek, S. Machin, and L. Woessmann. Amsterdam: Elsevier Sci.
Lynn, Laurence E., Jr., andMichael G. H. McGeary, eds. 1990. Inner-City Poverty inthe United States. Washington, DC: Nat. Acad. Press.
MacKinnon, James G., and Matthew D. Webb. 2017. “Wild Bootstrap Inferencefor Wildly Different Cluster Sizes.” J. Appl. Econometrics 32 (2): 233–54.
McLoyd, Vonnie C. 1998. “Socioeconomic Disadvantage and Child Develop-ment.” American Psychologist 53 (2): 185–204.
Olds, David L., JoAnn Robinson, Lisa Pettitt, et al. 2004. “Effects of Home Visitsby Paraprofessionals and by Nurses: Age 4 Follow-Up Results of a RandomizedTrial.” Pediatrics 114 (6): 1560–68.
Oreopoulos, Philip, Robert S. Brown, and Adam M. Lavecchia. 2014. “Pathwaysto Education: An Integrated Approach to Helping At-Risk High School Stu-dents.” Working Paper no. 20430 (August), NBER, Cambridge, MA.
Oreopoulos, Philip, and Uros Petronijevic. 2013. “Making College Worth It: AReview of Research on the Returns to Higher Education.” Working Paperno. 19053 (May), NBER, Cambridge, MA.
Oreopoulos, Philip, and Kjell G. Salvanes. 2011. “Priceless: The Non-pecuniaryBenefits of Schooling.” J. Econ. Perspectives 25 (1): 159–84.
Osofsky, Joy D. 1999. “The Impact of Violence on Children.” Future of Children 9(3): 33–49.
Polidano, Cain, Barbara Broadway, and Hielke Buddelmeyer. 2012. “Explainingthe SES School Completion Gap.”Working Paper no. 16 (August), MelbourneInst.
Rodríguez-Planas, Núria. 2012. “Longer-Term Impacts of Mentoring, EducationalServices and Learning Incentives: Evidence from a Randomized Trial in theUnited States.” American Econ. J.: Appl. Econ. 4 (4): 121–39.
This content downloaded from 128.100.177.180 on May 31, 2020 12:08:01 PMAll use subject to University of Chicago Press Terms and Conditions (http://www.journals.uchicago.edu/t-and-c).
984 journal of political economy
All
Rowen, Norman. 2012. “Pathways to Education and Its Accomplishments.” In Ad-olescent Literacies in a Multicultural Context, edited by A. Cumming. New York:Routledge.
Rowen, Norman, and Kevin Gosine. 2006. “Support That Matters: A Community-Based Response to the Challenge of Raising the Academic Achievement ofEconomically Vulnerable Youth.” In Inclusion in Urban Educational Environ-ments: Addressing Issues of Diversity, Equity, and Social Justice, edited by D. Arm-strong and B. McMahon. Charlotte, NC: Information Age Pub.
Schweinhart, Lawrence J., Jeanne Montie, Zongping Xiang, W. Steven Barnett,Clive R. Belfield, and Milagros Nores. 2005. Lifetime Effects: The High/Scope PerryPreschool Study through Age 40. Ypsilanti, MI: High/Scope Press.
Scrivener, Susan, Michael J. Weiss, Alyssa Ratledge, Timothy Rudd, ColleenSommo, and Hannah Fresques. 2015. “Doubling Graduation Rates: Three-Year Effects of CUNY’s Accelerated Study in Associate Programs (ASAP) forDevelopmental Education Students.” Report (February), MDRC, New York.
Selemon, Lynn D. 2013. “A Role for Synaptic Plasticity in the Adolescent Devel-opment of Executive Function.” Translational Psychiatry 3 (e238). doi:10.1038/tp.2013.7.
Steinberg, Laurence. Forthcoming. Our Last Best Chance: Why Adolescence MattersMore than Ever.
Toronto Social HousingConnections. 1998. “Guide to Social Housing inToronto.”Report, Community Information Toronto.
Venkatesh, Sudhir Alladi. 2002.American Project: The Rise and Fall of aModern Ghetto.Cambridge, MA: Harvard Univ. Press.
This content downloaded from 128.100.177.180 on May 31, 2020 12:08:01 PM use subject to University of Chicago Press Terms and Conditions (http://www.journals.uchicago.edu/t-and-c).