Embed Size (px)
Citation preview
University of Nebraska Medical Center University of Nebraska Medical Center
DigitalCommons@UNMC DigitalCommons@UNMC
Theses & Dissertations Graduate Studies
Summer 8-18-2017
Patient-Centered Medical Home Adoption in School-Based Health Patient-Centered Medical Home Adoption in School-Based Health
Centers Centers
Abbey Gregg University of Nebraska Medical Center
Follow this and additional works at: https://digitalcommons.unmc.edu/etd
Part of the Community Health and Preventive Medicine Commons, Health Services Administration
Commons, and the Health Services Research Commons
Recommended Citation Recommended Citation Gregg, Abbey, "Patient-Centered Medical Home Adoption in School-Based Health Centers" (2017). Theses & Dissertations. 214. https://digitalcommons.unmc.edu/etd/214
This Dissertation is brought to you for free and open access by the Graduate Studies at DigitalCommons@UNMC. It has been accepted for inclusion in Theses & Dissertations by an authorized administrator of DigitalCommons@UNMC. For more information, please contact [email protected].
PATIENT-CENTERED MEDICAL HOME ADOPTION IN SCHOOL-BASED HEALTH CENTERS
by
Abbey Gregg
A DISSERTATION
Presented to the Faculty of
the University of Nebraska Graduate College
in Partial Fulfillment of the Requirements
for the Degree of Doctor of Philosophy
Health Services Research, Administration & Policy Graduate Program
Under the Supervision of Professor Li-Wu Chen
University of Nebraska Medical Center Omaha, Nebraska
May, 2017
Supervisory Committee:
Li-Wu Chen, MHSA, PhD Jungyoon Kim, PhD
Hyo Jung Tak, PhD Melissa Tibbitts, PhD
Hongmei Wang, PhD Nizar Wehbi, MD, MPH, MBA
ii
PATIENT-CENTERED MEDICAL HOME IMPLEMENTATION IN SCHOOL-BASED HEALTH CENTERS
Abbey Gregg, PhD
University of Nebraska, 2017
Supervisor: Li-Wu Chen, MHSA, PhD
Abstract
The Patient-Centered Medical Home (PCMH) is promoted as a primary care delivery design that
can improve health care quality and patient outcomes while controlling health care costs. To achieve
PCMH recognition, primary care providers must implement practice-level changes in order to deliver
care that is comprehensive, coordinated, accessible, high quality, and whole-person oriented. This
practice transformation requires advanced use of health information technology, staff investment in
quality improvement and care coordination, and significant investments of both financial and human
resources to support these activities. As a safety-net provider, school-based health centers (SBHCs)
serve vulnerable children that typically experience barriers to having a medical home. It is critical for
SBHCs to keep pace with delivery reform so that the health care disparities seen in children served by
SBHCs are not exacerbated. However, characteristics of SBHCs such as their limited finances and small
staff size could restrict their ability to implement expensive care delivery changes.
The purpose of this research is to apply organization behavioral theories and adoption of
innovation theory to understand the factors associated with adoption of individual PCMH attributes,
higher levels of PCMH capacity, and formal recognition as a PCMH in SBHCs. This research addressed the
extent to which resource dependency theory and institutional theory can be used to explain PCMH
adoption in SBHCs. The first study involved mapping PCMH attributes available in a SBHC national-level
secondary data source to recognized PCMH definitions. These attributes underwent factor analysis to
create an index that could measure SBHC PCMH capacity. The second study examined the associations
iii
between various measures of PCMH capacity and individual PCMH attributes with measures of the
SBHC’s internal munificence, environmental complexity, and external isomorphic pressures. The third
study examined the associations between formal PCMH recognition and the measures of the SBHC’s
internal munificence, environmental complexity, and external isomorphic pressures. The results of these
three studies were synthesized to describe how both the SBHC’s internal and external environmental
characteristics are associated with various aspects of the overall PCMH adoption process.
iv
TABLE OF CONTENTS
LIST OF FIGURES ........................................................................................................................................... vi
LIST OF TABLES ............................................................................................................................................ vii
LIST OF ABBREVIATIONS .............................................................................................................................. ix
CHAPTER 1: INTRODUCTION ......................................................................................................................... 1
The Patient-Centered Medical Home ....................................................................................................... 1
History and Definition ........................................................................................................................... 1
Review of the Evidence ......................................................................................................................... 3
School-Based Health Centers .................................................................................................................... 7
History ................................................................................................................................................... 7
Review of the Evidence ......................................................................................................................... 9
Medical Home Potential ..................................................................................................................... 12
Theoretical Basis for the Study ............................................................................................................... 14
Conceptual Framework ........................................................................................................................... 20
Unique Contribution, Specific Aims, and Research Questions ............................................................... 21
CHAPTER 2: IDENTIFYING PATIENT-CENTERED MEDICAL HOME ATTRIBUTES IN SCHOOL-BASED HEALTH
CENTERS ...................................................................................................................................................... 24
Abstract ................................................................................................................................................... 24
Introduction ............................................................................................................................................ 26
Methods .................................................................................................................................................. 28
Results ..................................................................................................................................................... 30
Discussion................................................................................................................................................ 36
Implications and Contributions ............................................................................................................... 41
CHAPTER 3: PATIENT-CENTERED MEDICAL HOME CAPACITY IN SCHOOL-BASED HEALTH CENTERS ......... 43
Abstract ................................................................................................................................................... 43
Introduction ............................................................................................................................................ 45
Methods .................................................................................................................................................. 47
Results ..................................................................................................................................................... 50
Discussion................................................................................................................................................ 61
Implications and Contributions ............................................................................................................... 65
CHAPTER 4: CORRELATES OF PATIENT-CENTERED MEDICAL HOME RECOGNITION IN SCHOOL-BASED
HEALTH CENTERS ........................................................................................................................................ 67
Abstract ................................................................................................................................................... 67
v
Introduction ............................................................................................................................................ 69
Methods .................................................................................................................................................. 72
Results ..................................................................................................................................................... 74
Discussion................................................................................................................................................ 78
Implications and Contributions ............................................................................................................... 83
CHAPTER 5: DISCUSSION ............................................................................................................................. 84
Summary and Synthesis .......................................................................................................................... 84
Implications ............................................................................................................................................. 93
Limitations .............................................................................................................................................. 95
Future Research ...................................................................................................................................... 99
Bibliography .............................................................................................................................................. 102
APPENDIX A. PCMH ATTRIBUTES FROM THE SBHA 2013-2014 CENSUS .................................................. 128

vi
LIST OF FIGURES
Figure 1. Overlap and Influence of Internal and External Environmental Variables ..................... 20
Figure 2. Conceptual Framework of PCMH Adoption .................................................................... 21
vii
LIST OF TABLES
Table 1. Categorization of Internal and External Environmental Variables ................................................ 16
Table 2. Results of Factor Analysis for Adolescent SBHC PCMH Index ....................................................... 32
Table 3. Internal Consistency Reliability for Overall Index, Domains, and Dimensions (n = 1,218) ........... 33
Table 4. Mean Scores for Overall SBHC PCMH Index, Domains, and Dimensions (n = 1,218) ................... 33
Table 5. Scaled Scores for Overall SBHC PCMH Index and Domains by PCMH Status (n = 1,218) ............. 34
Table 6. Prevalence of PCMH Attribute by SBHC Characteristics (n = 1,218) ............................................. 35
Table 7. Description of SBHCs (n = 1,026) ................................................................................................... 51
Table 8. Mean Percentile Scores on the SBHC PCMH Index (n = 1,026) ..................................................... 52
Table 9. SBHC PCMH Index Scores by SBHC Characteristics (n = 1,026) ..................................................... 53
Table 10. SBHC PCMH Index Scores Adjusted by SBHC Characteristics (n = 1,026) ................................... 54
Table 11. Dimension Scores Adjusted by SBHC Characteristics (n = 1,026) ............................................... 55
Table 12. Odds Ratios for PCMH Attributes in the HIT and Payment Dimensions (n = 1,026) ................... 57
Table 13. Odds Ratios for PCMH Attributes in the Patient-Centered and Access and Quality Dimensions
(n = 1,026) ................................................................................................................................................... 58
Table 14. Odds Ratios for PCMH Attributes in the Care Management and Comprehensive Care
Dimensions (n = 1,026) ............................................................................................................................... 60
Table 15. Descriptive Statistics of SBHCs (n=1,212) .................................................................................... 75
Table 16. SBHC Characteristics by PCMH Recognition Outcomes (n=1,212) .............................................. 76
Table 17. Adjusted Odds Ratios for Any PCMH Recognition and National PCMH Recognition (n=1,212) . 77
Table 18. Comparison of Associations of SBHC Characteristics with PCMH Capacity and PCMH
Recognition ................................................................................................................................................. 86
Table 19. Relationship Between PCMH Attributes and Munificence Variables ......................................... 87
Table 20. Relationship Between PCMH Attributes and Complexity Variables ........................................... 89

viii
Table 21. Relationship Between PCMH Attributes and Isomorphic Pressure Variables ........................... 90
Table 22. Comparison of Article Study Populations ................................................................................... 96
ix
LIST OF ABBREVIATIONS
AAP American Academy of Pediatrics
ACA Affordable Care Act
CHC community health center
EHR electronic health record
EMR electronic medical record
FQHC federally qualified health center
FTE full-time equivalent
HIT health information technology
HRSA Health Resources and Services Administration
LHD local health department
NCQA National Committee for Quality Assurance
PCMH patient-centered medical home
PCP primary care provider
RUCA Rural Urban Commuting Area Codes
SBHA The School-Based Health Alliance
SBHC school-based health center
SES socioeconomic status
1
CHAPTER 1: INTRODUCTION
The Patient-Centered Medical Home
History and Definition
The medical home concept is currently promoted for use in both adult and pediatric primary
care settings, but it was first defined by the American Academy of Pediatrics (AAP) in 1967 for use by
pediatricians caring for children with special health care needs.1,2 The AAP was concerned with
incomplete medical records that resulted from poor communication and coordination between the
patient’s multiple providers.3 A “medical home”, a central location for a child’s complete medical
records, was needed to improve the care delivered to children with complex needs. In 1992, the AAP
released an official policy statement that expanded the definition to a vision of primary care that was
more prevention-oriented, continuous, and responsive to the individual needs of all children and
adolescents.4 Another official policy statement a decade later added that medical homes should offer
family-centered care and provide care coordination services.5
In 2001, the Institute of Medicine released a report calling for improvements in the health care
quality in the United States.6 In their report, the IOM specifically mentions that healthcare redesign
should focus on primary care and should incorporate meaningful innovations such as payment reform,
health information technology (HIT), and professional training on best practices. Per the IOM, the safety,
effectiveness, patient-centeredness, timeliness, efficiency, and equity were six areas that should be
focused on when redesigning primary care. The IOM’s report specifically mentioned many aspects of the
medical home, as previously defined by AAP, as being critical to the future of the health care system. In
2007, the AAP, American Academy of Family Physicians, American College of Physicians, and the
American Osteopathic Association issued a joint statement that defined the medical home principles
from the perspective of primary care providers.7 The seven principles of the patient-centered medical
home (PCMH) defined by these four primary care provider organizations are:
2
“Personal physician - each patient has an ongoing relationship with a personal physician
trained to provide first contact, continuous and comprehensive care.
Physician directed medical practice – the personal physician leads a team of individuals
at the practice level who collectively take responsibility for the ongoing care of patients.
Whole person orientation – the personal physician is responsible for providing for all the
patient’s health care needs or taking responsibility for appropriately arranging care with
other qualified professionals. This includes care for all stages of life; acute care; chronic
care; preventive services; and end of life care.
Care is coordinated and/or integrated across all elements of the complex health care
system (e.g., subspecialty care, hospitals, home health agencies, nursing homes) and the
patient’s community (e.g., family, public and private community- based services). Care is
facilitated by registries, information technology, health information exchange and other
means to assure that patients get the indicated care when and where they need and
want it in a culturally and linguistically appropriate manner.
Quality and safety are hallmarks of the medical home.
Enhanced access to care is available through systems such as open scheduling,
expanded hours and new options for communication between patients, their personal
physician, and practice staff.
Payment appropriately recognizes the added value provided to patients who have a
patient-centered medical home.”7
After the release of the seven joint principles, programs designed to support and measure the
PCMH model were created by both the public and private sector. National PCMH recognition and
accreditation programs were created by the Accreditation Association for Ambulatory Health Care
(AAAHC), National Committee for Quality Assurance (NCQA), The Joint Commission, and URAC. The
3
federal government also initiated programs to promote adoption of the medical home model. The
Affordable Care Act (ACA) included the Medicaid Health Home State Plan Option, which provided
enhanced federal funding and technical assistance to help states implement comprehensive care
coordination in their Medicaid programs. As of November 2016, 20 states and the District of Columbia
were participating in the Medicaid Health Home option.8 The ACA also authorized the Federally
Qualified Health Center (FQHC) Advanced Primary Care Practice Demonstration which provided
enhanced Medicare care coordination payments and technical assistance to 434 FQHC participants.9 As
a part of the project, FQHCs were expected to achieve Level 3 NCQA PCMH certification, which is the
certification level representing the highest PCMH capability as measured by NCQA.
There is not one standardized measurement of the medical home model across all public and
private payer initiatives, but NCQA’s assessment has become the most common PCMH standard used in
medical home demonstrations.10 The NCQA assesses six standards from the clinic’s perspective: (1)
patient-centered access, (2) team-based care, (3) population health management, (4) care management
and support, (5) care coordination and care transition, and (6) performance measurement and quality
improvement.11 PCMH recognition occurs at the practice-level and more than 60,000 medical providers
work in over 12,000 practices that are NCQA PCMH recognized.12 An estimated 30% of U.S. physicians
practice in clinics that could meet various PCMH program requirements and among these physicians,
43% believe the PCMH model is positively impacting care quality.13 Of nurse practitioners and physician
assistants participating in medical homes, 63% report a positive opinion of the medical home model.13
Review of the Evidence
Evaluations of the PCMH model have provided some promising results about its potential to
improve patient outcomes, reduce health care expenditure, and improve overall quality of care. PCMH
activities have been examined in a variety of settings, including both large and small primary care
offices, federally qualified health centers, rural and urban clinics, integrated delivery systems like the
4
Veteran’s Health Administration, and in patient panels from both private and public insurance groups.
Additionally, studies of the PCMH model have been conducted on both adult and pediatric populations.
Most pediatric studies evaluate PCMH implementation in children with special health care needs, the
original population which inspired the model.
Many different measurements of “medical homeness” are used in evaluation studies, from self-
report of PCMH status by clinicians to administration of PCMH survey tools to providers, and medical
home composite scores created using secondary data.14-18 The extreme heterogeneity in clinic settings,
patient populations studied, outcomes evaluated, and medical home definitions have resulted in mixed
findings about the effectiveness of the PCMH model. Despite these methodological limitations, there are
broadly positive associations between the PCMH model and desirable clinical and utilization outcomes.
The results of PCMH evaluation studies on health care quality and outcomes, cost, and utilization, with
an emphasis on results in pediatric populations when possible, will be discussed in further detail.
Quality and Health Outcomes
The medical home (operationalized by the National Survey of Children’s Health definition), is
associated with better parental assessment of child health and increased healthy behaviors in children
without special health care needs.14 Using the Medical Expenditure Panel Survey (MEPS) definition,
children with medical homes have increased odds of receiving health screenings, guidance from their
providers about oral health, diet, exercise, and injury prevention, and have higher parent reported
ratings of care quality.15,19 Pediatric practices that are NCQA PCMH recognized score higher on parent
assessments of child development and prevention care.20 For children with special health care needs, a
pediatric population that requires more interaction with the health care system, medical homes
increase the odds of having greater use of primary care office visits.21 In asthmatic children, having a
medical home is also associated with better performance on several pediatric quality measures, less
unmet health care needs, and reductions in school absences.22 Medical homes have also been
5
associated with improved academic outcomes for Latino children from low-income families.23 In safety-
net clinics, the PCMH model has also improved use of preventive services for adolescent populations,
but the effect varies based on patient sociodemographic characteristics.24 Adolescents’ self-report of
patient-centered care is associated with better global health status, receiving higher care quality, and
less unmet need for care.17,25
Although full implementation of the PCMH model leads to higher improvements in care quality
for children, even partial implementation of the model improves use of preventive care, demonstrating
that the medical home is not an “all or nothing” concept.20,26 Patients that report having accessible and
patient-centered communication with their providers also report higher care quality.27 Other studies
using multi-component definitions of medical homes have found associations with medical home
subscale scores and patient outcomes. For example, while overall PCMH score was not associated with
any pediatric patient experience, high quality improvement scores were positively related and high care
management scores were negatively related with patient experience.28
Not all studies report significant benefits of the PCMH model. For example, some care quality
gains in Medicaid PCMH programs have only been modest or produced mixed results.29 In a randomized
controlled trial with PCMH intervention practices, only two of eleven quality indicators and one of ten
efficiency indicators improved in the intervention group.30 In another study, having a medical home did
not improve developmental screening disparities between Non-Hispanic White and black children, and
did not improve receipt of mental health services.22
Utilization
For children without special health care needs, the medical home (defined by the National
Survey of Children’s Health operationalized definition), is associated with increased use of preventive
visits and decreases in both outpatient and emergency department vists.14 The association between
emergency department visits and the medical home was strongest for children aged 6-11 years, and the
6
association with outpatient sick visits was stronger in adolescents.14 Using the MEPS definition of a
medical home, positive healthcare utilization patterns have also been found.19,31 Another study
examining the parent’s report of a medical home also found it decreases emergency room use.18
However, this same study also used a medical home definition obtained by surveying the provider and
found that individual domains of the medical home score, but not the overall medical home score itself,
were associated with lower health care utilization rates.18 Others have found that comprehensive of care
and afterhours care were associated with improvements in health care utilization, but care coordination
increased use of outpatient and emergency department visits.32,33 Another study that assessed multiple
levels of medical homeness found that it was not associated with improving well-child visits, but that
practices with the highest PCMH levels might reduce avoidable emergency department use in publicly
insured children.34
Cost
The Patient-Centered Primary Care Collaborative has found that cost savings occur in PCMH
initiatives led by Medicaid programs, private insurers, and integrated health systems.35 Annual median
costs for children in the Colorado PCMH program were $1,129 less than children not enrolled in a PCMH
practice, and the North Carolina Medicaid medical home program was estimated to have saved $574
million over a 5 year time span due to a decreases in hospitalizations and emergency department
visits.29,35 A comprehensive primary care program with elements similar to the PCMH model (eg care
coordination, team-based care, and chronic disease management) was estimated to have saved a
regional insurance company $77.7 million in inpatient care costs over a decade for children with chronic
conditions.36 For children with special health care needs, receiving the PCMH component of care
coordination decreases out-of-pocket medical costs, especially for children with public insurance.37
Patients with providers that offer afterhours care also have lower total health expenditures.38
7
Some evaluation studies have found no significant cost-savings in PCMH programs, despite
modest improvements in care quality.30 Cost savings do not happen immediately; however, three years
of an insurance company led PCMH program resulted in a small decrease in their expenditures by 2.8%,
with the greatest reduction happening in patients with chronic conditions.39 Additionally, PCMH
implementation may have different effects on the potential cost savings for adults and children. PCMH
pediatric populations may have higher costs of care than adults because of the use of more preventive
services.26 Children with medical homes have higher use of outpatient visits, prescription drugs, and
dental services, but have similar total expenditure costs to children without medical homes.31 Therefore,
pediatric PCMH interventions may not immediately result in cost savings. While significant cost savings
are not always found in evaluations of small-scale PCMH interventions, scaling up the interventions to
involve more physicians and patients could result in significant savings over time.30 Additionally, cost
savings may not occur with only partial PCMH implementation.26
School-Based Health Centers
History
School-based health centers have their roots in one of the most successful public health
experiments, the initiation of a school nursing program in New York during the 1900s to combat
childhood infectious diseases.40 During this time period, nearly 20% of children died before reaching
their 5th birthday, mostly due to infectious diseases, and most New York school children needed medical
attention.41 After failing to see progress containing disease epidemics by simply excluding sick children
from school, nurses were brought into schools to treat ill students. Because of poverty, a poor
understanding of infectious disease prevention, and a general lack of access to health care, these
students would have otherwise remained sick and spread the disease to others.40 Child health and
school attendance improved after the introduction of school-based nursing, and school nurses became
responsible for infectious disease control, health education, and referring students to community
8
providers.42 An advanced practice school nursing program was started at the University of Colorado in
1970, and the idea that the school was an ideal setting to provide comprehensive primary care services,
especially to children without connections to community-based providers, became more widely
accepted.43 After The Education for All Handicapped Children Act, which integrated handicapped
children into regular classrooms passed in 1974, advanced nursing expertise was needed in school
settings to help manage the new range and scope of student health conditions present in schools.44
The expansion of the SBHC model was spurred on by The Robert Wood Johnson Foundation in
the 1980s-1990s through various initiatives that worked to expand health care access for children and to
encourage individual states to implement policies aimed at improving the financial sustainability of the
SBHC model.45,46 Today, an estimated 2,135 SBHCs provide care to 2.3 million children and
adolescents.47 According to the School Based Health Alliance, SBHCs are predominantly located in low-
income settings that include racial and ethnic minority-majority schools. Though exact services vary
based on the needs of the students and the community they serve, most SBHCs offer a combination of
primary care, behavioral health, and other specialty care, like nutrition or oral health services.
SBHCs are designed to overcome transportation, time, and financial barriers that may prevent
children from receiving needed health care services. The onsite provision of services at school is
convenient because children are mandated to be present, but also affordable because most SBHCs
accept Medicaid or sliding fee scale payments. Both children and parents avoid missing school and work
when visits to a medical provider are needed, and the SBHCs’ physical location allows them to combine
clinical care with public health activities and environmental supports. This provides a substantially
different type of care from what is normally given at other clinic sites in the community, in part because
the patients served by the SBHC are united by the relationships they have with each other and the
school staff.48 Because the SBHCs can see children in a natural setting, there may be increased
opportunities for follow-up visits needed to manage chronic conditions, better adherence in completing
9
treatments or immunization series that require multiple visits, and more occasions to observe the child
or adolescent for potential health problems.
Review of the Evidence
While high mortality rates from infectious diseases are no longer the primary health threat to
U.S. school children, socioeconomic factors and the structure of our health care system still result in
poor child health outcomes compared to other developed countries.49 Barriers that prevent individuals
from accessing health care have been termed “voltage drops” 50. “Voltage drops” for children occur
when there are health insurance limitations, financial cost-sharing burdens, and reduced access to high
quality primary care and specialty services.51 SBHCs are specifically designed to overcome these “voltage
drops” and are one response to the national imperative that every child needs to have access to high
quality primary care.49
One in five U.S. children live in poverty, and children are the age group in the U.S. most likely to
be living at or below the poverty line.52 Compared to Non-Hispanic White s, both Hispanics and Blacks
experience significantly higher rates of poverty.52 Race and poverty are intertwined and racial
differences in poverty are an important contributor to health disparities.53 Though not exclusive to
schools with high poverty and/or high racial and ethnic minority student representation, SBHCs are
predominantly located in schools that fit this description.47 Children of color and those living in poverty
experience worse health than their non-Hispanic white and higher socioeconomic status (SES) peers. For
example, children from lower SES backgrounds, with public health insurance, and of racial and ethnic
minority groups have significantly lower rates of adherence to The American Academy of Pediatrics’
(AAP) Well Child screening recommendations (AAP).54 Well child screenings include opportunities for
parents to discuss concerns with their medical provider while receiving age appropriate preventive and
diagnostic services, such as immunizations, growth and development assessments, and health
education. With lower rates of receiving recommended preventive services, it is not surprising that low
10
income and children of some racial/ethnic groups have higher rates of asthma, obesity, behavioral
problems, unmet health needs, emergency department use, and unmet specialty care needs.55-57
Multiple evaluation studies have demonstrated the impact on the health outcomes of children
and adolescents served by SBHCs. By having accessible and affordable primary care services offered at
the school, SBHCs increase use of preventive services, such as health maintenance visits and age
appropriate screenings.58,59 Adolescents and children may miss key immunizations for a variety of
reasons, including changes in insurance coverage or switching providers. SBHCs typically provide
affordable (sometimes free) immunizations in a setting ideally situated for implementing an
immunization tracking and recall system.60 Children in schools with SBHCs are also “captive audiences”,
and higher completion rates for immunization series in SBHC children may be explained by their ability
to easily see their provider for the multiple visits required by some vaccinations.58,60
Asthma is the most frequent inpatient diagnosis for children age one and older, and asthmatic
students with access to a SBHC have fewer activity limitations, emergency department visits,
hospitalizations, and lower health care costs.59,61-63 SBHCs’ success with helping asthmatic patients may
be because of their use of team-based approaches to combat illness. For example, a child with asthma
may receive treatment and counseling from a health care provider, but also may benefit from social
workers that help the family identify asthma triggers in the home.44 SBHCs are also positively associated
with improvements in mental and behavioral health conditions. Preschoolers with access to an SBHC
have better emotional health as reported by their parents, and adolescents are more likely to access
mental health services.64,65 Among students with mental health problems, SBHC patients have
significantly lower mental health and overall health costs.65
Overall, parents and students report high satisfaction with the care they receive at SBHCs.
Students using SBHCs describe good quality of care and report that discussions with providers are
respectful, understandable, confidential, and include topics such as sexual health, contraceptives, diet,
11
and nutrition.66,67 Compared to non-SBHC users, students who use SBHC services engage in more
positive health behaviors and are more satisfied with their health.68 In one study, parents reported
being happier with the care received at SBHCs than at other hospital and community-based clinics.69
SBHCs have also shown potential in the public health battle against obesity. Programs run by SBHCs
have been shown to decrease student body mass index and increase healthy behaviors.48,68
Better management of chronic conditions, like asthma, or prevention of conditions is a key
factor in reducing health care expenditures. Several evaluation studies have demonstrated SBHCs’ ability
to decrease emergency department use in their student patient population, which will reduce costs for
both patients and their insurance companies.58,59,61,69 A Community Guide systematic review of
economic evaluations of SBHCs concluded that use of SBHCs results in significant savings to society,
patients, and Medicaid programs.70 From the Medicaid perspective, SBHCs visits saved Medicaid
anywhere from $30-$969 per SBHC visit, and $46-$1,166 per SBHC user with variation depending on the
type of services offered at the SBHC.70
There is also some evidence that SBHCs positively affect educational outcomes. Health problems
are frequently the cause of absenteeism, which disproportionately affects low-income and minority
children, and puts them at risk for falling behind academically.71 Just like in the 1900s with infectious
diseases, adding school health services can reduce school exclusions due to illness.72 SBHC users have
also reported higher levels of school connectedness and more effort put towards college
preparation.73,74 The Community Guide recommends SBHCs in low-income communities due to evidence
of their ability to positively impact students’ grades, grade promotion, and high school graduation
rates.75 By improving the educational outcomes for low-income children, SBHCs also tackle the issue of
education being a social determinant of health and potentially reduce future health disparities caused
by low educational attainment.76 In both evaluations of the health and academic outcomes of SBHCs,
there were some studies that did not find significantly positive results. Inconsistent findings about the
12
benefits of SBHCs may be caused by their actual inability to improve health outcomes or due to well-
known methodological problems in the SBHC evaluation literature caused by small sample sizes,
selection bias of where children attend school and if they use the SBHC, and by the heterogeneity of
populations, services, and outcomes studied.77
Medical Home Potential
The AAP recommends that every child should have a medical home because they can reduce
health care expenditures, increase quality of care, improve health outcomes, decrease unmet medical
needs, and improve patient satisfaction in pediatric populations.78 The AAP currently recommends
SBHCs as both potential independent medical homes and collaborative partners for other pediatric
medical home practices.79 Given that “the national imperative to eliminate social disparities in health
will not be achieved without concerted attention to childhood, because the largest disparities are
initiated and perpetuated through childhood circumstances”, it is critical to improve the quality of
health care for children in every setting they receive it.49 Recognizing the importance of improving
health care services for children as part of a larger strategy to improve our nation’s health, the ACA
designated $200 million towards supporting the improvement and expansion of services at SBHCs and
the number of SBHCs grew 20% between 2010 and 2014.80,81
SBHCs are innately compatible with several components of the medical home model, such as
being promotive of patient-centered care that is accessible and culturally sensitive.82 According to both
adolescents and parents, the care they receive at their SBHC meets the AAP’s definition of a medical
home.83 SBHCs have already demonstrated their willingness to collaborate with other health care
providers to meet PCMH objectives of coordinated care, as most SBHCs are sponsored by other health
care organizations, and some are participants in innovative programs like school-based telehealth
programs that connects students to community providers from the convenience of the school setting.84
13
There are several valid concerns raised about SBHCs’ ability to become full-fledged medical
homes. First, many SBHCs only operate when school is in session, limiting children’s access to care
during summer and holiday vacations; however, SBHCs can overcome this obstacle by partnering with
their sponsoring organization or another community health care organization to provide afterhours
coverage.82 Secondly, SBHCs are small clinic operations and the medical home literature has
demonstrated significant challenges to PCMH adoption in small primary care settings.85-88 Small
practices may have fewer resources (e.g. financial, technical, human) that impede their practice
transformation, but these barriers can be overcome by accessing external practice supports offered by
PCMH programs.89
Thirdly, SBHCs operate on shoe string budgets and face financial sustainability issues due to
their mission to provide care for all children.82 Funding issues may constrain SBHC’s ability to implement
expensive elements of the PCMH model, such as quality improvement activities and purchase of HIT, let
alone pay for national PCMH accreditation fees. Currently, quality improvement activities are quite
limited in SBHCs, but this could improve through participation in state Medicaid PCMH initiatives that
offer external consultants on best practices.90,91 In fact, SBHCs could opt to only pursue medical home
designation through Medicaid or a local insurance provider, receive transformation support as a part of
these programs, and avoid the costs of NCQA or other national-level certification programs.
Participation in the Medicaid EHR Incentive Program for meaningful use could also be used to pay for
some of the HIT costs and simultaneously meet many NCQA PCMH standards.92,93
Finally, SBHCs are safety-net providers primarily located in low SES areas, have a large
proportion of racial and ethnic minority students, and are usually based in schools that include
adolescents. The medical home literature has demonstrated that these factors are associated with
decreased PCMH capacity at the practice level and medical home access disparities at the patient level.
Multiple studies have demonstrated that racial and ethnic minority children are less likely to have a
14
medical home or to receive care that is aligned with specific components of the PCMH model.94-98 Even
in safety-net clinics, lower PCMH capacity is associated with patient race/ethnicity.99,100 Home and
neighborhood characteristics, in addition to other sociodemographic characteristics such as income and
lack of private health insurance, are also associated with decreased medical home access.23,94-97,101,102
Medical home disparities have also been found to exist between young children and adolescents.22,97
However, there is evidence that despite the practice transformation challenges faced by safety-net
providers, they can offer care consistent with the PCMH model and achieve PCMH recognition.
27,85,99,100,103
Theoretical Basis for the Study
This dissertation examines variations in the adoption of the PCMH model as functions of an
SBHC’s internal resources, patient characteristics, and environmental pressures. The PCMH model may
be considered as an innovation; in fact, the PCMH model consists of several unique innovations, such as
HIT, care coordination, and team-based care.104 Because adoption of innovations is determined in part
by features of the innovations themselves, multiple PCMH adoption outcomes are modelled: (1)
individual PCMH components, (2) overall PCMH capacity, and (3) recognition as a PCMH. My approach
allows for identification of SBHC characteristics (i.e. internal resources, patient characteristics,
environmental pressures) that are associated with individual elements of the PCMH model, adoption of
multiple PCMH components, and more advanced transformation into a full-fledged PCMH. Aspects of
diffusion of innovations theory, resource dependency theory, and institutional theory will be used in this
dissertation to examine medical home adoption in SBHCs.
An innovation is “an idea, practice, or object that is perceived as new”.105 While the medical
home concept has existed in different iterations for decades, the push for the medical home to become
the standard for primary care is recent. An interesting feature of the PCMH as an innovation is the lack
of defined boundaries between its individual components. Per Rogers’ diffusion of innovation theory,
15
the individual components of the medical home model could be described as technology clusters. They
are distinguishable yet closely interrelated, so experience with one component can influence the
adopter’s perception of other PCMH components.
Features of the PCMH model and its individual components, from the SBHC’s perspective,
influence their decision to adopt the model. The most important attributes of the innovation are its
relative advantage over other options, compatibility with needs and values, complexity, trialability, and
observability.105 With the conflicting evidence on the effectiveness of the PCMH at improving quality,
outcomes, and cost, SBHCs may be uncertain about the benefits of adopting the medical home model.
SBHCs may be more likely to adopt specific PCMH components that they believe will be more effective
for them, are easier to implement, and can demonstrate measurable positive results. Over time,
adoption of enough successful PCMH components may lead to overall PCMH model implementation.
Resource dependency theory, institutional theory, and diffusion of innovations theory all place
importance on the social system’s impact on the organization’s decision-making process. From a
resource dependency perspective, SBHCs may choose to pursue the medical home model if they feel it
will enhance their ability to obtain resources needed for their survival, such as enhanced payments from
insurance providers or the ability to attract more patients to their practice. The adoption of innovations
is a proactive decision made in the best interests of the organization to enhance its ability to survive and
decrease its interdependence on other organizations.106 Diffusion of innovations and institutional theory
take a slightly different approach to the role of the social system in the innovation adoption process.
These theories posit that actors in powerful positions influence the adoption decision process of
organizations lower in their social structure. For example, larger systems that an SBHC is a part of, like
their state Medicaid program or managed care organizations, may influence PCMH adoption by creating
baseline performance or infrastructure requirements for providers in their network. Diffusion of
innovations would describe this influence as a system norm that establishes expected behavior of its
16
members, and institutional theory might explain this behavior as coercive isomorphism because the
SBHC is dependent upon optimal payment arrangements with Medicaid and managed care.107 According
to institutional theory, SBHCs that are sponsored by organizations that are favorable to the PCMH model
may also experience normative isomorphism and will adopt PCMH components that are viewed
favorably by their sponsoring organization.107 Adopting the PCMH model may legitimize the SBHC and
establish it as a high-quality provider of primary care, thus ensuring its ongoing relationship with
insurance programs and its sponsoring organization. While the motivation for change is explained
slightly differently in each theory (e.g. strategic survival choice opposed to behavioral expectations), all
three are complementary to each other. Each theory recognizes that adoption happens because of
interorganizational dependence and influence of powerful external organizations, and organizations
adopt innovation to maintain or improve their status quo.
Both resource dependency theory and institutional theory have been used independently and in
combination to explain the adoption of innovations in health care settings.108-114 Categorization of key
internal and external organizational variables fluctuates between these articles based on the
organizational setting and perspectives of the researchers, as does the significance of the associations of
the theories’ tenets with the measured organizational outcome.115-117 Based on my understanding of the
PCMH model, SBHC setting, and similarities between the organizational and adoption of innovation
theories, I have defined three sets of variables that I propose will explain SBHCs’ adoption of the PCMH
care model (Table 1). My definition of the variable categories may differ slightly from the original
theories due to the theoretical pluralism and unique research perspective of SBHCs as medical homes.
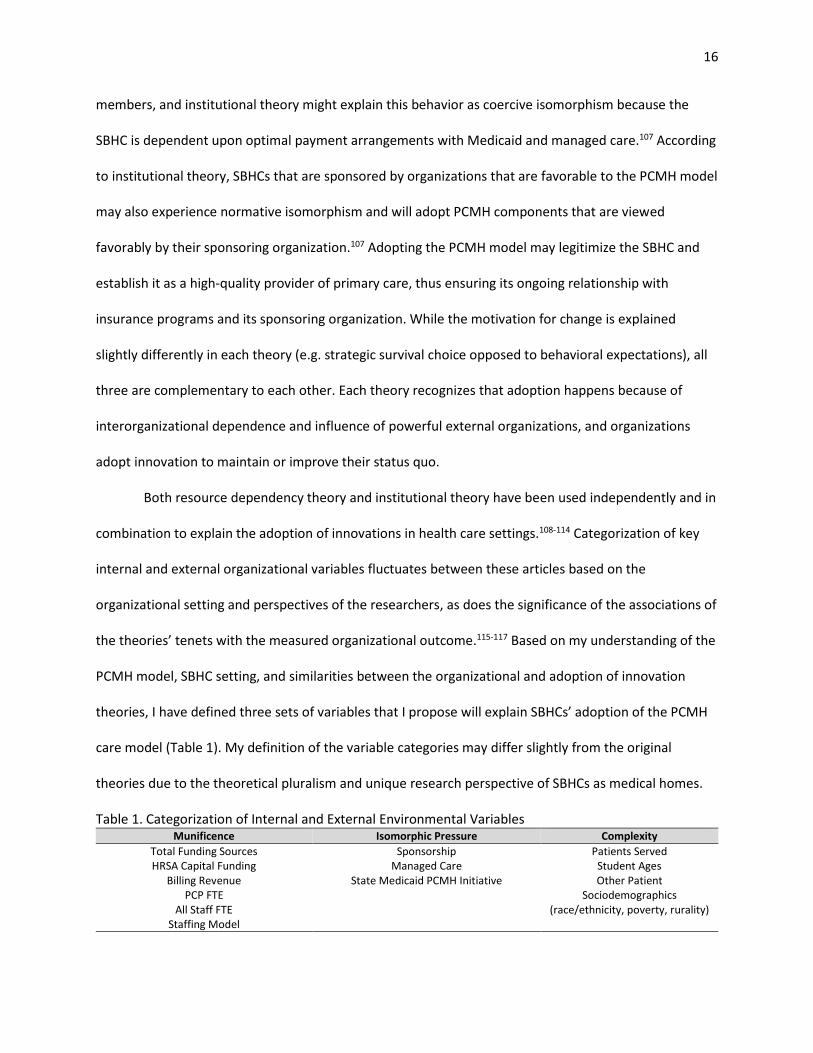
Table 1. Categorization of Internal and External Environmental Variables Munificence Isomorphic Pressure Complexity
Total Funding Sources Sponsorship Patients Served HRSA Capital Funding Managed Care Student Ages
Billing Revenue State Medicaid PCMH Initiative Other Patient Sociodemographics
(race/ethnicity, poverty, rurality) PCP FTE
All Staff FTE Staffing Model
17
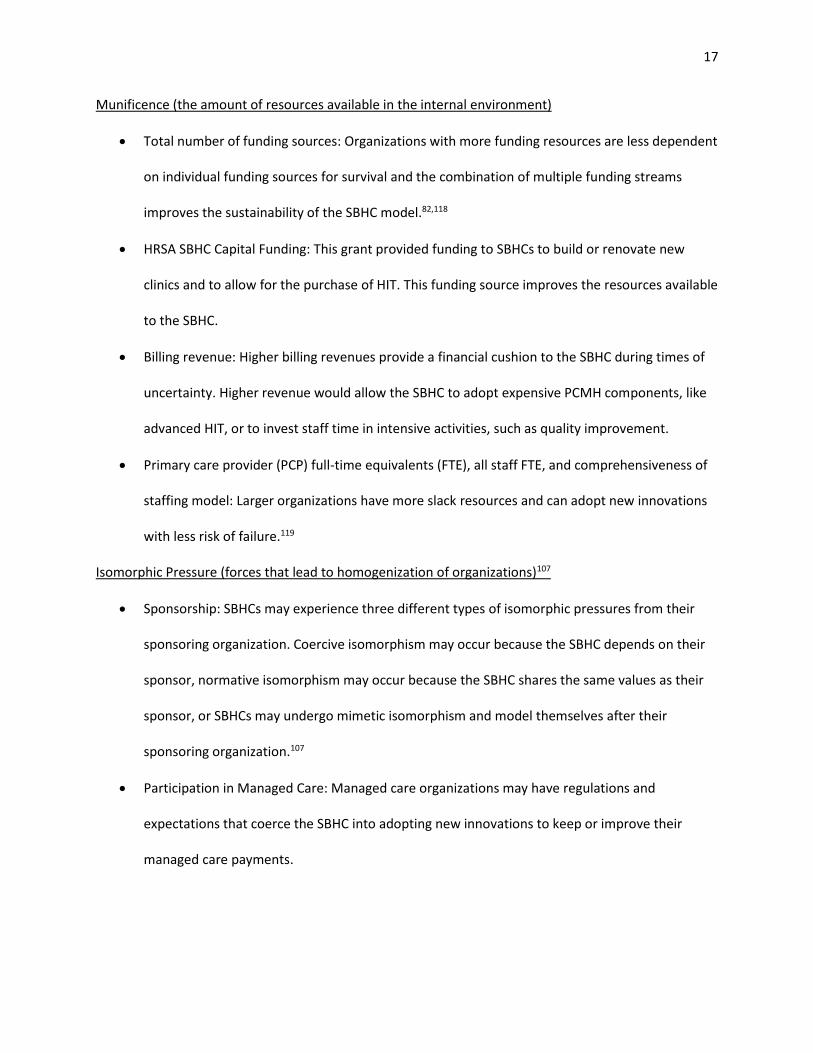
Munificence (the amount of resources available in the internal environment)
Total number of funding sources: Organizations with more funding resources are less dependent
on individual funding sources for survival and the combination of multiple funding streams
improves the sustainability of the SBHC model.82,118
HRSA SBHC Capital Funding: This grant provided funding to SBHCs to build or renovate new
clinics and to allow for the purchase of HIT. This funding source improves the resources available
to the SBHC.
Billing revenue: Higher billing revenues provide a financial cushion to the SBHC during times of
uncertainty. Higher revenue would allow the SBHC to adopt expensive PCMH components, like
advanced HIT, or to invest staff time in intensive activities, such as quality improvement.
Primary care provider (PCP) full-time equivalents (FTE), all staff FTE, and comprehensiveness of
staffing model: Larger organizations have more slack resources and can adopt new innovations
with less risk of failure.119
Isomorphic Pressure (forces that lead to homogenization of organizations)107
Sponsorship: SBHCs may experience three different types of isomorphic pressures from their
sponsoring organization. Coercive isomorphism may occur because the SBHC depends on their
sponsor, normative isomorphism may occur because the SBHC shares the same values as their
sponsor, or SBHCs may undergo mimetic isomorphism and model themselves after their
sponsoring organization.107
Participation in Managed Care: Managed care organizations may have regulations and
expectations that coerce the SBHC into adopting new innovations to keep or improve their
managed care payments.
18
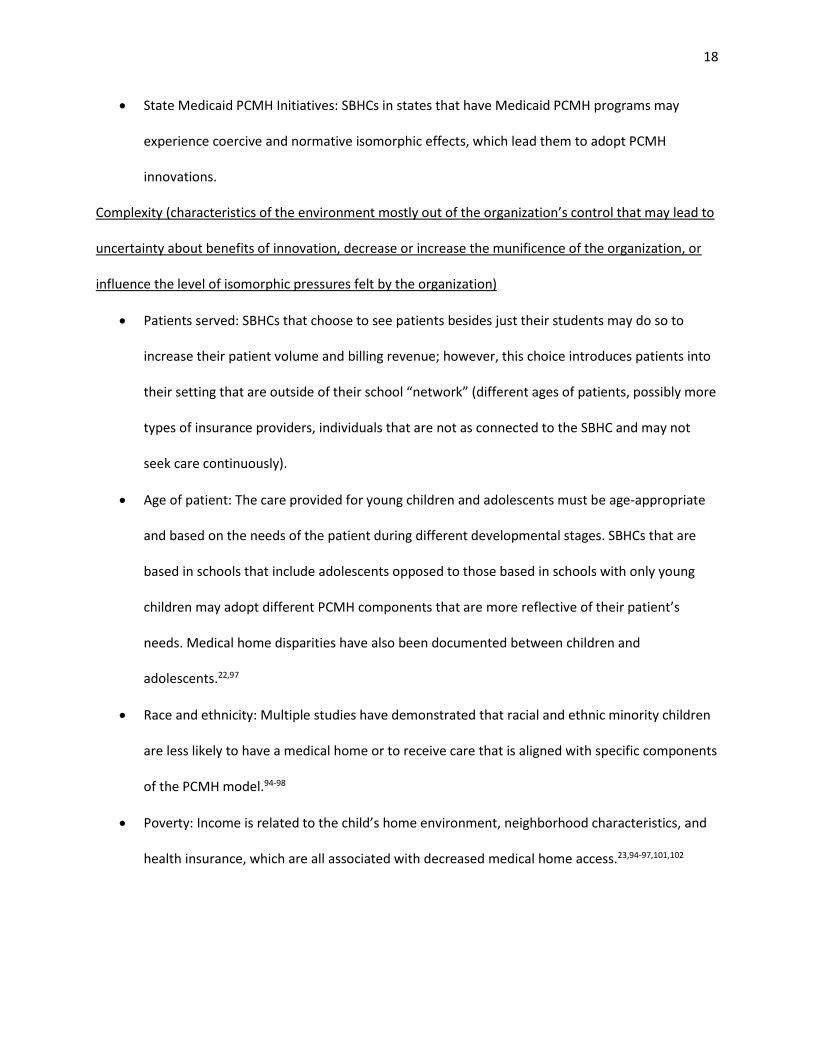
State Medicaid PCMH Initiatives: SBHCs in states that have Medicaid PCMH programs may
experience coercive and normative isomorphic effects, which lead them to adopt PCMH
innovations.
Complexity (characteristics of the environment mostly out of the organization’s control that may lead to
uncertainty about benefits of innovation, decrease or increase the munificence of the organization, or
influence the level of isomorphic pressures felt by the organization)
Patients served: SBHCs that choose to see patients besides just their students may do so to
increase their patient volume and billing revenue; however, this choice introduces patients into
their setting that are outside of their school “network” (different ages of patients, possibly more
types of insurance providers, individuals that are not as connected to the SBHC and may not
seek care continuously).
Age of patient: The care provided for young children and adolescents must be age-appropriate
and based on the needs of the patient during different developmental stages. SBHCs that are
based in schools that include adolescents opposed to those based in schools with only young
children may adopt different PCMH components that are more reflective of their patient’s
needs. Medical home disparities have also been documented between children and
adolescents.22,97
Race and ethnicity: Multiple studies have demonstrated that racial and ethnic minority children
are less likely to have a medical home or to receive care that is aligned with specific components
of the PCMH model.94-98
Poverty: Income is related to the child’s home environment, neighborhood characteristics, and
health insurance, which are all associated with decreased medical home access.23,94-97,101,102
19
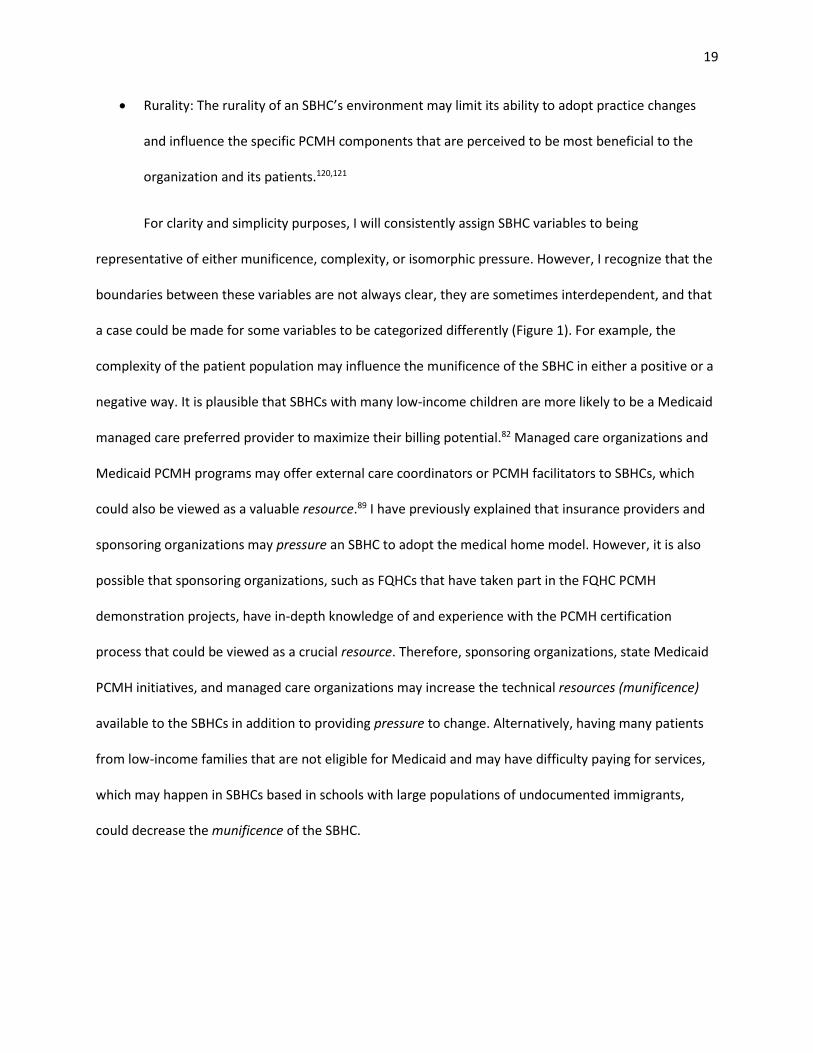
Rurality: The rurality of an SBHC’s environment may limit its ability to adopt practice changes
and influence the specific PCMH components that are perceived to be most beneficial to the
organization and its patients.120,121
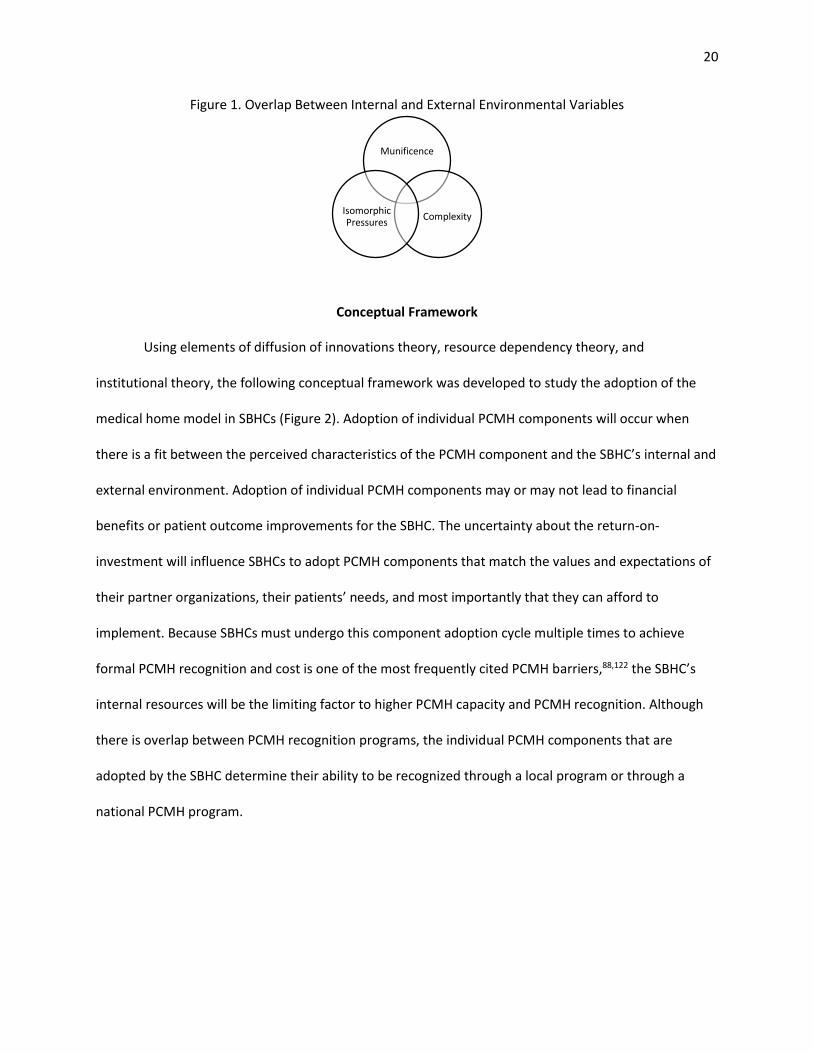
For clarity and simplicity purposes, I will consistently assign SBHC variables to being
representative of either munificence, complexity, or isomorphic pressure. However, I recognize that the
boundaries between these variables are not always clear, they are sometimes interdependent, and that
a case could be made for some variables to be categorized differently (Figure 1). For example, the
complexity of the patient population may influence the munificence of the SBHC in either a positive or a
negative way. It is plausible that SBHCs with many low-income children are more likely to be a Medicaid
managed care preferred provider to maximize their billing potential.82 Managed care organizations and
Medicaid PCMH programs may offer external care coordinators or PCMH facilitators to SBHCs, which
could also be viewed as a valuable resource.89 I have previously explained that insurance providers and
sponsoring organizations may pressure an SBHC to adopt the medical home model. However, it is also
possible that sponsoring organizations, such as FQHCs that have taken part in the FQHC PCMH
demonstration projects, have in-depth knowledge of and experience with the PCMH certification
process that could be viewed as a crucial resource. Therefore, sponsoring organizations, state Medicaid
PCMH initiatives, and managed care organizations may increase the technical resources (munificence)
available to the SBHCs in addition to providing pressure to change. Alternatively, having many patients
from low-income families that are not eligible for Medicaid and may have difficulty paying for services,
which may happen in SBHCs based in schools with large populations of undocumented immigrants,
could decrease the munificence of the SBHC.
20
Figure 1. Overlap Between Internal and External Environmental Variables
Conceptual Framework
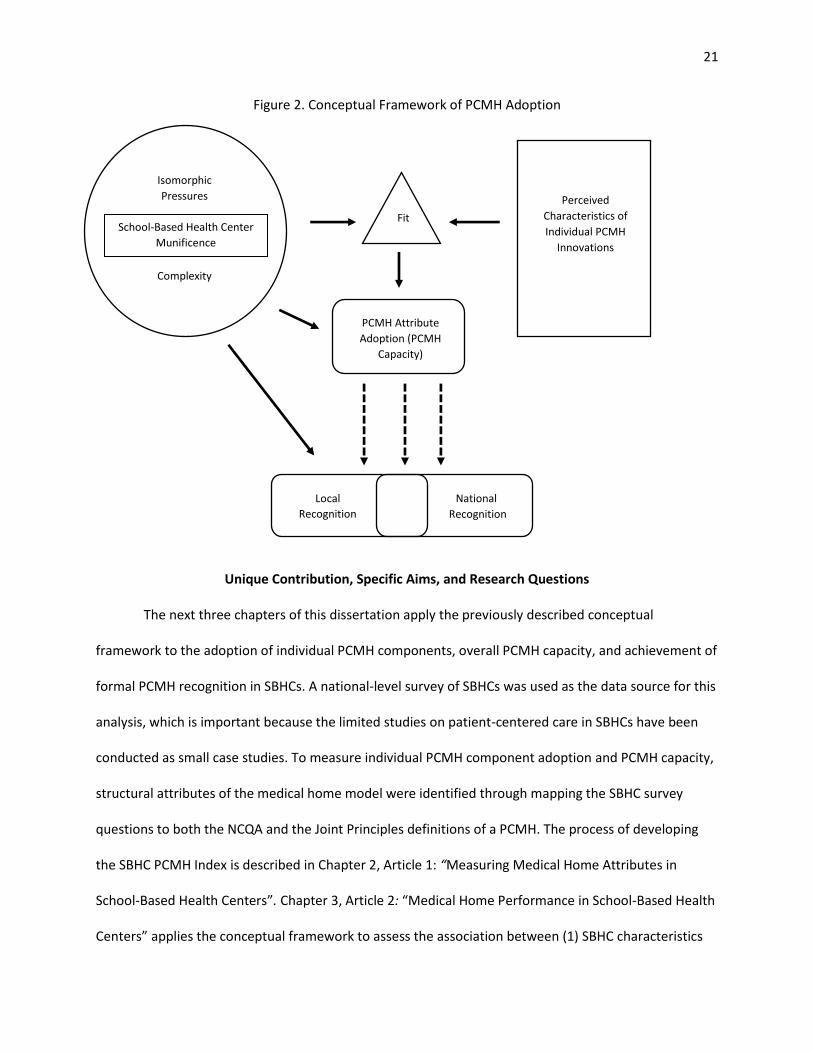
Using elements of diffusion of innovations theory, resource dependency theory, and
institutional theory, the following conceptual framework was developed to study the adoption of the
medical home model in SBHCs (Figure 2). Adoption of individual PCMH components will occur when
there is a fit between the perceived characteristics of the PCMH component and the SBHC’s internal and
external environment. Adoption of individual PCMH components may or may not lead to financial
benefits or patient outcome improvements for the SBHC. The uncertainty about the return-on-
investment will influence SBHCs to adopt PCMH components that match the values and expectations of
their partner organizations, their patients’ needs, and most importantly that they can afford to
implement. Because SBHCs must undergo this component adoption cycle multiple times to achieve
formal PCMH recognition and cost is one of the most frequently cited PCMH barriers,88,122 the SBHC’s
internal resources will be the limiting factor to higher PCMH capacity and PCMH recognition. Although
there is overlap between PCMH recognition programs, the individual PCMH components that are
adopted by the SBHC determine their ability to be recognized through a local program or through a
national PCMH program.
Munificence
ComplexityIsomorphic Pressures
21
Figure 2. Conceptual Framework of PCMH Adoption
Unique Contribution, Specific Aims, and Research Questions
The next three chapters of this dissertation apply the previously described conceptual
framework to the adoption of individual PCMH components, overall PCMH capacity, and achievement of
formal PCMH recognition in SBHCs. A national-level survey of SBHCs was used as the data source for this
analysis, which is important because the limited studies on patient-centered care in SBHCs have been
conducted as small case studies. To measure individual PCMH component adoption and PCMH capacity,
structural attributes of the medical home model were identified through mapping the SBHC survey
questions to both the NCQA and the Joint Principles definitions of a PCMH. The process of developing
the SBHC PCMH Index is described in Chapter 2, Article 1: “Measuring Medical Home Attributes in
School-Based Health Centers”. Chapter 3, Article 2: “Medical Home Performance in School-Based Health
Centers” applies the conceptual framework to assess the association between (1) SBHC characteristics
Fit
Isomorphic
Pressures
School-Based Health Center
Munificence
Complexity
Perceived
Characteristics of
Individual PCMH
Innovations
Local
Recognition
PCMH Attribute
Adoption (PCMH
Capacity)
National
Recognition
22
and individual PCMH component adoption, and (2) SBHC characteristics and PCMH capacity. Chapter 4,
Article 3: “Correlates of Patient-Centered Medical Home Recognition in School-Based Health Centers”
uses the framework to explain possible facilitators of formal medical home recognition. This dissertation
attempts to identify the current readiness of SBHCs to be medical homes, understand how medical
home adoption can be supported in SBHCs, and identify if SBHCs can offer patient-centered care to
pediatric populations that typically experience disparities in access to medical homes. The specific aims
of the three individual articles, along with their associated research questions, are listed below.
Article 1: Identifying Patient-Centered Medical Home Attributes in School-Based Health Centers
Specific Aim 1: Identify individual PCMH attributes and describe overall PCMH capacity in SBHCs.
Question 1.1: Are there specific PCMH components that are adopted consistently in SBHCs?
Question 1.2: Are there specific PCMH components that have low incidence of adoption in
SBHCs?
Question 1.3: Is there evidence of PCMH adoption disparities by SBHCs that serve different
student populations?
Article 2: Patient-Centered Medical Home Capacity in School-Based Health Centers
Specific Aim 2: Identify SBHC characteristics that are associated with the adoption of individual PCMH
components and overall PCMH capacity score.
Question 2.1: Are the internal munificence, patient population complexity, and external
isomorphic pressure variables associated with overall PCMH capacity?
Question 2.2: Are the internal munificence, patient population complexity, and external
isomorphic pressure variables associated with adoption of specific PCMH components?
Question 2.3: Between the three types of variables, is there one group that appears to be more
strongly associated with overall PCMH capacity and adoption of specific PCMH components?
23
Question 2.3: Controlling for other characteristics of the SBHC, is there evidence of PCMH
adoption disparities by SBHCs that serve different student populations?
Article 3: Correlates of Patient-Centered Medical Home Recognition in School-Based Health Centers
Specific Aim 3: Compare the SBHC characteristics associated with different PCMH recognition outcomes.
Question 3.1: Are the internal munificence, patient population complexity, and external
isomorphic pressure variables associated with formal PCMH recognition?
Question 3.2: Does how you define formal PCMH recognition affect associations between the
recognition outcome and the SBHC characteristics?
Question 3.3: Is there evidence of disparities in formal PCMH recognition achievement by SBHCs
that serve different student populations?
24
CHAPTER 2: IDENTIFYING PATIENT-CENTERED MEDICAL HOME ATTRIBUTES IN SCHOOL-BASED HEALTH
CENTERS
Abstract
Purpose: SBHCs have been suggested as potential medical homes, yet minimal attention has been paid
to measuring their progress towards implementing the PCMH model. Most SBHCs are based in schools
with adolescents, an age group that is known to be lacking access to medical homes. The purposes of
this article were to (1) develop an Index to measure PCMH attributes in SBHCs, (2) use the SBHC PCMH
Index to compare PCMH capacity between PCMH certified and non-PCMH SBHCs, and (3) examine
differences in SBHC PCMH Index scores between SBHCs based in schools with and without adolescents.
Methods: The 2013-2014 National Census of School-Based Health Centers was used as the primary data
source for this analysis. The SBHC PCMH Index was created by mapping questions from the Census to
PCMH elements in the National Committee for Quality Assurance’s (NCQA) PCMH 2014 Standards and
Guidelines and the Joint Principles of the Patient-Centered Medical Home. Exploratory factor analysis
was used to identify relationships between the selected PCMH attributes. PCMH capacity was compared
between SBHCs with different PCMH recognition status and by the primary student age group served by
the SBHC.
Results: A total of 6 PCMH dimensions were identified through exploratory factor analysis. These
dimensions were collapsed into two domains of Care Quality and Comprehensive Care. SBHCs
recognized as PCMHs had significantly higher scores in the total Index, in both domains, and four of the
six dimensions. There were no differences in total Index, domain, or dimension scores between SBHCs
based in schools with just children and those that also included adolescents, but there were differences
in the adoption of specific PCMH attributes.
Conclusions: The SBHC PCMH Index is the first known attempt to measure the presence of PCMH
attributes in a national survey of SBHCs. While not a comprehensive measurement of all PCMH

25
elements, the SBHC PCMH Index is a valid and reliable scale for measuring the PCMH construct in SBHCs.
SBHCs based in schools with just children and those with adolescents scored similarly on the overall
Index, but analysis of the individual Index items shows their respective strengths and weaknesses in
PCMH transformation.
26
Introduction
The concept of the medical home has evolved dramatically since 1967 when the AAP used the
term to describe a physical location of a child’s complete medical record.2 In 2002, the AAP expanded
their definition of a medical home to a service model for both pediatric and adult populations that
provides accessible, continuous, comprehensive, family-centered, coordinated, compassionate, and
culturally effective care. The Joint Principles of the Patient-Centered Medical Home published in 2007 by
the AAP, American Academy of Family Physicians, the American College of Physicians, and the American
Osteopathic Association also states that PCMHs should have high standards for quality and safety, and
that payment to PCMH providers should reflect the additional work and value provided to their
patients.7
Over half (57.9%) of U.S. children aged 1 to 17 years receive care from a medical home and
these children are less likely to have unmet medical needs.123 Evidence supporting the PCMH model of
care as a way to improve quality and health outcomes while reducing costs is somewhat mixed;
however, studies in pediatric populations have found associations between features of medical homes
and desirable health care utilizations (e.g. emergency department use, preventable hospitalizations, and
preventive health visits).14,18,34 Children with medical homes have also been found to receive higher
quality of care and have better health outcomes than children without medical homes.22,124 Parents of
children with medical homes also report higher levels of satisfaction and positive experiences.125
Despite research showing associations between the PCMH model and desirable outcomes, most
primary care practices treating children would not qualify for the lowest level of PCMH certification
offered by the NCQA, which is the most widely used standard for medical home programs.126,127 Among
pediatric providers, higher medical home infrastructure scores are seen in larger practices and in
practices with moderate levels of Medicaid patients.126 Multiple studies have also demonstrated
significant disparities in access to pediatric medical homes by patient characteristics. Children from

27
higher income families and those with private health insurance are more likely to have medical
homes.94,96,123 Significant disparities have also been seen in racial and ethnic minority children and in
children who live in less safe, less socially cohesive neighborhoods.94,98,123
Most SBHCs serve majority racial minority schools and are designed to address socioeconomic
barriers to accessing health care. SBHCs care for children that traditionally are less underserved by
medical homes, and the SBHCs’ ability to meet PCMH standards like the NCQA’s remains unclear.47 Every
child should have a medical home and many national and state-level initiatives have developed to
expand the PCMH model.128 This movement towards greater PCMH adoption is especially important for
SBHCs because racial and ethnic disparities in access to care and use of preventive services have been
found to decrease when minorities have access to a medical home.129
Efforts to promote the PCMH model in SBHCs will require information about the individual
PCMH attributes currently used in SBHCs. As a safety-net provider that primarily focuses on pediatric
populations, SBHCs may have unique features that promote or inhibit the adoption of specific
components of the medical home. Previous research has not evaluated differences in PCMH attribute
implementation between PCMH certified and non-certified SBHCs. Due to costs associated with
receiving national PCMH recognition, some SBHC providers not eligible for PCMH payment incentives
may choose not to seek formal certification but may still implement PCMH processes.
Additionally, differences in PCMH adoption and implementation between adolescent-serving
SBHCs and those based in schools with only young children has not been studied. This is a large gap in
the research because most SBHCs serve adolescents, yet older children are less likely to have a medical
home.47,123 This research addressed these underexplored areas in the literature and the specific
objectives of this study were to: (1) use data from a previously administered survey to develop an index
to measure PCMH attributes in SBHCs, (2) use the SBHC PCMH Index to compare the presence of PCMH
28
attributes between PCMH certified and non-PCMH SBHCs, and (3) examine differences in SBHC PCMH
Index scores between SBHCs based in schools with and without adolescents.
Methods
Study Participants and Data Collection
Data used in this study is from the 2013-2014 National Census of School-Based Health Centers.
The School-Based Health Alliance (SBHA) completes this triennial national survey of all known SBHCs and
includes questions about the SBHC’s organizational characteristics, population served, services offered,
policies and procedures, and PCMH certification. The survey is completed by the person most
knowledgeable about the clinical care provided in the SBHC. Survey respondents are asked to complete
a survey for each fixed SBHC site, so there are responses for each individual SBHC operated by the same
sponsoring organization. More detailed information about the School-Based Health Alliance Census
methodology can be found elsewhere.47 Of the 2,315 known SBHCs in the United States, 1,900
responded to the 2013-2014 Census. Of these 1,900 respondent SBHCs, only 1,507 provide primary care
services and reported their PCMH status, which was needed to assess validity of the SBHC PCMH Index.
The Index was developed and validated using complete case analysis, leaving 1,218 SBHCs as the final
sample size.
Instrument Development and Content Validity
The SBHC PCMH Index was created by identifying questions from the SBHA’s 2013-2014 Census
that were related to PCMH elements in the NCQA’s PCMH 2014 Standards and Guidelines and the Joint
Principles of the Patient-Centered Medical Home statement.7,11 Appendix A lists the questions from the
SBHA Census that were selected for initial inclusion into the SBHC PCMH Index and the corresponding
section of the NCQA or Joint Principles that is related to the SBHC survey item. Two questions in the
index only apply to clinics serving adolescents (e.g. depression screening and substance abuse) and are
not included in calculating the Index score for SBHCs located in schools without adolescents.
29
All items on the index were measured dichotomously as “yes” or “no”. For Census questions
where respondents were asked to choose from a variety of answers, the responses that were coded as
“yes” for the Index are listed in Appendix A below the actual Census question. A SBHC would need to
only answer one of the options positively to receive a score of “yes” on the Index; for example, an SBHC
that allows either students or parents/guardians to participate in health center committees, advisory
council, or Board would be scored as a “yes”. There is one exception to this scoring rule: the Index item
assessing if the SBHC provides structured health education requires the respondent to positively
respond to two of the three health education topics listed to be scored as a “yes” for this item.
Scale Reliability and Dimensionality
Exploratory factor analysis using a tetrachoric correlations matrix was used to identify the
underlying relationship between the PCMH attributes measured in the Index. Principal factors method
with orthogonal varimax rotation were used to conduct the factor analysis. Four items were excluded
from the final Index due to low correlation with other variables and poor factor loading scores. Factor
analysis and scale reliability rests were conducted for both the adolescent Index (18 questions) and the
child Index (16 questions). Factors more strongly correlated with each other were grouped into two
domains, Care Quality and Comprehensive Care. The reliability of the SBHC PCMH Index was then
assessed by measuring the internal consistency of the multiple Index domains, dimensions, and the
internal consistency of the overall scale using Cronbach’s alpha.130 A minimum alpha score of 0.7 is
usually recommended for use in assessing scale reliability.131
Analysis of SBHC PCMH Index Score
To calculate the Index scores, each question could receive a value of either 0 (“no”) or 1 (“yes”).
The adolescent Index had a possible total 18 points and the child Index had a possible total 16 points
due to question differences in the Comprehensive Care domain. So the scores on the adolescent and
child Index can be analyzed together, scoring for each dimension is calculated as the percent of total
30
points received. The scaled domain scores are calculated by averaging the mean scaled scores on each
dimension and the overall scaled Index score is calculated by averaging the scaled scores for each
domain. This scoring method assumes an equal weight to each PCMH dimension and prevents
higher/lower scores on the overall Index due to performance in one dimension with more/less
questions. The mean total Index, Care Quality domain, and Comprehensive Care domain scores were
then compared across PCMH status and student age categories using two sample t-tests. The presence
of each PCMH attribute in the Index was also compared across PCMH status and student age categories.
SBHC Characteristics
SBHCs were split into those based in schools that only have prekindergarten through fifth grade
and those that serve at least one grade of sixth or above. This categorization splits the schools into those
with only young children and those that have adolescents in their student population. SBHCs were also
categorized by their PCMH status. SBHCs that reported NCQA, Joint Commission, and other types of
state or insurance provider PCMH recognition were considered PCMH certified.
Results
Instrument Validity and Reliability
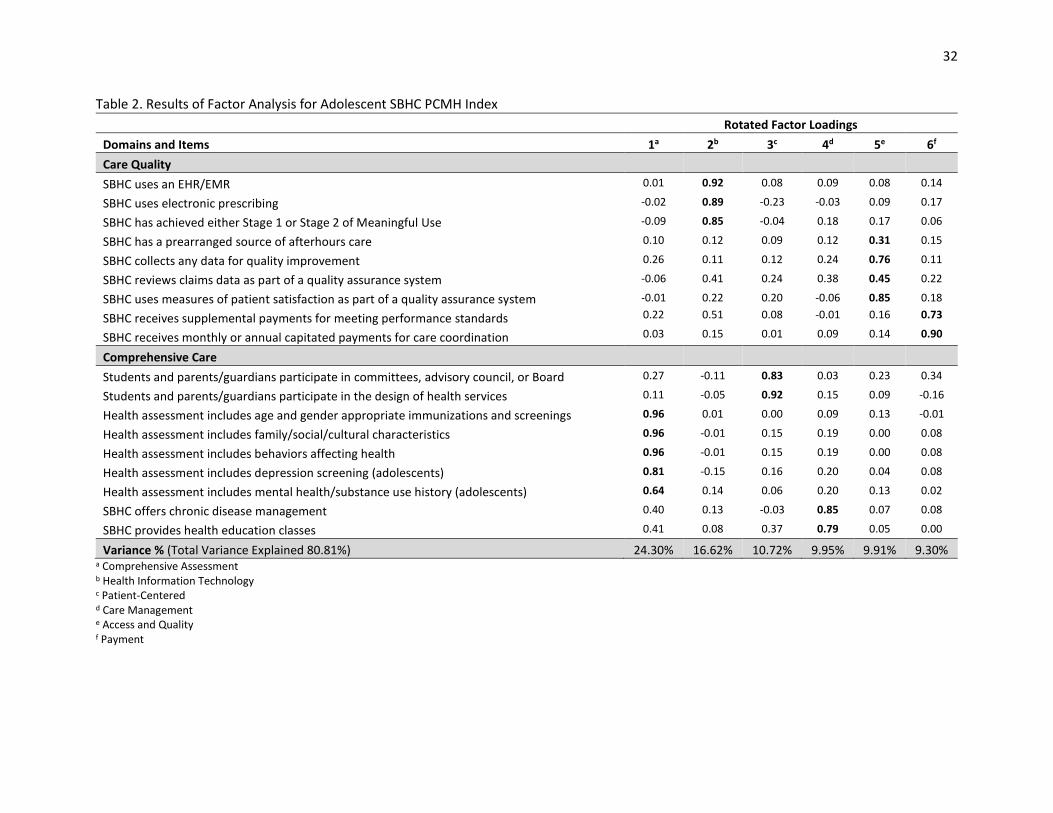
A total of six PCMH dimensions were identified through exploratory factor analysis (Table 2).
Factor analysis initially yielded seven dimensions with eigenvalues above 1, but only item “SBHC has a
prearranged source of afterhours care” loaded on to the seventh dimension. Only six factors were
retained after reviewing the scree plot and because the afterhours item loaded moderately strongly
(eigenvalue of 0.31) onto factor five. The factor analysis for the Index including the two adolescent
questions is shown in Table 2, and similar factor loadings were found for the child Index excluding these
questions. Two PCMH domains were created based on the correlations between the identified
dimensions. Each domain had a Cronbach’s alpha score that met minimum requirements for scale

31
reliability (Table 3). The overall SBHC PCMH Index had Cronbach’s alpha scores of 0.77 and 0.74 for the
adolescent and child Indexes respectively, and cleared the generally accepted threshold of 0.7.
32
Table 2. Results of Factor Analysis for Adolescent SBHC PCMH Index
Rotated Factor Loadings
Domains and Items 1a 2b 3c 4d 5e 6f
Care Quality
SBHC uses an EHR/EMR 0.01 0.92 0.08 0.09 0.08 0.14
SBHC uses electronic prescribing -0.02 0.89 -0.23 -0.03 0.09 0.17
SBHC has achieved either Stage 1 or Stage 2 of Meaningful Use -0.09 0.85 -0.04 0.18 0.17 0.06
SBHC has a prearranged source of afterhours care 0.10 0.12 0.09 0.12 0.31 0.15
SBHC collects any data for quality improvement 0.26 0.11 0.12 0.24 0.76 0.11
SBHC reviews claims data as part of a quality assurance system -0.06 0.41 0.24 0.38 0.45 0.22
SBHC uses measures of patient satisfaction as part of a quality assurance system -0.01 0.22 0.20 -0.06 0.85 0.18
SBHC receives supplemental payments for meeting performance standards 0.22 0.51 0.08 -0.01 0.16 0.73
SBHC receives monthly or annual capitated payments for care coordination 0.03 0.15 0.01 0.09 0.14 0.90
Comprehensive Care
Students and parents/guardians participate in committees, advisory council, or Board 0.27 -0.11 0.83 0.03 0.23 0.34
Students and parents/guardians participate in the design of health services 0.11 -0.05 0.92 0.15 0.09 -0.16
Health assessment includes age and gender appropriate immunizations and screenings 0.96 0.01 0.00 0.09 0.13 -0.01
Health assessment includes family/social/cultural characteristics 0.96 -0.01 0.15 0.19 0.00 0.08
Health assessment includes behaviors affecting health 0.96 -0.01 0.15 0.19 0.00 0.08
Health assessment includes depression screening (adolescents) 0.81 -0.15 0.16 0.20 0.04 0.08
Health assessment includes mental health/substance use history (adolescents) 0.64 0.14 0.06 0.20 0.13 0.02
SBHC offers chronic disease management 0.40 0.13 -0.03 0.85 0.07 0.08
SBHC provides health education classes 0.41 0.08 0.37 0.79 0.05 0.00
Variance % (Total Variance Explained 80.81%) 24.30% 16.62% 10.72% 9.95% 9.91% 9.30% a Comprehensive Assessment b Health Information Technology c Patient-Centered d Care Management e Access and Quality f Payment
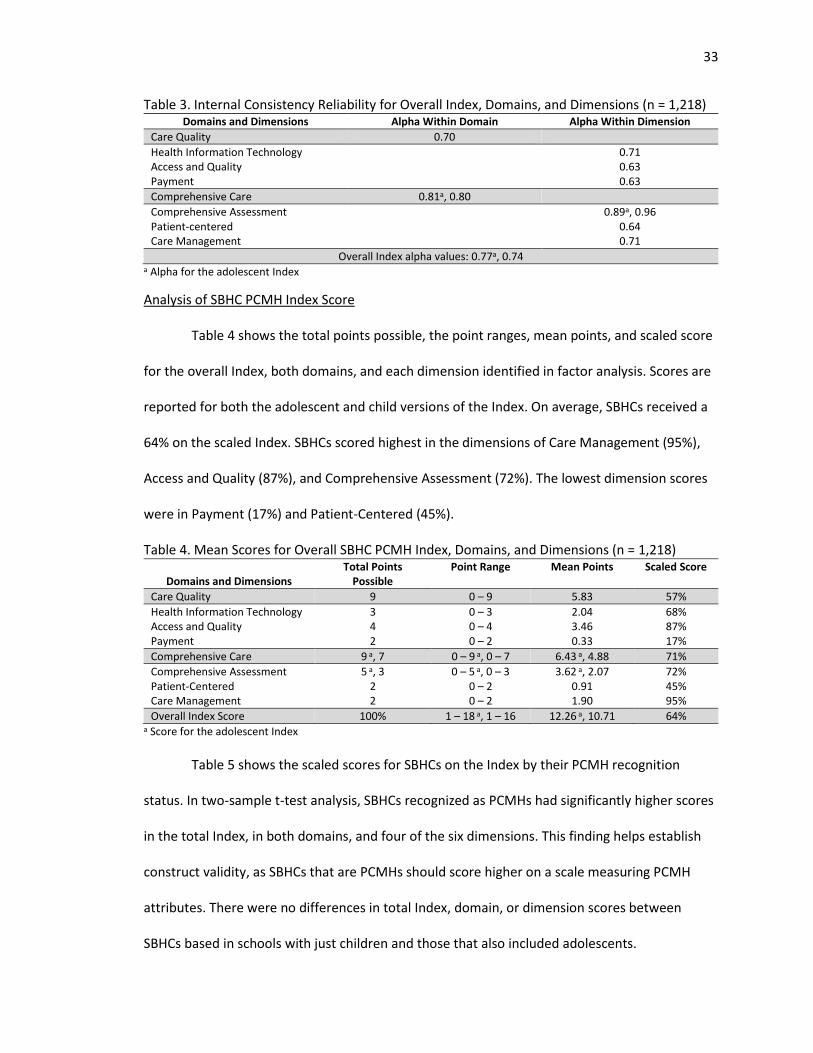
33
Table 3. Internal Consistency Reliability for Overall Index, Domains, and Dimensions (n = 1,218) Domains and Dimensions Alpha Within Domain Alpha Within Dimension
Care Quality 0.70
Health Information Technology 0.71 Access and Quality 0.63 Payment 0.63
Comprehensive Care 0.81a, 0.80
Comprehensive Assessment 0.89a, 0.96 Patient-centered 0.64 Care Management 0.71
Overall Index alpha values: 0.77a, 0.74 a Alpha for the adolescent Index
Analysis of SBHC PCMH Index Score
Table 4 shows the total points possible, the point ranges, mean points, and scaled score
for the overall Index, both domains, and each dimension identified in factor analysis. Scores are
reported for both the adolescent and child versions of the Index. On average, SBHCs received a
64% on the scaled Index. SBHCs scored highest in the dimensions of Care Management (95%),
Access and Quality (87%), and Comprehensive Assessment (72%). The lowest dimension scores
were in Payment (17%) and Patient-Centered (45%).
Table 4. Mean Scores for Overall SBHC PCMH Index, Domains, and Dimensions (n = 1,218)
Domains and Dimensions Total Points
Possible Point Range Mean Points Scaled Score
Care Quality 9 0 – 9 5.83 57%
Health Information Technology 3 0 – 3 2.04 68% Access and Quality 4 0 – 4 3.46 87% Payment 2 0 – 2 0.33 17%
Comprehensive Care 9 a, 7 0 – 9 a, 0 – 7 6.43 a, 4.88 71%
Comprehensive Assessment 5 a, 3 0 – 5 a, 0 – 3 3.62 a, 2.07 72% Patient-Centered 2 0 – 2 0.91 45% Care Management 2 0 – 2 1.90 95%
Overall Index Score 100% 1 – 18 a, 1 – 16 12.26 a, 10.71 64% a Score for the adolescent Index
Table 5 shows the scaled scores for SBHCs on the Index by their PCMH recognition
status. In two-sample t-test analysis, SBHCs recognized as PCMHs had significantly higher scores
in the total Index, in both domains, and four of the six dimensions. This finding helps establish
construct validity, as SBHCs that are PCMHs should score higher on a scale measuring PCMH
attributes. There were no differences in total Index, domain, or dimension scores between
SBHCs based in schools with just children and those that also included adolescents.
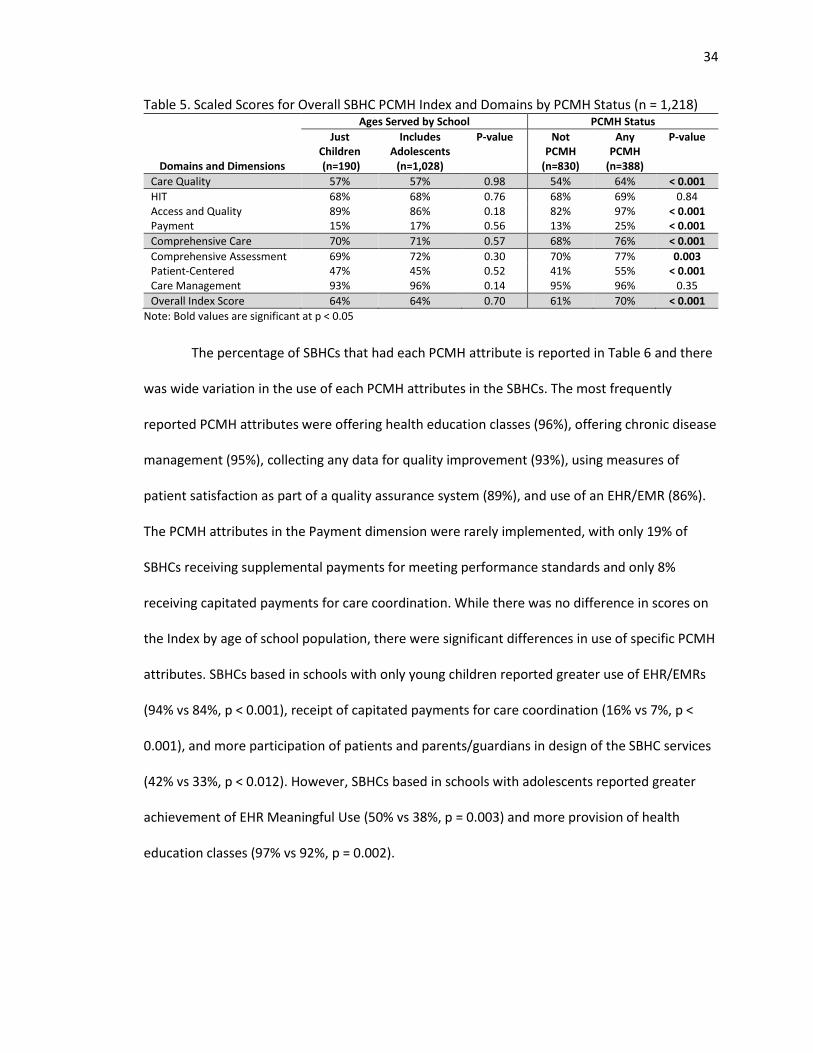
34
Table 5. Scaled Scores for Overall SBHC PCMH Index and Domains by PCMH Status (n = 1,218) Ages Served by School PCMH Status
Domains and Dimensions
Just Children (n=190)
Includes Adolescents
(n=1,028)
P-value Not PCMH
(n=830)
Any PCMH
(n=388)
P-value
Care Quality 57% 57% 0.98 54% 64% < 0.001
HIT 68% 68% 0.76 68% 69% 0.84 Access and Quality 89% 86% 0.18 82% 97% < 0.001 Payment 15% 17% 0.56 13% 25% < 0.001
Comprehensive Care 70% 71% 0.57 68% 76% < 0.001
Comprehensive Assessment 69% 72% 0.30 70% 77% 0.003 Patient-Centered 47% 45% 0.52 41% 55% < 0.001 Care Management 93% 96% 0.14 95% 96% 0.35
Overall Index Score 64% 64% 0.70 61% 70% < 0.001
Note: Bold values are significant at p < 0.05
The percentage of SBHCs that had each PCMH attribute is reported in Table 6 and there
was wide variation in the use of each PCMH attributes in the SBHCs. The most frequently
reported PCMH attributes were offering health education classes (96%), offering chronic disease
management (95%), collecting any data for quality improvement (93%), using measures of
patient satisfaction as part of a quality assurance system (89%), and use of an EHR/EMR (86%).
The PCMH attributes in the Payment dimension were rarely implemented, with only 19% of
SBHCs receiving supplemental payments for meeting performance standards and only 8%
receiving capitated payments for care coordination. While there was no difference in scores on
the Index by age of school population, there were significant differences in use of specific PCMH
attributes. SBHCs based in schools with only young children reported greater use of EHR/EMRs
(94% vs 84%, p < 0.001), receipt of capitated payments for care coordination (16% vs 7%, p <
0.001), and more participation of patients and parents/guardians in design of the SBHC services
(42% vs 33%, p < 0.012). However, SBHCs based in schools with adolescents reported greater
achievement of EHR Meaningful Use (50% vs 38%, p = 0.003) and more provision of health
education classes (97% vs 92%, p = 0.002).
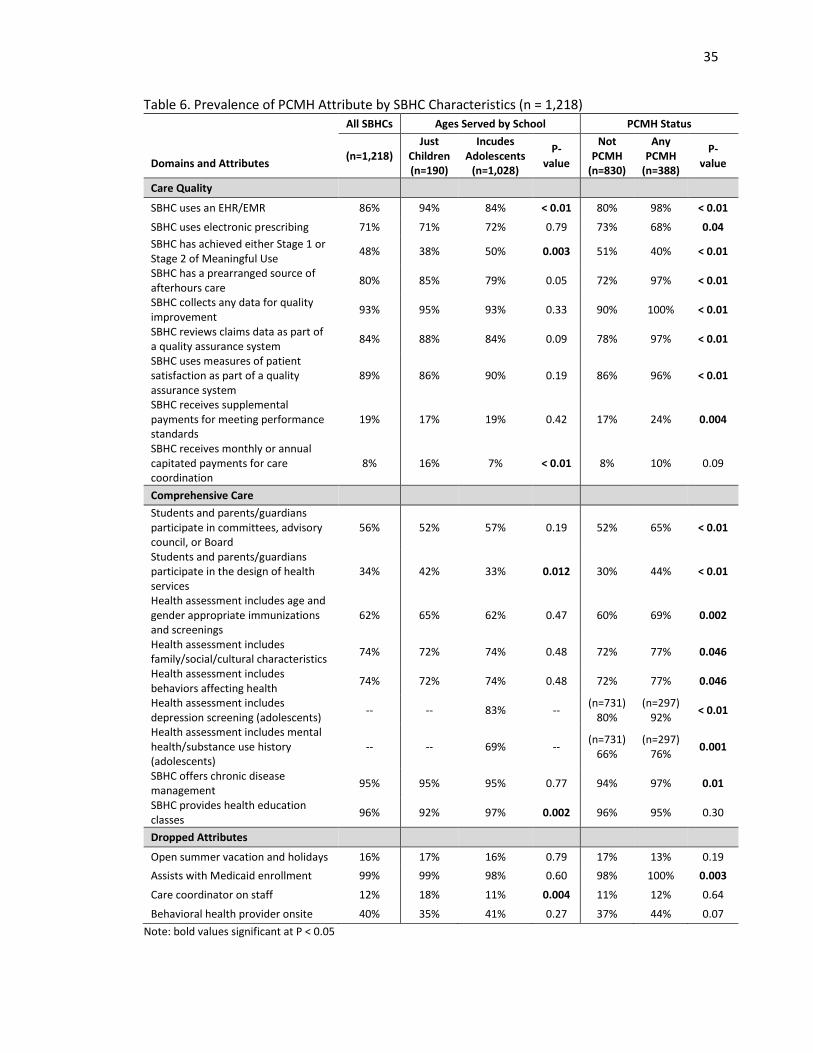
35
Table 6. Prevalence of PCMH Attribute by SBHC Characteristics (n = 1,218) All SBHCs Ages Served by School PCMH Status
Domains and Attributes
(n=1,218) Just
Children (n=190)
Incudes Adolescents
(n=1,028)
P-value
Not PCMH
(n=830)
Any PCMH
(n=388)
P-value
Care Quality
SBHC uses an EHR/EMR 86% 94% 84% < 0.01 80% 98% < 0.01
SBHC uses electronic prescribing 71% 71% 72% 0.79 73% 68% 0.04
SBHC has achieved either Stage 1 or Stage 2 of Meaningful Use
48% 38% 50% 0.003 51% 40% < 0.01
SBHC has a prearranged source of afterhours care
80% 85% 79% 0.05 72% 97% < 0.01
SBHC collects any data for quality improvement
93% 95% 93% 0.33 90% 100% < 0.01
SBHC reviews claims data as part of a quality assurance system
84% 88% 84% 0.09 78% 97% < 0.01
SBHC uses measures of patient satisfaction as part of a quality assurance system
89% 86% 90% 0.19 86% 96% < 0.01
SBHC receives supplemental payments for meeting performance standards
19% 17% 19% 0.42 17% 24% 0.004
SBHC receives monthly or annual capitated payments for care coordination
8% 16% 7% < 0.01 8% 10% 0.09
Comprehensive Care
Students and parents/guardians participate in committees, advisory council, or Board
56% 52% 57% 0.19 52% 65% < 0.01
Students and parents/guardians participate in the design of health services
34% 42% 33% 0.012 30% 44% < 0.01
Health assessment includes age and gender appropriate immunizations and screenings
62% 65% 62% 0.47 60% 69% 0.002
Health assessment includes family/social/cultural characteristics
74% 72% 74% 0.48 72% 77% 0.046
Health assessment includes behaviors affecting health
74% 72% 74% 0.48 72% 77% 0.046
Health assessment includes depression screening (adolescents)
-- -- 83% -- (n=731)
80% (n=297)
92% < 0.01
Health assessment includes mental health/substance use history (adolescents)
-- -- 69% -- (n=731)
66% (n=297)
76% 0.001
SBHC offers chronic disease management
95% 95% 95% 0.77 94% 97% 0.01
SBHC provides health education classes
96% 92% 97% 0.002 96% 95% 0.30
Dropped Attributes
Open summer vacation and holidays 16% 17% 16% 0.79 17% 13% 0.19
Assists with Medicaid enrollment 99% 99% 98% 0.60 98% 100% 0.003
Care coordinator on staff 12% 18% 11% 0.004 11% 12% 0.64
Behavioral health provider onsite 40% 35% 41% 0.27 37% 44% 0.07
Note: bold values significant at P < 0.05
36
Discussion
Using factor analysis, attributes of the PCMH model of care were grouped into six
dimensions and two domains to create the SBHC PCMH Index. The analyses in this study
demonstrated reliability and evidence of content and construct validity for the SBHC PCMH
Index. The overall Index score, both domains, and half of the dimensions met the 0.7 alpha
requirement for scale reliability.131 The alpha scores of the overall Index and Index components
may be underestimated because both the domains and the Index are multi-dimensional.132,133
The multi-dimensionality of the PCMH scale is to be expected as even one of the simpler
definitions of a PCMH from the Agency for Healthcare Research and Quality contains five
separate but related components: (1) comprehensive care, (2) patient-centered care, (3)
coordinated care, (4) accessible services, and (5) quality and safety.1
There were significant Index score differences between SBHCs that were and were not
PCMH recognized, which demonstrated that the SBHC PCMH Index accurately reflects attributes
associated with the PCMH model. SBHCs that had received recognition as a PCMH scored
significantly higher on the overall Index score, both domains, and four of the six dimensions,
demonstrating convergent construct validity between the SBHC PCMH Index and PCMH status.
However, there were no significant differences on the dimension scores of Health Information
Technology and Care Management by SBHC PCMH designation. In the Care Management
dimension, there was high overall implementation by all SBHCs of both PCMH attributes of
chronic disease management (95%) and health education classes (95%). SBHCs with PCMH
recognition were significantly associated with offering chronic disease management (97% vs.
94%, p = 0.01), but no difference was found with offering health education classes. The
insignificant difference on this attribute and high overall level of attribute implementation
demonstrates that SBHCs do quite well on offering health education to their patients, most
37
likely due to their non-traditional setting which might facilitate group or classroom
opportunities for health education.
The Health Information Technology dimension contained three attributes and for each
attribute, there was a significant difference in use by PCMH designation. SBHCs with any PCMH
designation reported greater use of EHR/EMRs, but were less likely to use electronic prescribing
or to have achieved Meaningful Use attestation. This somewhat contradictory finding can be
explained by looking at the type of PCMH designation the SBHC achieved (analysis not shown);
in both attribute cases, the SBHCs with national PCMH recognition had the highest scores and
SBHCs with state or local PCMH designation reported lower use than SBHCs without any type of
PCMH designation. This finding might reflect significant differences between the requirements
of different PCMH programs, with state or local PCMH programs requiring less sophisticated use
of HIT. The NCQA PCMH certification heavily emphasizes HIT use as critical for practice
transformation and incorporates Meaningful Use language in its scoring, but does not require
EHRs for PCMH certification.134 The HIT and patient-data emphasis of the NCQA program was
initially criticized for seemingly undervaluing other elements of the PCMH model, but enhanced
use of EHRs may lead to the PCMH’s goal of better care quality.135,136 Care quality improvements
in PCMH settings are possible even without EHR use, but improvements are enabled by HIT.137
While beyond the scope of this research, further efforts should evaluate if different EHR
requirements between PCMH certification programs may explain why some clinics adopting the
PCMH model have not seen significant improvements in their quality of care.
Overall, SBHCs are doing well with implementing certain elements of the PCMH model.
On the SBHC PCMH Index, SBHCs scored highest in the Care Management and Access and
Quality dimensions. The lowest scores were in the Patient-Centered and Payment dimensions.
Compared to a study of NCQA PCMH certified primary care clinics that used a different scale to
38
measure PCMH capacity, SBHCs had higher scores in patient care management, quality
improvement, and expanded access. Only 52.8% of the NQCA PCMH clinics received a full NCQA
score on afterhours coverage, but 80% of all SBHCs and 97% of PCMH SBHCs reported having a
prearranged source of afterhours care.138 Enhanced access to care is an important element of
the PCMH model and is associated with higher quality of care.27,139 Compared to the practices in
the other study, SBHCs had a lower use of e-prescribing and most likely lower implementation of
more advanced HIT reflected by low Meaningful Use attestation.138
On average, pediatric clinics only scored 38% on a NCQA-based PCMH scoring tool.126
This is much lower than the average score of 68% achieved by SBHCs on the SBHC PCMH Index;
however, similar scoring trends such as lower scores with HIT and high use of health education
were seen in the NCQA-based study and with the SBHC PCMH Index.126 While there are
comparability issues between these studies due to differences in scoring the PCMH elements, it
does provide some evidence of areas where SBHCs are performing well and where they may
need additional support. One dimension that SBHCs performed quite poorly on in the SBHC
PCMH Index is participation in the payment practices supportive of PCMH. Only 19% received
supplemental payments for meeting performance standards and 8% received capitated
payments for care coordination. Financial incentives are a primary driver of PCMH
transformation in small primary care practices and safety-net clinics, so additional efforts to
include SBHCs in insurance payment reform initiatives may be needed to increase adoption of
the medical home model.140,141
The Index scores did not significantly differ between SBHCs based in schools with and
without adolescents, which is dissimilar to previous research that found older children were less
likely to have a medical home.123 Nevertheless, there were significant differences in the use of
specific PCMH attributes between SBHCs based in schools with these different student
39
populations. Most SBHCs are in schools with adolescents, and these SBHCs had lower use of
EHR/EMRs, receipt of capitated payments for care coordination, and less participation of
patients and parents/guardians in design of the SBHC services. The low use of paid care
coordination activities and participation of parents/guardians in design of the SBHC services may
be related; previous research has found that physicians are less likely than parents to identify a
need for care coordination.142 Without parents/guardian participation in service design, SBHC
administrators may underestimate the need for care coordination services. Care coordination
services may be especially needed in SBHC settings where children and their families may have
language barriers, inadequate health insurance, and lower income levels that make navigating
the health care system difficult. In SBHCs with adolescents, care coordinators can play an
important role in planning for transitioning the child to adult health care providers, which can be
a difficulty and time consuming process.143
Overall, 48% of SBHCs achieved Meaningful Use, higher than the national pediatrician
Meaningful Use participation rate of less than 20%.144 Pediatrician participation in Meaningful
Use is hindered by many providers not meeting the eligibility threshold of 20% of encounters
being with Medicaid patients. Program eligibility may not be a problem for SBHCs because a
high percent of their patient population has Medicaid coverage.144 However, Meaningful Use
incentives and most national quality measurements are more aligned with improving care in
adult populations and may not reflect the unique medical needs of children and adolescents.144-
146 Meaningful Use attestation may have been higher in adolescent-serving SBHCs because the
Meaningful Use criteria may be more relevant for providers treating older children. Given the
importance of EHRs for achieving PCMH practice transformation and the high costs of
purchasing EHRs, it is important that the programs incentivizing advanced EHR use are
applicable for pediatric providers.
40
Health education was offered more in adolescent-serving SBHCs, a similar finding to
other research that found school health education becomes more comprehensive as grade level
increases.147 This may be because older children are perceived to have a greater ability to be
active participants in managing their own health. However, health education and promotion
programs designed for young children have been successful in improving their knowledge and
health outcomes in several areas, such as asthma, dental health, and nutrition.148-150 Even
though health education offering was high in all SBHCs, there is still some room for SBHCs
serving young children to improve their health promotion activities.
The SBHC PCMH Index is the first known attempt to measure the presence of PCMH
attributes in a national survey of SBHCs. The SBHC PCMH Index met scale reliability and validity
requirements, but there are some limitations to this research. The SBHC PCMH is not an
exhaustive scoring scale that represents all the PCMH elements that a primary care practice
should implement to meet NCQA or Joint Principles PCMH standards. The initial Index included
more questions that attempted to measure NCQA PCMH attributes, but these questions
measuring elements of care coordination, patient-centered access, and team-based care were
dropped during factor analysis. Care coordination is an important element of the PCMH model
and is associated with improvements in health care utilization and patient satisfaction.36,151
Despite its importance to the PCMH model, this element is only measured in the SBHC PCMH
Index by the question asking if the SBHC receives capitated payments for care coordination. The
SBHA Census does include a question asking if the SBHC has a care coordinator, but this was
dropped from the final Index due to poor loading in factor analysis and insignificant correlation
with other Index items. The item’s poor performance on factor analysis might be explained by
the overall limited use of care coordinators; only 8% of all SBHCs and 10% of PCMH recognized
SBHCs reported having a care coordinator. Due to their small staff sizes, SBHCs may instead rely
41
on nurses to handle care coordination activities instead of hiring dedicated care coordinators.
The SBHA census question does not capture if other staff members perform care coordination
duties, so the use of care coordination by SBHCs was probably underestimated by the question
asking about having a care coordinator on staff.
The final SBHC PCMH Index also dropped a Census question picked to represent a
“must-pass” PCMH element per the NCQA, providing same-day appointments. Attempts to
address this item in the Index were unsuccessful as the questions asking SBHCs about how many
days per week they were open and if they were open during holidays and summer vacation
were dropped due to insignificant associations with PCMH status and weak loading during factor
analysis. Only 14% of PCMH recognized SBHCs were open five days a week and when the school
was closed. This indicates that many SBHCs are partnering with their sponsoring organization or
another outside clinic to provide same-day appointments to their patients when the SBHC is
closed instead of extending their own clinic hours. Also, the question if the SBHC helps their
patients with enrollment in public health insurance had a poor correlation with other Index
items because almost 99% of SBHCs do this regardless of their PCMH status. It was not possible
to measure other NCQA PCMH elements such as care continuity, medication management, test
and referral tracking, and culturally appropriate care using the SBHC Census questions.
However, primary care practices that have a high prevalence of minorities and economically
disadvantaged patients are more likely than other practices to offer interpreters, multilingual
clinicians, and multi-functional EHR systems.152 So while these elements are not represented in
this Index, SBHCs may be doing well in these components of the PCMH model.
Implications and Contributions
The SBHC PCMH Index is the first known attempt to measure the presence of PCMH
attributes in a national survey of SBHCs. While not a comprehensive measurement of all PCMH
42
elements, the SBHC PCMH Index can be used to measure the PCMH construct in SBHCs. SBHCs
based in schools with just young children and those with adolescents scored similarly on the
overall Index, but analysis of the individual Index items shows their respective strengths and
weaknesses in specific elements of the PCMH model. The Index also identified specific areas
where all SBHCs could improve their service delivery. The lowest scores on the Index were found
in the dimensions of Payment and Patient-Centered. State Medicaid programs and private
insurance companies should make additional efforts to involve SBHCs in their value-based
payment programs and SBHCs should improve their internal processes to better involve patients
in the design of services offered by the SBHC.
43
CHAPTER 3: PATIENT-CENTERED MEDICAL HOME CAPACITY IN SCHOOL-BASED HEALTH
CENTERS
Abstract
Purpose: Both high levels of overall PCMH capacity and implementation of specific PCMH
components are associated with better quality of care and health care utilization in pediatric
populations. SBHCs have been suggested as potential medical homes, but may experience
challenges implementing the PCMH model. It is currently unknown if there are variations in
medial home adoption among different types of SBHCs. Therefore, the purpose of this study was
to examine the associations between both internal and external environmental characteristics
with SBHC’s overall PCMH capacity and adoption of individual PCMH components.
Methods: The 2013-2014 National Census of School-Based Health Centers was the primary data
source for this analysis. The SBHC PCMH Index was used to determine PCMH capacity scores
used as outcomes in the linear regression models. Individual PCMH attributes in the SBHC PCMH
Index were used as outcomes in the logistic regression models.
Results: The mean PCMH capacity score for all SBHCs was 68.59%, with higher scores in the
Comprehensive Care domain compared to the Care Quality domain. Managed care
arrangements, state Medicaid PCMH initiatives, funding sources, and patient billing activity
were all positively associated with overall PCMH capacity. Student race/ethnicity and SBHC
sponsoring organization (e.g. school system and “other”) were negatively associated with overall
PCMH capacity. SBHC characteristics were also independently associated with individual PCMH
components, with different relationships seen between specific component and SBHC
characteristics. Overall, SBHCs excel at offering health education and chronic disease
management components of the PCMH model, but need to improve participation in PCMH
payment reforms and involving patient stakeholders in the design of SBHC services.
44
Conclusions: The analysis resulted in findings that can be used by SBHC practitioners and
medical home initiatives to improve PCMH adoption. The internal and external SBHC
characteristics that are associated with high overall PCMH capacity are not all necessarily the
same factors associated with better odds of offering individual PCMH attributes. This provides
evidence that PCMH implementation happens differently, even in similar settings like school
health centers. Depending on if the goal is high PCMH capacity or adoption of specific PCMH
attributes, different factors may act as facilitators or barriers to success.
45
Introduction
The PCMH model is promoted as a needed redesign of the U.S. primary care system, yet
it is unclear how the primary principles of the PCMH model should be implemented.153 Specific
components of the medical home model have been suggested to be responsible for causing
desirable improvements in health outcomes, health care utilization, and quality of care.27,32
Partial implementation of the PCMH model has some independent benefits on care quality and
cost, and substantial implementation of most PCMH elements may not be needed to improve
care.26 Thus, it is important to measure implementation of PCMH elements, not just overall
designation as a medical home, when studying the medical home concept.
Despite several tools created to measure overall medical home capacity and
implementation of specific PCMH elements, there is no widely accepted valid tool available for
use with most primary care practices.153 It is important to measure PCMH capacity in different
primary care settings because the medical home is not implemented identically in every setting.
Medical homes should reflect the needs of the patients and medical home programs set up by
state-level initiatives also reflect the state’s unique needs and priorities.154 For pediatric
populations, the existing PCMH surveys differ in the PCMH principles they measure and
therefore measure different types of PCMH capacity.155 It has been suggested that
measurement of PCMH capacity in SBHCs, safety-net providers that predominantly serve
children and adolescents, will be insufficient if tools designed for other primary care practices
are used.156
This study addresses the need for measuring PCMH capacity in SBHCs by using the SBHC
PCMH Index. The SBHC PCMH Index consists of 16 questions for SBHCs based in schools with
only younger children and 18 questions for SBHCS in schools with adolescents. The additional
two questions include adolescent specific questions related to screening for depression and
46
substance abuse. This Index measures the presence of structural components of the PCMH
model in the dimensions of Health Information technology, Access and Quality, Payment,
Comprehensive Assessments, Patient-Centeredness, and Care Management based on PCMH
standards as defined by the NCQA and the Joint Principles from the AAP, American Academy of
Family Physicians, American College of Physicians, and the American Osteopathic Association.7,11
The use of this tool allows for the examination of the associations between SBHC characteristics
and individual attributes of the PCMH model and overall Index score.
The purpose of this study was to examine the associations between both internal and
external environmental characteristics on SBHC’s PCMH capacity. Using both resource
dependency theory and institutional theory as guiding frameworks, the overall hypothesis for
this study was that SBHCs with greater internal munificence and more external isomorphic
pressures will have superior PCMH capacity. The influence of munificence, defined in this study
as greater availability of financial and/or human resources, was predicted to be positively
associated with the implementation of PCMH elements that are more expensive or require
more technical knowledge to implement. Specifically, SBHCs with more staff (i.e. greater
number of primary care providers, more comprehensive staffing model, greater total number of
staff) and better financial sustainability (i.e. higher levels of billing covering their expenses,
greater number of funding sources, receipt of HRSA SBHC Capital funding) will have higher levels
of capacity in the areas of HIT adoption and quality improvement activities.
External isomorphic pressures, represented in this study by the presence of a state
Medicaid PCMH initiative and participation in managed care arrangements are expected to be
positively associated with overall greater PCMH capacity. Financial incentives are a main driver
of PCMH implementation and a key component of the medical home per the Joint Principles, so
it is predicted that SBHCs in states with Medicaid PCMH initiatives and in managed care
47
arrangements will be more likely to receive PCMH elements of financial payments for
performance and care coordination. To improve their care outcomes to qualify for receipt of
performance payments, SBHCs may adopt process improvements that are also attributes of the
PCMH model. The sponsoring organization for the SBHC may also influence the adoption of
PCMH components. Because FQHCs/CHCs are the most prominent sponsor type of SBHCs and
have generally been receptive to the PCMH model, SBHCs sponsored by FQHCs/CHCs are
predicted to have higher levels of PCMH capacity. FQHCs have benefitted from national
demonstration projects to improve their ability to become medical homes, so their sponsorship
is expected to have a positive, dispersed effect on many components of PCMH implementation.
This study categorizes features of the patient population served by the SBHC as
environmental complexity and predicts that SBHCs will offer specific PCMH attributes that are
compatible with addressing the needs of their patient population. Environmental complexity is
represented by variables categorizing the patient age, rurality, race/ethnicity, poverty level, and
if the SBHC sees patients beyond just students. Schools' decisions to offer specific health
services are associated with student age, community socioeconomic status, and the impact of
the health problem on the school.157 It has also been found that rurality, student race, student
health conditions, and student’s health insurance status influence students referral to and use
of SBHCs.158 Additionally, seeing patients beyond their students may add to the complexity of
services offered at the SBHC because the expanded patient population may bring with it more
variety of health needs across the lifespan.
Methods
Data Source
The 2013-2014 National Census of School-Based Health Centers conducted by the SBHA
was used as the primary data source for this analysis. The SBHA has conducted the triennial
48
national survey of SBHCs since 1998 and uses an online survey to collect data about SBHC
demographics, staffing, services, financing, and clinical policies.47 The SBHA maintains a
database of all known SBHCs in the United States and regularly updates it by working with state
affiliates, SBHC funders, and SBHA members to identify new SBHCs and closed SBHCs. Before
launching the census, contact information for representatives of each SBHC are verified and
within three months of census launch, all SBHCs that have not completed the census are
contacted to verify the SBHC’s information and to encourage census completion.
Study Sample
Of the 2,315 known SBHCs in the United States, 1,900 responded to the 2013-2014
Census. Of these 1,900 respondent SBHCs, 1,507 provide primary care and could potentially
serve as a medical home for their patients. Complete case analysis was used and after removing
survey responses missing information on variables of interest, 1,026 SBHCs were included in the
final sample for this study. Before dropping incomplete observations, missing data patterns
were examined. With the high number of variables used in the SBHC PCMH Index and as
independent variables in the regression analysis, only 69% of the 1,507 cases were complete.
The variables indicating if a SBHC was designated as a managed care preferred provider and if
they used claims data in their quality assurance programs were singularly responsible for 7% and
5% of the missing data, respectively. Little’s test for assessing the missing completely at random
assumption using the “mcartest” command in Stata provided no evidence against the missing
completely at random assumption.159 Of the remaining 57 missing data patterns, over 90% of
the patterns individually accounted for <= 1% of the missing data.
Dependent Variables
The SBHC PCMH Index was used to determine the total PCMH capacity score and the
Care Quality and Comprehensive Care domain scores used as outcomes in the linear regression
49
models. Individual PCMH attributes in the SBHC PCMH Index were used as outcomes in the
logistic regression models.
Independent Variables
Munificence: The total number of reported hours worked weekly by physicians, nurse
practitioners, and physician assistants was divided by 40 hours to calculate the mean PCP FTEs.
The FTEs for all staff members of the SBHC was also modeled as a continuous variable. The
staffing model of the health center categorizes the type of providers on staff at the SBHC into
those that have (1) just PCPs and behavioral health staff, (2) PCPs and other staff (e.g. dietician,
optometrist, dentist), and (3) clinics that offer PCPs, behavioral health, and other providers. The
percent of total SBHC operational expenses covered by patient billing was categorized into
quartiles. The total number of funding sources received by the SBHC and if they received HRSA
SBHC Capital funding was also included in the model.
Complexity: SBHCs were also split into those based in schools that only have
prekindergarten through fifth grade and those that serve at least one grade of sixth or above.
This categorization splits the schools into those with only young children and those that have
adolescents in their student population. SBHCs were also differentiated into those that only see
students as patients and those that also treat non-students. The percent of children in the
school that were non-Hispanic white and a proxy measure for student poverty, eligibility for free
or reduced price lunch, were also modelled as continuous variables. Children from families with
incomes between 130% and 185% percent of the FPL are eligible for reduced price meals and
children from families with incomes at or below 130% FPL are eligible for free meals.160
Medicaid and the CHIP program cover children up to 200% FPL in 49 states, so eligibility for free
or reduced lunch is a good indicator of Medicaid or CHIP eligibility.161 Zip code RUCA
50
approximation was used to categorize SBHC location into urban, large rural, small rural, and
isolated areas.162
Isomorphic Pressures: The sponsoring organizations were divided into 5 categories:
FQHCs/CHCs, hospitals, LHDs, school systems, and other (e.g. non-profit, behavioral health
agency, or university). SBHCs were also categorized by the presence of state-level Medicaid
PCMH Initiatives and if they were designated as a managed care preferred provider.163
Analysis
The prevalence of each SBHC characteristic was first examined for the entire sample and
then bivariate analyses with the Index scores and the SBHC characteristics were conducted using
simple linear regression. Multivariate linear regression on the Index scores and multivariate
logistic regression on each PCMH attribute were also completed to control for the effects of
various SBHC characteristics on the total PCMH score and implementation of specific elements
of the medical home. Survey respondents are nested within sponsoring organizations and by
state. Regression analysis with clustering on the state where the SBHC is located was used to
adjust for the correlated nature of the data.164 Cluster characteristics, such as a small number of
SBHC respondents in some states and many sponsoring organizations that only oversee one
SBHC, would cause bias in multi-level modelling.165,166 The data were analyzed using STATA
software, version 14 (Stata- Corp. 2015. Stata Statistical Software: Release 14. College Station,
TX: StataCorp LP).
Results
Most SBHCs have less than or equal to one full-time primary care provider on staff (88%)
and use a staffing model that includes primary care, behavioral health, and one other specialty
(57%) (Table 7). They are predominantly located in urban areas (83%) and are based in schools
with adolescents (87%). Half are designated as managed care preferred providers and over half
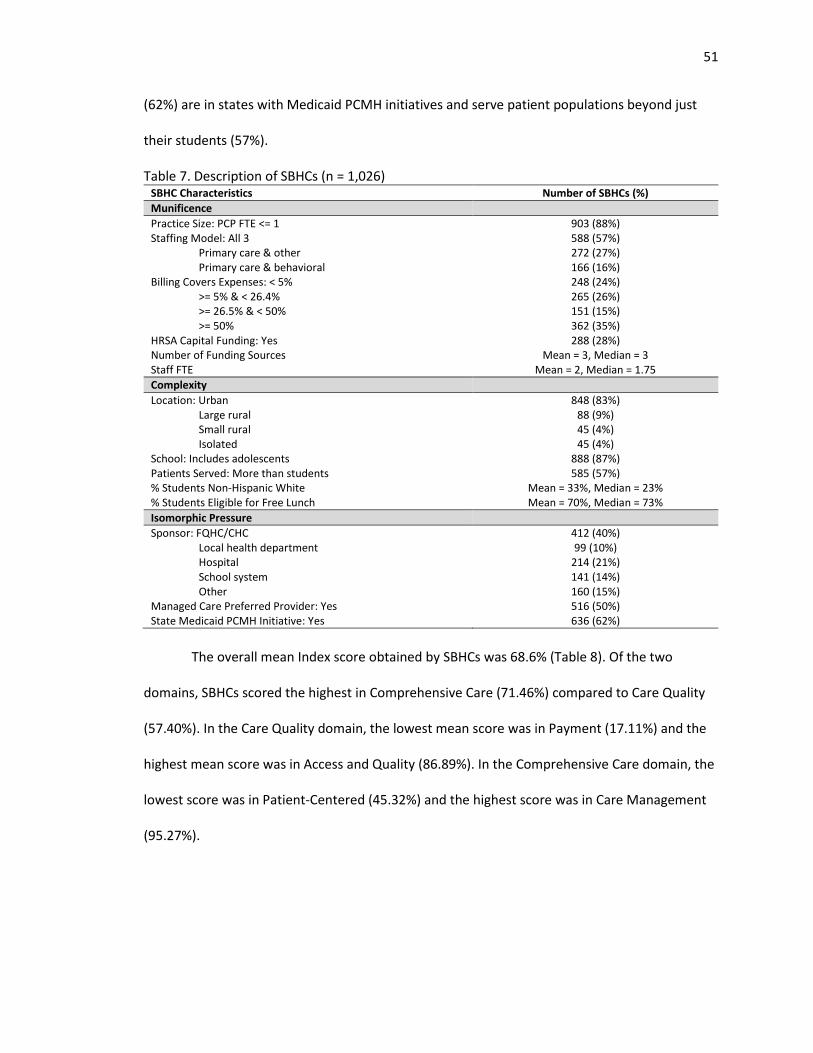
51
(62%) are in states with Medicaid PCMH initiatives and serve patient populations beyond just
their students (57%).
Table 7. Description of SBHCs (n = 1,026) SBHC Characteristics Number of SBHCs (%)
Munificence
Practice Size: PCP FTE <= 1 903 (88%) Staffing Model: All 3 588 (57%)
Primary care & other 272 (27%) Primary care & behavioral 166 (16%)
Billing Covers Expenses: < 5% 248 (24%) >= 5% & < 26.4% 265 (26%) >= 26.5% & < 50% 151 (15%) >= 50% 362 (35%)
HRSA Capital Funding: Yes 288 (28%) Number of Funding Sources Mean = 3, Median = 3 Staff FTE Mean = 2, Median = 1.75
Complexity
Location: Urban 848 (83%) Large rural 88 (9%) Small rural 45 (4%) Isolated 45 (4%)
School: Includes adolescents 888 (87%) Patients Served: More than students 585 (57%) % Students Non-Hispanic White Mean = 33%, Median = 23% % Students Eligible for Free Lunch Mean = 70%, Median = 73%
Isomorphic Pressure
Sponsor: FQHC/CHC 412 (40%) Local health department 99 (10%) Hospital 214 (21%) School system 141 (14%) Other 160 (15%)
Managed Care Preferred Provider: Yes 516 (50%) State Medicaid PCMH Initiative: Yes 636 (62%)
The overall mean Index score obtained by SBHCs was 68.6% (Table 8). Of the two
domains, SBHCs scored the highest in Comprehensive Care (71.46%) compared to Care Quality
(57.40%). In the Care Quality domain, the lowest mean score was in Payment (17.11%) and the
highest mean score was in Access and Quality (86.89%). In the Comprehensive Care domain, the
lowest score was in Patient-Centered (45.32%) and the highest score was in Care Management
(95.27%).
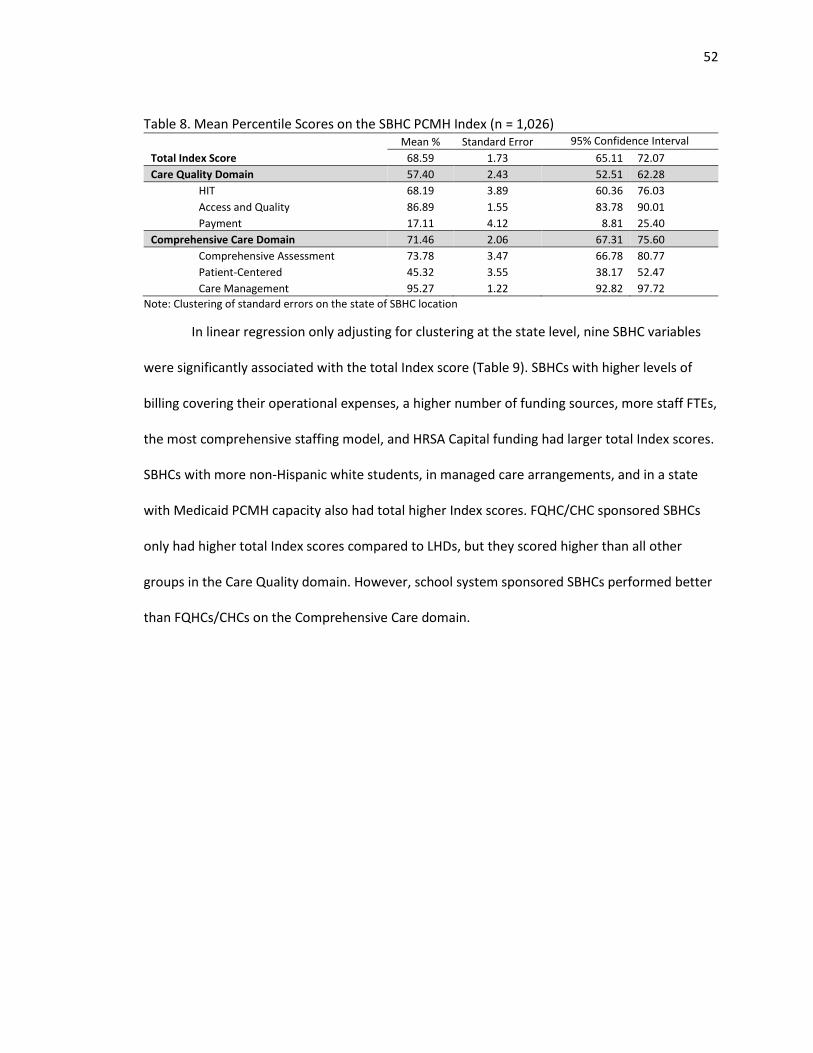
52
Table 8. Mean Percentile Scores on the SBHC PCMH Index (n = 1,026)
Mean % Standard Error 95% Confidence Interval Interval Total Index Score 68.59 1.73 65.11 72.07
Care Quality Domain 57.40 2.43 52.51 62.28
HIT 68.19 3.89 60.36 76.03
Access and Quality 86.89 1.55 83.78 90.01
Payment 17.11 4.12 8.81 25.40
Comprehensive Care Domain 71.46 2.06 67.31 75.60
Comprehensive Assessment 73.78 3.47 66.78 80.77
Patient-Centered 45.32 3.55 38.17 52.47
Care Management 95.27 1.22 92.82 97.72
Note: Clustering of standard errors on the state of SBHC location
In linear regression only adjusting for clustering at the state level, nine SBHC variables
were significantly associated with the total Index score (Table 9). SBHCs with higher levels of
billing covering their operational expenses, a higher number of funding sources, more staff FTEs,
the most comprehensive staffing model, and HRSA Capital funding had larger total Index scores.
SBHCs with more non-Hispanic white students, in managed care arrangements, and in a state
with Medicaid PCMH capacity also had total higher Index scores. FQHC/CHC sponsored SBHCs
only had higher total Index scores compared to LHDs, but they scored higher than all other
groups in the Care Quality domain. However, school system sponsored SBHCs performed better
than FQHCs/CHCs on the Comprehensive Care domain.
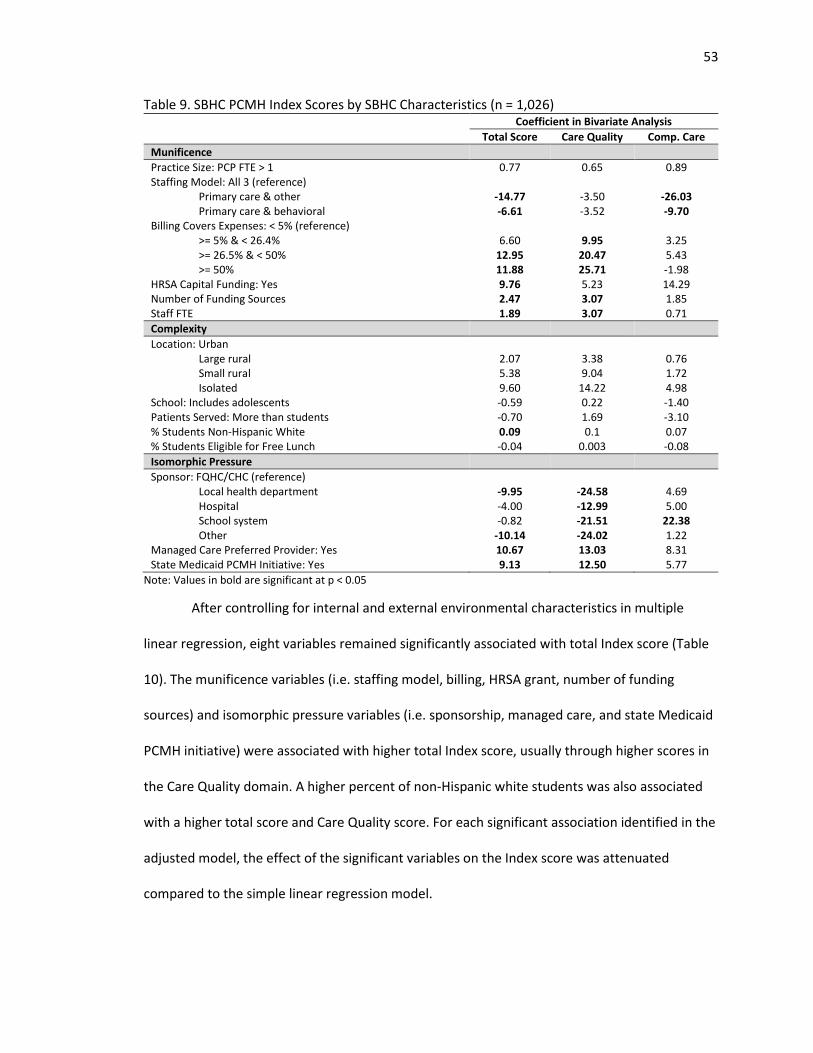
53
Table 9. SBHC PCMH Index Scores by SBHC Characteristics (n = 1,026) Coefficient in Bivariate Analysis
Total Score Care Quality Comp. Care
Munificence
Practice Size: PCP FTE > 1 0.77 0.65 0.89 Staffing Model: All 3 (reference)
Primary care & other -14.77 -3.50 -26.03 Primary care & behavioral -6.61 -3.52 -9.70
Billing Covers Expenses: < 5% (reference) >= 5% & < 26.4% 6.60 9.95 3.25 >= 26.5% & < 50% 12.95 20.47 5.43 >= 50% 11.88 25.71 -1.98
HRSA Capital Funding: Yes 9.76 5.23 14.29 Number of Funding Sources 2.47 3.07 1.85 Staff FTE 1.89 3.07 0.71
Complexity
Location: Urban Large rural 2.07 3.38 0.76 Small rural 5.38 9.04 1.72 Isolated 9.60 14.22 4.98
School: Includes adolescents -0.59 0.22 -1.40 Patients Served: More than students -0.70 1.69 -3.10 % Students Non-Hispanic White 0.09 0.1 0.07 % Students Eligible for Free Lunch -0.04 0.003 -0.08
Isomorphic Pressure
Sponsor: FQHC/CHC (reference) Local health department -9.95 -24.58 4.69 Hospital -4.00 -12.99 5.00 School system -0.82 -21.51 22.38 Other -10.14 -24.02 1.22
Managed Care Preferred Provider: Yes 10.67 13.03 8.31 State Medicaid PCMH Initiative: Yes 9.13 12.50 5.77
Note: Values in bold are significant at p < 0.05
After controlling for internal and external environmental characteristics in multiple
linear regression, eight variables remained significantly associated with total Index score (Table
10). The munificence variables (i.e. staffing model, billing, HRSA grant, number of funding
sources) and isomorphic pressure variables (i.e. sponsorship, managed care, and state Medicaid
PCMH initiative) were associated with higher total Index score, usually through higher scores in
the Care Quality domain. A higher percent of non-Hispanic white students was also associated
with a higher total score and Care Quality score. For each significant association identified in the
adjusted model, the effect of the significant variables on the Index score was attenuated
compared to the simple linear regression model.
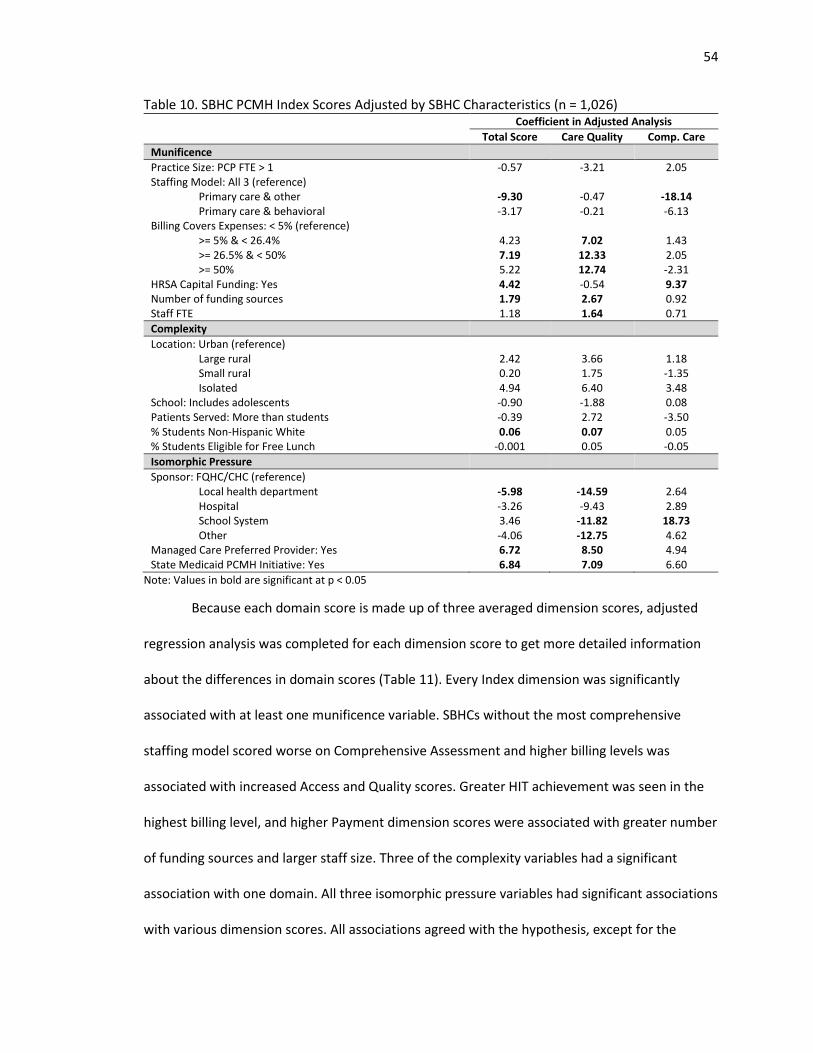
54
Table 10. SBHC PCMH Index Scores Adjusted by SBHC Characteristics (n = 1,026) Coefficient in Adjusted Analysis
Total Score Care Quality Comp. Care
Munificence
Practice Size: PCP FTE > 1 -0.57 -3.21 2.05 Staffing Model: All 3 (reference)
Primary care & other -9.30 -0.47 -18.14 Primary care & behavioral -3.17 -0.21 -6.13
Billing Covers Expenses: < 5% (reference) >= 5% & < 26.4% 4.23 7.02 1.43 >= 26.5% & < 50% 7.19 12.33 2.05 >= 50% 5.22 12.74 -2.31
HRSA Capital Funding: Yes 4.42 -0.54 9.37 Number of funding sources 1.79 2.67 0.92 Staff FTE 1.18 1.64 0.71
Complexity
Location: Urban (reference) Large rural 2.42 3.66 1.18 Small rural 0.20 1.75 -1.35 Isolated 4.94 6.40 3.48
School: Includes adolescents -0.90 -1.88 0.08 Patients Served: More than students -0.39 2.72 -3.50 % Students Non-Hispanic White 0.06 0.07 0.05 % Students Eligible for Free Lunch -0.001 0.05 -0.05
Isomorphic Pressure
Sponsor: FQHC/CHC (reference) Local health department -5.98 -14.59 2.64 Hospital -3.26 -9.43 2.89 School System 3.46 -11.82 18.73 Other -4.06 -12.75 4.62
Managed Care Preferred Provider: Yes 6.72 8.50 4.94 State Medicaid PCMH Initiative: Yes 6.84 7.09 6.60
Note: Values in bold are significant at p < 0.05
Because each domain score is made up of three averaged dimension scores, adjusted
regression analysis was completed for each dimension score to get more detailed information
about the differences in domain scores (Table 11). Every Index dimension was significantly
associated with at least one munificence variable. SBHCs without the most comprehensive
staffing model scored worse on Comprehensive Assessment and higher billing levels was
associated with increased Access and Quality scores. Greater HIT achievement was seen in the
highest billing level, and higher Payment dimension scores were associated with greater number
of funding sources and larger staff size. Three of the complexity variables had a significant
association with one domain. All three isomorphic pressure variables had significant associations
with various dimension scores. All associations agreed with the hypothesis, except for the
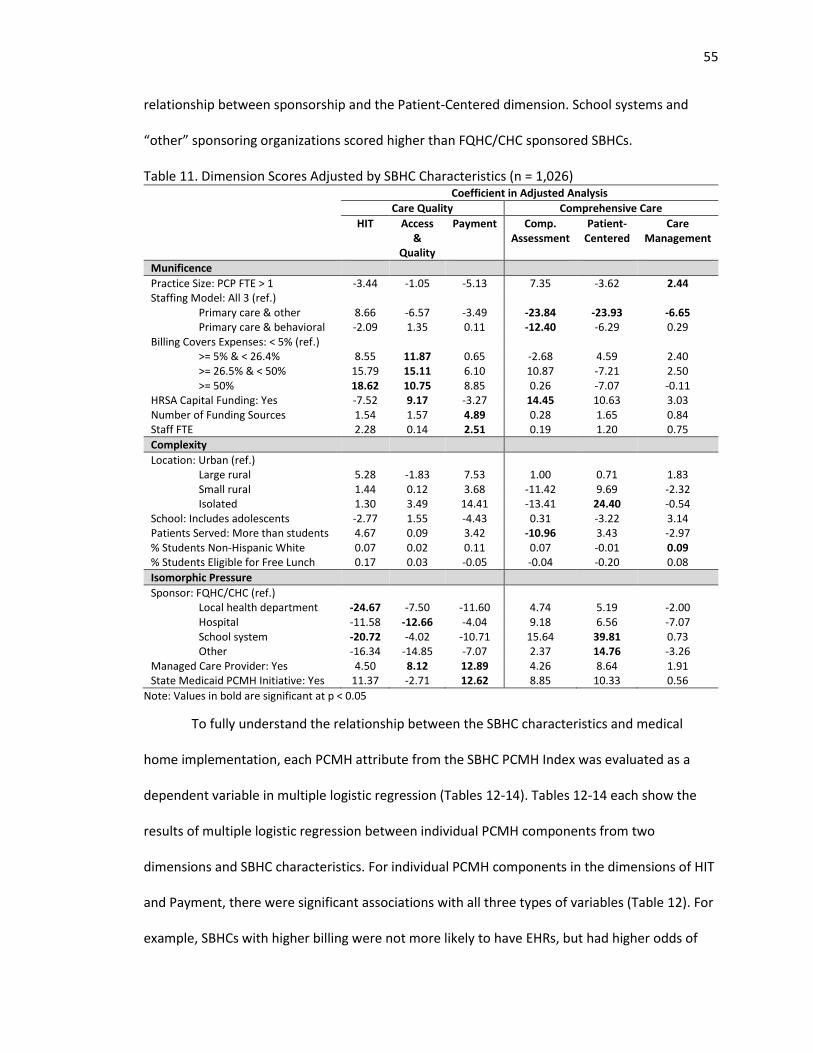
55
relationship between sponsorship and the Patient-Centered dimension. School systems and
“other” sponsoring organizations scored higher than FQHC/CHC sponsored SBHCs.
Table 11. Dimension Scores Adjusted by SBHC Characteristics (n = 1,026) Coefficient in Adjusted Analysis
Care Quality Comprehensive Care
HIT Access &
Quality
Payment Comp. Assessment
Patient-Centered
Care Management
Munificence
Practice Size: PCP FTE > 1 -3.44 -1.05 -5.13 7.35 -3.62 2.44 Staffing Model: All 3 (ref.)
Primary care & other 8.66 -6.57 -3.49 -23.84 -23.93 -6.65 Primary care & behavioral -2.09 1.35 0.11 -12.40 -6.29 0.29
Billing Covers Expenses: < 5% (ref.) >= 5% & < 26.4% 8.55 11.87 0.65 -2.68 4.59 2.40 >= 26.5% & < 50% 15.79 15.11 6.10 10.87 -7.21 2.50 >= 50% 18.62 10.75 8.85 0.26 -7.07 -0.11
HRSA Capital Funding: Yes -7.52 9.17 -3.27 14.45 10.63 3.03 Number of Funding Sources 1.54 1.57 4.89 0.28 1.65 0.84 Staff FTE 2.28 0.14 2.51 0.19 1.20 0.75
Complexity
Location: Urban (ref.) Large rural 5.28 -1.83 7.53 1.00 0.71 1.83 Small rural 1.44 0.12 3.68 -11.42 9.69 -2.32 Isolated 1.30 3.49 14.41 -13.41 24.40 -0.54
School: Includes adolescents -2.77 1.55 -4.43 0.31 -3.22 3.14 Patients Served: More than students 4.67 0.09 3.42 -10.96 3.43 -2.97 % Students Non-Hispanic White 0.07 0.02 0.11 0.07 -0.01 0.09 % Students Eligible for Free Lunch 0.17 0.03 -0.05 -0.04 -0.20 0.08
Isomorphic Pressure
Sponsor: FQHC/CHC (ref.) Local health department -24.67 -7.50 -11.60 4.74 5.19 -2.00 Hospital -11.58 -12.66 -4.04 9.18 6.56 -7.07 School system -20.72 -4.02 -10.71 15.64 39.81 0.73 Other -16.34 -14.85 -7.07 2.37 14.76 -3.26
Managed Care Provider: Yes 4.50 8.12 12.89 4.26 8.64 1.91 State Medicaid PCMH Initiative: Yes 11.37 -2.71 12.62 8.85 10.33 0.56
Note: Values in bold are significant at p < 0.05
To fully understand the relationship between the SBHC characteristics and medical
home implementation, each PCMH attribute from the SBHC PCMH Index was evaluated as a
dependent variable in multiple logistic regression (Tables 12-14). Tables 12-14 each show the
results of multiple logistic regression between individual PCMH components from two
dimensions and SBHC characteristics. For individual PCMH components in the dimensions of HIT
and Payment, there were significant associations with all three types of variables (Table 12). For
example, SBHCs with higher billing were not more likely to have EHRs, but had higher odds of
56
more advanced use of HIT. Odds of electronic prescribing also increased with the percent of
white students. Managed care SBHCs and those in states with state Medicaid PCMH initiatives
had greater odds of electronic prescribing.
More funding sources and more staff increased the odds of both Payment attributes,
and higher levels of billing also increased the odds of receiving supplemental performance
payments. Two of the three rural categories had higher odds of receiving care coordination
payments compared to urban SBHCs. SBHCs based in schools with adolescents were less likely to
receive care coordination payments, as were SBHCs in schools with higher poverty levels.
Managed care SBHCs and those in states with state Medicaid PCMH initiatives had of receiving
performance payments and care coordination payments. FQHC/CHC sponsored SBHCs
performed better than at least one other sponsor type in every attribute except for receipt of
performance payments.
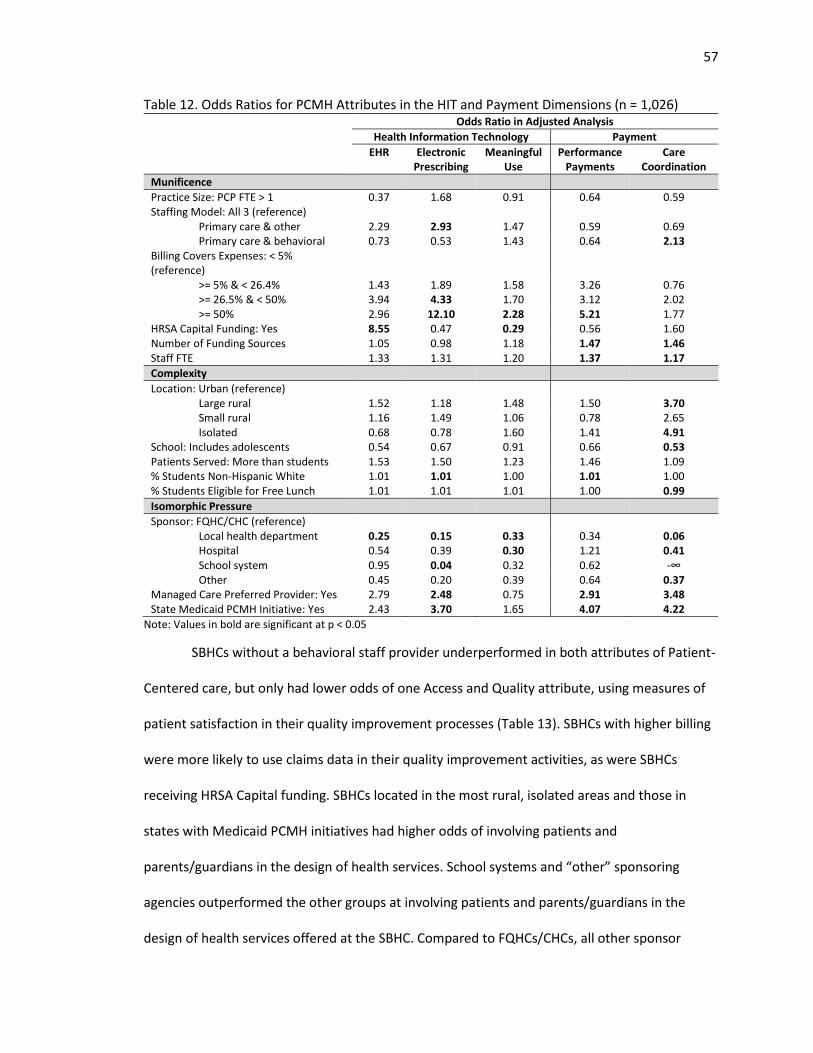
57
Table 12. Odds Ratios for PCMH Attributes in the HIT and Payment Dimensions (n = 1,026) Odds Ratio in Adjusted Analysis
Health Information Technology Payment
EHR Electronic Prescribing
Meaningful Use
Performance Payments
Care Coordination
Munificence
Practice Size: PCP FTE > 1 0.37 1.68 0.91 0.64 0.59 Staffing Model: All 3 (reference)
Primary care & other 2.29 2.93 1.47 0.59 0.69 Primary care & behavioral 0.73 0.53 1.43 0.64 2.13
Billing Covers Expenses: < 5% (reference)
>= 5% & < 26.4% 1.43 1.89 1.58 3.26 0.76 >= 26.5% & < 50% 3.94 4.33 1.70 3.12 2.02 >= 50% 2.96 12.10 2.28 5.21 1.77
HRSA Capital Funding: Yes 8.55 0.47 0.29 0.56 1.60 Number of Funding Sources 1.05 0.98 1.18 1.47 1.46 Staff FTE 1.33 1.31 1.20 1.37 1.17
Complexity
Location: Urban (reference) Large rural 1.52 1.18 1.48 1.50 3.70 Small rural 1.16 1.49 1.06 0.78 2.65 Isolated 0.68 0.78 1.60 1.41 4.91
School: Includes adolescents 0.54 0.67 0.91 0.66 0.53 Patients Served: More than students 1.53 1.50 1.23 1.46 1.09 % Students Non-Hispanic White 1.01 1.01 1.00 1.01 1.00 % Students Eligible for Free Lunch 1.01 1.01 1.01 1.00 0.99
Isomorphic Pressure
Sponsor: FQHC/CHC (reference) Local health department 0.25 0.15 0.33 0.34 0.06 Hospital 0.54 0.39 0.30 1.21 0.41 School system 0.95 0.04 0.32 0.62 -∞ Other 0.45 0.20 0.39 0.64 0.37
Managed Care Preferred Provider: Yes 2.79 2.48 0.75 2.91 3.48 State Medicaid PCMH Initiative: Yes 2.43 3.70 1.65 4.07 4.22
Note: Values in bold are significant at p < 0.05
SBHCs without a behavioral staff provider underperformed in both attributes of Patient-
Centered care, but only had lower odds of one Access and Quality attribute, using measures of
patient satisfaction in their quality improvement processes (Table 13). SBHCs with higher billing
were more likely to use claims data in their quality improvement activities, as were SBHCs
receiving HRSA Capital funding. SBHCs located in the most rural, isolated areas and those in
states with Medicaid PCMH initiatives had higher odds of involving patients and
parents/guardians in the design of health services. School systems and “other” sponsoring
agencies outperformed the other groups at involving patients and parents/guardians in the
design of health services offered at the SBHC. Compared to FQHCs/CHCs, all other sponsor
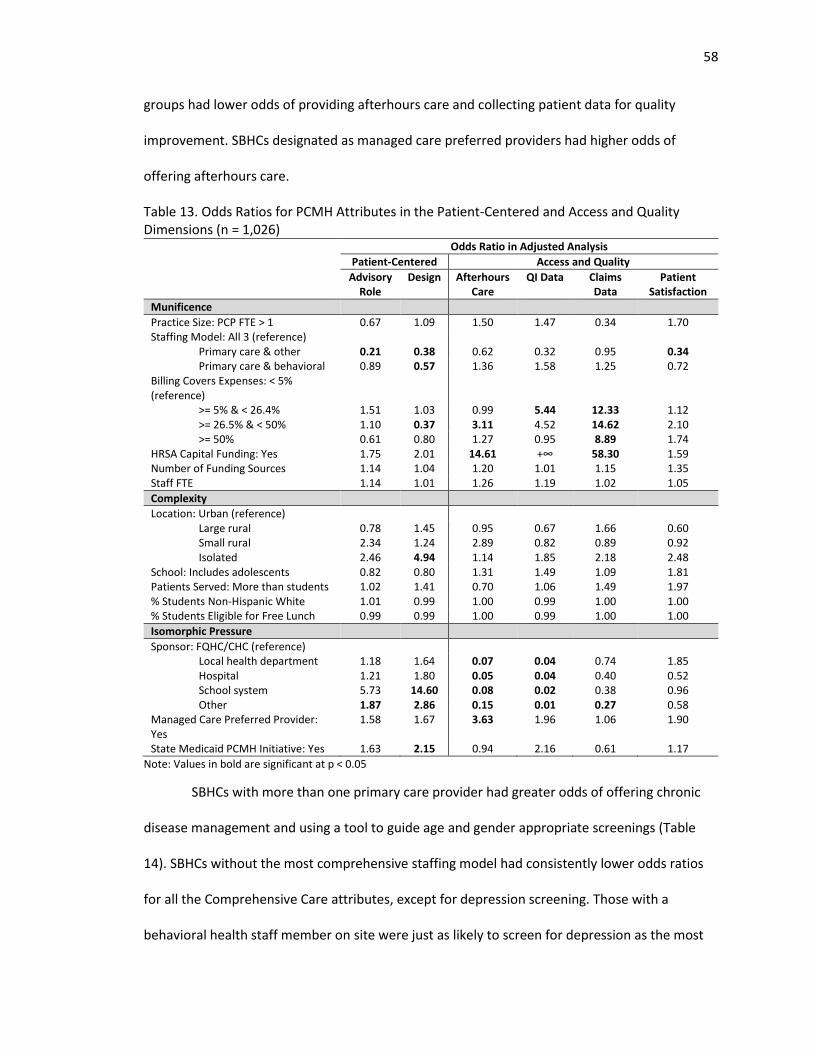
58
groups had lower odds of providing afterhours care and collecting patient data for quality
improvement. SBHCs designated as managed care preferred providers had higher odds of
offering afterhours care.
Table 13. Odds Ratios for PCMH Attributes in the Patient-Centered and Access and Quality Dimensions (n = 1,026)
Odds Ratio in Adjusted Analysis
Patient-Centered Access and Quality
Advisory Role
Design
Afterhours Care
QI Data Claims Data
Patient Satisfaction
Munificence
Practice Size: PCP FTE > 1 0.67 1.09 1.50 1.47 0.34 1.70 Staffing Model: All 3 (reference)
Primary care & other 0.21 0.38 0.62 0.32 0.95 0.34 Primary care & behavioral 0.89 0.57 1.36 1.58 1.25 0.72
Billing Covers Expenses: < 5% (reference)
>= 5% & < 26.4% 1.51 1.03 0.99 5.44 12.33 1.12 >= 26.5% & < 50% 1.10 0.37 3.11 4.52 14.62 2.10 >= 50% 0.61 0.80 1.27 0.95 8.89 1.74
HRSA Capital Funding: Yes 1.75 2.01 14.61 +∞ 58.30 1.59 Number of Funding Sources 1.14 1.04 1.20 1.01 1.15 1.35 Staff FTE 1.14 1.01 1.26 1.19 1.02 1.05
Complexity
Location: Urban (reference) Large rural 0.78 1.45 0.95 0.67 1.66 0.60 Small rural 2.34 1.24 2.89 0.82 0.89 0.92 Isolated 2.46 4.94 1.14 1.85 2.18 2.48
School: Includes adolescents 0.82 0.80 1.31 1.49 1.09 1.81 Patients Served: More than students 1.02 1.41 0.70 1.06 1.49 1.97 % Students Non-Hispanic White 1.01 0.99 1.00 0.99 1.00 1.00 % Students Eligible for Free Lunch 0.99 0.99 1.00 0.99 1.00 1.00
Isomorphic Pressure
Sponsor: FQHC/CHC (reference) Local health department 1.18 1.64 0.07 0.04 0.74 1.85 Hospital 1.21 1.80 0.05 0.04 0.40 0.52 School system 5.73 14.60 0.08 0.02 0.38 0.96 Other 1.87 2.86 0.15 0.01 0.27 0.58
Managed Care Preferred Provider: Yes
1.58 1.67 3.63 1.96 1.06 1.90
State Medicaid PCMH Initiative: Yes 1.63 2.15 0.94 2.16 0.61 1.17
Note: Values in bold are significant at p < 0.05
SBHCs with more than one primary care provider had greater odds of offering chronic
disease management and using a tool to guide age and gender appropriate screenings (Table
14). SBHCs without the most comprehensive staffing model had consistently lower odds ratios
for all the Comprehensive Care attributes, except for depression screening. Those with a
behavioral health staff member on site were just as likely to screen for depression as the most
59
comprehensively staffed SBHCs. One billing level (third quartile) was positively associated with
using a tool for screening for social factors and health behaviors that affect health. SBHCs with
HRSA funding had greater odds of offering chronic disease management and using a tool to
screen for drug use. For complexity variables, as rurality and the diversity of the patient
population increased, the odds of several Comprehensive Assessment attributes decreased. The
results for the sponsorship variable were mixed compared to the predicted direction: hospitals
performed better than FQHCs/CHCs on four of the five Comprehensive Assessment attributes,
and school systems outperformed FQHCs/CHCs on using a tool for age and gender appropriate
screenings.
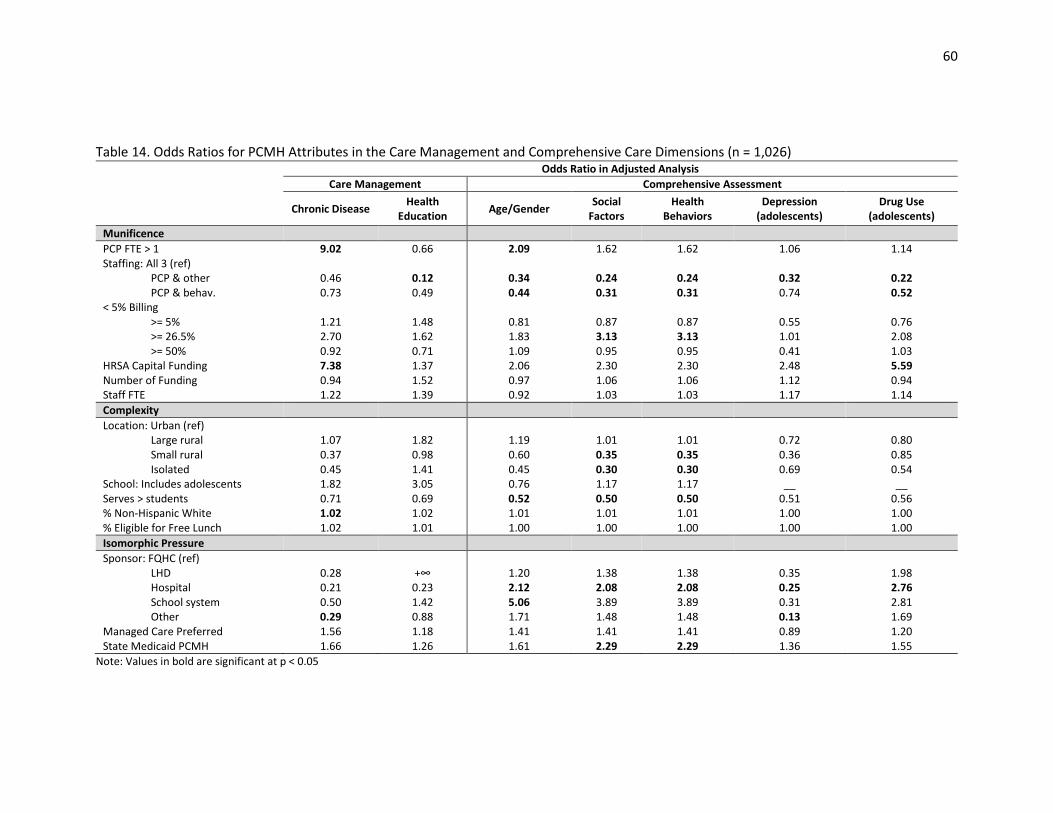
60
Table 14. Odds Ratios for PCMH Attributes in the Care Management and Comprehensive Care Dimensions (n = 1,026)
Odds Ratio in Adjusted Analysis
Care Management Comprehensive Assessment
Chronic Disease Health
Education Age/Gender
Social Factors
Health Behaviors
Depression (adolescents)
Drug Use (adolescents)
Munificence
PCP FTE > 1 9.02 0.66 2.09 1.62 1.62 1.06 1.14 Staffing: All 3 (ref)
PCP & other 0.46 0.12 0.34 0.24 0.24 0.32 0.22 PCP & behav. 0.73 0.49 0.44 0.31 0.31 0.74 0.52
< 5% Billing >= 5% 1.21 1.48 0.81 0.87 0.87 0.55 0.76 >= 26.5% 2.70 1.62 1.83 3.13 3.13 1.01 2.08 >= 50% 0.92 0.71 1.09 0.95 0.95 0.41 1.03
HRSA Capital Funding 7.38 1.37 2.06 2.30 2.30 2.48 5.59 Number of Funding 0.94 1.52 0.97 1.06 1.06 1.12 0.94 Staff FTE 1.22 1.39 0.92 1.03 1.03 1.17 1.14
Complexity
Location: Urban (ref) Large rural 1.07 1.82 1.19 1.01 1.01 0.72 0.80 Small rural 0.37 0.98 0.60 0.35 0.35 0.36 0.85 Isolated 0.45 1.41 0.45 0.30 0.30 0.69 0.54
School: Includes adolescents 1.82 3.05 0.76 1.17 1.17 __ __ Serves > students 0.71 0.69 0.52 0.50 0.50 0.51 0.56 % Non-Hispanic White 1.02 1.02 1.01 1.01 1.01 1.00 1.00 % Eligible for Free Lunch 1.02 1.01 1.00 1.00 1.00 1.00 1.00
Isomorphic Pressure
Sponsor: FQHC (ref) LHD 0.28 +∞ 1.20 1.38 1.38 0.35 1.98 Hospital 0.21 0.23 2.12 2.08 2.08 0.25 2.76 School system 0.50 1.42 5.06 3.89 3.89 0.31 2.81 Other 0.29 0.88 1.71 1.48 1.48 0.13 1.69
Managed Care Preferred 1.56 1.18 1.41 1.41 1.41 0.89 1.20 State Medicaid PCMH 1.66 1.26 1.61 2.29 2.29 1.36 1.55
Note: Values in bold are significant at p < 0.05
61
Discussion
The purpose of this study was to examine the associations between both internal and external
environmental (munificence, complexity, and isomorphic pressure) SBHC characteristics with PCMH
capacity. PCMH capacity was evaluated at multiple levels: the overall score on the SBHC PCMH Index,
Index domain and dimension scores, and of individual PCMH attributes. The analysis resulted in findings
that can be used by SBHC practitioners and medical home initiatives to improve PCMH adoption. There
were significant differences in the PCMH capacity score and adoption of PCMH attributes by SBHC
characteristics. Overall, SBHCs performed best in the Comprehensive Care domain due to high scores in
Care Management and Comprehensive Assessment dimensions. SBHCs scored 95% in the Care
Management dimension, indicating very high offerings of chronic disease management and health
education classes. However, SBHCs only scored 17% in the Payment dimension. SBHCs that do not
receive enhanced payments may have difficulties sustaining and expanding their implementation of the
medical home model.
The mean cost of applying for NCQA’s highest level of PCMH recognition has been estimated at
$13,700 per primary care provider FTE, which does not include the additional expenses of ongoing costs
for staff and supplies.167 Other estimates of the actual implementation costs of PCMH elements range
from $7,691 - $9,658 per primary care provider FTE per month.168 Increased PCMH capacity is also
associated with higher health center operating costs due to PCMH activities related to advanced EHR
use and quality improvement activities.169 Given the high costs of PCMH implementation, it was
expected that most of the munificence variables would be associated with increased overall Index
scores and higher odds of use for more expensive PCMH attributes. These anticipated findings were
mostly confirmed in this analysis. SBHCs with greater billing revenue had higher scores in the HIT
dimension and the Access and Quality dimension. Higher billing was associated with greater electronic
prescribing and more Meaningful Use achievement. Electronic prescribing is one component of the
62
Meaningful Use incentive payments that requires prescribers to transmit 40% of allowable prescriptions
using EHR technology.170 Substantial investments of planning time and the ongoing transformation of
work processes are required for the successful adoption of electronic prescribing.171 A recent systematic
review of the challenges of PCMH transformation cited difficulties of implementing meaningful use of
EHR systems, including electronic prescribing, as a key barrier to the medical home model due to
unanticipated difficulties integrating the EHR system into the clinician’s work processes, and the
significant required investments of time, effort, and resources.122
The comprehensiveness of the staffing model on PCMH attribute adoption had mixed findings.
SBHCs with at least three different provider specialty types were better at offering more Comprehensive
Assessments, health education classes, and incorporating patients/parents/guardians into the design of
health services. However, SBHCs without a behavioral health provider and without another specialty
provider (not including behavioral health) were more likely to offer electronic prescribing and receive
care coordination payments, respectively. As both activities are expensive, probably more so than the
use of screening tools and involving stakeholders in the design of services, SBHCs may make a strategic
choice to forego hiring specialists in order to pursue other PCMH elements.
Both Payment dimension attributes were significantly associated with munificence variables.
Though participating in performance payment programs may potentially increase a provider’s revenue,
it requires significant investments to demonstrate that the practice is meeting performance standards.
One study has found that implementation of pay-for-performance programs costs $1,000 - $11,100 per
full-time clinician, and annual maintenance costs ranged from around $100 - $4,300 per clinician, with
the highest costs being seen in small provider clinics.172 These costs include non-personnel costs and
personnel time associated with data capture, collecting, and reporting, so it makes sense that greater
billing revenue, greater number of overall funding sources, and larger staff size are associated with
increased odds of receiving performance payments. In pediatric practices, providers operating in
63
solo/small provider clinics and providers caring for high percentage of publicly insured patients more
frequently reported staffing insufficiencies as a primary barrier to implementing care coordination
services.173 In this analysis, both number of funding sources and larger overall staff size were associated
with higher odds of receiving care coordination payments.
This analysis did not find much evidence to support that environmental complexity, as measured
by patient-level variables, is significantly associated with overall PCMH capacity in SBHCs. By their very
design, SBHCs are placed in complex environments. PCMH access disparities typically seen in
adolescents and in children without private health insurance may be addressed by seeking care at
SBHCs. However, this study did find that an increasing percent of non-Hispanic white students at the
school was associated with higher PCMH capacity, which is contrary to other research that did not find
significant relationships between a practice’s racial/ethnicity practice mix and PCMH processes.85,87,174 In
this study, race was related to higher odds of electronic prescribing, supplemental payments for
performance, and chronic disease management. As electronic prescribing is an advanced function of
EHRs, disparities in EHR adoption and greater financial barriers to adoption experienced by providers
serving minority patients may explain this finding.175,176 Although EHR implementation by patient
race/ethnicity was insignificant in this study, advanced EHR modules such as electronic prescribing may
be used less with minority populations due to its additional costs. Also, providers with more minority
patients have experienced worse quality outcomes in pay-for-performance programs, which usually
include chronic disease management measures, so SBHCs with higher amounts of minority patients may
choose to opt-out of performance-based payment schemes.177,178 While the magnitude of the race effect
on PCMH capacity was small, this does translate into a large PCMH capacity difference between schools
that are predominantly non-Hispanic white and those that are minority majority schools.
The study findings do provide evidence of isomorphic effects on PCMH capacity, but the effects
were not as widespread across the various domains and dimensions as anticipated. Both managed care
64
arrangements and Medicaid state PCMH Initiatives were associated with increased odds of electronic
prescribing, supplemental performance payments, and care coordination payments. All three of these
PCMH attributes serve the interests of managed care and Medicaid, which explains why these insurance
programs are associated with these PCMH attributes. Along with benefits for the patients and providers,
electronic prescribing can lower costs for insurers due to better adherence to formulary prescribing and
reduction in adverse drug effects.179 The increased payments to small clinics gives up-front financial
support needed for practices to adopt other elements of the PCMH model, so payment reform is the
foundation upon which practice transformation can be built.180
However, neither managed care or State Medicaid initiatives were associated with any
attributes from the Access and Quality dimension or the Care Management dimension. SBHCs in states
with Medicaid PCMH initiatives did have higher odds of screening for social factors and health behaviors
that would negatively affect health and for involving patients/parents/guardians in the design of health
services. Implementation of validated screening tools in pediatric populations has been found to
improve detection of behavioral and developmental concerns and referral to community
resources.181,182 Child development screening is sometimes actually required of Medicaid providers
because of its benefits in assisting in early identification of problems in young children.183 Given the
success of implementing screening tools for age appropriate developmental behaviors in pediatric
populations and the known association between health and social factors, it makes sense that managed
care and Medicaid would also promote increased use of screening tools which will promote cost-saving
preventive services.
SBHCs sponsored by FQHCs/CHCs only performed better in two dimensions: HIT and Access and
Quality. It was hypothesized that FQHC/CHC sponsored organizations would outperform other
sponsoring agencies because of greater technical knowledge of the PCMH certification process. The
Affordable Care Act’s FQHC Advanced Primary Care Practice Demonstration, which ended in 2013,
65
provided financial and technical assistance to 434 FQHCs to help them become NCQA PCMH
recognized.9 This program provided various levels of technical support to FQHCs and previous research
has demonstrated the helpfulness of external support for PCMH adoption.184 It was expected that SBHCs
sponsored by nationally certified FQHCs would receive support, encouragement, and pressure to adopt
PCMH innovations, leading to widespread increased PCMH capacity. This pressure to adopt the PCMH
model may partially explain why FQHC SBHCs performed better in the HIT and Access and Quality
dimensions, two areas that are highly emphasized in the NCQA program. However, these associations
may also be explained by resource dependency theory. Greater technical support of advanced HIT use,
knowledge of quality improvement processes, and availability to provide afterhours care when the SBHC
is closed could be considered resources that increase the munificence of the SBHC. Because FQHC/CHC
sponsorship was only positively associated with PCMH dimensions that require more financial and staff
investment and was negatively associated with less expensive PCMH attributes (e.g. patients and
parents/guardians participating in SBHC advisory boards and participating in design of health services),
there is inconclusive evidence that FQHC/CHC sponsorship results in pressure for their SBHCs to
implement the complete medical home model. Although, it does appear that SBHC sponsorship
influences adoption of specific PCMH attributes that the sponsor has experience implementing
themselves. This can also be seen in school system sponsored SBHCs which performed better at
involving patients/parents/guardians in the SBHC activities. Schools have experience and processes in
place for involving parents in their activities, such as through parent teacher associations, and may find
it easier to include parents and students in their SBHC activities.
Implications and Contributions
This study is the first to describe the effects of various internal and external environmental
variables on PCMH capacity in SBHCs. SBHCs typically perform well in using tools to provide
Comprehensive Assessments of their patients’ needs, but have very low levels of participation in PCMH
66
payment reforms. Because adoption of most PCMH attributes require significant investments of time or
money, special PCMH payments are needed to sustain and grow PCMH implementation. SBHCs, which
are small clinics with limited staffing, may need external support to develop their infrastructure in order
to participate in these enhanced payment programs. This study also found that SBHCs with higher
munificence and greater isomorphic pressure had better PCMH capacity and were more likely to
implement specific elements of the medical home model. Among SBHCs, differences in rurality, student
age, and family income had minimal effects on PCMH adoption, but lower levels of PCMH capacity were
seen in schools with more minority students.
67
CHAPTER 4: CORRELATES OF PATIENT-CENTERED MEDICAL HOME RECOGNITION IN SCHOOL-BASED
HEALTH CENTERS
Abstract
Purpose: The patient-centered medical home model (PCMH) of care is promoted as a way to improve
access to care, health care outcomes, and control costs. The organizational, environmental, and patient
characteristics associated with school-based health centers (SBHCs) obtaining PCMH recognition is
currently unknown. Resource dependency theory and institutional theory were used to explore the
predictors of PCMH recognition in SBHCs.
Methods: The 2013-2014 National Census of School-Based Health Centers was used as the primary data
source for this analysis. Multivariable logistic regression controlling for organizational, environmental,
and patient characteristics representative of munificence, environmental complexity, and isomorphic
pressures was used to assess the odds of a SBHC obtaining (1) any type of PCMH recognition, and (2) of
obtaining national PCMH recognition.
Results: Only 29% (n = 346) of SBHCs had received any type of recognition as a PCMH and 17% (n = 203)
reported receiving national-level recognition. After controlling for covariates and the clustered nature of
the data, SBHCs that were managed care preferred providers, received Health Resources and Services
Administration SBHC Capital Funding, and were based in schools without adolescents had greater odds
of both types of PCMH recognition outcomes. Increased revenue from patient billing, more staff FTEs,
and the type of sponsoring agency is also associated with national PCMH recognition.
Conclusions: These findings reflect that a high capacity of financial and staff resources are needed for
national-level PCMH recognition and that the cost and quality goals of managed care are supportive of
PCMH implementation. Additionally, SBHCs based in schools that include adolescents were less likely to
have both levels of PCMH recognition and efforts should be made to increase medical home activity in
these SBHCs. There were differences in significant associations between the two PCMH recognition

68
outcomes, indicating that the definition of a medical home is important to consider when evaluating
organizational characteristics associated with the PCMH model.
69
Introduction
The ACA encourages implementation of PCMHs through a variety of primary care
transformation demonstrations and PCMH use in pediatric populations has been shown to reduce
health care expenditures, increase quality of care, improve health outcomes, decrease unmet medical
needs, and improve patient satisfaction.78,185 The PCMH concept was pioneered by the AAP because this
delivery system provides comprehensive primary care that is accessible, coordinated, culturally
sensitive, and reflective of the unique needs of the patient.2 Medical practices may choose to pursue
PCMH certification or recognition from a national-level organization, such as the NCQA, Joint
Commission, URAC, or the Accreditation Association of Ambulatory Health Care (AAAHC). PCMH
designation is also available through participation in state-level PCHM initiatives and demonstration
projects that involve Medicaid agencies and/or private insurance companies. At least half of all state
Medicaid programs have payment structures for PCMHs that include care management fees,
performance-based payments, or up-front implementation costs.163
Though widely heralded as a promising model to improve the primary health care system, there
is still inconclusive evidence about the PCMH model’s effect on clinical and cost outcomes, partly due to
the wide variety of standards that exist between different PCMH certifying organizations.186 The inability
of PCMH practices to fully deliver on improving quality while reducing costs of care may also be caused
by the insufficient changes to how primary care providers are reimbursed for delivering care in a PCMH
setting.187 If payment changes to providers are inadequate, the costs of redesigning care delivery (e.g.
hiring more staff or purchasing health information technology) and costs associated with applying for
national PCMH certification may be barriers to fully adopting this model of care.
The time demands of implementing practice changes and health information technology
challenges are also limiting capabilities to many primary care providers. PCMH adoption is influenced by
incentives that support practice changes, the provider’s relationship to other health care organizations,
70
and the financial and technical resources available to the practice to support change.184,188 Primary care
practices that receive health information technical support or assistance with reporting performance
measurements have fewer barriers to delivering patient-centered care.188 Also, larger practices and
providers with more connections to other healthcare organizations are more likely to deliver elements
of the PCMH model of care.86,88 Beyond financial and technical assistance, the motivation of the practice
to become PCMH certified is also important and practices that see being a PCMH as a benefit to both
themselves and their patients adopt more components of PCMH delivery than practices that see pursuit
of being a PCMH as an external imposed requirement.184 In safety-net health clinics, staff turnover due
to the challenges of providing care for high-needs patients and lack of financial support for
implementing PCMH functions have been found to be barriers to PCMH transformation.189
SBHCs are safety-net health clinics co-located with a school that are designed to overcome
transportation, time, language, and financial barriers that may prevent children from receiving needed
health care services. Evaluation studies of SBHCs have demonstrated their ability to improve the health
and educational outcomes of their patients, and SBHCs are promoted by the Community Preventive
Services Task Force as an evidence-based program.75 SBHCs have been found to increase their students’
access to primary care services, reduce their emergency department use, improve immunization rates,
and decrease exclusion from school due to immunization non-compliance.58-60,64,66,69,190,191 Recognizing
the importance of improving health care services for children as part of a larger strategy to improve our
nation’s health, the ACA designated $200 million towards supporting the improvement and expansion of
services at SBHCs through the HRSA SBHC Capital program and the number of SBHCs grew by 20%
between 2010 and 2014.47,81 SBHCs have been suggested as a possible setting for PCMH
implementation, but may encounter challenges offering this model of continuous and comprehensive
care because many SBHCs are only open when school is in session.82,83 SBHCs also rely heavily on grant
funding and see many uninsured patients, so many not be able to afford the health information
71
technology or staffing needed to be a PCMH. SBHCs sponsored by larger health care organizations that
can see patients when the SBHC is not open and provide technical and technological support may be
able to implement elements of the PCMH model.82
The purpose of this study is to describe SBHC characteristics associated with different types of
PCMH recognition. This study is the first to examine formal PCMH certification using national data from
SBHCs and adds to the growing literature studying PCMH implementation in small practices and in
safety-net providers. To advance implementation of the medical home concept, more research is
needed to understand what influences practices to seek different types of PCMH recognition. Using
concepts from both resource dependency theory and institutional theory, the overall hypothesis for this
study was that SBHCs with greater internal munificence and more external isomorphic pressures will be
more likely to achieve PCMH certification. The influence of munificence, defined in this study as greater
availability of financial and/or human resources, was predicted to be positively associated with PCMH
recognition because undergoing practice transformations require significant investments of time, staff,
and money. External isomorphic pressures, represented in this study by the presence of a state
Medicaid PCMH initiative, SBHC participation in managed care arrangements, and specific sponsoring
organizations (e.g. FQHCs/CHCs) will be positively associated with increased odds of PCMH recognition.
Additionally, this study controls for features of the patient population, defined as environmental
complexity, that are known or suspected to be associated with medical home disparities. Environmental
complexity is represented by variables categorizing the patient age, rurality, race/ethnicity, poverty
level, and if the SBHC sees patients beyond just students. Patient age influences utilization patterns in
SBHCs and may in part dictate a practice’s ability or motivation to implement change in delivery of
services.158 Rural clinics are thought to experience significant difficulties to obtaining PCMH recognition,
and it has also been found that Non-Hispanic White children and children from families with higher
incomes are also more likely to have a medical home than their counterparts.22,192 Seeing patients
72
beyond their students may add to complexity because the expanded patient population may bring with
it more variety of health needs across the lifespan.
Methods
Data Source
The 2013-2014 National Census of School-Based Health Centers conducted by the SBHA was
used as the primary data source for this analysis. The SBHA has conducted the triennial national survey
of SBHCs since 1998 and uses an online survey to collect data about SBHC demographics, staffing,
services, financing, and clinical policies.47 The SBHA maintains a database of all known SBHCs in the
United States and regularly updates it by working with state affiliates, SBHC funders, and SBHA members
to identify new SBHCs and closed SBHCs. Before launching the census, contact information for
representatives of each SBHC are verified and within three months of census launch, all SBHCs that have
not completed the census are contacted to verify the SBHC’s information and to encourage census
completion.
Study Sample
Of the 2,315 known SBHCs in the United States, 1,900 responded to the 2013-2014 Census. Of
these 1,900 respondent SBHCs, 1,507 provide primary care and reported their PCMH status. After
removing observations missing responses on other key variables, 1,212 SBHCs were included in the final
sample for this study.
Dependent Variables
Two binary outcome variables were generated that indicate: (1) if a SBHC has received any type
of PCMH recognition, and (2) if they received PCMH recognition from a national organization (i.e. NCQA,
Joint Commission, or AAAHC). Other national-level PCMH certification programs are available, but were
not reported by any SBHC.
73
Independent Variables
Munificence: The total number of reported hours worked weekly by physicians, nurse
practitioners, and physician assistants was divided by 40 hours to calculate the mean PCP FTE. The FTE
for all staff members of the SBHC was also modeled as a continuous variable. The staffing model of the
health center categorizes the type of providers on staff at the SBHC into those that have (1) just PCPs
and behavioral health staff, (2) PCPs and other staff (e.g. dietician, optometrist, dentist), and (3) clinics
that offer PCPs, behavioral health, and other providers. The percent of total SBHC operational expenses
covered by patient billing was categorized into quartiles. The total number of funding sources received
by the SBHC and if they received HRSA SBHC Capital funding was also included in the model.
Complexity: SBHCs were also split into those based in schools that only have prekindergarten
through fifth grade and those that serve at least one grade of sixth or above. This categorization splits
the schools into those with only young children and those that have adolescents in their student
population. SBHCs were also differentiated into those that only see students as patients and those that
also treat non-students. Race/ethnicity and a proxy measure for student poverty, eligibility for free or
reduced price lunch, were also included. Children from families with incomes between 130% and 185%
percent of the federal poverty level (FPL) are eligible for reduced price meals and children from families
with incomes at or below 130% FPL are eligible for free meals.160 Medicaid and the Children’s Health
Insurance Program (CHIP) cover children up to 200% FPL in 49 states, so eligibility for free or reduced
lunch is a good indicator of Medicaid or CHIP eligibility.161 Zip code RUCA (rural-urban commuting areas)
approximation was used to categorize SBHC location into urban, large rural, small rural, and isolated
areas.162
Isomorphic Pressures: The sponsoring organizations were divided into 5 categories:
FQHCs/CHCs, hospitals, LHDs, school systems, and other (e.g. non-profit, behavioral health agency, or
74
university). SBHCs were also categorized by the presence of state-level Medicaid PCMH Initiatives and if
they were designated as a managed care preferred provider.163
Analysis
The prevalence of each SBHC characteristic was first examined for the entire sample and then
bivariate analyses by both PCMH outcome variables were conducted using chi-square tests and two-
tailed t-tests. The relationship between both PCMH recognition outcomes and SBHC characteristics
were analyzed using multivariable logistic regression. Survey respondents are nested within sponsoring
organizations and by state. Logistic regression with clustering on the state where the SBHC is located
was used to adjust for correlated nature of the data.164 Cluster characteristics, such as a small number of
SBHC respondents in some states and many sponsoring organizations that only oversee one SBHC,
would cause bias in multi-level modelling.165,166 Generalized estimating equations were also ruled out
due to biased estimates with binary outcome variables in models with 50 small, unbalanced clusters.193
The data were analyzed using STATA software, version 14 (Stata- Corp. 2015. Stata Statistical Software:
Release 14. College Station, TX: StataCorp LP).
Results
The characteristics of the SBHCs in this study sample are shown in Table 15. Most (71%) of
SBHCs are not recognized as a PCMH, but 12% and 17% have received local and national certification,
respectively. The majority have <=1 PCP FTE on staff (88%), have a staffing model of at least three
different specialties of health care providers (56%), are in urban areas (83%), and are in schools with
adolescents (87%). Clinical health care organizations, such as FQHC/CHCs (39%) and hospitals (21%),
represent most sponsoring organizations. Half (50%) are designated as managed care preferred
providers/medical homes and 62% are in states with Medicaid PCMH initiatives. The SBHCs serve a
racially and ethnically diverse student population with a mean value of 33% of the student population at
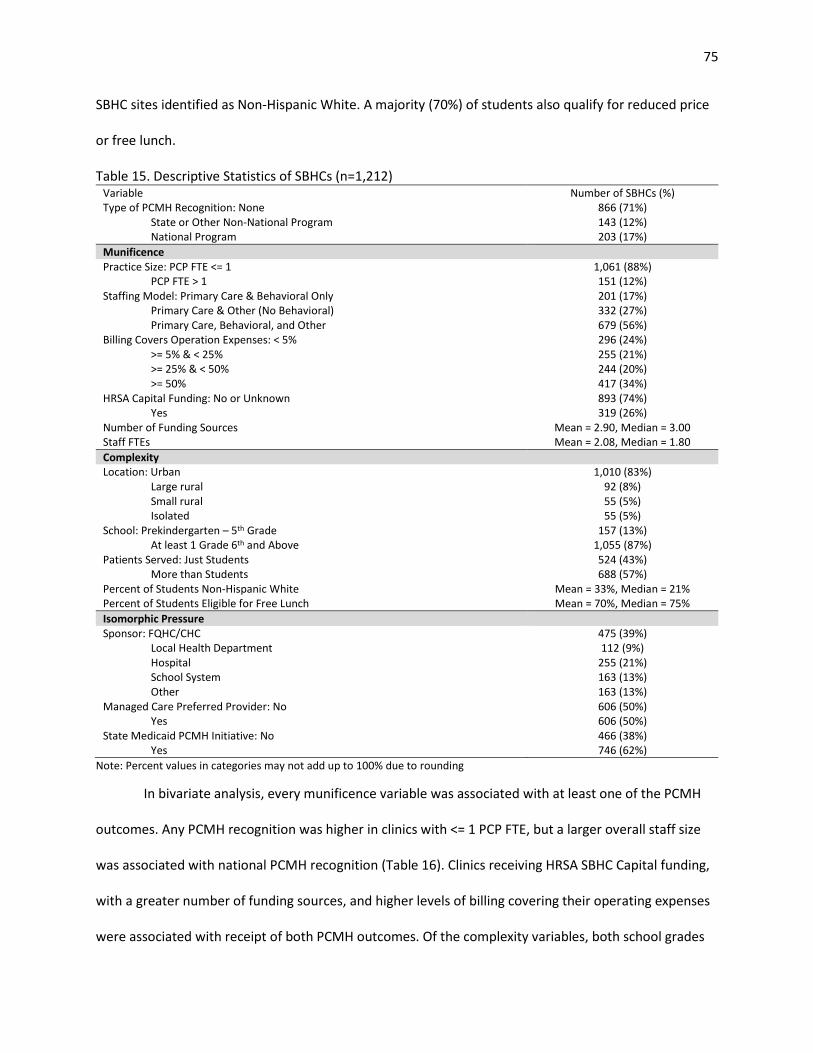
75
SBHC sites identified as Non-Hispanic White. A majority (70%) of students also qualify for reduced price
or free lunch.
Table 15. Descriptive Statistics of SBHCs (n=1,212) Variable Number of SBHCs (%) Type of PCMH Recognition: None 866 (71%)
State or Other Non-National Program 143 (12%) National Program 203 (17%)
Munificence Practice Size: PCP FTE <= 1 1,061 (88%)
PCP FTE > 1 151 (12%) Staffing Model: Primary Care & Behavioral Only 201 (17%)
Primary Care & Other (No Behavioral) 332 (27%) Primary Care, Behavioral, and Other 679 (56%)
Billing Covers Operation Expenses: < 5% 296 (24%) >= 5% & < 25% 255 (21%) >= 25% & < 50% 244 (20%) >= 50% 417 (34%)
HRSA Capital Funding: No or Unknown 893 (74%) Yes 319 (26%)
Number of Funding Sources Mean = 2.90, Median = 3.00 Staff FTEs Mean = 2.08, Median = 1.80
Complexity Location: Urban 1,010 (83%)
Large rural 92 (8%) Small rural 55 (5%) Isolated 55 (5%)
School: Prekindergarten – 5th Grade 157 (13%) At least 1 Grade 6th and Above 1,055 (87%)
Patients Served: Just Students 524 (43%) More than Students 688 (57%)
Percent of Students Non-Hispanic White Mean = 33%, Median = 21% Percent of Students Eligible for Free Lunch Mean = 70%, Median = 75%
Isomorphic Pressure Sponsor: FQHC/CHC 475 (39%)
Local Health Department 112 (9%) Hospital 255 (21%) School System 163 (13%) Other 163 (13%)
Managed Care Preferred Provider: No 606 (50%) Yes 606 (50%)
State Medicaid PCMH Initiative: No 466 (38%) Yes 746 (62%)
Note: Percent values in categories may not add up to 100% due to rounding
In bivariate analysis, every munificence variable was associated with at least one of the PCMH
outcomes. Any PCMH recognition was higher in clinics with <= 1 PCP FTE, but a larger overall staff size
was associated with national PCMH recognition (Table 16). Clinics receiving HRSA SBHC Capital funding,
with a greater number of funding sources, and higher levels of billing covering their operating expenses
were associated with receipt of both PCMH outcomes. Of the complexity variables, both school grades
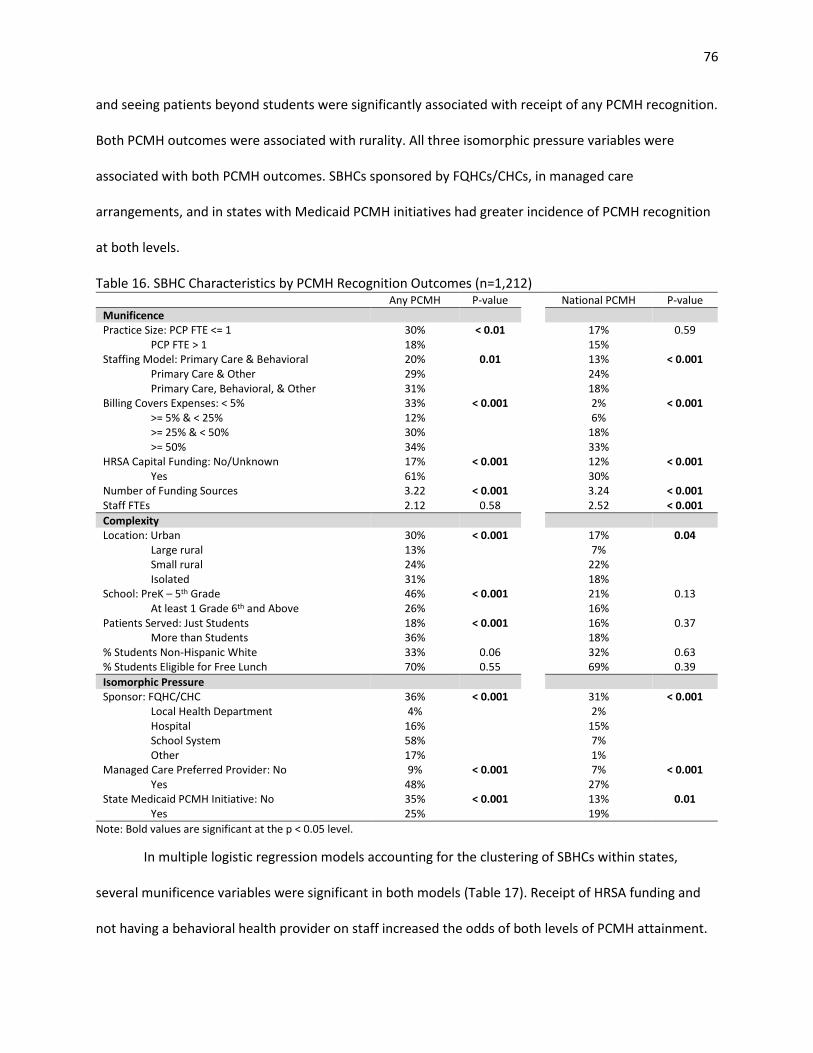
76
and seeing patients beyond students were significantly associated with receipt of any PCMH recognition.
Both PCMH outcomes were associated with rurality. All three isomorphic pressure variables were
associated with both PCMH outcomes. SBHCs sponsored by FQHCs/CHCs, in managed care
arrangements, and in states with Medicaid PCMH initiatives had greater incidence of PCMH recognition
at both levels.
Table 16. SBHC Characteristics by PCMH Recognition Outcomes (n=1,212) Any PCMH P-value National PCMH P-value
Munificence Practice Size: PCP FTE <= 1 30% < 0.01 17% 0.59
PCP FTE > 1 18% 15% Staffing Model: Primary Care & Behavioral 20% 0.01 13% < 0.001
Primary Care & Other 29% 24% Primary Care, Behavioral, & Other 31% 18%
Billing Covers Expenses: < 5% 33% < 0.001 2% < 0.001 >= 5% & < 25% 12% 6% >= 25% & < 50% 30% 18% >= 50% 34% 33%
HRSA Capital Funding: No/Unknown 17% < 0.001 12% < 0.001 Yes 61% 30%
Number of Funding Sources 3.22 < 0.001 3.24 < 0.001 Staff FTEs 2.12 0.58 2.52 < 0.001
Complexity Location: Urban 30% < 0.001 17% 0.04
Large rural 13% 7% Small rural 24% 22% Isolated 31% 18%
School: PreK – 5th Grade 46% < 0.001 21% 0.13 At least 1 Grade 6th and Above 26% 16%
Patients Served: Just Students 18% < 0.001 16% 0.37 More than Students 36% 18%
% Students Non-Hispanic White 33% 0.06 32% 0.63 % Students Eligible for Free Lunch 70% 0.55 69% 0.39
Isomorphic Pressure Sponsor: FQHC/CHC 36% < 0.001 31% < 0.001
Local Health Department 4% 2% Hospital 16% 15% School System 58% 7% Other 17% 1%
Managed Care Preferred Provider: No 9% < 0.001 7% < 0.001 Yes 48% 27%
State Medicaid PCMH Initiative: No 35% < 0.001 13% 0.01 Yes 25% 19%
Note: Bold values are significant at the p < 0.05 level.
In multiple logistic regression models accounting for the clustering of SBHCs within states,
several munificence variables were significant in both models (Table 17). Receipt of HRSA funding and
not having a behavioral health provider on staff increased the odds of both levels of PCMH attainment.
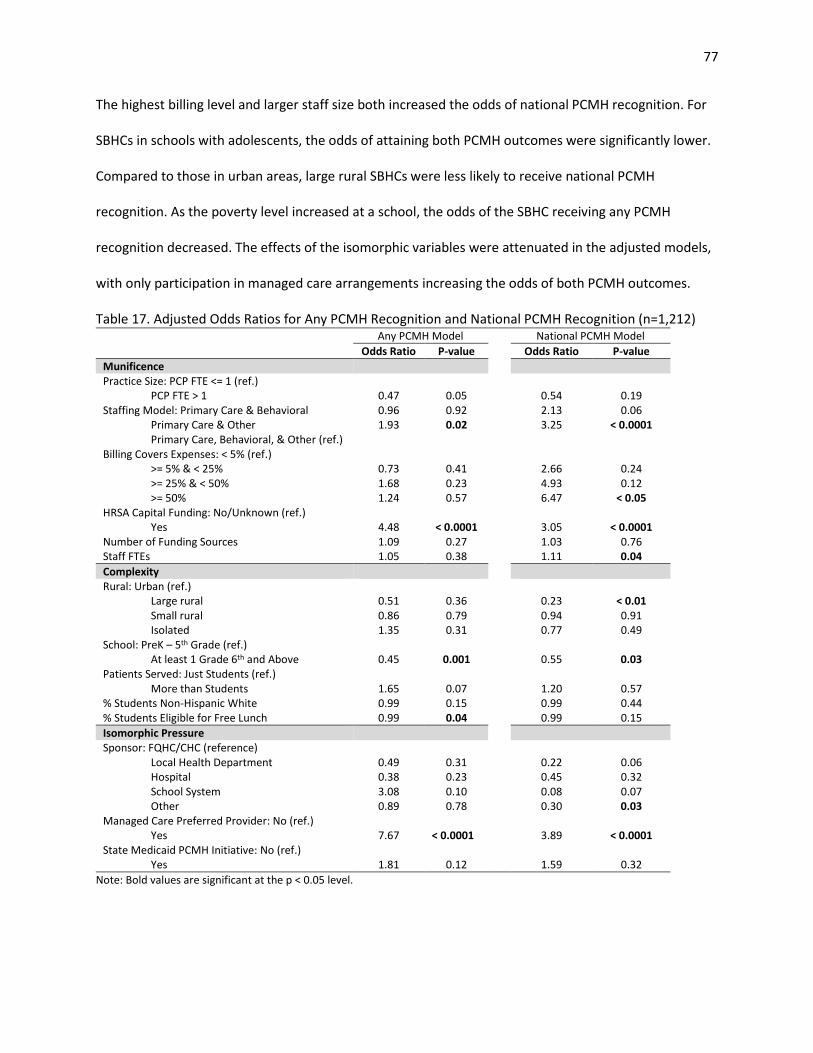
77
The highest billing level and larger staff size both increased the odds of national PCMH recognition. For
SBHCs in schools with adolescents, the odds of attaining both PCMH outcomes were significantly lower.
Compared to those in urban areas, large rural SBHCs were less likely to receive national PCMH
recognition. As the poverty level increased at a school, the odds of the SBHC receiving any PCMH
recognition decreased. The effects of the isomorphic variables were attenuated in the adjusted models,
with only participation in managed care arrangements increasing the odds of both PCMH outcomes.
Table 17. Adjusted Odds Ratios for Any PCMH Recognition and National PCMH Recognition (n=1,212) Any PCMH Model National PCMH Model
Odds Ratio P-value Odds Ratio P-value
Munificence Practice Size: PCP FTE <= 1 (ref.)
PCP FTE > 1 0.47 0.05 0.54 0.19 Staffing Model: Primary Care & Behavioral 0.96 0.92 2.13 0.06
Primary Care & Other 1.93 0.02 3.25 < 0.0001 Primary Care, Behavioral, & Other (ref.)
Billing Covers Expenses: < 5% (ref.) >= 5% & < 25% 0.73 0.41 2.66 0.24 >= 25% & < 50% 1.68 0.23 4.93 0.12 >= 50% 1.24 0.57 6.47 < 0.05
HRSA Capital Funding: No/Unknown (ref.) Yes 4.48 < 0.0001 3.05 < 0.0001
Number of Funding Sources 1.09 0.27 1.03 0.76 Staff FTEs 1.05 0.38 1.11 0.04
Complexity Rural: Urban (ref.)
Large rural 0.51 0.36 0.23 < 0.01 Small rural 0.86 0.79 0.94 0.91 Isolated 1.35 0.31 0.77 0.49
School: PreK – 5th Grade (ref.) At least 1 Grade 6th and Above 0.45 0.001 0.55 0.03
Patients Served: Just Students (ref.) More than Students 1.65 0.07 1.20 0.57
% Students Non-Hispanic White 0.99 0.15 0.99 0.44 % Students Eligible for Free Lunch 0.99 0.04 0.99 0.15
Isomorphic Pressure Sponsor: FQHC/CHC (reference)
Local Health Department 0.49 0.31 0.22 0.06 Hospital 0.38 0.23 0.45 0.32 School System 3.08 0.10 0.08 0.07 Other 0.89 0.78 0.30 0.03
Managed Care Preferred Provider: No (ref.) Yes 7.67 < 0.0001 3.89 < 0.0001
State Medicaid PCMH Initiative: No (ref.) Yes 1.81 0.12 1.59 0.32
Note: Bold values are significant at the p < 0.05 level.
78
Discussion
This study found that both the SBHCs’ internal and external environmental variables were
independently associated with the PCMH outcomes. Any PCMH recognition was less likely for SBHCs
located in schools with increasing amounts of low-income students, similar to previous research that
found low-income patients are less likely to have a medical home.22 Student race/ethnicity was not
significant in the adjusted models or bivariate analysis. This is a different finding than prior research
conducted using patient-level data that found Non-Hispanic White patients are more likely to be served
by PCMHs.22 This discrepancy may be because SBHCs’ intentions are to specifically address health care
access disparities that may be related to issues such as race/ethnicity.
SBHCs that covered more of their operational expenses through patient billing had greater odds
of being nationally PCMH recognized. Given prior research showing cost as a barrier to PCMH
implementation and the need for reliable funding to support PCMH adoption, it is most likely that SBHCs
with low billing revenue cannot afford to seek PCMH recognition.189 The low billing revenue may be
caused by seeing a high number of uninsured patients, who then in turn may miss out on the possible
benefits of receiving care from a PCMH. Billing revenue was not significant in the any type of PCMH
model and this most likely reflects that is more expensive to obtain national-level PCMH recognition
than state or local recognition as a PCMH.
This study revealed an association between SBHC sponsor type and national PCMH recognition.
FQHC/CHCs are the most common sponsor of SBHCs and were significantly more likely to be nationally
recognized than SBHCs sponsored by “other” groups. While not meeting the P < 0.05 cutoff, LHD (OR =
0.22, p = 0.06) and school system sponsored (OR = 0.08, p = 0.07) SBHCs were also less likely to have
national-level recognition. There are several possible explanations for FQHCs/CHCs increased odds of
national PCMH recognition. For example, FQHCs are required to have patient-majority governing boards
and practices incorporating patient feedback are more likely to deliver patient-centered care.86 FQHC
79
sponsored SBHCs may also have been more likely to be nationally certified due to transformation
facilitation occurring at the FQHC level. In addition to the costs associated with practice changes needed
for PCMH adoption, receiving NCQA or Joint Commission PCMH recognition requires significant time and
personnel investment to demonstrate how PCMH requirements are met by the practice. The ACA’s
FQHC Advanced Primary Care Practice Demonstration, which ended in 2013, provided financial and
technical assistance to 434 FQHCs to help them become NCQA PCMH recognized.9 Previous research has
demonstrated the helpfulness of external support for PCMH adoption and nationally certified FQHCs
may have been able to provide technical assistance and support to SBHCs they sponsor.184
Compared to the other sponsoring organizations, FQHCs/CHCs and hospitals can probably
provide several different types of PCMH support to their SBHCs. FQHCs/CHCs and hospitals may also be
able to provide after-hours appointments to patients when the SBHC is closed to meet PCMH
requirements for enhanced access. FQHCs/CHCs and hospitals will most likely have more expertise with
health information technology, billing, and reporting clinical performance measures. Using advanced
health information technology was a significant barrier to seeking PCMH implementation in prior
research, and may be a limiting factor for SBHCs sponsored by health departments, school systems, and
non-profits.86,189
SBHCs that were recognized as managed care preferred providers/medical homes had greater
odds of both PCMH outcomes. This is not surprising for several reasons. Managed care organizations
frequently offer incentive payments to contracted providers that control the costs of treating their
patients. The managed care organizations’ emphasis on coordinated care and preventative services may
be supportive of adoption of some PCMH elements.194 Additionally, approximately 80% of Medicaid
enrollees receive most of their care through managed care arrangements.195 As a high proportion of
their patients are Medicaid enrolled or eligible, SBHCs that do not participate in managed care contracts
may not be sufficiently reimbursed for services provided to Medicaid clients.82 If the SBHC is not a
80
managed care preferred provider, patients may also choose to seek care outside the SBHC, which
decreases the population of insured patients seen by the SBHC. As SBHCs serve many students without
health insurance, billing revenue from insured students is needed to maintain financial sustainability.82
The number of funding sources for services at the SBHC was not associated with either PCMH outcome.
With the high costs of seeking PCMH certification, at least at the national level, it was expected that
SBHCs with more diversified funding sources might have better practice reserve to fund transformation
efforts. Lack of financial support for PCMH initiatives is a major barrier in safety-net clinics, but so is
funding stream continuity with grants only supporting activities for limited periods of time.189 With the
limited duration of grant funding or constraints on how the money is used, the number of funding
sources does not seem to be critical to seeking formal PCMH designation. More stable and ongoing
financial resources, such as from patient billing revenue, may be more supportive of sustained practice
change.
SBHCs that received HRSA SBHC Capital funding had significantly higher odds of any type of
PCMH recognition and of national-level PCMH recognition. The HRSA SBHC Capital grants were intended
to improve and expand services at SBHCs, but were not designated for any specific PCMH component or
for SBHCs to seek PCMH recognition.81 The primary use of these grant funds was to renovate or build
new facilities for SBHCs. Due to the cross-sectional nature of the data used in this study, it is not possible
to know if receipt of federal funding for facility costs freed up SBHC resources to invest in PCMH
implementation, or if progressive SBHCs that had already adopted the PCMH model of care were more
likely to receive HRSA funding. New physical spaces for the SBHC may also improve workflow and better
accommodate delivering health care in the team-based environment required by the PCMH model.
It was somewhat surprising that SBHCs without a behavioral health provider on staff had greater
odds of PCMH recognition. The integration of behavioral health services into primary care and providing
care for all the patient’s healthcare needs are components of the PCMH model. As previously discussed,
81
SBHCs are generally small with limited budgets. SBHCs that choose to not hire a behavioral health
provider may still meet NCQA PCMH requirements by demonstrating how care is coordinated between
primary care and behavioral health.93 By not having a behavioral health provider on staff and instead
coordinating care with a behavioral health provider that may be a part of the school system or out in the
community, SBHCs may be able to save money that can be used to implement other required PCMH
elements.
SBHCs in states with Medicaid PCMH Initiatives were not more likely to receive either type of
PCMH designation. Prior research has also found that state-level characteristics/policies are not
associated with children’s access to medical homes.96 In this analysis, PCMH initiatives must have been
in place by June 2012, and the SBHA Census survey was administered in 2013. It may take several years
for the state PCMH Initiatives to produce tangible results, and analysis of later years of SBHA Census
data may be a better predictor of the effects of the state programs.196
Finally, SBHCs located in schools with adolescent students had lower odds of receiving both
PCMH outcomes. Early PCMH initiatives focused on mothers and children so Medicaid and local
initiatives may have targeted providers treating young children for inclusion into their PCMH
programs.163 In addition to the basic primary care offered by most SBHCs, SBHCs treating adolescents
may also offer sexual and reproductive health services and health promotion activities targeting drug
and alcohol use, intimate partner violence, suicide, and general violence (e.g. guns, gangs, fighting).47
The variety of services needed in an SBHC that sees adolescents, especially for health promotion
activities which are generally not billable to insurance providers, may limit the ability of these SBHCs to
pursue formal PCMH recognition.
SBHCs are frequently the main source of care for a large percentage of their adolescent patients,
especially when the adolescent is uninsured.83 If the PCMH model is indeed a facilitator of better quality
care, it is concerning that this model is less likely to be used since most SBHCs are based in schools with
82
adolescents. Adolescence is a key time frame when high-risk behaviors (i.e. smoking and alcohol use)
that cause adult morbidity begin and the PCMH care model could improve adolescent and subsequently
adult health.197 It is important to consider that there was no difference between SBHCs in schools with
adolescents and those with only young children in the national PCMH model. The findings from this
study may just reflect that SBHCs with adolescents are not targeted for local PCMH programs, but could
still achieve national PCMH recognition. It is also currently unclear if there are differences in patient
health and cost outcomes amongst the different PCMH programs.186
This study had a few limitations. First, the cross-sectional study design does not allow for
causality inferences. Second, the survey responses came from a single person within each SBHC and
PCMH recognition status was not independently validated by the study authors. Additionally, the
outcome measures of any PCMH recognition and national-level PCMH recognition most likely do not
fully capture PCMH implementation.198 Assessing these two outcomes separately recognizes that there
are possibly differences in levels of PCMH functionality in a clinic that has received any type of PCMH
designation compared to those with national recognition; however, these two outcomes are not
mutually exclusive. Many PCMH programs use NCQA accreditation standards, so an SBHC could receive
both types of PCMH designation, but have only reported one type in the Census. This violation of
independence between the outcomes prevented use of multinomial regression which could have
provided more precise estimates of the effects of SBHC characteristics on different types of PCMH
recognition. Finally, the 2013-2014 Census had responses from 82% of all known SBHCs and can be
considered broadly representative of SBHCs. The Census does not weight respondents or provide
information about non-respondents, therefore the results may not be nationally representative of all
SBHCs.
83
Implications and Contributions
Despite limitations such as small practice size and limited funding, SBHCs can achieve formal
PCMH recognition. Several organizational characteristics of the SBHCs were found to be associated with
the different types of PCMH recognition. SBHCs that covered higher amounts of their operational
expenses through patient billing revenue, that received HRSA SBHC funding, had larger staff sizes, and
participated in managed care arrangements were the most likely to receive national-level PCMH
recognition. These findings reflect that a high capacity of financial and staff resources (munificence) are
needed for national-level PCMH recognition and that the cost and quality goals of managed care
(isomorphic pressure) are supportive of PCMH implementation. Additionally, SBHCs based in schools
that include adolescents (complexity) were less likely to have both levels of PCMH recognition and
efforts should be made to increase medical home activity in these SBHCs. In comparing the two models,
there were differences in significant associations between the PCMH outcomes and the munificence,
complexity, and isomorphic pressure variables. While further research needs to determine if state-level
or national-level PCMH programs are comparable in producing desired patient outcomes, it is important
to recognize that different factors may influence providers’ ability to seek one type of recognition over
the other.
84
CHAPTER 5: DISCUSSION
Summary and Synthesis
The purpose of this dissertation was to apply organization behavioral theories and adoption of
innovation theory to understand the factors associated with adoption of individual PCMH attributes,
higher levels of PCMH capacity, and formal recognition as a PCMH in SBHCs. First, the SBHC PCMH Index
was created using factor analysis and was used to identify individual PCMH attribute adoption and
PCMH capacity in SBHCs. A conceptual framework using elements of resource dependency theory,
institutional theory, and diffusion of innovations theory guided the design of the last two studies that
evaluated PCMH capacity and PCMH recognition as a product of SBHC environmental characteristics.
The extent to which these two studies supported the conceptual framework will be addressed along
with a discussion of how the findings from all three studies answer the research questions posed in the
Introduction.
Research Questions
Article 1: Identifying Patient-Centered Medical Home Attributes in School-Based Health Centers
Specific Aim 1: Identify individual PCMH attributes and describe overall PCMH capacity in SBHCs.
Question 1.1: Are there specific PCMH components that are adopted consistently in SBHCs?
Consistent adoption will be defined as at least 50% of SBHCs reported use of the attribute as
measured using the SBHC PCMH Index. In the adolescent version of the Index, 14 of 18 attributes were
adopted in over half of the SBHCs. These commonly adopted attributes were: using an EHR, using
electronic prescribing, having afterhours care, collecting data for quality improvement, using measures
of patient satisfaction in the quality assurance system, having students or parents/guardians participate
in advisory roles, offering comprehensive health assessments (all five components), offering chronic
disease management, and providing health education classes. Of these 14 attributes, only electronic
85
prescribing and health education were not positively significantly associated with receipt of formal
PCMH recognition.
Question 1.2: Are there specific PCMH components that have low incidence of adoption in SBHCs?
Four PCMH attributes were not frequently adopted by SBHCs. Only 34% allowed student and
parent/guardians to participate in the design of health services, 8% received care coordination
payments, 19% received supplemental payments for care coordination, and less than half (48%) have
achieved either Stage 1 or Stage 2 of Meaningful Use attestation.
Question 1.3: Is there evidence of PCMH adoption disparities by SBHCs that serve different student
populations?
In Article 1, the SBHCs’ overall PCMH capacity and adoption of individual PCMH components
was compared between those based in schools with only young children and those in schools that
include adolescents. These two types of SBHCs had the exact same score on the overall Index (64%) and
there were no significant differences in domain or dimension scores. However, adoption of specific
PCMH components differed between these two groups. SBHCs based in schools with only young children
reported greater use of EHR/EMRs (94% vs 84%, p < 0.001), receipt of capitated payments for care
coordination (16% vs 7%, p < 0.001), and more participation of patients and parents/guardians in design
of the SBHC services (42% vs 33%, p < 0.012). However, SBHCs based in schools with adolescents
reported greater achievement of EHR Meaningful Use (50% vs 38%, p = 0.003) and more provision of
health education classes (97% vs 92%, p = 0.002).
Article 2: Patient-Centered Medical Home Capacity in School-Based Health Centers
Specific Aim 2: Identify SBHC characteristics that are associated with the adoption of individual PCMH
components and overall PCMH capacity score.
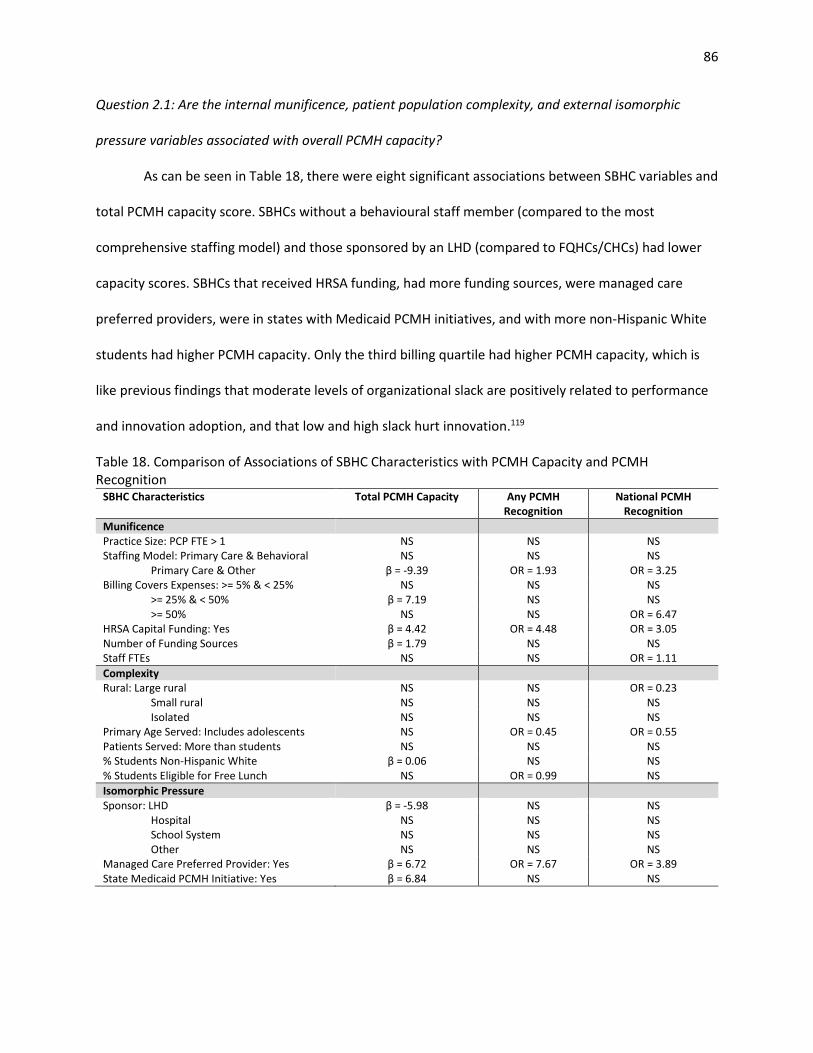
86
Question 2.1: Are the internal munificence, patient population complexity, and external isomorphic
pressure variables associated with overall PCMH capacity?
As can be seen in Table 18, there were eight significant associations between SBHC variables and
total PCMH capacity score. SBHCs without a behavioural staff member (compared to the most
comprehensive staffing model) and those sponsored by an LHD (compared to FQHCs/CHCs) had lower
capacity scores. SBHCs that received HRSA funding, had more funding sources, were managed care
preferred providers, were in states with Medicaid PCMH initiatives, and with more non-Hispanic White
students had higher PCMH capacity. Only the third billing quartile had higher PCMH capacity, which is
like previous findings that moderate levels of organizational slack are positively related to performance
and innovation adoption, and that low and high slack hurt innovation.119
Table 18. Comparison of Associations of SBHC Characteristics with PCMH Capacity and PCMH Recognition
SBHC Characteristics Total PCMH Capacity Any PCMH Recognition
National PCMH Recognition
Munificence Practice Size: PCP FTE > 1 NS NS NS Staffing Model: Primary Care & Behavioral NS NS NS
Primary Care & Other β = -9.39 OR = 1.93 OR = 3.25 Billing Covers Expenses: >= 5% & < 25% NS NS NS
>= 25% & < 50% β = 7.19 NS NS >= 50% NS NS OR = 6.47
HRSA Capital Funding: Yes β = 4.42 OR = 4.48 OR = 3.05 Number of Funding Sources β = 1.79 NS NS Staff FTEs NS NS OR = 1.11
Complexity Rural: Large rural NS NS OR = 0.23
Small rural NS NS NS Isolated NS NS NS
Primary Age Served: Includes adolescents NS OR = 0.45 OR = 0.55 Patients Served: More than students NS NS NS % Students Non-Hispanic White β = 0.06 NS NS % Students Eligible for Free Lunch NS OR = 0.99 NS
Isomorphic Pressure Sponsor: LHD β = -5.98 NS NS
Hospital NS NS NS School System NS NS NS Other NS NS NS
Managed Care Preferred Provider: Yes β = 6.72 OR = 7.67 OR = 3.89 State Medicaid PCMH Initiative: Yes β = 6.84 NS NS
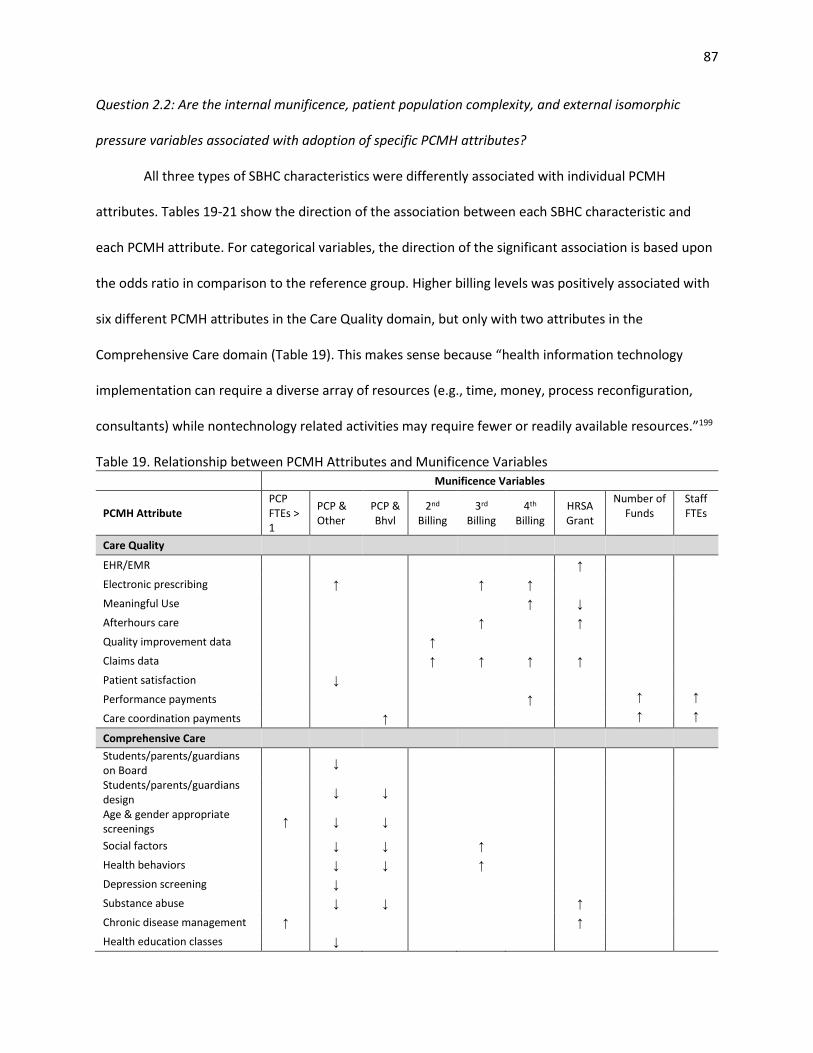
87
Question 2.2: Are the internal munificence, patient population complexity, and external isomorphic
pressure variables associated with adoption of specific PCMH attributes?
All three types of SBHC characteristics were differently associated with individual PCMH
attributes. Tables 19-21 show the direction of the association between each SBHC characteristic and
each PCMH attribute. For categorical variables, the direction of the significant association is based upon
the odds ratio in comparison to the reference group. Higher billing levels was positively associated with
six different PCMH attributes in the Care Quality domain, but only with two attributes in the
Comprehensive Care domain (Table 19). This makes sense because “health information technology
implementation can require a diverse array of resources (e.g., time, money, process reconfiguration,
consultants) while nontechnology related activities may require fewer or readily available resources.”199
Table 19. Relationship between PCMH Attributes and Munificence Variables
Munificence Variables
PCMH Attribute PCP FTEs > 1
PCP & Other
PCP & Bhvl
2nd Billing
3rd Billing
4th Billing
HRSA Grant
Number of Funds
Staff FTEs
Care Quality
EHR/EMR ↑
Electronic prescribing ↑ ↑ ↑
Meaningful Use ↑ ↓
Afterhours care ↑ ↑
Quality improvement data ↑
Claims data ↑ ↑ ↑ ↑
Patient satisfaction ↓
Performance payments ↑ ↑ ↑
Care coordination payments ↑ ↑ ↑
Comprehensive Care
Students/parents/guardians on Board
↓
Students/parents/guardians design
↓ ↓
Age & gender appropriate screenings
↑ ↓ ↓
Social factors ↓ ↓ ↑
Health behaviors ↓ ↓ ↑
Depression screening ↓
Substance abuse ↓ ↓ ↑
Chronic disease management ↑ ↑
Health education classes ↓
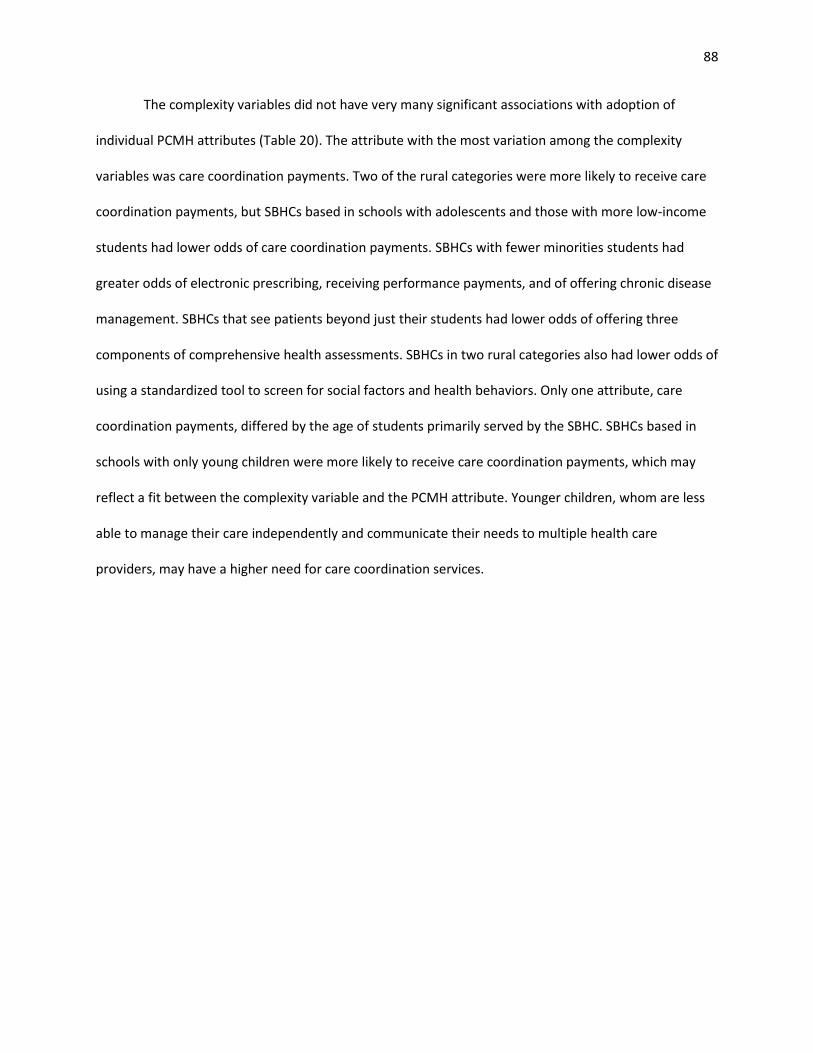
88
The complexity variables did not have very many significant associations with adoption of
individual PCMH attributes (Table 20). The attribute with the most variation among the complexity
variables was care coordination payments. Two of the rural categories were more likely to receive care
coordination payments, but SBHCs based in schools with adolescents and those with more low-income
students had lower odds of care coordination payments. SBHCs with fewer minorities students had
greater odds of electronic prescribing, receiving performance payments, and of offering chronic disease
management. SBHCs that see patients beyond just their students had lower odds of offering three
components of comprehensive health assessments. SBHCs in two rural categories also had lower odds of
using a standardized tool to screen for social factors and health behaviors. Only one attribute, care
coordination payments, differed by the age of students primarily served by the SBHC. SBHCs based in
schools with only young children were more likely to receive care coordination payments, which may
reflect a fit between the complexity variable and the PCMH attribute. Younger children, whom are less
able to manage their care independently and communicate their needs to multiple health care
providers, may have a higher need for care coordination services.
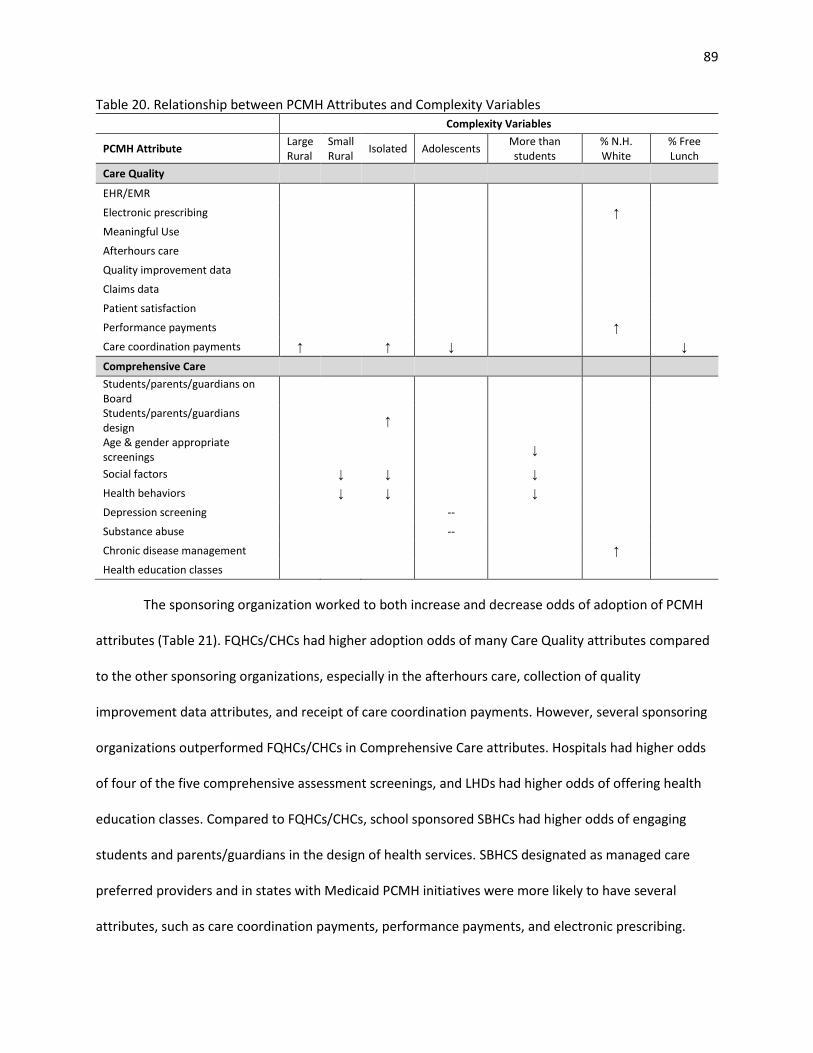
89
Table 20. Relationship between PCMH Attributes and Complexity Variables Complexity Variables
PCMH Attribute Large Rural
Small Rural
Isolated Adolescents More than students
% N.H. White
% Free Lunch
Care Quality
EHR/EMR
Electronic prescribing ↑
Meaningful Use
Afterhours care
Quality improvement data
Claims data
Patient satisfaction
Performance payments ↑
Care coordination payments ↑ ↑ ↓ ↓
Comprehensive Care
Students/parents/guardians on Board
Students/parents/guardians design
↑
Age & gender appropriate screenings
↓
Social factors ↓ ↓ ↓
Health behaviors ↓ ↓ ↓
Depression screening --
Substance abuse --
Chronic disease management ↑
Health education classes
The sponsoring organization worked to both increase and decrease odds of adoption of PCMH
attributes (Table 21). FQHCs/CHCs had higher adoption odds of many Care Quality attributes compared
to the other sponsoring organizations, especially in the afterhours care, collection of quality
improvement data attributes, and receipt of care coordination payments. However, several sponsoring
organizations outperformed FQHCs/CHCs in Comprehensive Care attributes. Hospitals had higher odds
of four of the five comprehensive assessment screenings, and LHDs had higher odds of offering health
education classes. Compared to FQHCs/CHCs, school sponsored SBHCs had higher odds of engaging
students and parents/guardians in the design of health services. SBHCS designated as managed care
preferred providers and in states with Medicaid PCMH initiatives were more likely to have several
attributes, such as care coordination payments, performance payments, and electronic prescribing.
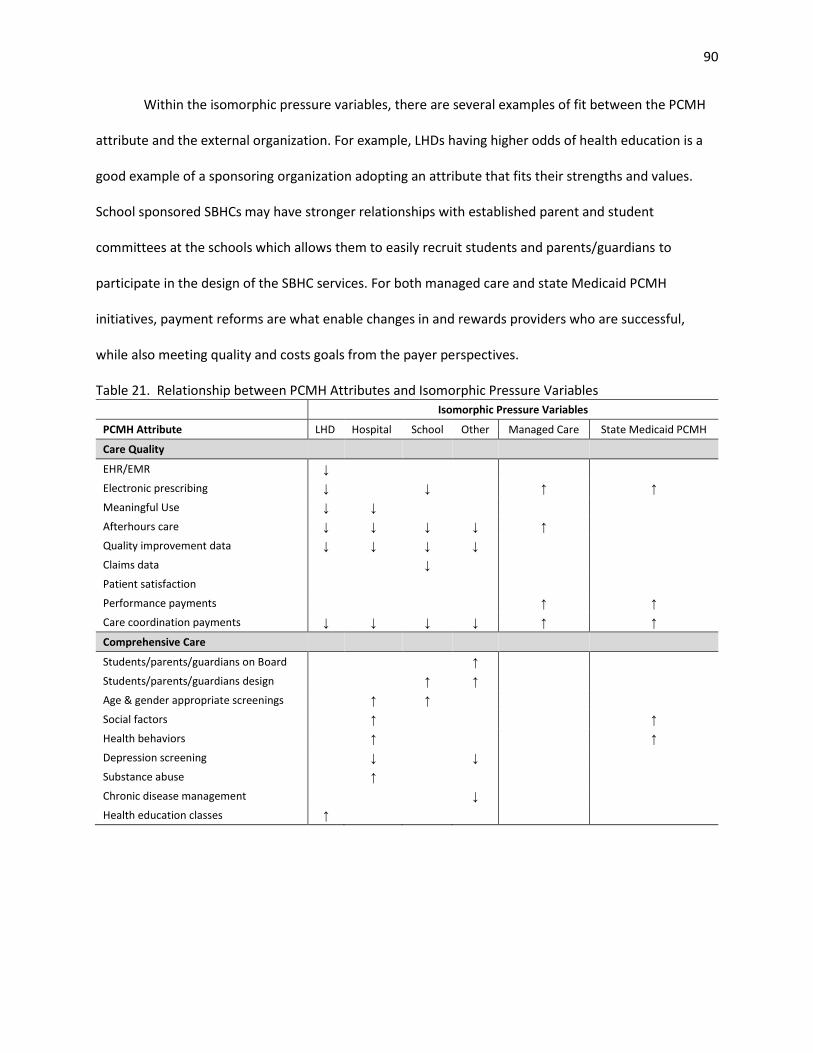
90
Within the isomorphic pressure variables, there are several examples of fit between the PCMH
attribute and the external organization. For example, LHDs having higher odds of health education is a
good example of a sponsoring organization adopting an attribute that fits their strengths and values.
School sponsored SBHCs may have stronger relationships with established parent and student
committees at the schools which allows them to easily recruit students and parents/guardians to
participate in the design of the SBHC services. For both managed care and state Medicaid PCMH
initiatives, payment reforms are what enable changes in and rewards providers who are successful,
while also meeting quality and costs goals from the payer perspectives.
Table 21. Relationship between PCMH Attributes and Isomorphic Pressure Variables
Isomorphic Pressure Variables
PCMH Attribute LHD Hospital School Other Managed Care State Medicaid PCMH
Care Quality
EHR/EMR ↓
Electronic prescribing ↓ ↓ ↑ ↑
Meaningful Use ↓ ↓
Afterhours care ↓ ↓ ↓ ↓ ↑
Quality improvement data ↓ ↓ ↓ ↓
Claims data ↓
Patient satisfaction
Performance payments ↑ ↑
Care coordination payments ↓ ↓ ↓ ↓ ↑ ↑
Comprehensive Care
Students/parents/guardians on Board ↑
Students/parents/guardians design ↑ ↑
Age & gender appropriate screenings ↑ ↑
Social factors ↑ ↑
Health behaviors ↑ ↑
Depression screening ↓ ↓
Substance abuse ↑
Chronic disease management ↓
Health education classes ↑
91
Question 2.3: Between the three types of variables, is there one group that appears to be more strongly
associated with overall PCMH capacity and adoption of specific PCMH components?
The munificence variables were frequently associated with increased PCMH capacity and many
Care Quality attributes. Complexity had minimal effect on PCMH capacity, but was associated with a few
specific PCMH attributes. Isomorphic pressure variables were associated with PCMH capacity and
several individual PCMH attributes. To generalize, munificence is associated more with individual PCMH
attributes that require resource investments of time, money, staff while non-technology PCMH
attributes may be more associated with isomorphic pressure variables. The exception to this
generalization is the pressure variable of FQHC/CHC sponsorship which was associated with HIT
attributes; FQHC/CHC sponsorship may also be representative of a munificence variable due to the
resources (e.g. HIT support, experience in the FQHC PCMH demonstration projects) available to SBHCs
they sponsor.
Question 2.3: Controlling for other characteristics of the SBHC, is there evidence of PCMH adoption
disparities by SBHCs that serve different student populations?
SBHCs with more non-Hispanic white students had a higher total PCMH capacity score. This is
because three attributes (e.g. electronic prescribing, performance payments, and chronic disease
management) had lower odds of adoption as the percent of racial and ethnic minority students
increased. While overall capacity was not significantly associated with any other complexity variable,
several complexity variables were associated with individual PCMH attributes. SBHCs seeing patients
beyond students had lower odds of using standardized screening tools for social factors, health
behaviors, and age and gender appropriate screenings. Some rural SBHCs had lower odds of using
screening tools for social factors and health behaviors, but had higher odds of receiving care
coordination payments. Both adolescent serving SBHCs and those with more low-income students had
lower odds of care coordination payments.
92
Article 3: Correlates of Patient-Centered Medical Home Recognition in School-Based Health Centers
Specific Aim 3: Compare the SBHC characteristics associated with different PCMH recognition
outcomes.
Question 3.1: Are the internal munificence, patient population complexity, and external isomorphic
pressure variables associated with formal PCMH recognition?
As can be seen in Table 18, there were many significant associations between SBHC
characteristics and both definitions of formal PCMH recognition. Consistent across both models, being a
managed care preferred provider, being based in a school without adolescents, receiving HRSA funding,
and having a staffing model that consists of primary care and other specialty (not behavioral health)
were associated with increased odds of PCMH recognition.
Question 3.2: Does how you define formal PCMH recognition affect associations between the recognition
outcome and the SBHC characteristics?
Some associations between SBHC characteristic variables and the outcome changed depending
upon how formal PCMH recognition was defined. For example, more staff and the highest quartile of
billing were associated with national PCMH recognition, but was not associated with receipt of any type
of PCMH recognition. SBHCs in large rural areas were less likely to receive national PCMH recognition,
but was not associated with receipt of any type of PCMH recognition. Poverty was negatively associated
with any PCMH recognition, but not national PCMH recognition.
Question 3.3: Is there evidence of disparities in formal PCMH recognition achievement by SBHCs that
serve different student populations?
For both PCMH outcomes, SBHCs located in schools without adolescents had greater odds of
formal recognition. This finding is like previous research showing that older children are less likely to
receive care from medical homes. As described in the last section, both poverty and one rurality
category were each negatively associated with one of the PCMH outcomes.
93
Implications
The SBHC PCMH Index described in the first article presented in this dissertation is the first
known attempt to measure the presence of PCMH attributes in SBHCs at a national level. While not a
comprehensive measurement of all PCMH elements, the SBHC PCMH Index can be used to measure the
progress of PCMH adoption in SBHCs. The Index identified specific areas where all SBHCs could improve
their service delivery. The lowest scores on the Index were found in the dimensions of Payment and
Patient-Centered. State Medicaid programs and private insurance companies should make additional
efforts to involve SBHCs in their value-based payment programs because financial incentives are
generally needed for small practices to achieve PCMH recognition.140 Additionally, SBHCs should
improve their internal processes to better involve patients in the design of services offered by the SBHC.
This area of improvement could be considered a low-hanging fruit that all SBHCs should be able to
achieve because both school and “other” sponsored SBHCs had higher odds of involving students and
parents/guardians in the design of SBHC services. However, the traditional health care provider
sponsors like FQHCs/CHCs, hospitals, and LHDs may initially overlook this area of the PCMH model and
instead choose to adopt PCMH attributes more directly related to providing a health care service.
Besides exploring the effects of munificence and isomorphic pressures on PCMH adoption, this
dissertation had a secondary research agenda of seeing if patient complexity (i.e. patient groups
associated with lower access to medical homes) was associated with PCMH adoption. SBHCs are
designed to overcome access to care disparities for underserved children. Among SBHCs, differences in
rurality, student age, and family income had minimal effects on PCMH adoption, but lower levels of
PCMH capacity were seen in schools with more minority students. SBHCs are primarily located in
minority majority schools, yet the SBHCs serving more non-Hispanic white students are better medical
homes per the measurements used in this dissertation. More research is needed here to understand the
94
relationship between race and PCMH in a medical setting intended for minority students and how to
best support these SBHCs in adopting PCMH innovations.
Despite limitations such as small practice size and limited funding, SBHCs can achieve formal
PCMH recognition. However, SBHCs that covered higher amounts of their operational expenses through
patient billing revenue, that received HRSA SBHC funding, had larger staff sizes, and participated in
managed care arrangements were the most likely to receive national-level PCMH recognition. These
findings reflect that a high capacity of financial and staff resources (munificence) are needed for
national-level PCMH recognition and that the cost and quality goals of managed care (isomorphic
pressure) are supportive of PCMH implementation. When possible, SBHCs should participate in
managed care and regulations at the state level should be supportive of this arrangement. If national-
level PCMH recognition is superior to local PCMH programs, SBHCs may need additional external
supports and possibly modified application processes in order to achieve national PCMH recognition.
Additionally, SBHCs based in schools that include adolescents were less likely to have both levels of
PCMH recognition and efforts should be made to increase medical home activity in these SBHCs as older
children are the primary recipients of care at SBHCs.
Throughout this dissertation, it was evident that how PCMH was defined affected the
association between organizational characteristics and the outcome variable. When researchers,
policymakers, and PCMH program administrators evaluate PCMH programs, they would be best served
to look at the different levels of medical-homeness. Medical home programs administrators need to
understand that the relationships between PCMH capacity and adoption of specific PCMH attributes
may not be the same. Similarly, evaluations of PCMH programs need to consider the type of PCMH
recognition received as there are external and internal organization characteristics differently associated
with both PCMH recognition types.
95
Limitations
There are several limitations to the previously described research. The National Census of School-
Based Health Centers conducted by the SBHA was chosen as the data source because it is the only
national-level survey specific to SBHCs; however, there are some disadvantages to using this data
source. The SBHA administers the survey to every known SBHC and has a high response rate, but does
not report information about non-respondents or use non-response weighting. Some variables of
interest, such as if the SBHC is designated as a managed care preferred provider and receives
supplemental performance payments, included many missing values. After evaluation of the missing
data patterns, data was assumed to be missing completely at random and complete case analysis was
used in all analyses (Table 22). Across the SBHC subpopulation samples used in different analyses
throughout this dissertation, there did not appear to be missing data problems that would limit the
generalizability of these findings to all SBHCs. However, both item non-response and unit non-response
could have been a source of bias.
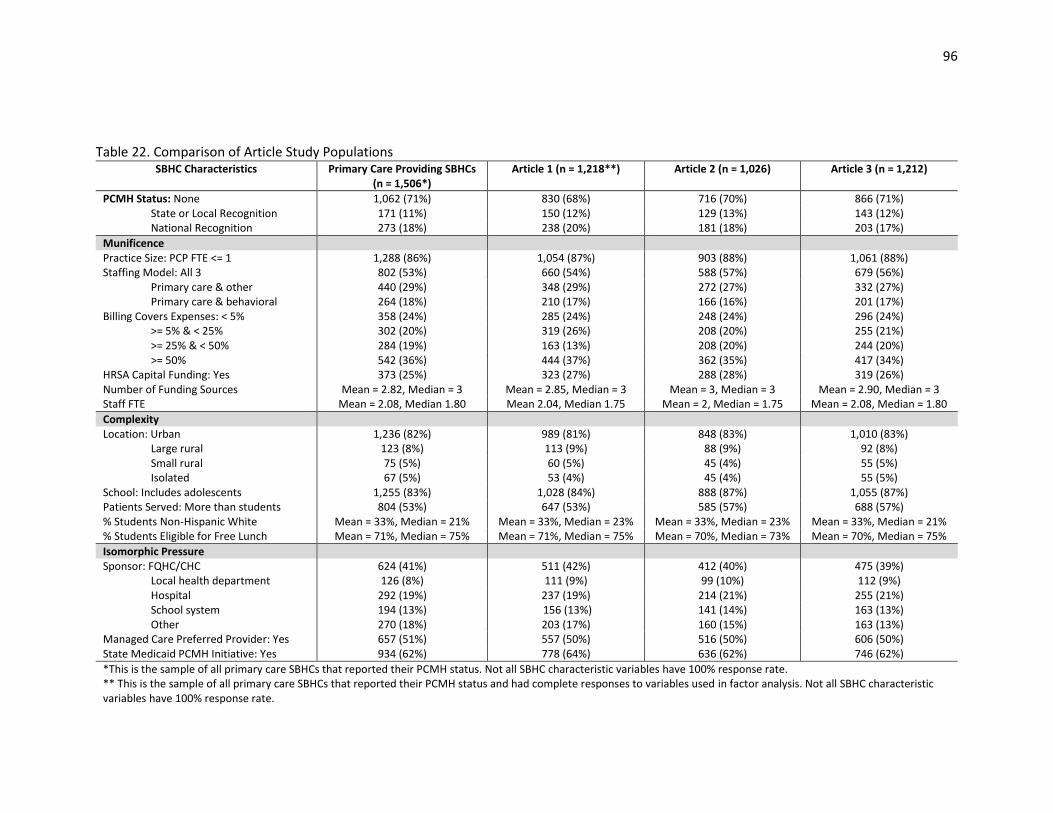
96
Table 22. Comparison of Article Study Populations SBHC Characteristics Primary Care Providing SBHCs
(n = 1,506*) Article 1 (n = 1,218**) Article 2 (n = 1,026) Article 3 (n = 1,212)
PCMH Status: None 1,062 (71%) 830 (68%) 716 (70%) 866 (71%) State or Local Recognition 171 (11%) 150 (12%) 129 (13%) 143 (12%) National Recognition 273 (18%) 238 (20%) 181 (18%) 203 (17%)
Munificence Practice Size: PCP FTE <= 1 1,288 (86%) 1,054 (87%) 903 (88%) 1,061 (88%) Staffing Model: All 3 802 (53%) 660 (54%) 588 (57%) 679 (56%)
Primary care & other 440 (29%) 348 (29%) 272 (27%) 332 (27%) Primary care & behavioral 264 (18%) 210 (17%) 166 (16%) 201 (17%)
Billing Covers Expenses: < 5% 358 (24%) 285 (24%) 248 (24%) 296 (24%) >= 5% & < 25% 302 (20%) 319 (26%) 208 (20%) 255 (21%) >= 25% & < 50% 284 (19%) 163 (13%) 208 (20%) 244 (20%) >= 50% 542 (36%) 444 (37%) 362 (35%) 417 (34%)
HRSA Capital Funding: Yes 373 (25%) 323 (27%) 288 (28%) 319 (26%) Number of Funding Sources Mean = 2.82, Median = 3 Mean = 2.85, Median = 3 Mean = 3, Median = 3 Mean = 2.90, Median = 3 Staff FTE Mean = 2.08, Median 1.80 Mean 2.04, Median 1.75 Mean = 2, Median = 1.75 Mean = 2.08, Median = 1.80
Complexity Location: Urban 1,236 (82%) 989 (81%) 848 (83%) 1,010 (83%)
Large rural 123 (8%) 113 (9%) 88 (9%) 92 (8%) Small rural 75 (5%) 60 (5%) 45 (4%) 55 (5%) Isolated 67 (5%) 53 (4%) 45 (4%) 55 (5%)
School: Includes adolescents 1,255 (83%) 1,028 (84%) 888 (87%) 1,055 (87%) Patients Served: More than students 804 (53%) 647 (53%) 585 (57%) 688 (57%) % Students Non-Hispanic White Mean = 33%, Median = 21% Mean = 33%, Median = 23% Mean = 33%, Median = 23% Mean = 33%, Median = 21% % Students Eligible for Free Lunch Mean = 71%, Median = 75% Mean = 71%, Median = 75% Mean = 70%, Median = 73% Mean = 70%, Median = 75%
Isomorphic Pressure Sponsor: FQHC/CHC 624 (41%) 511 (42%) 412 (40%) 475 (39%)
Local health department 126 (8%) 111 (9%) 99 (10%) 112 (9%) Hospital 292 (19%) 237 (19%) 214 (21%) 255 (21%) School system 194 (13%) 156 (13%) 141 (14%) 163 (13%) Other 270 (18%) 203 (17%) 160 (15%) 163 (13%)
Managed Care Preferred Provider: Yes 657 (51%) 557 (50%) 516 (50%) 606 (50%) State Medicaid PCMH Initiative: Yes 934 (62%) 778 (64%) 636 (62%) 746 (62%)
*This is the sample of all primary care SBHCs that reported their PCMH status. Not all SBHC characteristic variables have 100% response rate. ** This is the sample of all primary care SBHCs that reported their PCMH status and had complete responses to variables used in factor analysis. Not all SBHC characteristic variables have 100% response rate.
97
While the SBHA Census has been conducted since 1998, the questions asked have changed
over time and only a limited number of variables key to this research were asked in comparable
manners between multiple years of data. By using a cross-sectional design and only one year of
survey data, I am unable to make causal conclusions and am limited to only identifying
significant associations. Longitudinal study designs are useful for studying the adoption of PCMH
attributes and changes in PCMH capacity over time, and use of future years of SBHA Census data
may be insightful for studying the growth of the PCMH model in SBHCs.199
Analyses using resource dependency theory and institutional theory traditionally include
measures of the external environment at the metropolitan statistical area or county-level to
explain organizational behavior. The National Census of School-Based Health Centers dataset
does include each SBHC’s address and I had planned to use a geographic information systems
(GIS) mapping software to identify the county and census tract where the SBHC was located.
Then additional environmental variables frequently applied in research guided by resource
dependency theory, such as health care provider supply or community measures of poverty,
could have been included in my analysis. However, several hundred SBHCs returned addresses
that could not be mapped due to invalid and incomplete addresses submitted by the survey
respondent. Most of these invalid GIS addresses self-identified as being “rural” and inspection of
their addresses revealed that many SBHCs provided a P.O. box address instead of a physical
address. Exclusion of these SBHCs would have reduced the overall sample size and especially
decreased the number of rural SBHCs included in the analysis.
Without GIS information, variables representing the SBHCs’ external environment could not
be included. By design SBHCs are in medically underserved areas with high poverty rates so their
external environment should be similar, so there may not be enough variation in their external
environment to explain PCMH adoption. Influence of rurality on PCMH adoption was
98
considered an important element of this study so accuracy of the rurality information was
critical. Because it was unknown what criteria SBHCs used to self-identify their rurality, this
Census variable was not used. Instead, zip code RUCA approximations developed by the
WWAMI Rural Health Research Center were used to identify the rurality of the SBHC using their
zip code from the Census data. The zip code approximation method does not use commuting
data to classify location and is based only on the Census tract codes; however, there is a 92.9%
match between zip code approximation RUCAs and census tract RUCAs.162
There are also limitations to my research because of how I defined PCMH capacity and
PCMH recognition. The SBHC PCMH Index presented in Chapter 2, Article 1: “Identifying Medical
Home Attributes in School-Based Health Centers” was developed by mapping SBHC Census
questions to both the NCQA and Joint Principles definitions of a medical home. Although this
Index demonstrated reliability and evidence of construct validity, it is not a comprehensive
measure of all PCMH components. The Index only measures presence of a structure or process
related to the PCMH model, not actual proficiency in use of the PCMH attribute. The two
separately modelled outcomes of “any PCMH recognition” and “national PCMH recognition”
were used in Chapter 4, Article 3: “Correlates of Patient-Centered Medical Home Recognition in
School-Based Health Centers” because receipt of state-level and national-level PCMH
recognition are not mutually exclusive. In fact, national PCMH standards from NCQA are
frequently required for state-level PCMH programs. Therefore, SBHCs with national PCMH
recognition may also have state-level recognition. However, all SBHCs only provided one
response to the question of “Has your health center been recognized as a patient-centered
medical home by any of the following (select all that apply)?”. The uncertainty about the
distinctions between the PCMH recognition levels achieved by SBHCs prevented use of a
99
multinomial logistic model that could have provided clearer answers on how SBHC
characteristics influence receipt of state-level recognition compared to national-level.
Finally, the sparsely populated and uneven clusters in my data prevented me from using
multi-level modeling to account for the two levels of correlation present in my data: (1)
sponsoring organization clusters, and (2) state-level clusters. I clustered my standards errors at
the state-level because it was the highest level of aggregation, but this does result in loss of
information and possible ecological fallacy.
Future Research
This dissertation provided insight into the medical home adoption processes at SBHCs
and identified possible facilitators of individual PCMH components, higher PCMH capacity, and
formal PCMH recognition. However, this research has led me to ask more questions about how
to improve medical home adoption in SBHCs. Time is an important component of innovation
adoption, and analysis of future years of SBHC Census data will be insightful to see if the
presence of state Medicaid PCMH will increase PCMH capacity. Also, SBHCs with HRSA SBHC
Capital funding had higher odds of having EHRs, possibly because they used grant funding to
purchase HIT, but were less likely to have received Meaningful Use attestation. It would be
interesting to see how long it takes new HIT purchasers to catch up with other SBHCs in use of
advanced HIT capabilities. Policymakers and practitioners need to be aware of the time it takes
to transform a practice so that PCMH efforts are not abandoned too soon due to lack of positive
results or delays in the transformation process.85 Additionally, the intent of the HRSA SBHC
Capital Funding was not to increase PCMH adoption, but to provide funding for expansion/
improvement of existing SBHCs’ physical location or for the purchase of some types of medical
equipment or HIT. The HRSA SBHC Capital Funding was the first and only federal funding
dedicated to SBHCs and it expired in 2013. Multi-year analysis of the impact of HRSA Capital
100
Funding could be used to demonstrate if this federal funding had significant and positive
unintended effects on grant recipients’ practice transformation towards the PCMH model. This
information is necessary for SBHC advocates and could provide factual support for ongoing
federal support of SBHC programs.
Innovation adoption decisions happen at both the organization and individual within an
organization level.200 The medical home literature has demonstrated that individuals within
clinics are important to initiating and sustaining practice transformation.88,189 An individual’s
understanding of the PCMH transformation process, motivations for undergoing change, and
belief in their capability to successfully manage adopting new processes are important elements
of the PCMH adoption process.184 There are several qualitative analytic approaches that could
be used in future research to better understand PCMH adoption in SBHCs. Positive deviant
analysis with SBHCs that have been successful with PCMH implementation could provide
information on the organization leadership and SBHC staff relationships that are supportive of
practice transformation. To undertake a significant practice transformation, SBHCs would need
to be knowledgeable about the PCMH process and feel confident about their ability to succeed.
Social network analysis could also provide insight on the information and resource sharing
between SBHCs and their external partners that leads to adoption of the PCMH model.
In the PCMH literature, the significance of the quality and cost improvements caused by
PCMH implementation is still under debate. This uncertainty about exact PCMH quality and cost
benefits is in part caused by the difficulties of controlling for different practice settings and the
multiple definitions of a PCMH. Studying PCMH adoption in SBHCs addresses the issue of
different practice settings and my dissertation demonstrated that it is possible to look at PCMH
adoption from multiple perspectives using national-level SBHC data. Recently, the School-Based
Health Alliance launched the School Health Services National Quality Initiative to collect the first
101
standardized performance measures from SBHCS in order to describe the quality of care given at
SBHCs on a national level.201 This quality data, in combination with information from the SBHC
Census survey, could be used to evaluate health care quality: (1) at different levels of PCMH
capacity, (2) with specific PCMH components, (3) between non-PCMH recognized and PCMH
SBHCs, and (4) between nationally recognized PCMHs and state/insurance provider PCMHs. As
baseline quality may influence a SBHC’s decision to pursue the medical home model, a
propensity score approach could be used to adjust for initial quality differences during
estimation of the effect of PCMH transformation on clinical quality outcomes.
102
Bibliography
1. Agency for Healthcare Research and Quality. Defining the PCMH.
https://pcmh.ahrq.gov/page/defining-pcmh. Accessed August 18, 2016.
2. American Academy of Pediatrics. What is medical home?
https://medicalhomeinfo.aap.org/overview/Pages/Whatisthemedicalhome.aspx. Updated 2016.
Accessed August 18, 2016.
3. Sia C, Tonniges TF, Osterhus E, Taba S. History of the medical home concept. Pediatrics.
2004;113(5 Suppl):1473-1478.
4. American Academy of Pediatrics. Ad hoc task force on definition of the medical home: The
medical home. Pediatrics. 1992;90(5):774.
5. Medical Home Initiatives for Children With Special Needs Project Advisory Committee.
American Academy of Pediatrics. The medical home. Pediatrics. 2002;110(1 Pt 1):184-186.
6. Institute of Medicine (US) Committee on Quality of Health Care in America. Crossing the
quality chasm: A new health system for the 21st century. Washington, DC: National Academies
Press; 2001.
7. American Academy of Family Physicians, American Academy of Pediatrics, American College
of Physicians, American Osteopathic Association. Joint principles of the patient-centered
medical home. 2007.
8. Centers for Medicare and Medicaid Services. Health home information resource center.
https://www.medicaid.gov/state-resource-center/medicaid-state-technical-assistance/health-
103
homes-technical-assistance/health-home-information-resource-center.html. Updated 2016.
Accessed March 28, 2017.
9. Centers for Medicare and Medicaid Services. Federally qualified health center demonstration.
https://innovation.cms.gov/initiatives/FQHCs/. Updated 2017. Accessed March 22, 2017.
10. Stange KC, Nutting PA, Miller WL, et al. Defining and measuring the patient-centered medical
home. Journal of General Internal Medicine. 2010;25(6):601-612.
11. National Committee for Quality Assurance (NCQA). 2014 PCMH standards and guidelines.
2014.
12. National Committee for Quality Assurance (NCQA). Patient-centered medical home (PCMH)
recognition.
http://www.ncqa.org/Programs/Recognition/Practices/PatientCenteredMedicalHomePCMH.asp
x. Updated 2017. Accessed March 26, 2017.
13. Ryan J, Doty M, Hamel L, Norton M, Abrams M, Brodie A. Primary care providers’ views of
recent trends in health care delivery and payment. Washington, DC: The Commonwealth Fund
and The Kaiser Family Foundation. 2015.
14. Long WE, Bauchner H, Sege RD, Cabral HJ, Garg A. The value of the medical home for
children without special health care needs. Pediatrics. 2012;129(1):87-98.
15. Romaire MA, Bell JF. The medical home, preventive care screenings, and counseling for
children: Evidence from the medical expenditure panel survey. Academic Pediatrics.
2010;10(5):338-345.
104
16. Green LA, Chang H, Markovitz AR, Paustian ML. The reduction in ED and hospital admissions
in medical home practices is specific to primary care–sensitive chronic conditions. Health Serv
Res. 2017.
17. Toomey SL, Elliott MN, Schwebel DC, et al. Relationship between adolescent report of
patient-centered care and of quality of primary care. Academic pediatrics. 2016;16(8):770-776.
18. Raphael JL, Cooley WC, Vega A, et al. Outcomes for children with chronic conditions
associated with parent- and provider-reported measures of the medical home. J Health Care
Poor Underserved. 2015;26(2):358-376.
19. Han B, Yu H, Friedberg MW. Evaluating the impact of parent‐reported medical home status
on children's health care utilization, expenditures, and quality: A difference‐in‐differences
analysis with causal inference methods. Health Serv Res. 2017;52(2):786-806.
20. Harder VS, Krulewitz J, Jones C, Wasserman RC, Shaw JS. Effects of patient-centered medical
home transformation on child patient experience. J Am Board Fam Med. 2016;29(1):60-68.
21. Willits KA, Platonova EA, Nies MA, Racine EF, Troutman ML, Harris HL. Medical home and
pediatric primary care utilization among children with special health care needs. Journal of
Pediatric Health Care. 2013;27(3):202-208.
22. Aysola J, Bitton A, Zaslavsky AM, Ayanian JZ. Quality and equity of primary care with patient-
centered medical homes: Results from a national survey. Med Care. 2013;51(1):68-77.
105
23. Stevens GD, Vane C, Cousineau MR. Association of experiences of medical home quality with
health‐related quality of life and school engagement among latino children in low‐income
families. Health Serv Res. 2011;46(6pt1):1822-1842.
24. Garcia-Huidobro D, Shippee N, Joseph-DiCaprio J, O'Brien JM, Svetaz MV. Effect of patient-
centered medical home on preventive services for adolescents and young adults. Pediatrics.
2016;137(6):10.1542/peds.2015-3813.
25. Ramos MM, Sebastian RA, Stumbo SP, McGrath J, Fairbrother G. Measuring unmet needs for
anticipatory guidance among adolescents at school-based health centers. Journal of Adolescent
Health. 2017.
26. Paustian ML, Alexander JA, El Reda DK, Wise CG, Green LA, Fetters MD. Partial and
incremental PCMH practice transformation: Implications for quality and costs. Health Serv Res.
2014;49(1):52-74.
27. Lebrun-Harris LA, Shi L, Zhu J, Burke MT, Sripipatana A, Ngo-Metzger Q. Effects of patient-
centered medical home attributes on patients' perceptions of quality in federally supported
health centers. Ann Fam Med. 2013;11(6):508-516.
28. Burnet D, Gunter KE, Nocon RS, et al. Medical home characteristics and the pediatric patient
experience. Med Care. 2014;52(11 Suppl 4):S56-63.
29. Trapp D. Medical homes for Medicaid: The North Carolina model. American Medical News,
Aug. 2010;2.
106
30. Fifield J, Forrest DD, Burleson JA, Martin-Peele M, Gillespie W. Quality and efficiency in small
practices transitioning to patient centered medical homes: A randomized trial. Journal of
General Internal Medicine. 2013;28(6):778-786.
31. Romaire MA, Bell JF, Grossman DC. Health care use and expenditures associated with access
to the medical home for children and youth. Med Care. 2012;50(3):262-269.
32. Long WE, Cabral HJ, Garg A. Are components of the medical home differentially associated
with child health care utilization, health, and health promoting behavior outcomes? Clin Pediatr
(Phila). 2013;52(5):423-432.
33. O'Malley AS. After-hours access to primary care practices linked with lower emergency
department use and less unmet medical need. Health Aff (Millwood). 2013;32(1):175-183.
34. Christensen AL, Zickafoose JS, Natzke B, McMorrow S, Ireys HT. Associations between
practice-reported medical homeness and health care utilization among publicly insured children.
Academic Pediatrics. 2015;15(3):267-274.
35. Grumbach K, Grundy P. Outcomes of implementing patient centered medical home
interventions. Washington, DC: Patient-Centered Primary Care Collaborative. 2010.
36. Liptak GS, Burns CM, Davidson PW, McAnarney ER. Effects of providing comprehensive
ambulatory services to children with chronic conditions. Arch Pediatr Adolesc Med.
1998;152(10):1003-1008.
37. Porterfield SL, DeRigne L. Medical home and out-of-pocket medical costs for children with
special health care needs. Pediatrics. 2011;128(5):892-900.
107
38. Jerant A, Bertakis KD, Fenton JJ, Franks P. Extended office hours and health care
expenditures: A national study. Ann Fam Med. 2012;10(5):388-395.
39. Cuellar A, Helmchen LA, Gimm G, et al. The CareFirst patient-centered medical home
program: Cost and utilization effects in its first three years. Journal of General Internal Medicine.
2016;31(11):1382-1388.
40. Vessey JA, McGowan KA. A successful public health experiment: School nursing. Pediatr
Nurs. 2006;32(3):255-257.
41. Preston SH, Haines MR. Fatal years: Child mortality in late nineteenth-century America.
Princeton University Press; 2014.
42. Wold SJ, Dagg NV. School nursing: A framework for practice. J Sch Health. 1978;48(2):111-
114.
43. Silver HK, Igoe JB, McAtee PR. The school nurse practitioner: Providing improved health care
to children. Pediatrics. 1976;58(4):580-584.
44. Gustafson EM. History and overview of school-based health centers in the US. Nurs Clin
North Am. 2005;40(4):595-606.
45. Schlitt JJ, Rickett KD, Montgomery LL, Lear JG. State initiatives to support school-based
health centers: A national survey. Journal of Adolescent Health. 1995;17(2):68-76.
46. Isaacs SL, Knickman JR. To improve health and health care 2000: The Robert Wood Johnson
Foundation anthology. 1999.
108
47. Lofink Love H, Schelar E, Taylor K, et al. 2013-14 census of school-based health centers:
Methodology, key report data details, and acknowledgements. 2015.
48. Clayton S, Chin T, Blackburn S, Echeverria C. Different setting, different care: Integrating
prevention and clinical care in school-based health centers. Am J Public Health.
2010;100(9):1592-1596.
49. Starfield B. U.S. child health: What's amiss, and what should be done about it? Health Aff
(Millwood). 2004;23(5):165-170.
50. Eisenberg JM, Power EJ. Transforming insurance coverage into quality health care: Voltage
drops from potential to delivered quality. JAMA. 2000;284(16):2100-2107.
51. Chung PJ, Schuster MA. Access and quality in child health services: Voltage drops. Health Aff
(Millwood). 2004;23(5):77-87.
52. DeNavas-Walt C, Proctor BD. Income and poverty in the United States: 2013. US Census
Bureau. Retrieved December 2013;15:2014.
53. Williams DR, Priest N, Anderson NB. Understanding associations among race, socioeconomic
status, and health: Patterns and prospects. Health Psychology. 2016;35(4):407.
54. Abdus S, Selden TM. Adherence with recommended well-child visits has grown, but large
gaps persist among various socioeconomic groups. Health Aff (Millwood). 2013;32(3):508-515.
55. Miller JE. The effects of race/ethnicity and income on early childhood asthma prevalence
and health care use. Am J Public Health. 2000;90(3):428-430.
109
56. Singh GK, Kogan MD, Van Dyck PC, Siahpush M. Racial/ethnic, socioeconomic, and
behavioral determinants of childhood and adolescent obesity in the United States: Analyzing
independent and joint associations. Ann Epidemiol. 2008;18(9):682-695.
57. Flores G, Tomany-Korman SC. Racial and ethnic disparities in medical and dental health,
access to care, and use of services in US children. Pediatrics. 2008;121(2):e286-98.
58. Allison MA, Crane LA, Beaty BL, Davidson AJ, Melinkovich P, Kempe A. School-based health
centers: Improving access and quality of care for low-income adolescents. Pediatrics.
2007;120(4):e887-94.
59. Adams EK, Johnson V. An elementary school-based health clinic: Can it reduce Medicaid
costs? Pediatrics. 2000;105(4):780-788.
60. Federico SG, Abrams L, Everhart RM, Melinkovich P, Hambidge SJ. Addressing adolescent
immunization disparities: A retrospective analysis of school-based health center immunization
delivery. Am J Public Health. 2010;100(9):1630-1634.
61. Guo J, Jang R, Keller K, McCracken A, Pan W, Cluxton R. Impact of school-based health
centers on children with asthma. Journal of Adolescent Health. 2005;37(4):266-274.
62. Magzamen S, Patel B, Davis A, Edelstein J, Tager IB. Kickin’Asthma: School‐Based asthma
education in an urban community. J Sch Health. 2008;78(12):655-665.
63. Healthcare Cost and Utilization Project. HCUP facts and figures: Statistics on hospital-based
care in the United States. 2009.
110
64. Gance-Cleveland B, Yousey Y. Benefits of a school-based health center in a preschool. Clin
Nurs Res. 2005;14(4):327-342. doi: 14/4/327 [pii].
65. Guo JJ, Wade TJ, Keller KN. Impact of school-based health centers on students with mental
health problems. Public Health Rep. 2008:768-780.
66. Gibson EJ, Santelli JS, Minguez M, Lord A, Schuyler AC. Measuring school health center
impact on access to and quality of primary care. Journal of Adolescent Health. 2013;53(6):699-
705.
67. Klein JD, Handwerker L, Sesselberg TS, Sutter E, Flanagan E, Gawronski B. Measuring quality
of adolescent preventive services of health plan enrollees and school-based health center users.
Journal of Adolescent Health. 2007;41(2):153-160.
68. McNall MA, Lichty LF, Mavis B. The impact of school-based health centers on the health
outcomes of middle school and high school students. Am J Public Health. 2010;100(9):1604-
1610.
69. Kaplan DW, Brindis CD, Phibbs SL, Melinkovich P, Naylor K, Ahlstrand K. A comparison study
of an elementary school–based health center: Effects on health care access and use. Arch
Pediatr Adolesc Med. 1999;153(3):235-243.
70. Ran T, Chattopadhyay SK, Hahn RA, Community Preventive Services Task Force. Economic
evaluation of school-based health centers: A community guide systematic review. Am J Prev
Med. 2016;51(1):129-138.
111
71. Robert Wood Johnson Foundation. The relationship between school attendance and health.
http://www.rwjf.org/content/dam/farm/reports/issue_briefs/2016/rwjf431726. September
2016. Accessed March 2017.
72. Van Cura M. The relationship between School‐Based health centers, rates of early dismissal
from school, and loss of seat time. J Sch Health. 2010;80(8):371-377.
73. Strolin-Goltzman J, Sisselman A, Melekis K, Auerbach C. Understanding the relationship
between school-based health center use, school connection, and academic performance. Health
Soc Work. 2014;39(2):83-91.
74. Bersamin M, Garbers S, Gaarde J, Santelli J. Assessing the impact of school-based health
centers on academic achievement and college preparation efforts: Using propensity score
matching to assess school-level data in California. The Journal of School Nursing. 2016;32(4):241-
245.
75. Community Preventive Services Task Force. Promoting health equity through education
programs and policies: School-based health centers.
http://www.thecommunityguide.org/healthequity/education/RRschoolbasedhealthcenters.html
. Updated March 2015. Accessed March 31, 2016, 2016.
76. Irwin A, Valentine N, Brown C, et al. The commission on social determinants of health:
Tackling the social roots of health inequities. PLoS Med. 2006;3(6):e106.
77. Bersamin M, Garbers S, Gold MA, et al. Measuring success: Evaluation designs and
approaches to assessing the impact of school-based health centers. Journal of Adolescent
Health. 2016;58(1):3-10.
112
78. American Academy of Pediatrics. Why is medical home important?
https://medicalhomeinfo.aap.org/overview/Pages/Evidence.aspx. Accessed March 31, 2016.
79. Council on School Health. School-based health centers and pediatric practice. Pediatrics.
2012;129(2):387-393. doi: 10.1542/peds.2011-3443 [doi].
80. School-Based Health Alliance. 2013-14 census of school-based health centers: Methodology,
key report data details, and acknowledgements. 2015.
81. Health Resources and Services Administration. School-based health centers.
http://www.hrsa.gov/ourstories/schoolhealthcenters/. Accessed February 4, 2016.
82. Keeton V, Soleimanpour S, Brindis CD. School-based health centers in an era of health care
reform: Building on history. Current Problems in Pediatric and Adolescent Health Care.
2012;42(6):132-156.
83. O'Leary ST, Lee M, Federico S, et al. School-based health centers as patient-centered medical
homes. Pediatrics. 2014;134(5):957-964.
84. North SW, McElligot J, Douglas G, Martin A. Improving access to care through the patient-
centered medical home. Pediatr Ann. 2014;43(2):e33-e38.
85. Hearld LR, Hearld KR, Hogan TH. Community-level sociodemographic characteristics and
patient-centered medical home capacity. Population Health Management in Health Care
Organizations. Emerald Group Publishing Limited; 2014:23-50.
86. Goldberg DG, Mick SS. Medical home infrastructure: Effect of the environment and practice
characteristics on adoption in Virginia. Med Care Res Rev. 2010;67(4):431-449.
113
87. Rittenhouse DR, Casalino LP, Shortell SM, et al. Small and medium-size physician practices
use few patient-centered medical home processes. Health Aff (Millwood). 2011;30(8):1575-
1584. doi: 10.1377/hlthaff.2010.1210 [doi].
88. Nutting PA, Crabtree BF, Miller WL, Stewart EE, Stange KC, Jaen CR. Journey to the patient-
centered medical home: A qualitative analysis of the experiences of practices in the national
demonstration project. Ann Fam Med. 2010;8 Suppl 1:S45-56; S92.
89. Gimm G, Want J, Hough D, Polk T, Rodan M, Nichols LM. Medical home implementation in
small primary care practices: Provider perspectives. J Am Board Fam Med. 2016;29(6):767-774.
90. Gance-Cleveland B, Costin DK, Degenstein JA. School‐Based health centers: Statewide quality
improvement program. J Nurs Care Qual. 2003;18(4):288-294.
91. Takach M. Reinventing Medicaid: State innovations to qualify and pay for patient-centered
medical homes show promising results. Health Aff (Millwood). 2011;30(7):1325-1334.
92. Centers for Medicare and Medicaid Services. An introduction to the Medicaid EHR incentive
program for eligible professionals. 2012. Accessed March 2017.
93. National Committee for Quality Assurance (NCQA). PCMH 2014 standards and guidelines.
July 25, 2016. Accessed March 2017.
94. Aysola J, Orav EJ, Ayanian JZ. Neighborhood characteristics associated with access to patient-
centered medical homes for children. Health Aff (Millwood). 2011;30(11):2080-2089.
114
95. Zickafoose JS, Davis MM. Medical home disparities are not created equal: Differences in the
medical home for children from different vulnerable groups. J Health Care Poor Underserved.
2013;24(3):1331-1343.
96. Zickafoose JS, Gebremariam A, Davis MM. Medical home disparities for children by
insurance type and state of residence. Matern Child Health J. 2012;16(1):178-187.
97. Adams SH, Newacheck PW, Park MJ, Brindis CD, Irwin CE. Medical home for adolescents:
Low attainment rates for those with mental health problems and other vulnerable groups.
Academic Pediatrics. 2013;13(2):113-121.
98. Raphael JL, Guadagnolo BA, Beal AC, Giardino AP. Racial and ethnic disparities in indicators
of a primary care medical home for children. Academic Pediatrics. 2009;9(4):221-227.
99. Gao Y, Nocon RS, Gunter KE, et al. Characteristics associated with patient-centered medical
home capability in health centers: A cross-sectional analysis. Journal of General Internal
Medicine. 2016;31(9):1041-1051.
100. Hoilette LK, Blumkin AK, Baldwin CD, Fiscella K, Szilagyi PG. Community health centers:
Medical homes for children? Academic Pediatrics. 2013;13(5):436-442.
101. Hu X, Phillips VL, Gaydos LM, Joski P. Association of healthy home environments and use of
patient-centered medical homes by children of low-income families. Journal of Pediatric Health
Care. 2017;31(2):203-214.
102. Bleser WK, Young SI, Miranda PY. Disparities in patient-and family-centered care during US
children's health care encounters: A closer examination. Academic Pediatrics. 2017;17(1):17-26.
115
103. Henke RM, Johann J, Senathirajah M, et al. Implementation of the patient-centered medical
home model in facilities providing comprehensive care to medically underserved populations. J
Health Care Poor Underserved. 2016;27(4):1638-1646.
104. Arend J, Tsang‐Quinn J, Levine C, Thomas D. The Patient‐Centered medical home: History,
components, and review of the evidence. Mount Sinai Journal of Medicine: A Journal of
Translational and Personalized Medicine. 2012;79(4):433-450.
105. Rogers EM. Diffusion of innovations. 5th ed. New York: Free Press; 2003.
106. Pfeffer J, Salancik GR. The external control of organizations: A resource dependence
perspective. Stanford University Press; 2003.
107. DiMaggio P, Powell WW. The iron cage revisited: Collective rationality and institutional
isomorphism in organizational fields. Am Sociol Rev. 1983;48(2):147-160.
108. Kazley AS, Ozcan YA. Organizational and environmental determinants of hospital EMR
adoption: A national study. J Med Syst. 2007;31(5):375-384.
109. Banaszak-Holl J, Zinn JS, Mor V. The impact of market and organizational characteristics on
nursing care facility service innovation: A resource dependency perspective. Health Serv Res.
1996;31(1):97-117.
110. Zinn JS, Weech RJ, Brannon D. Resource dependence and institutional elements in nursing
home TQM adoption. Health Serv Res. 1998;33(2 Pt 1):261-273.
116
111. Weech-Maldonado R, Elliott MN, Pradhan R, Schiller C, Dreachslin J, Hays RD. Moving
towards culturally competent health systems: Organizational and market factors. Soc Sci Med.
2012;75(5):815-822.
112. Macfarlane F, Barton-Sweeney C, Woodard F, Greenhalgh T. Achieving and sustaining
profound institutional change in healthcare: Case study using neo-institutional theory. Soc Sci
Med. 2013;80:10-18.
113. Schiaffino MK, Al-Amin M, Schumacher JR. Predictors of language service availability in US
hospitals. 2014.
114. Yeager VA, Zhang Y, Diana ML. Analyzing determinants of hospitals' accountable care
organizations participation: A resource dependency theory perspective. Med Care Res Rev.
2015;72(6):687-706. doi: 10.1177/1077558715592295 [doi].
115. Yeager VA, Menachemi N, Savage GT, Ginter PM, Sen BP, Beitsch LM. Using resource
dependency theory to measure the environment in health care organizational studies: A
systematic review of the literature. Health Care Manage Rev. 2014;39(1):50-65. doi:
10.1097/HMR.0b013e3182826624 [doi].
116. Flood AB, Fennell ML. Through the lenses of organizational sociology: The role of
organizational theory and research in conceptualizing and examining our health care system. J
Health Soc Behav. 1995:154-169.
117. Rye CB, Kimberly JR. The adoption of innovations by provider organizations in health care.
Medical Care Research and Review. 2007;64(3):235-278.
117
118. Froelich KA. Diversification of revenue strategies: Evolving resource dependence in
nonprofit organizations. Nonprofit Voluntary Sector Q. 1999;28(3):246-268.
119. Nohria N, Gulati R. Is slack good or bad for innovation? Academy of Management Journal.
1996;39(5):1245-1264.
120. Westfall JM, Zittleman L, Ringel M, et al. How do rural patients benefit from the patient-
centred medical home? A card study in the high plains research network. London Journal of
Primary Care. 2014;6(6):136-148.
121. MacKinney AC, Mueller KJ, McBride TD. The march to accountable care organizations—how
will rural fare? The Journal of Rural Health. 2011;27(1):131-137.
122. Janamian T, Jackson CL, Glasson N, Nicholson C. A systematic review of the challenges to
implementation of the patient-centered medical home: Lessons for Australia. Med J Aust.
2014;201(3):S69-S73.
123. Strickland BB, Jones JR, Ghandour RM, Kogan MD, Newacheck PW. The medical home:
Health care access and impact for children and youth in the United States. Pediatrics.
2011;127(4):604-611.
124. Homer CJ, Klatka K, Romm D, et al. A review of the evidence for the medical home for
children with special health care needs. Pediatrics. 2008;122(4):e922-37.
125. Hamilton LJ, Lerner CF, Presson AP, Klitzner TS. Effects of a medical home program for
children with special health care needs on parental perceptions of care in an ethnically diverse
patient population. Matern Child Health J. 2013;17(3):463-469.
118
126. Zickafoose JS, Clark SJ, Sakshaug JW, Chen LM, Hollingsworth JM. Readiness of primary care
practices for medical home certification. Pediatrics. 2013;131(3):473-482.
127. Bitton A, Martin C, Landon BE. A nationwide survey of patient centered medical home
demonstration projects. Journal of General Internal Medicine. 2010;25(6):584-592.
128. American Academy of Pediatrics. AAP agenda for children: Medical home.
https://www.aap.org/en-us/about-the-aap/aap-facts/AAP-Agenda-for-Children-Strategic-
Plan/Pages/AAP-Agenda-for-Children-Strategic-Plan-Medical-Home.aspx. Accessed March 1,
2017.
129. Beal A, Doty M, Hernandez S, Shea K, Davis K. Closing the divide: How medical homes
promote equitable care: Results from the commonwealth fund 2006 health quality survey:
Commonwealth Fund. 2007.
130. Cronbach LJ. Coefficient alpha and the internal structure of tests. Psychometrika.
1951;16(3):297-334.
131. Nunnally J. Psychometric theory (2nd edit.) McGraw-hill. Hillsdale, NJ. 1978.
132. Schmitt N. Uses and abuses of coefficient alpha. Psychol Assess. 1996;8(4):350.
133. Furr RM. Evaluating psychometric properties: Dimensionality and reliability. In: Scale
construction and psychometrics for social and personality psychology. London: SAGE
Publications Ltd; 2011:25-51. 10.4135/9781446287866.n4.
134. National Committee for Quality Assurance (NCQA). Getting on board part 1 before: Learn it.
2016.
119
135. Berenson RA, Hammons T, Gans DN, et al. A house is not a home: Keeping patients at the
center of practice redesign. Health Aff (Millwood). 2008;27(5):1219-1230.
136. Cantiello J, Kitsantas P, Moncada S, Abdul S. The evolution of quality improvement in
healthcare: Patient-centered care and health information technology applications. Journal of
Hospital Administration. 2016;5(2):p62.
137. Kern LM, Edwards A, Kaushal R. The patient-centered medical home, electronic health
records, and quality of care. Ann Intern Med. 2014;160(11):741-749.
138. Tirodkar MA, Morton S, Whiting T, et al. There's more than one way to build a medical
home. Am J Manag Care. 2014;20(12):e582-9.
139. Shi L, Lock DC, Lee DC, et al. Patient-centered medical home capability and clinical
performance in HRSA-supported health centers. Med Care. 2015;53(5):389-395.
140. Scholle SH, Asche SE, Morton S, Solberg LI, Tirodkar MA, Jaen CR. Support and strategies for
change among small patient-centered medical home practices. Ann Fam Med. 2013;11 Suppl
1:S6-13.
141. Birnberg JM, Drum ML, Huang ES, et al. Development of a safety net medical home scale
for clinics. Journal of General Internal Medicine. 2011;26(12):1418-1425.
142. Perrin EC, Lewkowicz C, Young MH. Shared vision: Concordance among fathers, mothers,
and pediatricians about unmet needs of children with chronic health conditions. Pediatrics.
2000;105(Supplement 2):277-285.
120
143. Council on Children With Disabilities - American Academy of Pediatrics. Care coordination
in the medical home: Integrating health and related systems of care for children with special
health care needs. Pediatrics. 2005;116(5):1238-1239-1244.
144. Miller D, Noonan K, Fiks AG, Lehmann CU. Increasing pediatrician participation in EHR
incentive programs. Pediatrics. 2015;135(1):e1-4. doi: 10.1542/peds.2014-2438 [doi].
145. Adirim T, Meade K, Mistry K, Council on Quality Improvement and Patient Safety,
Committee on Practice Management. A new era in quality measurement: The development and
application of quality measures. Pediatrics. 2017;139(1):10.1542/peds.2016-3442.
146. Lehmann CU, Mansour J, Klein JD. What does ‘meaningful use’ mean for pediatrics?
Pediatric Health. 2010;4(4):361-363.
147. Kann L, Telljohann SK, Wooley SF. Health education: Results from the school health policies
and programs study 2006. J Sch Health. 2007;77(8):408-434.
148. Holzheimer L, Mobay H, Masters IB. Educating young children about asthma: Comparing
the effectiveness of a developmentally appropriate asthma education video tape with picture
book. Child Care Health and Development. 1998;24:85-99.
149. Hawkins RJ, Zanetti DL, Main PA, et al. Oral hygiene knowledge of high‐risk grade one
children: An evaluation of two methods of dental health education. Community Dent Oral
Epidemiol. 2000;28(5):336-343.
121
150. Stock S, Miranda C, Evans S, et al. Healthy buddies: A novel, peer-led health promotion
program for the prevention of obesity and eating disorders in children in elementary school.
Pediatrics. 2007;120(4):e1059-68.
151. Barry TL, Davis DJ, Meara JG, Halvorson M. Case management: An evaluation at Children's
Hospital Los Angeles. Nursing Economics. 2002;20(1):22.
152. Friedberg MW, Safran DG, Coltin KL, Dresser M, Schneider EC. Readiness for the patient-
centered medical home: Structural capabilities of Massachusetts primary care practices. Journal
of General Internal Medicine. 2009;24(2):162-169.
153. Landon BE, Gill JM, Antonelli RC, Rich EC. Prospects for rebuilding primary care using the
patient-centered medical home. Health Aff (Millwood). 2010;29(5):827-834.
154. Kaye N, Buxbaum J, Takach M. Building medical homes: Lessons from eight states with
emerging programs. National Academy for State Health Policy. 2011.
155. Bethell CD, Read D, Brockwood K, American Academy of Pediatrics. Using existing
population-based data sets to measure the American Academy of Pediatrics definition of
medical home for all children and children with special health care needs. Pediatrics. 2004;113(5
Suppl):1529-1537.
156. Larson SA, Chapman SA. Patient-centered medical home model: Do school-based health
centers fit the model? Policy, Politics, & Nursing Practice. 2013;14(3-4):163-174.
157. Billy JO, Grady WR, Wenzlow AT, Brener ND, Collins JL, Kann L. Contextual influences on
school provision of health services. Journal of Adolescent Health. 2000;27(1):12-24.
122
158. Wade TJ, Mansour ME, Guo JJ, Huentelman T, Line K, Keller KN. Access and utilization
patterns of school-based health centers at urban and rural elementary and middle schools.
Public Health Rep. 2008:739-750.
159. Li C. Little’s test of missing completely at random. Stata Journal. 2013;13(4):795-809.
160. U.S. Department of Agriculture. National school lunch program.
https://www.fns.usda.gov/sites/default/files/NSLPFactSheet.pdf. Updated 2013. Accessed
December 18, 2016.
161. The Henry J. Kaiser Family Foundation. Where are states today? Medicaid and CHIP
eligibility levels for children, pregnant women, and Adults. http://kff.org/medicaid/fact-
sheet/where-are-states-today-medicaid-and-chip/. Updated 2017. Accessed February 3, 2017.
162. WWAMI Rural Health Research Center. ZIP code RUCA approximation.
http://depts.washington.edu/uwruca/ruca-approx.php. Updated 2005. Accessed December 21,
2016.
163. Takach M. About half of the states are implementing patient-centered medical homes for
their Medicaid populations. Health Aff (Millwood). 2012;31(11):2432-2440. doi:
10.1377/hlthaff.2012.0447 [doi].
164. Primo DM, Jacobsmeier ML, Milyo J. Estimating the impact of state policies and institutions
with mixed-level data. State Politics & Policy Quarterly. 2007;7(4):446-459.
123
165. Schunck R. Cluster size and aggregated level 2 variables in multilevel models. A cautionary
note. Methods, Data, Analyses: A Journal for Quantitative Methods and Survey Methodology
(mda). 2016;10(1):97-108.
166. Clarke P. When can group level clustering be ignored? Multilevel models versus single-level
models with sparse data. J Epidemiol Community Health. 2008;62(8):752-758.
167. Halladay JR, Mottus K, Reiter K, et al. The cost to successfully apply for level 3 medical
home recognition. J Am Board Fam Med. 2016;29(1):69-77.
168. Magill MK, Ehrenberger D, Scammon DL, et al. The cost of sustaining a patient-centered
medical home: Experience from 2 states. Ann Fam Med. 2015;13(5):429-435.
169. Nocon RS, Sharma R, Birnberg JM, Ngo-Metzger Q, Lee SM, Chin MH. Association between
patient-centered medical home rating and operating cost at federally funded health centers.
JAMA. 2012;308(1):60-66.
170. Blumenthal D, Tavenner M. The “meaningful use” regulation for electronic health records.
N Engl J Med. 2010;2010(363):501-504.
171. Crosson JC, Etz RS, Wu S, Straus SG, Eisenman D, Bell DS. Meaningful use of electronic
prescribing in 5 exemplar primary care practices. Ann Fam Med. 2011;9(5):392-397.
172. Halladay JR, Stearns SC, Wroth T, et al. Cost to primary care practices of responding to
payer requests for quality and performance data. Ann Fam Med. 2009;7(6):495-503.
124
173. Tschudy MM, Raphael JL, Nehal US, O'Connor KG, Kowalkowski M, Stille CJ. Barriers to care
coordination and medical home implementation. Pediatrics. 2016;138(3):10.1542/peds.2015-
3458. Epub 2016 Aug 9.
174. Friedberg MW, Coltin KL, Safran DG, Dresser M, Schneider EC. Medical home capabilities of
primary care practices that serve sociodemographically vulnerable neighborhoods. Arch Intern
Med. 2010;170(11):938-944.
175. Jha AK, Bates DW, Jenter C, et al. Electronic health records: Use, barriers and satisfaction
among physicians who care for black and Hispanic patients. J Eval Clin Pract. 2009;15(1):158-
163.
176. Hing E, Burt CW. Are there patient disparities when electronic health records are adopted?
J Health Care Poor Underserved. 2009;20(2):473-488.
177. Lewis VA, Fraze T, Fisher ES, Shortell SM, Colla CH. ACOs serving high proportions of racial
and ethnic minorities lag in quality performance. Health Aff (Millwood). 2017;36(1):57-66.
178. Agency for Healthcare Research and Quality. Medicaid managed care plan offers patient-
specific, pay-for-performance program, leading to improvements in immunization rates and
diabetes care. https://innovations.ahrq.gov/node/4985. Updated 2014. Accessed March 30,
2017.
179. Gerstle RS, Lehmann CU, American Academy of Pediatrics Council on Clinical Information
Technology. Electronic prescribing systems in pediatrics: The rationale and functionality
requirements. Pediatrics. 2007;119(6):e1413-22.
125
180. Nutting PA, Crabtree BF, McDaniel RR. Small primary care practices face four hurdles--
including a physician-centric mind-set--in becoming medical homes. Health Aff (Millwood).
2012;31(11):2417-2422.
181. Schonwald A, Huntington N, Chan E, Risko W, Bridgemohan C. Routine developmental
screening implemented in urban primary care settings: More evidence of feasibility and
effectiveness. Pediatrics. 2009;123(2):660-668.
182. Garg A, Butz AM, Dworkin PH, Lewis RA, Thompson RE, Serwint JR. Improving the
management of family psychosocial problems at low-income children's well-child care visits: The
WE CARE project. Pediatrics. 2007;120(3):547-558.
183. Earls MF, Hay SS. Setting the stage for success: Implementation of developmental and
behavioral screening and surveillance in primary care practice--the North Carolina assuring
better child health and development (ABCD) project. Pediatrics. 2006;118(1):e183-8.
184. Wise CG, Alexander JA, Green LA, Cohen GR, Koster CR. Journey toward a patient‐centered
medical home: Readiness for change in primary care practices. Milbank Q. 2011;89(3):399-424.
185. Centers for Medicare and Medicaid Services. Innovation models.
https://innovation.cms.gov/initiatives/index.html#views=models&key=primary care. Accessed
December 18, 2016.
186. Williams JW, Jackson GL, Powers BJ, et al. The patient-centered medical home. Closing the
quality gap: Revisiting the state of the science. Evidence report no. 208. (prepared by the Duke
evidence-based practice center under contract no. 290-2007-10066-I.). July 2012. AHRQ
Publication No. 12-E008-EF.
126
187. Berenson R, Delbanco S, Murray R, Upadhyay D. Payment methods and benefit designs:
How they work and how they work together to improve health care. The patient-centered
medical home—advanced primary care. 2016.
188. Goldberg DG, Mick SS, Kuzel AJ, Feng LB, Love LE. Why do some primary care practices
engage in practice improvement efforts whereas others do not? Health Serv Res.
2013;48(2pt1):398-416.
189. Quinn MT, Gunter KE, Nocon RS, et al. Undergoing transformation to the patient centered
medical home in safety net health centers: Perspectives from the front lines. Ethn Dis.
2013;23(3):356-362.
190. Key JD, Washington EC, Hulsey TC. Reduced emergency department utilization associated
with school-based clinic enrollment. Journal of Adolescent Health. 2002;30(4):273-278.
191. Young TL, D'angelo SL, Davis J. Impact of a School‐Based health center on emergency
department use by elementary school students. J Sch Health. 2001;71(5):196-198.
192. Gale JA, Croll Z, Hartley D. Rural health clinic readiness for patient-centered medical home
recognition: Preparing for the evolving healthcare marketplace. 2015.
193. McNeish DM. Modeling sparsely clustered data: Design-based, model-based, and single-
level methods. Psychol Methods. 2014;19(4):552.
194. Heider F, Wirth B, Kuznetsov A. Medicaid managed care: Challenges and opportunities for
pediatric medical home implementation and children and youth with special health care needs.
2016.
127
195. Centers for Medicare & Medicaid Services. Managed care.
https://www.medicaid.gov/medicaid/managed-care/index.html. February 2017.
196. American Academy of Family Physicians. State Medicaid programs drive PCMH initiatives
forward. http://www.aafp.org/news/government-medicine/20130404statemedicaid.html.
Updated 2013. Accessed March 3, 2017.
197. AAP Committee on Adolescence. Achieving quality health services for adolescents.
Pediatrics. 2016;138(2):e20161347.
198. Peikes DN, Reid RJ, Day TJ, et al. Staffing patterns of primary care practices in the
comprehensive primary care initiative. Ann Fam Med. 2014;12(2):142-149. doi:
10.1370/afm.1626 [doi].
199. Hearld LR, Weech-Maldonado R, Asagbra OE. Variations in patient-centered medical home
capacity: A linear growth curve analysis. Medical Care Research and Review. 2013;70(6):597-
620.
200. Frambach RT, Schillewaert N. Organizational innovation adoption: A multi-level framework
of determinants and opportunities for future research. Journal of Business research.
2002;55(2):163-176.
201. School-Based Health Alliance. Quality counts. http://www.sbh4all.org/resources/quality-
counts/. Accessed January 15, 2017.
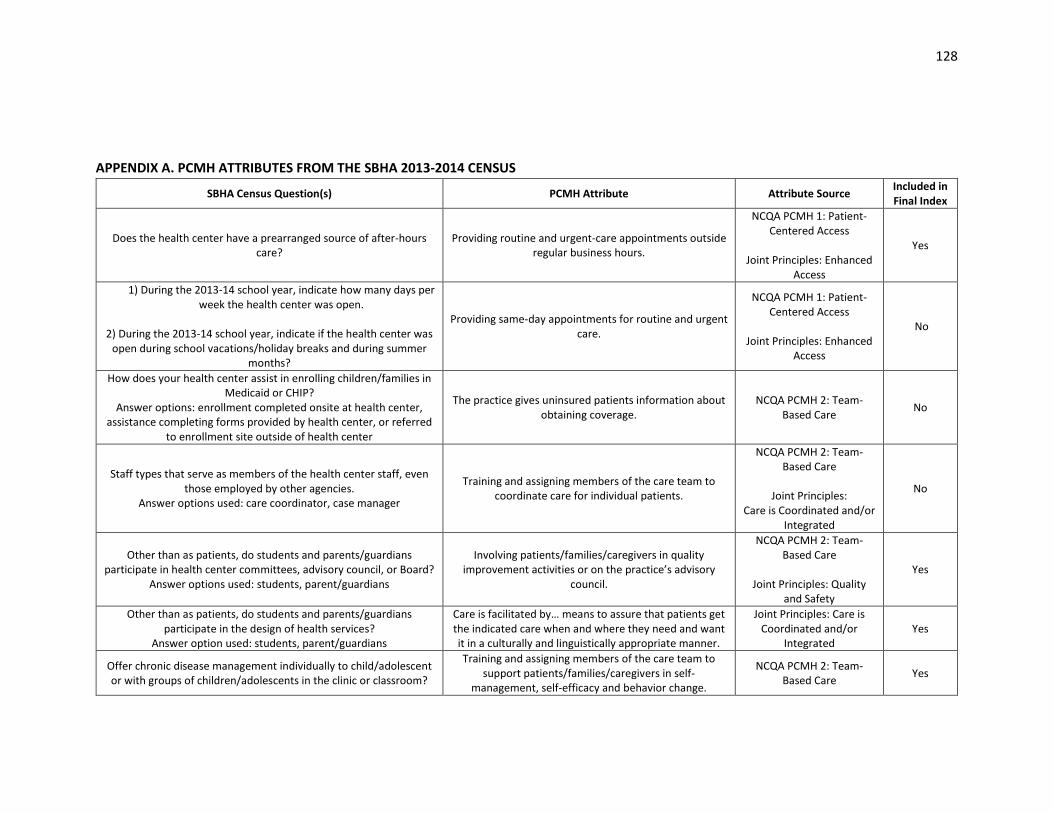
128
APPENDIX A. PCMH ATTRIBUTES FROM THE SBHA 2013-2014 CENSUS
SBHA Census Question(s) PCMH Attribute Attribute Source Included in Final Index
Does the health center have a prearranged source of after-hours care?
Providing routine and urgent-care appointments outside regular business hours.
NCQA PCMH 1: Patient-Centered Access
Joint Principles: Enhanced
Access
Yes
1) During the 2013-14 school year, indicate how many days per week the health center was open.
2) During the 2013-14 school year, indicate if the health center was
open during school vacations/holiday breaks and during summer months?
Providing same-day appointments for routine and urgent care.
NCQA PCMH 1: Patient-Centered Access
Joint Principles: Enhanced
Access
No
How does your health center assist in enrolling children/families in Medicaid or CHIP?
Answer options: enrollment completed onsite at health center, assistance completing forms provided by health center, or referred
to enrollment site outside of health center
The practice gives uninsured patients information about obtaining coverage.
NCQA PCMH 2: Team-Based Care
No
Staff types that serve as members of the health center staff, even those employed by other agencies.
Answer options used: care coordinator, case manager
Training and assigning members of the care team to coordinate care for individual patients.
NCQA PCMH 2: Team-Based Care
Joint Principles:
Care is Coordinated and/or Integrated
No
Other than as patients, do students and parents/guardians participate in health center committees, advisory council, or Board?
Answer options used: students, parent/guardians
Involving patients/families/caregivers in quality improvement activities or on the practice’s advisory
council.
NCQA PCMH 2: Team-Based Care
Joint Principles: Quality
and Safety
Yes
Other than as patients, do students and parents/guardians participate in the design of health services?
Answer option used: students, parent/guardians
Care is facilitated by… means to assure that patients get the indicated care when and where they need and want it in a culturally and linguistically appropriate manner.
Joint Principles: Care is Coordinated and/or
Integrated Yes
Offer chronic disease management individually to child/adolescent or with groups of children/adolescents in the clinic or classroom?
Training and assigning members of the care team to support patients/families/caregivers in self-
management, self-efficacy and behavior change.
NCQA PCMH 2: Team-Based Care
Yes
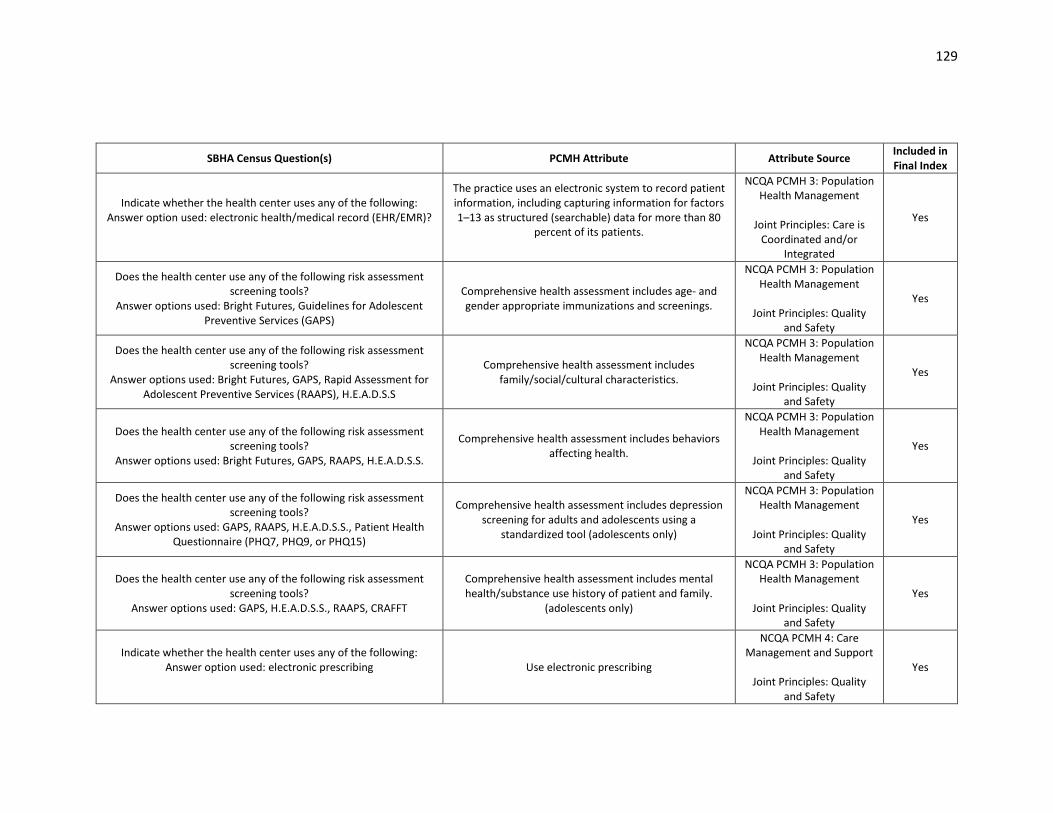
129
SBHA Census Question(s) PCMH Attribute Attribute Source Included in Final Index
Indicate whether the health center uses any of the following: Answer option used: electronic health/medical record (EHR/EMR)?
The practice uses an electronic system to record patient information, including capturing information for factors 1–13 as structured (searchable) data for more than 80
percent of its patients.
NCQA PCMH 3: Population Health Management
Joint Principles: Care is
Coordinated and/or Integrated
Yes
Does the health center use any of the following risk assessment screening tools?
Answer options used: Bright Futures, Guidelines for Adolescent Preventive Services (GAPS)
Comprehensive health assessment includes age- and gender appropriate immunizations and screenings.
NCQA PCMH 3: Population Health Management
Joint Principles: Quality
and Safety
Yes
Does the health center use any of the following risk assessment screening tools?
Answer options used: Bright Futures, GAPS, Rapid Assessment for Adolescent Preventive Services (RAAPS), H.E.A.D.S.S
Comprehensive health assessment includes family/social/cultural characteristics.
NCQA PCMH 3: Population Health Management
Joint Principles: Quality
and Safety
Yes
Does the health center use any of the following risk assessment screening tools?
Answer options used: Bright Futures, GAPS, RAAPS, H.E.A.D.S.S.
Comprehensive health assessment includes behaviors affecting health.
NCQA PCMH 3: Population Health Management
Joint Principles: Quality
and Safety
Yes
Does the health center use any of the following risk assessment screening tools?
Answer options used: GAPS, RAAPS, H.E.A.D.S.S., Patient Health Questionnaire (PHQ7, PHQ9, or PHQ15)
Comprehensive health assessment includes depression screening for adults and adolescents using a
standardized tool (adolescents only)
NCQA PCMH 3: Population Health Management
Joint Principles: Quality
and Safety
Yes
Does the health center use any of the following risk assessment screening tools?
Answer options used: GAPS, H.E.A.D.S.S., RAAPS, CRAFFT
Comprehensive health assessment includes mental health/substance use history of patient and family.
(adolescents only)
NCQA PCMH 3: Population Health Management
Joint Principles: Quality
and Safety
Yes
Indicate whether the health center uses any of the following: Answer option used: electronic prescribing
Use electronic prescribing
NCQA PCMH 4: Care Management and Support
Joint Principles: Quality
and Safety
Yes
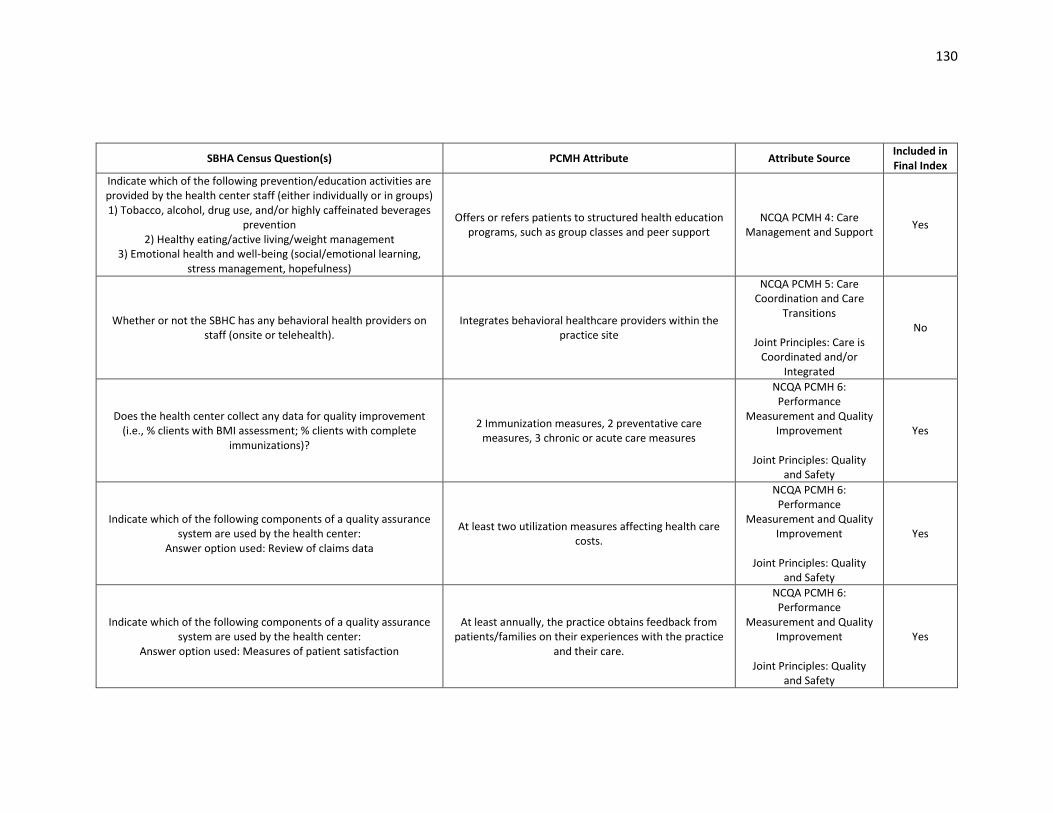
130
SBHA Census Question(s) PCMH Attribute Attribute Source Included in Final Index
Indicate which of the following prevention/education activities are provided by the health center staff (either individually or in groups) 1) Tobacco, alcohol, drug use, and/or highly caffeinated beverages
prevention 2) Healthy eating/active living/weight management
3) Emotional health and well-being (social/emotional learning, stress management, hopefulness)
Offers or refers patients to structured health education programs, such as group classes and peer support
NCQA PCMH 4: Care Management and Support
Yes
Whether or not the SBHC has any behavioral health providers on staff (onsite or telehealth).
Integrates behavioral healthcare providers within the practice site
NCQA PCMH 5: Care Coordination and Care
Transitions
Joint Principles: Care is Coordinated and/or
Integrated
No
Does the health center collect any data for quality improvement (i.e., % clients with BMI assessment; % clients with complete
immunizations)?
2 Immunization measures, 2 preventative care measures, 3 chronic or acute care measures
NCQA PCMH 6: Performance
Measurement and Quality Improvement
Joint Principles: Quality
and Safety
Yes
Indicate which of the following components of a quality assurance system are used by the health center:
Answer option used: Review of claims data
At least two utilization measures affecting health care costs.
NCQA PCMH 6: Performance
Measurement and Quality Improvement
Joint Principles: Quality
and Safety
Yes
Indicate which of the following components of a quality assurance system are used by the health center:
Answer option used: Measures of patient satisfaction
At least annually, the practice obtains feedback from patients/families on their experiences with the practice
and their care.
NCQA PCMH 6: Performance
Measurement and Quality Improvement
Joint Principles: Quality
and Safety
Yes
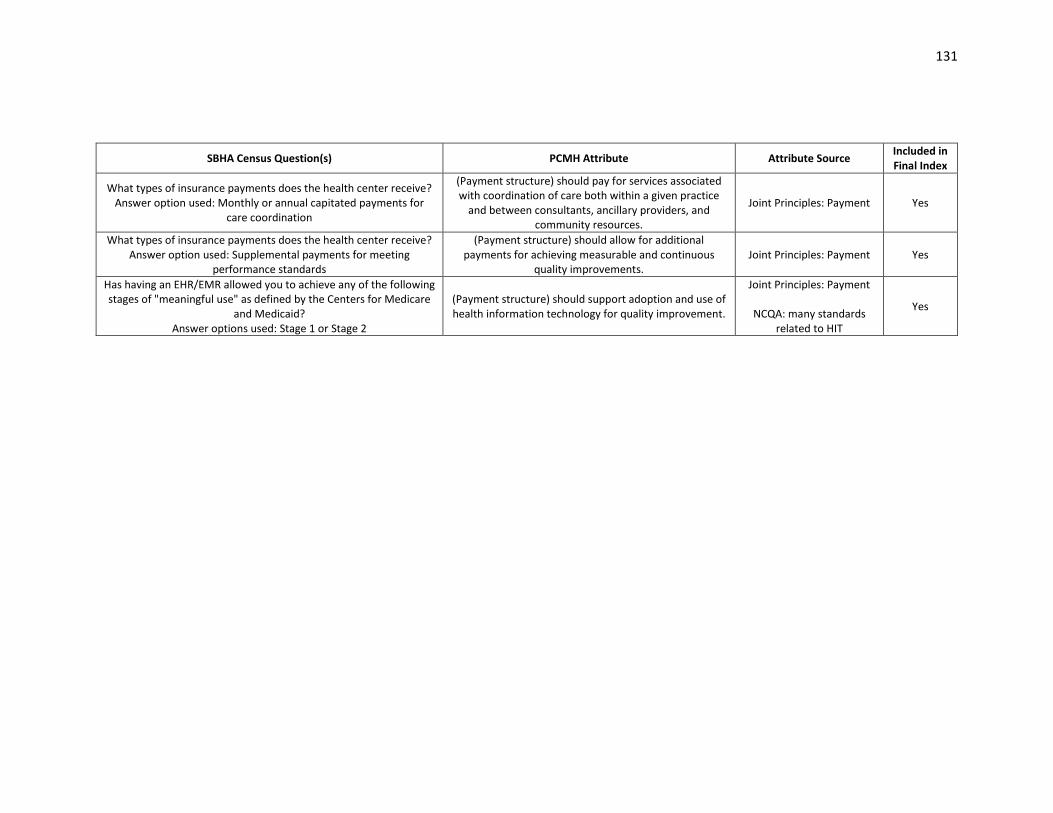
131
SBHA Census Question(s) PCMH Attribute Attribute Source Included in Final Index
What types of insurance payments does the health center receive? Answer option used: Monthly or annual capitated payments for
care coordination
(Payment structure) should pay for services associated with coordination of care both within a given practice
and between consultants, ancillary providers, and community resources.
Joint Principles: Payment Yes
What types of insurance payments does the health center receive? Answer option used: Supplemental payments for meeting
performance standards
(Payment structure) should allow for additional payments for achieving measurable and continuous
quality improvements. Joint Principles: Payment Yes
Has having an EHR/EMR allowed you to achieve any of the following stages of "meaningful use" as defined by the Centers for Medicare
and Medicaid? Answer options used: Stage 1 or Stage 2
(Payment structure) should support adoption and use of health information technology for quality improvement.
Joint Principles: Payment
NCQA: many standards related to HIT
Yes

![Patient-Centered Care Requires Patient-Centered Insight ... · Patient-Centered Care Requires Patient-Centered Insight: What We Can Do To Complete the Picture [00:01] [Carolyn Wong](https://img.pdfslide.net/doc/110x75/60d2327a2a6d8a22813efc12/patient-centered-care-requires-patient-centered-insight-patient-centered-care.jpg)